3System Solid State System (3S) 2014 First Quarter Investor Conference May 15, 2014 鑫創科技:...
10
3S 3S ystem ystem Solid State System (3S) 2014 First Quarter Investor Conference May 15, 2014 鑫鑫鑫鑫: 3259
-
Upload
merry-morris -
Category
Documents
-
view
214 -
download
1
Transcript of 3System Solid State System (3S) 2014 First Quarter Investor Conference May 15, 2014 鑫創科技:...

3S3Systemystem
Solid State System (3S)
2014 First Quarter Investor Conference
May 15, 2014
鑫創科技: 3259

2
Agenda
Welcome
1QFY14 Financial Results
2QFY14 Outlook
Q&A

3
Safe Harbor Statement
Except for historical information contained herein, the matters set forth in
this presentation are forward looking statements that are subject to risks
and uncertainties that could cause actual results to differ materially,
including the impact of competitive products and pricing, timely design
acceptance by our customers, timely introduction of new technologies,
ability to ramp new products into volume, industry wide shifts in supply
and demand for semiconductor products, industry overcapacity, availability
of manufacturing capacity, financial stability in end markets, and other
risks.

4
1QFY14 Consolidated Income StatementNT$K
1Q14 4Q13 1Q13 QoQ(%) YoY(%)
Sales 170,193 191,835 117,086 (11) 45
Gross Profit 49,970 76,469 24,639 (35) 103
Selling Expenses 15,897 12,959 14,763 23 8
G&A Expenses 7,350 7,514 7,880 (2) (7)
R&D Expenses 48,196 48,282 48,687 0 (1)
Operating Income (21,473) 7,714 (46,691) (378) -
Non-operating Income& Exp. 2,740 2,676 (2,148)
Income Before Tax (18,733) 10,390 (48,839)
Net Income (18,733) 14,831 (48,839)
EPS(NT$) (0.27) 0.26 (0.78)
Weighted Avg. Outstanding Shares 70,400 63,502 62,549
5
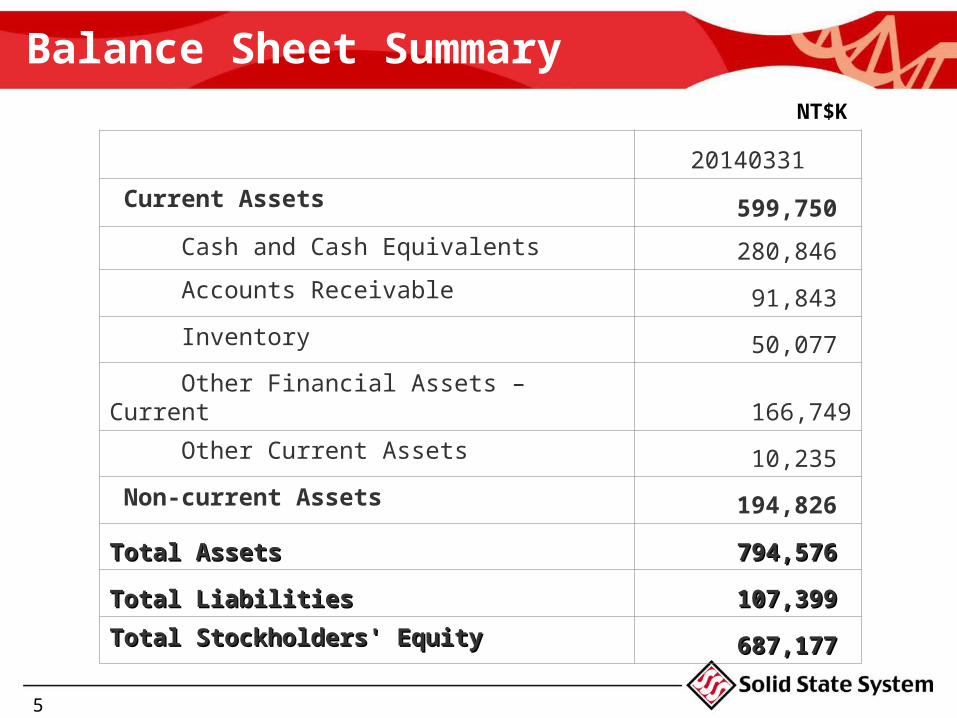
Balance Sheet SummaryNT$K
20140331
Current Assets 599,750
Cash and Cash Equivalents 280,846
Accounts Receivable 91,843
Inventory 50,077
Other Financial Assets – Current 166,749
Other Current Assets 10,235
Non-current Assets 194,826
Total AssetsTotal Assets 794,576 794,576
Total LiabilitiesTotal Liabilities 107,399 107,399
Total Stockholders' EquityTotal Stockholders' Equity 687,177 687,177

6
Cash Flow Summary
NT$K
1Q14
Operating Cash Flow 9,272
Investment Cash Flow (23,689)
Financing Cash Flow 4,231
Net increase in Cash & Equivalents (10,186)
Cash & Equivalents at Year Beginning 291,032
Cash & Equivalents at Year End 280,846
7
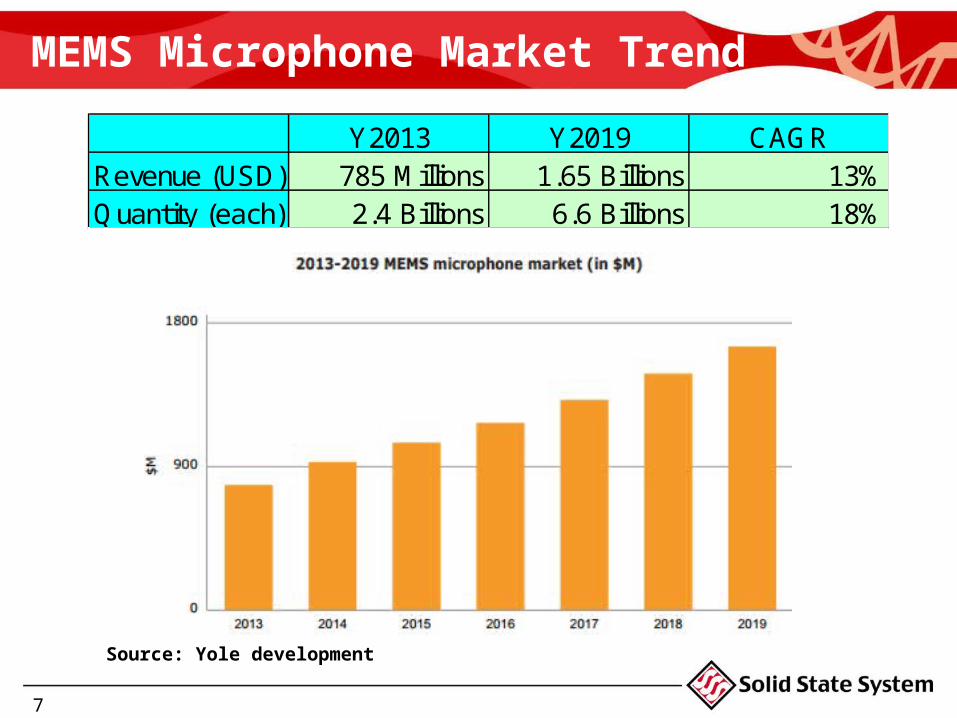
MEMS Microphone Market Trend
Y2013 Y2019 CAGRRevenue (USD) 785 Millions 1.65 Billions 13%Quantity (each) 2.4 Billions 6.6 Billions 18%
Source: Yole development

8
MEMS Microphone Market Trend
Source: Yole development
Applications:
Cellphone/Smartphone
Laptop/Notebook
Earphone Headset
Wearable/IoT
Smart TV
Medical (Hearing Aid)
Automotive
Consumer Electronics
9
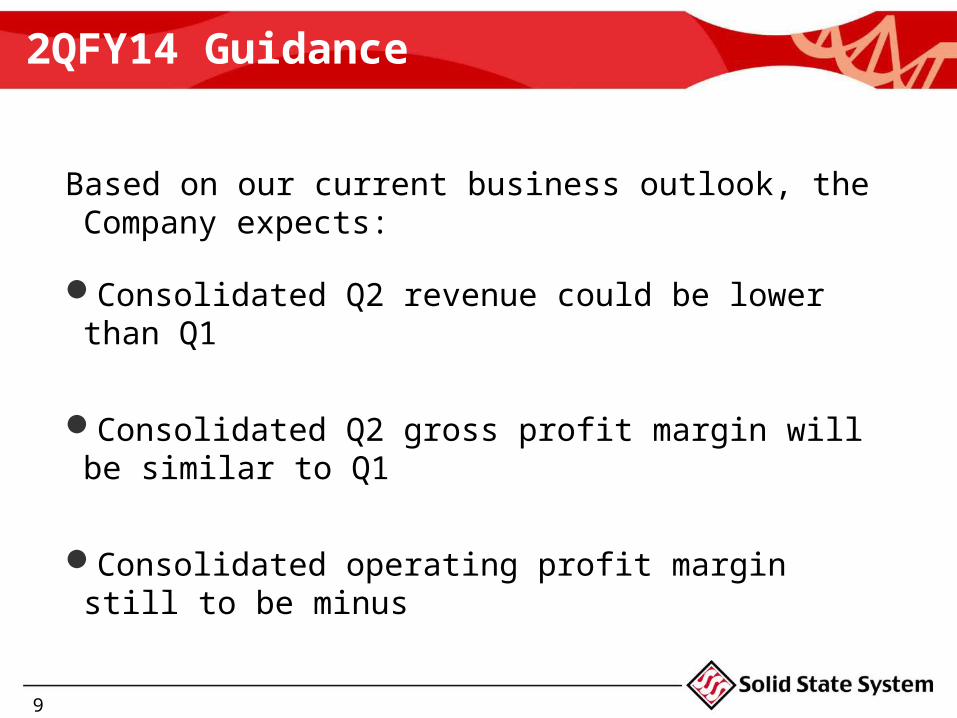
2QFY14 Guidance
Based on our current business outlook, the Company expects:
Consolidated Q2 revenue could be lower than Q1
Consolidated Q2 gross profit margin will be similar to Q1
Consolidated operating profit margin still to be minus
10
選擇鑫創 選擇創新
投資人專線: 03-552-6533
www.3system.com.tw
鑫創科技: 3259