3rd Year Spectroscopy
36
1 1 3 rd year Spectroscopy Dr. Alan Ryder (R222, Physical Chemistry) 4 lectures: – Rotational & Vibrational spectroscopies 1 exam question. Notes on: – www.nuigalway.ie/nanoscale/3rdspectroscopy.html Spectroscopy links on: – http://www.nuigalway.ie/nanoscale/links.html 2 3 rd year spectroscopy: 1 st Topic General Features of Spectroscopy: – Introduction & review of 2 nd year. – Transitions & probabilities. – Populations of energy levels & c onsequences. – Linewidths. – Bohr Condition. Be able to show an understanding of the theories behind spectroscopy. Be able to calculate populations of energy levels and spectral line widths. – Section 8.1-2, Physical Chemistry, Atkins 8 th ed., p.243. 3 Introduction-General Principles Spectra - transitio ns between energy states: – Molecule, E f - E i = h ν (photon energy). Transition probability: – selection rules. Populations (Boltzmann distribution). Molecules have bonds they can vibrate… Wavenumber: 5000 nm = 5 x10 -4 cm = 2000 cm -1 ENERGY PHOTON BEFORE DURING AFTER ε ν λ ν = = = h h c hc / ∆E (molecule) = E (photon) 4 Absorption spectroscopy Can refer to the absorptio n of any frequency of r adiation, most common are: – UV-visible absorption ( electronic). – IR absorption (vibrational ). – Microwave absorption ( rotational). – NMR/ESR (nuclear & electron spin). These are many types of molecular spectroscopy. Energy of the radiation ≅ energy of transition. Based on quantum principles.
Transcript of 3rd Year Spectroscopy
8/14/2019 3rd Year Spectroscopy
http://slidepdf.com/reader/full/3rd-year-spectroscopy 1/36
1
1
3 rd year Spectroscopy
Dr. Alan Ryder (R222, Physical Chemistry) 4 lectures:
– Rotational & Vibrational spectroscopies
1 exam question.
Notes on:
– www.nuigalway.ie/nanoscale/3rdspectroscopy.html
Spectroscopy links on:
– http://www.nuigalway.ie/nanoscale/links.html
2
3 rd year spectroscopy: 1st Topic
General Features of Spectroscopy:
– Introduction & review of 2nd year.
– Transitions & probabilities.
– Populations of energy levels & consequences.
– Linewidths.
– Bohr Condition.
Be able to show an understanding of the theories behind
spectroscopy. Be able to calculate populations of energy levels and
spectral line widths.– Section 8.1-2, Physical Chemistry, Atkins 8th ed., p.243.
3
Introduction-General Principles
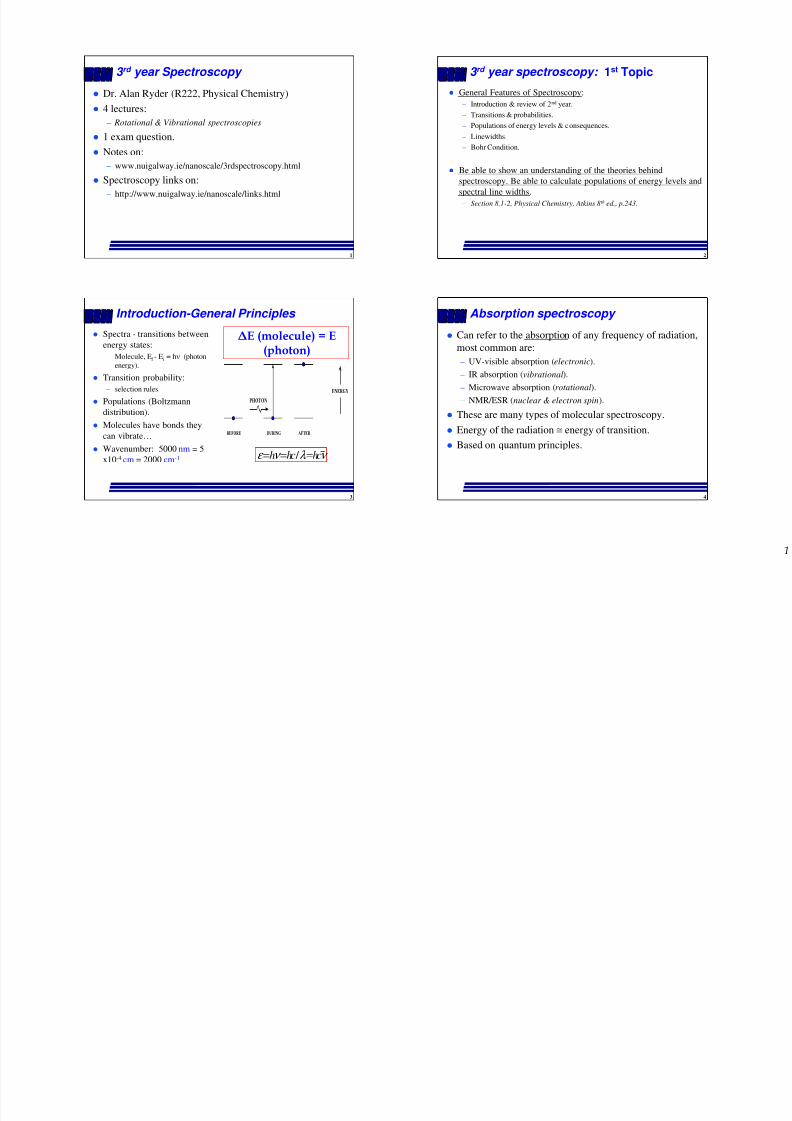
Spectra - transitions between
energy states:
– Molecule, Ef - Ei = h ν (photon
energy).
Transition probability:
– selection rules. Populations (Boltzmann
distribution).
Molecules have bonds they
can vibrate…
Wavenumber: 5000 nm = 5
x10-4 cm = 2000 cm-1
ENERGY
PHOTON
BEFORE DURING AFTER
ε ν λ ν = = =h hc hc /
∆E (molecule) = E(photon)
4
Absorption spectroscopy
Can refer to the absorption of any frequency of radiation,
most common are:
– UV-visible absorption (electronic).
– IR absorption (vibrational).
– Microwave absorption (rotational).– NMR/ESR (nuclear & electron spin).
These are many types of molecular spectroscopy.
Energy of the radiation ≅ energy of transition.
Based on quantum principles.
8/14/2019 3rd Year Spectroscopy
http://slidepdf.com/reader/full/3rd-year-spectroscopy 2/36
2
5
Emission & Scattering spectroscopy
EMISSION: Emission of any
frequency of radiation.
Concerned with the properties
of the emitted photons from a
sample.
In the UV-VIS-NIR
(electronic transitions ):
– Fluorescence, Phosphorescence,
Chemiluminescence,
photoluminescence,
In the Microwave:
– Rotational transitions,
astrophysics.
Based on quantum principles.
SCATTERING: Look at how
light scatters from
molecules/materials:
– Not absorbed, photons don’t
have to pass thru
– Can use everything from
neutrons to x-rays etc.
Most Important is Raman
spectroscopy:
– Molecular technique.
– Great for forensics etc.
6
Intensities of spectral lines
Three Essential concepts govern intensity: Transition probability: the likelihood of a system (e.g.
molecule) changing from one state to another.
Population of Energy levels: the number of molecules (or
atoms in the initial state).
Concentration (& path length): The amount of material
present giving rise to the spectrum.
– This done last year: Beer-Lambert
7
Transition probability (I):
Based on quantum mechanical principles…..is a transition
allowed or forbidden?
To simplify matters we use selection rules.
Each type of spectroscopy has it’s own selection rules.
Underlying classical idea:– for a molecule to be able to interact with the EM field and
absorb or create a photon of frequency ν,
– it must possess, at least transiently, a dipole oscillating at that
frequency.
8
Transition probability (II):
*
z,f i i
i
ˆ= d .
wave function of the initial energy state.
= wave function of the final energy state.
ˆ is the electric dipole moment operator.
Rate of change of
f z
f
z
µ µ τ
µ
Ψ Ψ
Ψ =
Ψ
=
∫ Transition dipole moment :
f f i
2 2
i f i z,f i
population of the state (w ) due to transitions from
state is: w | | where E = amplitude of EM field, intensity.
The size of the transition dipole can be regarded as a measure o
µ
←
←
Ψ
Ψ ∝ Ε ∝
f the
charge redistribution that accompanies a transition.
A transition will be active (and generate or absorb photons)
only if the accompanying charge redistribution is dipolar.

8/14/2019 3rd Year Spectroscopy
http://slidepdf.com/reader/full/3rd-year-spectroscopy 3/36
3
9
Transition probability (III):
1s electron → a 2s electron:– Spherical migration of charge.
– No dipole moment assoc. with this
charge migration.
– Transition is electric-dipole forbidden.
1s electron → a 2 p electron:
– Dipole associated with the charge
migration.
– This transition is allowed.
10
Gross Selection Rules
Specifies the general features a molecule must have if it isto have a spectrum of a given kind:
– e.g. a molecule gives a rotational spectrum only if it has a
permanent electric dipole moment.
– e.g. a vibration is Raman active only if there is a change in
polarizability.
A detailed study of the transition moment leads to the
specific selection rules that express the allowed
transitions in terms of the changes in quantum numbers.
11
Populations of energy levels (I)
The strength of an absorption depends on the number of molecules
in a particular energy level.
Governed by the Boltzmann Distribution:
i
i i
i
- /kT
N = no. molecules in an energy level, , with energy E .
N = total no. molecules i
Ne
Boltzmann dist
n system.
Taking into account degenerate energy l
ribution: N =
e
vels,
,
E
q = partition function
i
q
i- /kT
i i
i
we can write:
N g e at equilibrium,
where g number of degenerate levels.
E ∝ ×
=
12
Populations of energy levels (II)
In spectroscopy:
– interested in the relative populations of energy levels.
i
i
f
i
i i i
ii
f f f f
i i i i
i
- /kT
- /kT
- /kT
- /kT
N g e at equilibrium, where g number of degenerate levels.
N eg
N
N g N geexp( ( ) / )
N g N ge
N =
rearra
no.
nge to: f i
E
E
E
E
ratio , q = partition functionq
ratio , E E kT ,
∝ × =
⇒ = = ×
⇒ = = × = × − −
i
f f
f
i
molecules in an initial energy level, , with energy E .
N = no. molecules in a final energy level, , with energy E .
So assuming single states:N
exp( ( ) / )N
i
f
final state E kT ,
initial state
= − ∆

8/14/2019 3rd Year Spectroscopy
http://slidepdf.com/reader/full/3rd-year-spectroscopy 4/36
4
13
Typical energies & populations
Region Frequency(Hz) NA hυ nf / ni
RF 10 7 4 mJ/mol 0.999998
Microwave 1011 40 J/mol 0.984
IR 1013 4 kJ/mol 0.202
UV-VIS
10
15
400 kJ/mol
3x10
-70
X-RAY 1018 400 MJ/mol <10-99
14
Spectroscopic Consequences
For RF ( NMR) & Microwave ( Rotational):– Energies are very low (∆E’s small).
– Population differences are small ⇒
– Easy to saturate the energy levels.
When molecules are heated up:
– Higher E levels are populated ⇒
– More allowed transitions, more complex spectra.
– Tends to a continuum fairly easily.
For large ∆E’s, ground state is the most populated.
15
Fate of molecule?
Non-radiative transition: M* + M → M + M + heat
Spontaneous emission: M* → M + h ν (very fast for large ∆E)
Stimulated emission (opposite to stimulated absorption).
These factors contribute to linewidth & to lifetime of excited state.
16
Linewidths
A number of effects contribute to the widths of
spectroscopic lines.
Some contributions to linewidths can be modified by
changing the conditions:
– To achieve high resolutions we need to know how to minimizethese contributions.
Other contributions cannot be changed:
– Represent an inherent limitation on resolution.
8/14/2019 3rd Year Spectroscopy
http://slidepdf.com/reader/full/3rd-year-spectroscopy 5/36
5
17
Linewidths: Doppler Broadening
One important broadening process in gaseous samples isthe Doppler effect:
– Radiation is shifted in frequency when the source is moving
towards or away from the observer.
Very important for the study of gaseous samples:
– Atmospheric & interstellar chemistry.
– In some cases, meaningful spectroscopic data can be obtained
only from gaseous samples.
18
Linewidths: Doppler Broadening (I)
When a source emitting electromagnetic radiation of frequency ν
moves with a speed s relative to an observer, the observer detects
radiation of frequency:
1/ 2 1/ 21 / 1 /
1 / 1 /
c = speed of light, s = speed of source. For s << c, then:
, and ,1 / 1 /
receeding approaching
receeding approaching
s c s cwhere
s c s c
s c s c
ν ν ν ν
ν ν ν ν
− + = = + −
≈ ≈+ −
19
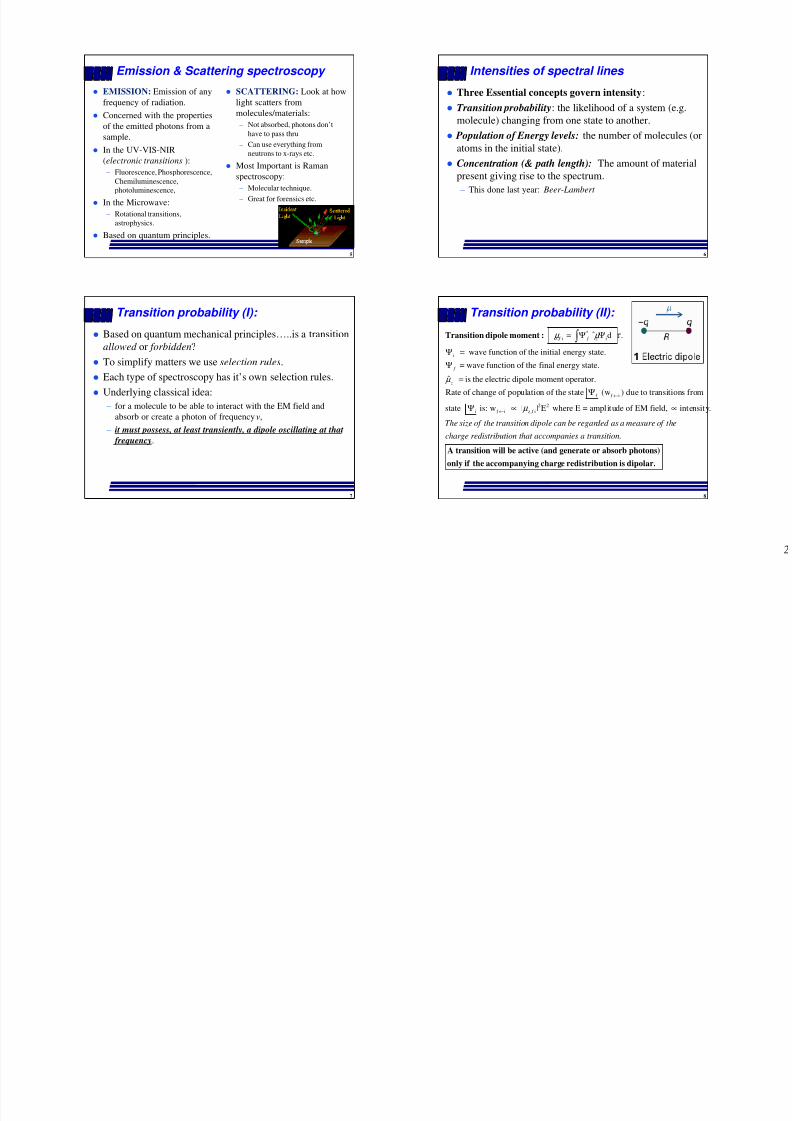
Linewidths: Doppler Broadening (II)
As temperature increases:
– Molecules speed up.
– Line broadens.
Very significant in astrophysics.
To solve this:
Make measurements @ very lowtemp.
– Liquid N2 (-196 ºC)
– Liquid He (-270 ºC)
20
Linewidths: Doppler Broadening (III)
Molecules reach high speeds in all directions in a gas:
– stationary observer detects the corresponding Doppler-shifted
range of frequencies.
– Some molecules approach the observer, some move away; some
move quickly, others slowly.
The detected spectral ‘line’ is the absorption or emission
profile arising from all the resulting Doppler shifts.

8/14/2019 3rd Year Spectroscopy
http://slidepdf.com/reader/full/3rd-year-spectroscopy 6/366
21
Linewidths: Doppler Broadening (IV)
i
2
i
K
- /kT
We know from the
The probability that a gas molecule of mass & speed in a sample
NeBoltzmann dis
with temp.
tribution: N
1has Kinetic E
=
nergy, E = ms
,
is propor2
E
q = partition functionq
m s T
-
tional to .2
We can relate this to the1
observed frequencies:1 /
,obs
ms
s
e
kT
cν ν
≈ ±
obs
obs
When s c, the Doppler shift in the frequency is - s/c
a symmetrical distribution of observed frequencies w.r.t. molecular speeds.
Intensity of a transition at :
probability of findin
ν ν ν
ν
≈ ±
⇒
∝
I
obs
2 2 2
obsobs
g molecule that emits/absorbs at ,
.....Gaussian Func( ) /
t2
ionmc kT
eν ν ν
ν
ν
− −∝⇒ IO PG
22
Linewidths: Doppler Broadening (V)
1/ 2 1/ 2
2 2 2
obsobs
( ) / 2 ...Gaussian Function.
Linewidth at half-height can be calculated and gives:
2 2 ln 2 2 2 ln 2or
Better to write.
2 2 ln 2
.....
ob
obs
s obs
mc kT e
v kT kT
c m c m
kT
v c m
ν ν ν ν
λ δν δλ
δν
− −∝
= =
=
IO PG
1/ 2 1/ 22 2 ln
or
Alwa
2
ys remember:
obskT
c m
δλ
λ
=
∝T
line width m
23
Linewidths: Doppler Broadening (VI)
For light masses & high temperatures:
– Broad lines ⇒ cool the system for higher resolution.
For a molecule like N2 at r.t. (T ≈ 300 K):
– δν / ν ≈ 2.3 × 10⁻⁶.
– For a typical rotational transition 1 cm−1
(ν = 30 GHz),– linewidth ~ 70 kHz.
– ∆λ = 2.3 µm (what was the wavelength?)
24
Doppler Broadening: example (I)
1
A fluorescent molecule emits red light at 660 . What is the Doppler-shifted
wavelength if it is approaching approached at 80
At what speed of approach would it appear green (52
nm
km hr
n0 )?
S
?
1
m
tep
−
1 1
1
18
: Equations: , c=speed of light, s=speed of source.1 /
Step 2: Rear
km h ms
msn
1We know: 1
80 22.222
22.2221 660 = 0.999
range:
999 92.998
m1 ms0
approachi
B
O
ng
O S
BS
s c
s
cν λ λ
λ
ν
λ
ν
− −
−
−
∝ ⇒ = −
=
⇒ = −
−
×
≈
25 660
659.9999505
nm
mnOBSλ
×
=

8/14/2019 3rd Year Spectroscopy
http://slidepdf.com/reader/full/3rd-year-spectroscopy 7/36
25
Doppler Broadening: example (II)
8 19
7
9
1
1
1- c
520 101- 2.998 10 = 6.366 10
660 10These kind
At what speed of approach woul
Step 3: Rearrange:
Step 4: Inp
d it ap nm
mms ms
ut
pear gr
values:
een (520
s
)
m
?
OBS
OBS
s
c
s
s
λ λ
λ
λ
−−
−−
= −
⇒ =
×= × ×
× of speed found in interstellar space......
Allows astronomers to calculate velocities of systems.
26
Linewidths: Lifetime Broadening (I)
Spectroscopic lines from gas-phase samples are not infinitely sharp
even when Doppler broadening has been largely eliminated by
working at low temps:
– Same is true of the spectra of samples in condensed phases and solution.
This residual broadening is due to quantum mechanical effects.
Specifically, when the Schrödinger equation is solved for a system
that is changing with time, it is found that it is impossible to specify
the energy levels exactly:
– Heisenberg again….
27
Linewidths: Lifetime Broadening (II)
If on average a system survives in a state for a time τ (tau), thelifetime of the state:
( )( )1
:
E= aka.
?cm
ps
....
5.3E = hc , = [
(in
Then its energy levels are blurred to an extent of order E, where
Can express in terms of wavenumber: [Rem. E=hc
)
]
Work it ou
δ
δ
τ
δ δν δν τ
ν
−⇒
uncertainty broadening
]
Long lifetime small uncertainty narrow linewidths
Short lifetime larger uncertainty wider linewidths
t
⇒ ⇒
⇒ ⇒
28
Lifetime Broadening (example)
( ) ( )
( )
1 1
1
Estimate the lifetime of a state that gives rise to a line of width of:
(a) 0.10 , (b) 1.0 ,cm cm MHz
cm ps
psStep1: Equations: rea
(c) 100 .
5.3 5.3, :
( )
5.3( ) : ( )
0.10
rrange to
psps
cma
δν τ τ δν
τ
− −
−
≈ ≈
≈
( )
( )6
10
9
1 1
1
1
11
1
-1
-1
5.353 ( ) : ( ) 5.3
1.0
( )( ) : : hc h
( )
5.31
psps ps ps
cm
s
cms
pss00 10 ( )0.0033 ( )
2.998 10cm ps
cms( ) 0.0033 cm
s1.6 10 1
Convert MHz to c
. n6 s
m
b
cc
τ
ν ν ν ν
ν τ
τ
− −
−
−
−−
−
−
= ≈ =
= ⇒ =
×= = ⇒ ≈ =
×
= × =

8/14/2019 3rd Year Spectroscopy
http://slidepdf.com/reader/full/3rd-year-spectroscopy 8/36 8
29
3rd year spectroscopy: 2 nd Topic
Pure Rotational Spectroscopy:
– Microwave spectroscopy.
– Moments of inertia and angular momentum.
– Rotational Energy levels & populations of E levels.
– Degeneracy & selection rules.
– Selection rules.
– Centrifugal distortion.
Understand and be able to explain rotationalspectroscopy, calculate energy levels and energies of
spectroscopic transitions.– Section 8.3-8.7, Physical Chemistry, Atkins 8th ed., p.254.
– Section 19.5-19.7, Elements of Physical Chemistry, 4th ed.
30
Background
Widely used in astronomy to study the molecular
composition of interstellar clouds.
– Rotational motions ⇒ low energies ⇒ long wavelengths
– Microwaves………long pathlengths
– NASA website: http://dsnra.jpl.nasa.gov/IMS/
Interstellar molecules:
H2O, CO, CS2, NH3, H2CO, CH3OH…..etc.
Biggest molecular spectrometers……
31
Sample spectrum (mixture)
Very Sharp absorption/emission lines in GHz range.
Each molecule has different bands.
32
Microwave spectrometer
Microwave 3 to 60 GHz:– X-band at 8 to 12 GHz; wavelength = 25-35 mm
Path-length 2 m; pressure 10-5 bar; Temp to 800 K;– vapour-phase.
Mica windows: transparent to MCWE
MCWESOURCE
DETECTOR
FREQUENCY
SWEEP
AMPLIFIER100 kHz
OSCILLATOR
DISPLAY
BRASS TUBING
VACUUM
MICA WINDOW

8/14/2019 3rd Year Spectroscopy
http://slidepdf.com/reader/full/3rd-year-spectroscopy 9/36 9
33
Microwave spectroscopy
Low pressure to avoid molecular collisions.
Compounds must be in the vapour-phase
– But it is easy to work at temperatures up to 800 K since cell is
made of brass with mica windows. Even solid NaCl has
sufficient vapour pressure to give a good spectrum.
Very high-resolution e.g. 12C16O absorption at
115,271.204 MHz
– Can be used to identify compounds
Rotation ⇒ Moments of inertia– Will give information about bond lengths and bond angles.
34
Moment of Inertia (I)
KEY PARAMETER.
Rotational inertia
Rotational analogue of mass forlinear motion
I must be specified with respectto a chosen axis of rotation
For a point mass:
– I = mr2.
35
Moments of inertia
Key molecular parameter: the
moment of inertia, I , of the
molecule.
Defined as the mass of each
atom multiplied by the square
of its distance from therotational axis through the
centre of mass of the molecule.
36
Asymmetric Rotors:
This is the most complex
case…very difficult to solve.
Three different moments of
inertia; IA≠ IB ≠ IC
all three rotation axes coincide
at the centre of mass of themolecule.
Examples;
– Water

8/14/2019 3rd Year Spectroscopy
http://slidepdf.com/reader/full/3rd-year-spectroscopy 10/36 10
37
Moments of Inertia (I)
Most important cases (3Y): linear diatomic & triatomic molecules.
38
Moments of Inertia (II): Spherical
4
2
6
2
Relatively Simple terms:
Tetrahedral (e.g. CH )
8I =
3
Octahedral (e.g. SF )I = 4
A
A
m R
m R
39
Rotors & other definitions
Rigid Rotor: a body that does not distort under the stressof rotation.
Linear rotor: a rigid rotor with one moment of inertiaequal to zero (e.g. CO2, HCl, OCS, and HC≡CH).
Spherical rotor: a rigid rotor with three equal moments
of inertia (e.g. CH4, SiH4, SF6).
Symmetric rotor: a rigid rotor with two equal moments of inertia (e.g. NH3, CH3Cl, and CH3CN).
Asymmetric rotor: a rigid rotor with three differentmoments of inertia (e.g. H2O, H2CO, and CH3OH).
40
Moments of Inertia (III): Symmetrical
Complex forms:
2 differentorientations.
.

8/14/2019 3rd Year Spectroscopy
http://slidepdf.com/reader/full/3rd-year-spectroscopy 11/36 11
41
What type of spectra?
Based on moments of
inertia, I = mr2:
IA = IB = IC
– no MCWE spectrum e.g.CH4
IA = 0, IB = IC
– linear molecules e.g. NaCl
IA ≠ IB = IC
– complicated e.g. NH3
IA≠ IB ≠ IC
– very complex e.g. H2O
42
Energy Levels for rotating systems
2
a
2 2 2
-1
a rad s1
= , = angular velocity ( ) about that axis,2
I = and
1 1 1
: energy of a body rotating about an ax
: = + + ,2 2 2
is a is:
In 3D
a a a
a a b b c c
E I
moment of inertia
E I I I
angular mom
ω ω
ω ω ω
Classical case
2 2 2
a a a
,This is the key equation.
about axis a is J = I ,
Use this and quantum mechanics to obtain rotational energy levels.
Start with 2D case:
2 2 2
a b c
a b c
entu
J J J E
I I I
m ω
= +
⇒
+
43
Rotation: system conditions (2D)
Body of mass m confined to a ring of radius R by V=0
XY plane only
k
2k
2
Total Energy = Kinetic energy (E )
E = ½
Rem: Momentum,
2
BUT....not linear motion...so:
k
mv
p mv
p E
m
=
⇒ =
44
Angular Momentum
Angular momentum J z = ± pr ( p = mv)
– Momentum × Radius
– ± term because you can have two different directions
– Clockwise, Anti-clockwise
Right Hand Rule:– Fingers point in direction of travel
– Thumb points in Jz direction

8/14/2019 3rd Year Spectroscopy
http://slidepdf.com/reader/full/3rd-year-spectroscopy 12/3612
45
Rotational Energy:
2 2
22
What values allowed?...NOT ALL.
de Broglie:
otherwise:
destructive interf
, mr = I ( ) so .......2 2
,
eran
and ,
(0)= (2 )
can only have
c
c
e.
z zk k
z z
J J E moment of inertia E
mr I
h hr J pr J
pλ
λ
ψ ψ π
λ
= ⇒ =
= = ± ⇒ = ±
ertain values:
2, 0,1,2,3l
l
r m
m
π λ ⇒ = =
46
Rotational Energy:
( )22
2 2
2
Angular Momentum:
[Quantisation]
Remember:
2, and
0, 1, 22
, , 0, 1, 22 2
2 2, 0, 1, 2..
Remem... ber:2
z
l
l z l l
l zk k l
l
r hr J
m
m h J m m
m J E E m
mr mr
l m I mr m
E k I
π λ
λ
π
= = ±
⇒ = = = ± ±
= ⇒ = = ± ±
= ± ± ==
∴∴∴∴
47
Energy Levels 3D
2, J 0,1,2,3.....
, ( 1), ( 2)........0
rotational Quantum number,
subsiduary quantum number.
NOTE: Energy
Can easily extend to 3D and
depends on
t:
.
ge
( 1)
2 J
J
J
m J J J
J
m
J J E
I =
= ± ± − ± −
=
=
+=
Moment of Inertia
48
Rotational Constants
Coefficients of quantum numbers in the rotational term
expression and inversely proportional to the principal
moments of inertia.
2
-1
2
2
is Planck's constant & the speed of light in vacuu
( )
hB = , units in wavenumber ( ).
8 cI
.
Always check the units to see which B expression used
[SI units preferre
J
cm
m
h
B = ,units in Joules8 I
π
π
h c
d].

8/14/2019 3rd Year Spectroscopy
http://slidepdf.com/reader/full/3rd-year-spectroscopy 13/3613
49
Energy levels:
J
J J-1
J
4
2 2 2
E =BJ(J+1), J=0,1,2,3.............
: E
Spherical rotors (e.g. CH ):
Linear rotors (e.g. CO , HCl, C H
E E 2BJ
E =BJ(J
Seperation
+1), J=0,1
between adjacent lev
,2,3............
els
Seperation betwe
.
):
− = ∆ =
J J-1: E E E 2BJ
Rotational constant decreases as I increases
large molecules have closely spaced rotational E levels.
en adjacent leve
ls − = ∆ =
⇒
50
Energy levels: symmetric Rotor
3 3 6 6
In symmetric rotors, two moments of inertia are equal but different
from the third (as in CH Cl, NH , and C H );
the unique axis of the molecule is its principal axis.
Now energy term is more complex (
,
2
K is the quantum number used to signify
a component on the principal axis;
angular
)
momentum about the
:
principal ax
is,
( 1) ( ) , 0,1,2,3... 0, 1, 2... J k
see Atkins for details
E BJ J A B K J K = + + − = = ± ±
51
Degeneracy
Degeneracy of Jth level is (2J+1)
– mJ subsidiary quantum number
– angular momentum of the molecule has a
component on an external, lab.-fixed axis (z)
– (a) M J is close to its maximum value, J , most of
the molecular rotation is around the laboratory z-axis.
– (b) An intermediate value of M J.
– (c) When M J = 0 the molecule has no angular
momentum about the z-axis.
– All three diagrams correspond to a state with K
= 0.
52
Degeneracy & Stark effect:
Polar linear rotor case:
– Can observe the degenerate energy
levels by applying an external electric
field M J = 0 :
– All sublevels are doubly degenerate
except that with M J = 0
2J+1 fold degeneracy:– E.g. J =7, 15 levels.

8/14/2019 3rd Year Spectroscopy
http://slidepdf.com/reader/full/3rd-year-spectroscopy 14/3614
53
Rotational energy levels: Linear Rotor
E
J=4, M4=9
J=3, M3=7
J=2, M2=5
J=1, M1=3
J=0, M0=10
For ∆ J=1:
∆E = 2 (J) h2 /8π2I
– 0→1: ∆E = 2 h2 /8π2I
– 1→2: ∆E = 4 h2 /8π2I
– 2→3: ∆E = 6 h2 /8π2I
etc.,
Rem. J= upper E level.
Constant increasing
difference of:
– ∆E = 2 h2 /8π2I = 2B
54
Selection Rules (1):
Selection rules for absorption are:
The molecule must have a non-zero
dipole moment, µ ≠ 0.
– A rotating polar molecule looks like an
oscillating dipole that can stir the EM field
into oscillation (and vice versa for
absorption).
∆J = +1
55
Selection Rules (2):
Rotational Inactive molecules:
– Homonuclear diatomics: N2, O2, etc.
– Symmetrical linear molecules: CO2.
– Spherical rotors (CH4) cannot have electric dipole
moments.
Which of the following molecules are rotationally
active and yield a pure rotational spectrum?
CO2, OCS, H2O, CH2=CH2,
C6H6, H2, NO, N2O, CH4
56
Selection Rules (3):
Specific rotational selection rules are found by
evaluating the transition dipole moment between
rotational states.
– ∆J = ±1, ∆MJ = 0, ±1
– J = +1 corresponds to absorption.
– J = −1 corresponds to emission.
The allowed change in J in each case arises from
the conservation of angular momentum when a
photon, (a spin -1 particle), is emitted or absorbed.
8/14/2019 3rd Year Spectroscopy
http://slidepdf.com/reader/full/3rd-year-spectroscopy 15/36
15
57
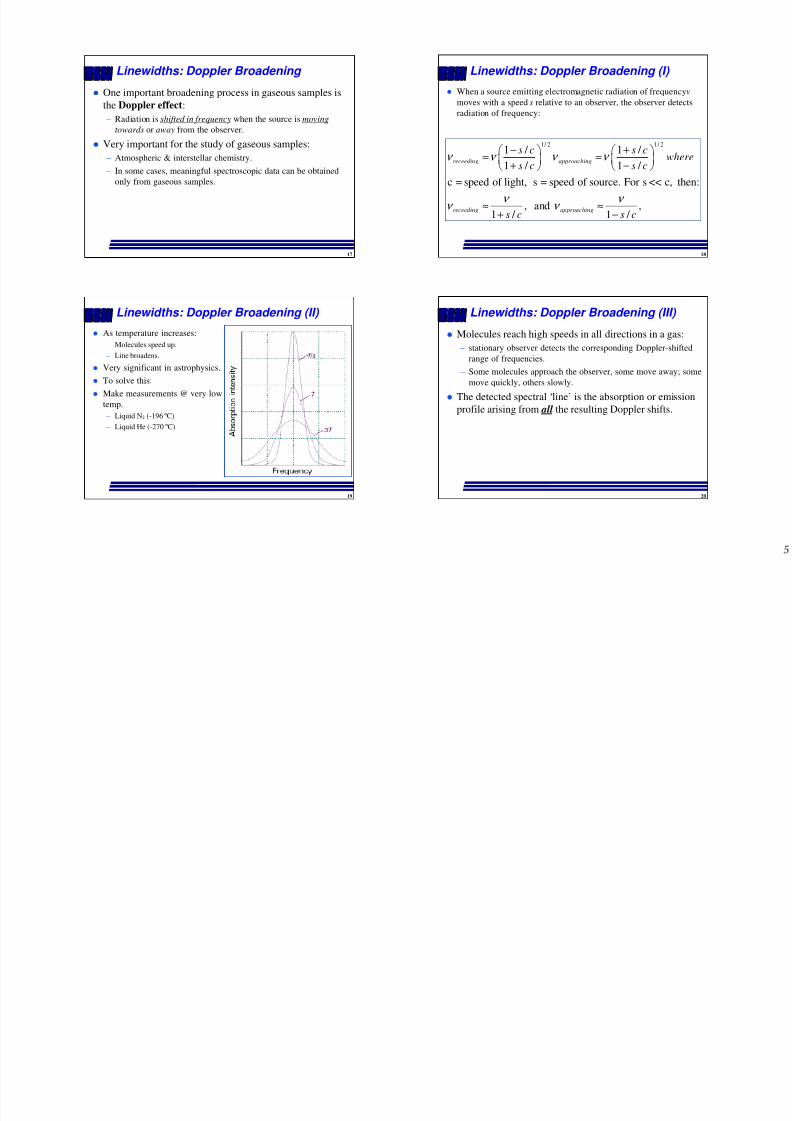
Rotational energy levels: linear rotor.
Top: transitions allowed by
the selection rule ∆J = ±1,
Bottom: typical pure
rotational absorption spectrum
(displayed in terms of
transmitted radiation).
Intensities reflect:
– populations of the initial level.
– strengths of the transition dipole
moments.
Constant frequency separation.
Increasing energy separation.
58
Example 1:(I)
The splitting between the spectral lines in the 12C16O
spectrum is 3.8626 cm-1. Find the value of re, theequilibrium internuclear distance.
( )( )
( )
22
2
2 2 22
2 2 2 2
12 16
2hStep 1: Equations: E = , for a linear diatomic: .
8 I
2h 2h 2hRearrange to : E =
8 8 E 8 E
Step 2: Calculate reduced mass for C O:
0.012 0.016= , =
0.012
C O
C O
I r
r r r
m m
m m
µ π
π µ π µ π µ
µ µ
∆ =
∆ ⇒ = ⇒ =∆ ∆
+ +( )-26
1kg, = avogadros number
0.016
= 1.139 x 10 kg
a
a
N N
µ
×
59
Example 1:(II) -1 -1
34 10 1 1
23
2 34 2
2 2 26
Step 3: Convert cm to joules: 3.8626 cm , E = hc
E (6.621 10 Js) (2.998 10 cms ) (3.8626 cm )
E = 7.667 10 J
Step 4: input values:
2h 2 (6.626 10 Js)8 E 8 (1.139 10 kg) (
er
ν ν
π µ π
− − −
−
−
−
= ∆
⇒ ∆ = × × × ×
∆ ×
× ×= =∆ × × ×
23
67 2 220 -1 2 2 -2
47
o10
7.667 10 J)
8.768 10 J s )1.272 10 Jkg s [REM: 1 J= 1 kgm s ]
6.895 10 kgJ
1.128 10 m = 1.128 Α
e
e
r
r
−
−−
−
−
×
×= = ×
×
= ×
60
Appearance of spectra
Intensities of spectral lines increase with
increasing J and pass through a max. before tailing
off as J becomes large.
The most important reason for the maximum in
intensity is the existence of a maximum in thepopulation of rotational levels.
Boltzmann distribution implies that the population
of each state decays exponentially with increasing
J , but the degeneracy of the levels also increases.

8/14/2019 3rd Year Spectroscopy
http://slidepdf.com/reader/full/3rd-year-spectroscopy 16/36
16
61
Populations of rotational levels
( ) J
J J
/ kT
n g eε −
∝J 2J+1 exp ( -εεεε / kT ) nJ / n 0
0 1 1.000 1.00
1 3 0.981 2.94
2 5 0.945 4.73
3 7 0.893 6.25
4 9 0.828 7.45
5 11 0.754 8.29
6 13 0.673 8.75
7 15 0.590 8.85
8 17 0.507 8.629 19 0.428 8.13
Use this to calculatethe relative
populations of the
energy levels…
Show how
spectra/populations
change with
temperature &
energy.
62
Relative populations
Thermal equilibrium
relative populations of rot.
E levels for linear rotor.
REMEMBER:
You have to have
molecules in the ground
state… AND…
a vacancy in the excited
state for absorption…
Like airlines….
63
Example (2): part I
Pure Microwave absorptions at 84.421, 90.449, and 96.477 GHz on
flowing dibromine gas over hot copper metal at 1100 K.
What transitions do these frequencies represent?
What is the bond length of the sp
9 -1
ecies formed? Assume linear rotor.
Step1 Analysis: 96.477 - 90.449 = 6.028 & 90.449 - 84.421 = 6.028
So, constant near constant differance: 6.028 GHz = 6.028 10 s .
84.421 6.028 = 14 J=13
×
⇒ ÷ →
29 -1
2
J=14 E = 28B
90.449 6.028 = 15 J=14 J=15 E = 30B
96.477 6.028 = 16 J=15 J=16 E = 32B
hE = 2BJ = 2 J = h 2B h (6.028 10 s ) .
8 Iν
π
⇒ ∆
⇒ ÷ → ⇒ ∆
⇒ ÷ → ⇒ ∆
∆ ⇒ = ×
Data from NIST website, Original paper: Manson, De Lucia, Gordy. J. Chem. Phys. 63, 2724 (1975). 64
Example (2): part II
29 -1
2
2 2
2 2 9 -1
-34
-45 2 2
2 9 -1
2
A
2 hE = = h = h(6.028 10 s )
8 I
2 h 2 hRearrange to: I =
8 E 8 (h 6.028 10 s )
2 (6.626 10 Js)I = 2.784 10 Js ( kgm )8 (6.028 10 s )
(0.063 0.079)I = r , = N = 5.82 1
(0.063+0.079)
ν π
π π
π
µ µ
∆ ×
=∆ × ×
× = × =×
×× -26
-45 2-12
-26
0 kg
2.784 10 kgmr= I/ 218.6 10 m.
5.82 10 kg µ
×⇒ = = ×
×

8/14/2019 3rd Year Spectroscopy
http://slidepdf.com/reader/full/3rd-year-spectroscopy 17/36
1
65
Centrifugal distortion (I)
Atoms of rotating molecules are
subject to centrifugal forces
– tend to distort the molecular geometry
– changes the moments of inertia
The effect of centrifugal distortion on a
diatomic molecule is:
⇒ stretch the bond
⇒ increases the moment of inertia.
66
Centrifugal distortion (II)
Increased bond lengths ⇒ bigger moments of inertia
– reduces the rotational constant
consequently the energy levels are slightly closer than the rigid-
rotor expressions predict.
Effect is usually taken into account empirically by subtracting a
term from the energy and writing:
2 2
J
J
( ) ( 1) ( 1)
D is the centrifugal distortion constant.
D is large when the bond is easily stretched.
J E J BJ J D J J = + − +
67
Emission spectroscopy: 1
Radio-telescopes pick up radiation from interstellar space.
High resolution means that species can be identified
unambiguously.
Owens Valley Radio Observatory 10.4 m telescope
Orion A molecular cloud ~300K, ~10-7
cm-3
517 lines from 25 species
CN, SiO, SO2, H2CO, OCS, CH3OH, etc
13CO (220,399 MHz) and 12CO (230,538 MHz)
See spectrum on slide 35.
68
3rd year spectroscopy: 3 rd Topic
Vibrational Spectroscopy:
– Introduction & selection rules.
– Potential energy level diagram.
– Anharmonicity
– Morse Potential Energy curve.
– Overtones & Hot bands.
Understand and be able to explain vibrational spectroscopy, terms
and concepts. Calculate reduced masses, energy levels &
transitions, force & anharmonicity constants, & number of
vibrational modes.
– Sec. 19.9-19.15: Elements of Physical Chemistry, 4th ed.
– Sec. 13.9-13.15: Physical Chemistry, 8th ed. Atkins.
4th year QChem

8/14/2019 3rd Year Spectroscopy
http://slidepdf.com/reader/full/3rd-year-spectroscopy 18/36
18
69
Molecular vibrations 1
All molecules capable of vibrating.
Many different types of vibration (modes)|:
– Stretching, Bending, Wagging, Twisting.
The bigger the molecule, the more vib. modes:
– 3 N − 5 for linear molecules (e.g. CO2)
– 3 N − 6 for nonlinear molecules (e.g. H2O) .
– Where N = number of atoms in molecule
– Diatomics (1 mode)
– Proteins…10’s of thousands
Vibrations excited by absorption of EM radiation of correct energy.
70
Molecular vibrations 2
Observing the frequencies of vibration can be used to ID molecules:
Molecular Fingerprints
FT-IR and Raman spectroscopy used in this way for:
– Forensics (drugs, explosives, hazmat)
– Monitoring progress of reactions
0
2 5 0 0
5 0 0 0
7 5 0 0
5 0 0 6 0 0 7 0 0 8 0 0 9 0 0 1 0 0 0 1 1 0 0R a m a n s h i f t, c m
- 1
I n t e n s i t y ( a r b . u n i t s )
MDMA
Heroin Cocaine
71
Selection Rules
These are very important in vibrational spectroscopy.
Used to predict which vibrations you should observe.
Rules are different for IR-Absorption and Ramanscattering.
Sometimes we see bands in IR and not in Raman …..andvisa-versa.
Raman good for non-polar molecules.
IR good for polar molecules.
72
Gross selection rule: IR-Absorption
The dipole moment, p, of the molecule must changeduring the vibration for it to IR active
• Does not have to have apermanent dipole…canmove
• Some vibrations cause nochange in dipole moment(homonuclear diatomics)
Transitions are restricted to single-quantum jumps toneighboring levels……e.g. from v=0 to v=1, from v=1 to v=2,etc

8/14/2019 3rd Year Spectroscopy
http://slidepdf.com/reader/full/3rd-year-spectroscopy 19/36
19
3Y-Spectroscopy-NUIG-2008/9 73
Changing dipole moment
– Original molecule AB:
2 atoms + “bond”
⇒ electron cloud
– Draw bond dipole
– Distort molecule
– Draw new bond dipole
– Has dipole changed?
+q -qr
p→→→→
p→→→→
+q -qr
A Br
74
Typical IR spectrum Plot of%TransmittanceVersus Wavenumber
Vibration type V /cm−−−−1
C–H 2850−2960
C–H 1340−1465
C–C stretch, bend 700−1250
C=C stretch 1620−1680
C≡C stretch 2100−2260
O–H stretch 3590−3650
C=O stretch 1640−1780
C≡N stretch 2215−2275
N–H stretch 3200−3500
Hydrogen bonds 3200−3570
3Y-Spectroscopy-NUIG-2008/9 75
Environmental Influences (I)
Covalent diatomic molecule HCl:
– Gas-phase (2,886 cm-1), Solid state (2,720 cm-1).
– Aromatic solvent (2,712 cm-1 ), ether solvent (2,393 cm-1).
Conclusion?
– weak intermolecular bonding R2O....H-Cl
Vibrational bands are usually broader in condensedmedia (solid liquid) than gas phase.
Crystalline materials have sharper vibrational bandsthan amorphous materials:
– Can be used to distinguish polymorphs of pharmaceuticalproducts.
– Degree of crystallinity in polymers & semi-conductors.
76
Analysis of vibrational spectra (I)
Functional group region most important for interpreting
IR spectra:
– In IR it is the polar covalent bonds than are IR "active".
– In Raman spectra non-polar bonds are also "active".
– In organic molecules these polar covalent bonds represent the
functional groups.
Hence, the most useful information obtained from an IR
spectrum is what functional groups are present within the
molecule.

8/14/2019 3rd Year Spectroscopy
http://slidepdf.com/reader/full/3rd-year-spectroscopy 20/36
20
77
Band areas
Single bonds toH
O - H
C - H
Fingerprint region
Phenol…
Functional group region
78
Analysis of vibrational spectra (II)
Some functional groups are combinations of different
bond types:
– Esters (CO2R) contain both C=O and C-O bonds.
– Both are typically seen in an IR spectrum of an ester.
In the fingerprint region, spectra tend to be more complex
and much harder to assign.
– But very important in Physics, Materials Science,
etc………….properties of materials
79
Applications of IR spectroscopy (I)
IR spectra of polyatomics are complex:
More than just stretching vibrations:
– Bending, wagging, twisting.
– Combinations of vibrations.
Very good therefore for:– Identification (forensics).
– Molecular Comparison.
– Non-destructive testing.
– Seeing changes in molecular environment.
80
Applications of IR spectroscopy (II)
Can be implemented in microscopes for micron scale
analysis.
Drawbacks:
Very sensitive to water and other polar molecules
– Makes measurements in solution very difficult An absorption effect….limits sensitivity & hinders
sampling.
Works in the IR region ⇒ limits optical resolution.
Not very good for quantitative analysis.
8/14/2019 3rd Year Spectroscopy
http://slidepdf.com/reader/full/3rd-year-spectroscopy 21/36
21
81
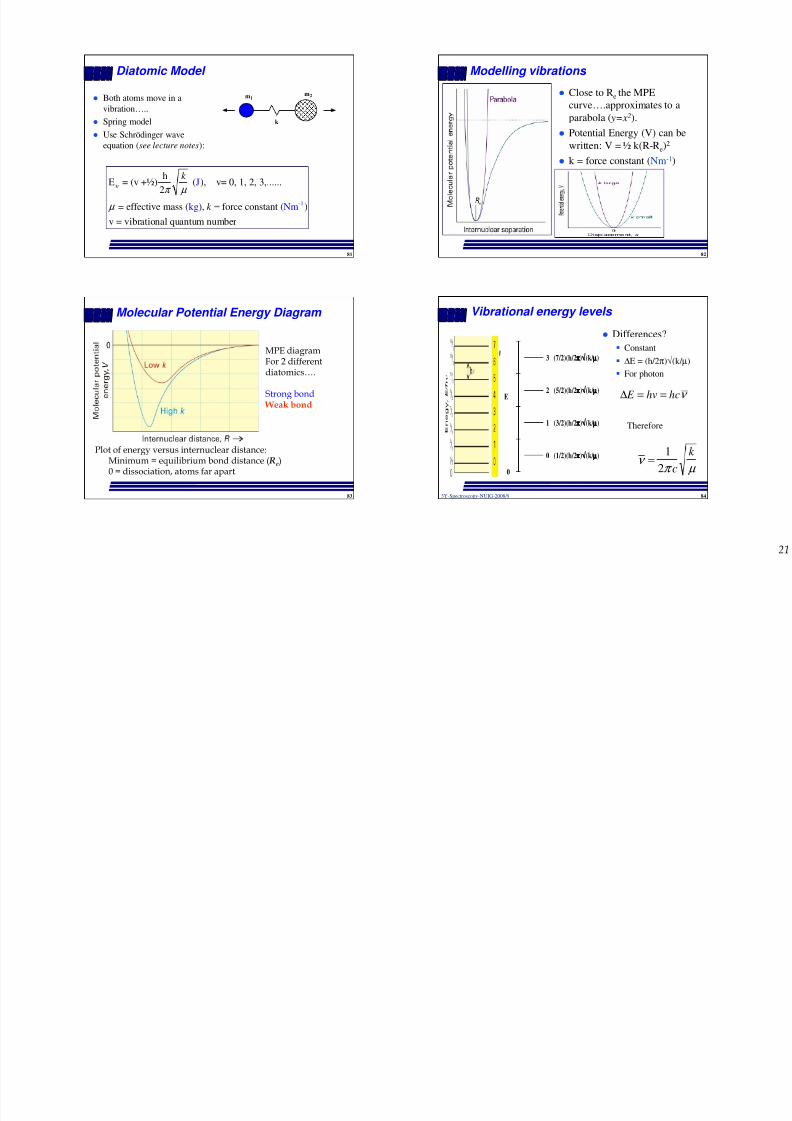
Diatomic Model
Both atoms move in avibration…..
Spring model
Use Schrödinger wave
equation (see lecture notes):
m1m2
k
-1
hE = (v +½) ( ), v= 0, 1, 2, 3,......
2
= effective mas
J
kg Ns ( ), force constant ( )
v = vibrational quantum numb r
m
e
k
k
υ π µ
µ =
82
Modelling vibrations
Close to Re the MPE
curve….approximates to aparabola ( y=x2).
Potential Energy (V) can be
written: V = ½ k(R-Re)2
k = force constant (Nm-1)
83
Molecular Potential Energy Diagram
Plot of energy versus internuclear distance:Minimum = equilibrium bond distance ( R
e)
0 = dissociation, atoms far apart.
MPE diagramFor 2 differentdiatomics….
Strong bond Weak bond
3Y-Spectroscopy-NUIG-2008/9 84
Vibrational energy levels
E
0
0
1
2
3
(1/2)(h/2ππππ)√√√√(k/ µµµµ)
(3/2)(h/2ππππ)√√√√(k/ µµµµ)
(5/2)(h/2ππππ)√√√√(k/ µ
µµµ)
(7/2)(h/2ππππ)√√√√(k/ µµµµ)
Differences?
Constant
∆E = (h/2π)√(k/ µ)
For photon
Therefore
ν π µ
=1
2 c
k
ν hchv E ==∆
8/14/2019 3rd Year Spectroscopy
http://slidepdf.com/reader/full/3rd-year-spectroscopy 22/36
22
85
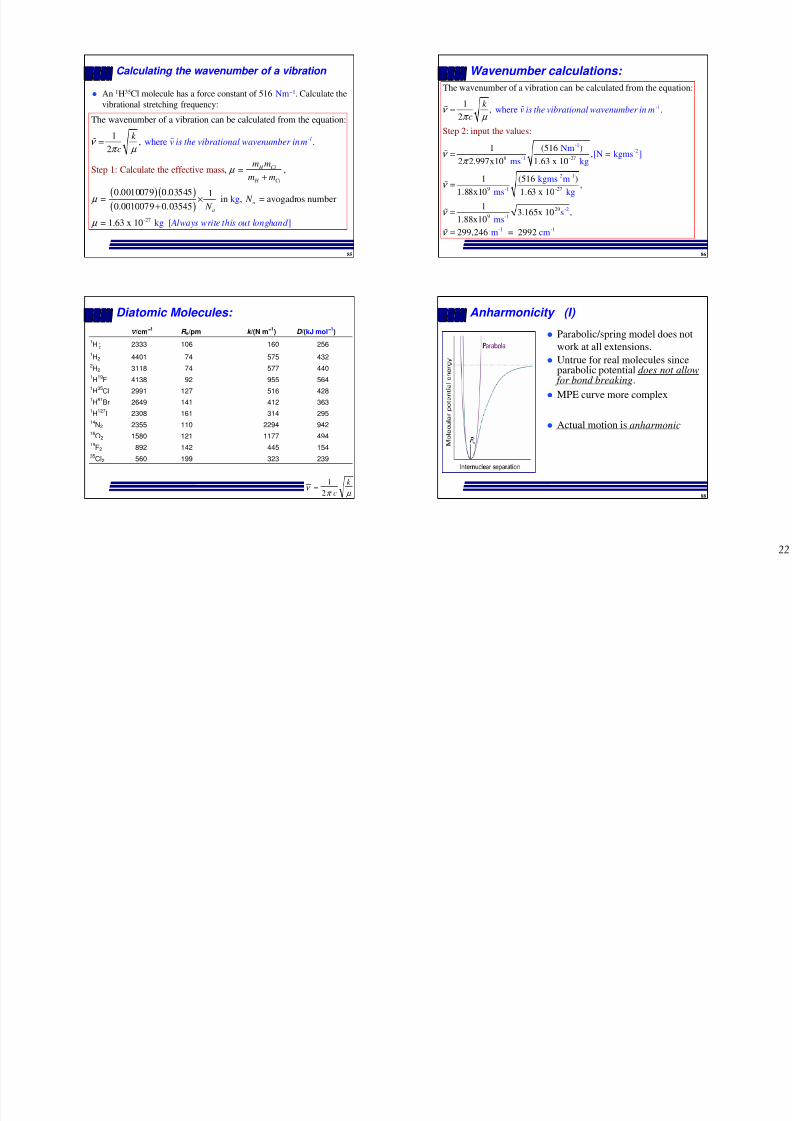
Calculating the wavenumber of a vibration
An 1H35Cl molecule has a force constant of 516 Nm−1. Calculate the
vibrational stretching frequency:
( )( )
where
The wavenumber of a vibration can be calculated from the equation:
1, .
2
, = ,
0.0010079 0.03545
= 0.0
Step 1: Calculate the effective mass
-1
H Cl
H Cl
ν is the vibrational wavenumber ink
c
m m
m
m
m
ν π µ
µ
µ
=
+
( )-27
1in , = avogadros number010079 0.03545
= 1.63 x 10
kg
kg [ ]
a
a
Always write this out longh d
N N
an µ
×+
86
Wavenumber calculations:
8
-1
- 71 -2
The wavenumber of a vibration can be calculated from the equation:
1 , .2
1 (516 ),
2 2.997x10 1
Step
.63 x 10
2: input
where
N
the v
m[N =
alue
s kg
s:
k m
-1ν is the vibrational wavenumber in mk
cν
π µ
ν π
=
=
-2
-2 -1
-1
-2
-1
-1 -1
9 -27
29
9
1 (516 ),
1.88x10 1.63 x 10
1
gms ]
kgms m
ms kg
s3.165x 10 ,1.88x10
2
ms
m cm99,246 = 2992
ν
ν
ν
=
=
=
87
Diatomic Molecules:
V /cm−−−−1 R e/pm k /(N m−−−−1) D /(kJ mol−−−−
1)
1H 2
+ 2333 106 160 256
1H2 4401 74 575 432
2H2 3118 74 577 440
1H
19F 4138 92 955 564
1H
35Cl 2991 127 516 428
1H
81Br 2649 141 412 363
1H
127I 2308 161 314 295
14N2 2355 110 2294 942
16O2 1580 121 1177 494
19F2 892 142 445 154
35Cl2 560 199 323 239
ν π µ
=1
2 c
k
88
Anharmonicity (I)
Parabolic/spring model does not
work at all extensions.
Untrue for real molecules sinceparabolic potential does not allow for bond breaking.
MPE curve more complex
Actual motion is anharmonic

8/14/2019 3rd Year Spectroscopy
http://slidepdf.com/reader/full/3rd-year-spectroscopy 23/36
23
89
Convergence of energy levels
Use a function that resembles the
general shape of a molecularpotential energy curve.
Morse Potential Energy Curve
Corresponding Schrödinger equation
can be solved:
– Values of the energies obtained.
– Number of bound levels is finite .
– Tends to a limit at the dissociation
energy.
90
Morse Potential Energy Curve (II)
De = depth of the potential minimum.
Near the well minimum the variation of
V with displacement ≈ a parabola.But allows for dissociation at large
displacements.
{ }
( )21Rem: V= kx where, x
2
2
e
2
e
ea( R R )e
R R for s
k , a ,
2
imple HO.
hcDV hcD 1 e µω
ω µ
− − = =
−
=
= −
Morse Potential Energy
91
Morse Potential Energy Curve (III)
Solving the Schrödinger equation for the Morse potential gives
permitted energy levels (in vibrational wavenumber terms):
2
nd
2
,2 4
/
1.
2
2 term in the expression subtracts from the first with increasing effect
as increases, and hence
1 1( )
gives ris
2 2
e
ee
e
G v v v xa
x D
k
k vibrational wavenumber
c
v
ν
µω
ω µ
ν µ
ν
π
ν = + − +
= =
=
= =
to the convergence of the levels
at high quantum numbers.
92
Spring model vs. Morse
Energy levels unequally
spaced, converging at high
energy.
Amount of distortion
increases with increasing
energy.
All transitions are no
longer the same.
E
0
6
5
4
3
2
1
0
6
5
4
3
2
1
0
2
G( ) =( +½)hc ,...........................simple spring model
G( ) =( +½)hc ( +½) hc ....Morse modele
x
υ υ ν
υ υ ν υ ν −

8/14/2019 3rd Year Spectroscopy
http://slidepdf.com/reader/full/3rd-year-spectroscopy 24/36
24
93
Overtones & Hot Bands
Anharmonicity results in allowed transitions for:
Transitions of ∆v > 1 are allowed:
– Fundamental (0→1).
– Overtones (0 → 2):
Enables calculation of Anharmonicity constant xe.
– Basis of NIR spectroscopy (overtones of OH, CH, NH).
For anharmonic oscillator, all values of v are allowed:
– v > 1 transitions, only weakly allowed if anharmonicity is
slight.
– Hot bands (1 → 2)
94
Example:
1
1
2
e e e
e
HCl has a fundamental band at 2,885.9 ,
and an overtone at 5,668.1 .
Calculate we and the anha
Step 1: Equation: G(v) = (v + 1/2) - (v + 1/2
rmonicity constant .
For the overtone
)
cm
cm
.
b
x
xν ν
−
−
2
2 e e e
2
1 e e e
2
0 e e e
11
and, v=2 E = (2 + 1/2) (2 + 1/2)
For the fundamental band, v=1 E = (1.5) (1.5)
For zero point energy, v=0 E = (0.5) (0.5)
Step 2: Input values & solve
c2885.9 m
:
= E
x
x
x
ν ν
ν ν
ν ν
−
⇒ −
⇒ −
⇒ −
0 e e e
e
2 0 e e e
1
1
e
E 22989.6
5668.1 = E E 2 6
0.0 4
m
17
cmc
x
x
x
ν ν ν
ν ν
−
−− = − =− = −
⇒ =
95
3 rd year quantum: 4th Topic
Vibrational-Rotational Spectroscopy :
– High resolution spectroscopy.
– Selection Rules.
– P-Q-R branches.
– Combination Differences.
– Calculating energies of transitions.
Understand and be able to explain high resolutionvibrational spectroscopy and the selection rules. Be ableto calculate energy levels and rotational constants.
– Sec.19.14: Elements of Physical Chemistry, 4thed., p.502 (intro).
– Sec. 13.12, Physical Chemistry, Atkins 8th ed., p.457.
96
Background
In condensed phases (liquid, solids) the lower energy
transitions are all hidden in the gross vibrational
spectra….
In the gas phase, where there is little intermolecular
interactions:
– Use a high resolution spectrometer:
– Can Resolve the vibrational bands into many individual
narrower bands…..~10 cm-1 separation
– ⇒ rotational modes

8/14/2019 3rd Year Spectroscopy
http://slidepdf.com/reader/full/3rd-year-spectroscopy 25/36
25
97
High resolution spectrum of HCl
The lines appear in pairs because H35Cl and H37Cl bothcontribute (their abundance ratio is 3:1).
– Mode is H-Cl stretch
98
High resolution infrared (Energies)
2
J 2
2
,
Combining Vibrational + rotational energy changes:
In terms of joules ( )
Energy of a rotational-vibrational transition
hE =
is:
E
1 h k E = ( + )
2 2
1 h k ( + )
2
J(J
2
+1)8 I
hJ(J+1)+
J
8
J ν
ν ν π
ν
π µ
π
µ
π
⇒
=
,
2
2
2
,
1(
I
h
8 I)
h k
2( 1) Where
2 J e ev v
or
E B J B J ν ω π
ω π µ
ν = + + + =
=
99
High Res. IR (Selection rules)
E(v,J) = (v + 1/2)ħ(k / µ)1/2 + J(J + 1)Bv
Selection rule: ∆v= +1, ∆J = ±1 (& sometimes 0)
– Rotational energy change must accompany a vibrational energy
change.
On low energy side, ∆J = –1, = P Branch.
– Intensities mirror populations of starting levels
On high energy side, ∆J = +1, = R branch.
For ∆J = 0, Q branch
100
Q branch selection rule
Q branch J = 0,
Is allowed only when there is angular momentum around
the axis of a linear molecule
– e.g. NO has Q branch because of single π electron
For spectrum of HCl there is a gap at the expected
location of the Q branch because it is forbidden.
For CO2…some modes do/others don’t:
– Asymmetric stretch…no Q branch
– Bending mode…has an Q branch
8/14/2019 3rd Year Spectroscopy
http://slidepdf.com/reader/full/3rd-year-spectroscopy 26/36
26
101
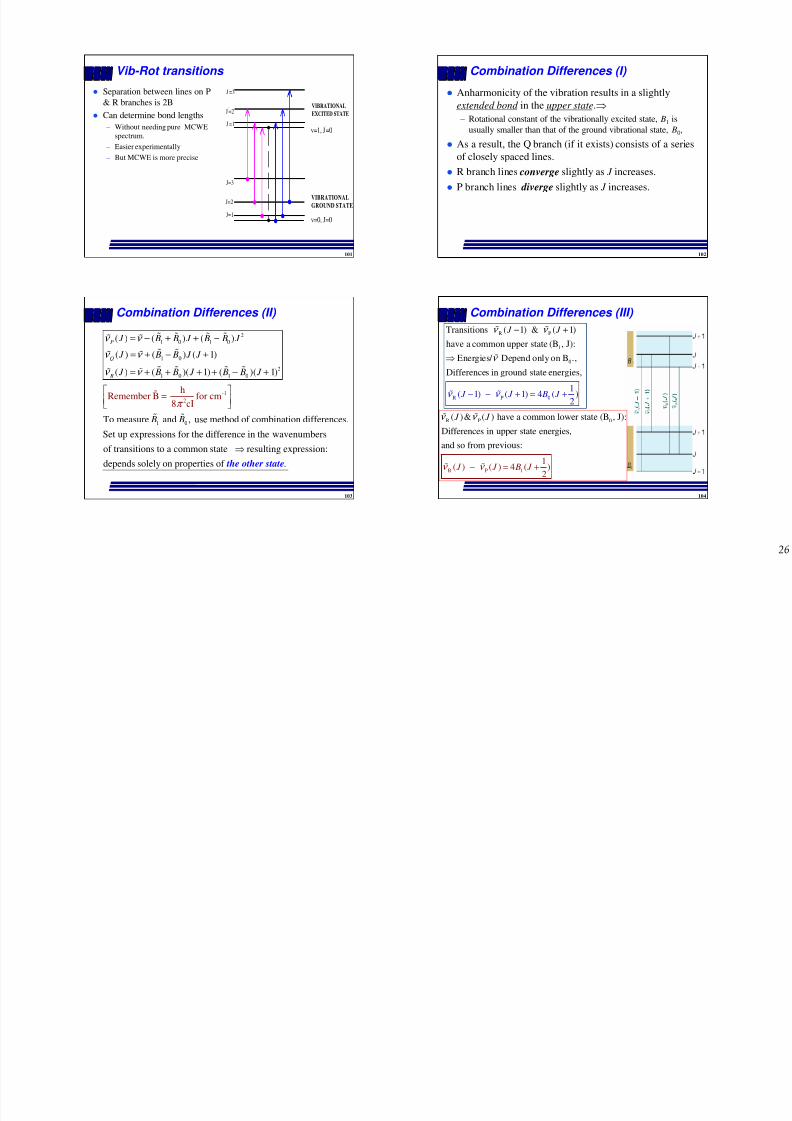
Vib-Rot transitions
Separation between lines on P
& R branches is 2B Can determine bond lengths
– Without needing pure MCWE
spectrum.
– Easier experimentally
– But MCWE is more precise
v=1, J'=0
J'=1
J'=2
J'=3
J=1
J=2
J=3
v=0, J=0
VIBRATIONALGROUND STATE
VIBRATIONAL
EXCITED STATE
102
Combination Differences (I)
Anharmonicity of the vibration results in a slightly
extended bond in the upper state.⇒– Rotational constant of the vibrationally excited state, B1 is
usually smaller than that of the ground vibrational state, B0,
As a result, the Q branch (if it exists) consists of a series
of closely spaced lines.
R branch lines converge slightly as J increases.
P branch lines diverge slightly as J increases.
103
Combination Differences (II)
2
1 0 1 0
1 0
2
1 0 1 0
1 0
-1
2
hRemember B =
( )
for cm8 c
( ) ( )
( ) ( ) ( 1)
( ) ( )( 1) ( )( 1)
To measure and , use method of combination differences.
Set up
I
P
Q
R
J B B J B B J
J B B J J
J B B J B B J
B B
ν ν
ν ν
ν ν
π
= − + + −
= + − +
= + + + + − +
expressions for the difference in the wavenumbers
of transitions to a common state resulting expression:
depends solely on properties of .
⇒
the other state
104
Combination Differences (III)
R
R P
1
0
P 0
Transitions ( 1) & ( 1)
have a common upper state (B , J):
Energies/ Depend only on B .,
Differences in ground s
1
(
tate energies,
1) ( 1) 4 ( )2 J J B J
J J ν
ν
ν
ν
ν
− − + =
− +
+
⇒
0
1
R P
R P
( )& ( ) have a common lower state (B , J):
Differences in upper state energies,
and so from p
1(
revious:
) ( ) 4 ( )2
J J
J J
B J ν
ν ν
ν − = +

8/14/2019 3rd Year Spectroscopy
http://slidepdf.com/reader/full/3rd-year-spectroscopy 27/36
2
105
Combination Differences (IV)
Plot of the combination difference against J + ½ should
be a straight line of slope 4 B0 or 4B1,⇒– Rotational constant of the molecule in the state v = 0 or V=1 can
be determined [see practical no. 3.5]
– B1 should be less than B0
– If slope not linear ⇒ Centrifugal distortion at play
– Remember to check units (cm-1 or J)
106
Example: HBr….part 1:
-1
The Vibrational-Rotational spectrum of HBr has many absorption
lines, four of which are at: 2590.95, 2575.19, 2542.25, and 2525.09 .What is the fundamantal vibration and the rotational consta
cmnts fo
- nd rd1
Step 1: Analysis of data & assignment of transiti
r the
g
Seperation is ~ 15 except betwee
round and first vibrationally excited stat
n 2 & 3 where it is do
e?
uble this.
Missing tra
ons:
nsit
c
l
m
ion⇒ -1ies around 2560 .
2575 is (v=0, J=0) (v=1, J=1) transition
2590 is (v=0,J=1) (v=1,J=2) transition
2542 is (v=0,J=1) (v=1,J=0) transition
2525 is
cm
(v=0,J=2)
(R branch)
(R branch)
(P branch)
⇒ →
⇒ →⇒ →
⇒ (v=1,J=1) transition (P branch)→
107
Example: HBr….part 2:
R P
-1 -1
-10
0
0
0
1( 1) ( 1) 4 (
Step 2: Equatio
For Transitions with a common upper state (v=1, J=1):
2 cm cm
ns & Input values
575.19 ( ) - 2525.25 ( ) = 4B (1+1/2)
)
= 6BB 8.35
For Tr
:
c
a
m
nsitio
n w th
2
s i
J J B J ν ν − − + = +
⇒
=
-1 -1 -
1
1
1
1
R P
0
1( ) ( ) 4 ( )
2
a common lower state (B , J):
2590.95 (cm cm) - 2542.25 ( ) = 6B B 8. c12 m
J J B J ν ν
⇒ ⇒ =
− = +
108
3 rd year quantum: 5th Topic
Raman Spectroscopy:
– Overview and Instrumentation.
– Selection rules & their consequences.
– Rotational Raman.
– Comparison between MIR and Raman.
– Raman Microscopy Understand and be able to explain Raman spectroscopy
and the selection rules. Describe the instrumentation andthe pros/cons of the method.
– Sec. 19.12 & 19.15: Elements of Physical Chemistry, 4th ed.
– Sec. 13.13 & 13.16: Physical Chemistry, 8th ed. Atkins.

8/14/2019 3rd Year Spectroscopy
http://slidepdf.com/reader/full/3rd-year-spectroscopy 28/36
28
109
Scattering process
Scattering of monochromatic light by materials:
– Molecules of a gas, liquid or solid
– Usually NIR, Visible, or UV light used
Light does not have to pass through sample:
– Can analyze lots of different material types
110
2 Types of scattering
99.999 %+ of the incident light is Rayleigh scattered :
– No change in wavelength of incident light.
– Elastic scattering from molecules & materials
<0.001% of the light is Raman scattered:
– either greater than original or less than original by a constant amount
determined by molecular energy levels
– independent of incident light frequency
111
Raman scattering (I)
Light interacts with the vibrational modes of molecules
& materials.
Bands at Longer & Shorter wavelengths.
Stokes shift…tolonger wavelength
Anti-Stokes toshorterwavelength.
112
Raman Scattering (II)
RAYLEIGH
RAMAN(STOKES)
RAMAN(ANTI-STOKES)
υυυυ0000((((υυυυ0000−−−−υυυυ1111)))) ((((υυυυ0000++++ υυυυ1111))))
Frequency, cm-1
Rayleigh scattering:
– 103 – 104 weaker than incident light.
Raman scattering:
– 103 – 105 weaker than Rayleigh.
Ratio between Stokes & Anti-
Stokes:
– Populations of E levels.
– Boltzmann Distribution.
– Dependant on temperature:
( )n g kT J J J ∝ −exp / ε
8/14/2019 3rd Year Spectroscopy
http://slidepdf.com/reader/full/3rd-year-spectroscopy 29/36
29
113
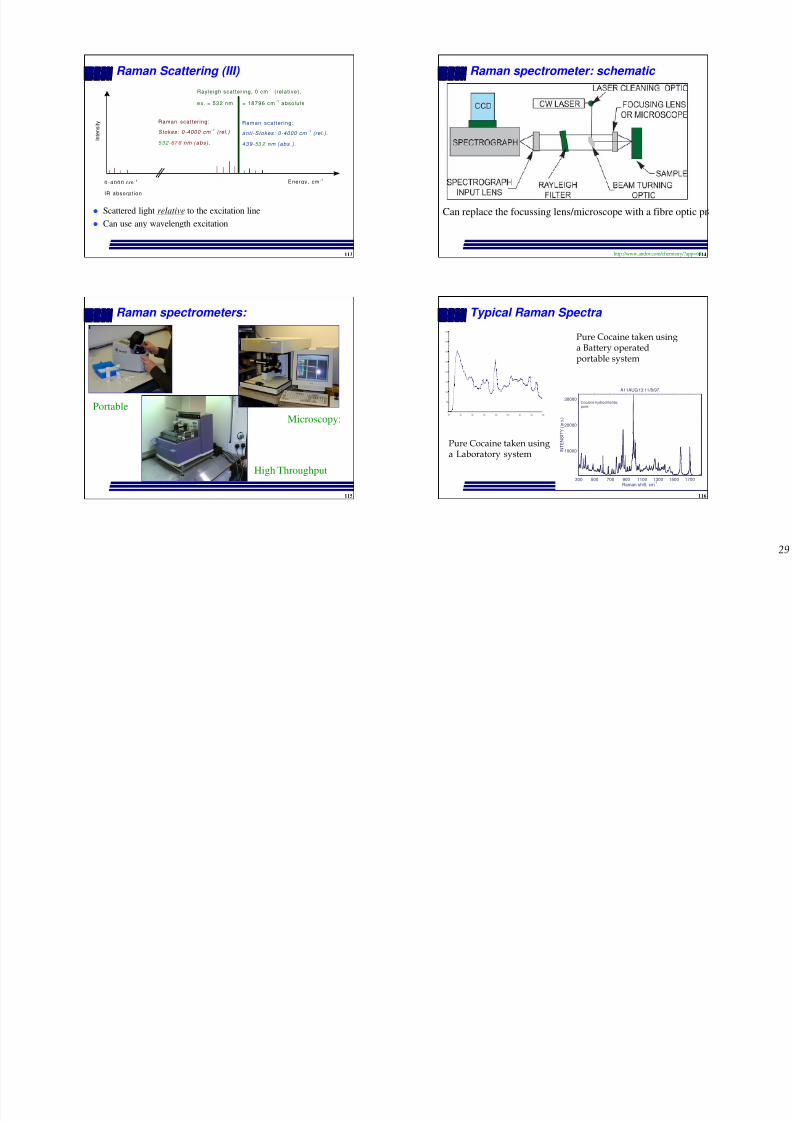
Raman Scattering (III)
Scattered light relative to the excitation line
Can use any wavelength excitation
0-4000 cm -1
IR absorpt ion
Rayleigh scattering, 0 cm -1 (re lat ive),
ex. = 532 nm = 18796 cm-1
absolute
I n t e n s i t y
Energy, cm -1
Raman scattering:
anti-Stokes: 0-4000 cm -1 (rel.).
439- 53 2 nm (abs. ) .
Raman scattering:
Stokes: 0-4000 cm -1 (rel.)
532- 67 6 nm (abs) .
114
Raman spectrometer: schematic
http://www.andor.com/chemistry/?app=64
Can replace the focussing lens/microscope with a fibre optic pr
115
Raman spectrometers:
Portable
Microscopy:
High Throughput
116
Typical Raman Spectra
0
500
1000
1500
2000
2500
3000
3500
4000
200 400 600 800 1000 1200 1400 1600 1800
Pure Cocaine taken usinga Battery operatedportable system
10000
20000
30000
300 500 700 900 1100 1300 1500 1700
Cocaine hydrochloride,pure.
Raman shift, cm-1
.
I N T E N S I T Y
( a r b . )
A11AUG13:11/8/97.
Pure Cocaine taken usinga Laboratory system
8/14/2019 3rd Year Spectroscopy
http://slidepdf.com/reader/full/3rd-year-spectroscopy 30/36
30
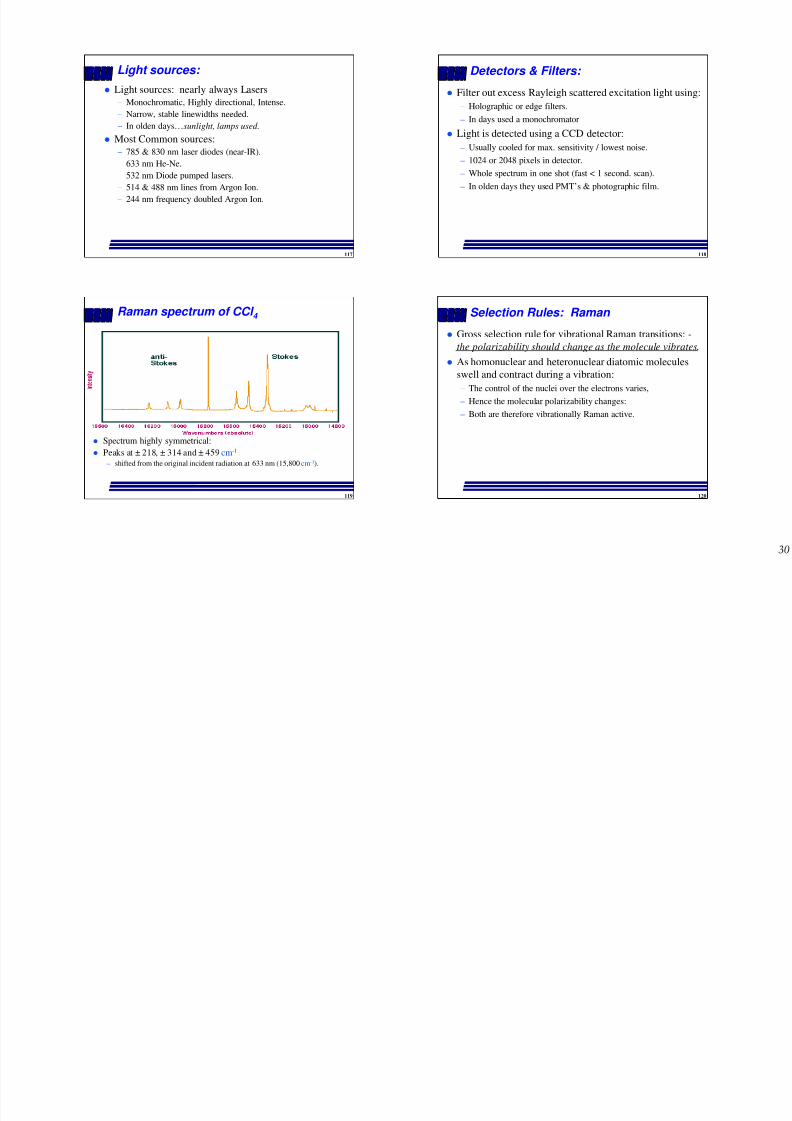
117
Light sources:
Light sources: nearly always Lasers
– Monochromatic, Highly directional, Intense.– Narrow, stable linewidths needed.
– In olden days…sunlight, lamps used.
Most Common sources:
– 785 & 830 nm laser diodes (near-IR).
– 633 nm He-Ne.
– 532 nm Diode pumped lasers.
– 514 & 488 nm lines from Argon Ion.
– 244 nm frequency doubled Argon Ion.
118
Detectors & Filters:
Filter out excess Rayleigh scattered excitation light using:
– Holographic or edge filters.
– In days used a monochromator
Light is detected using a CCD detector:
– Usually cooled for max. sensitivity / lowest noise.
– 1024 or 2048 pixels in detector.
– Whole spectrum in one shot (fast < 1 second. scan).
– In olden days they used PMT’s & photographic film.
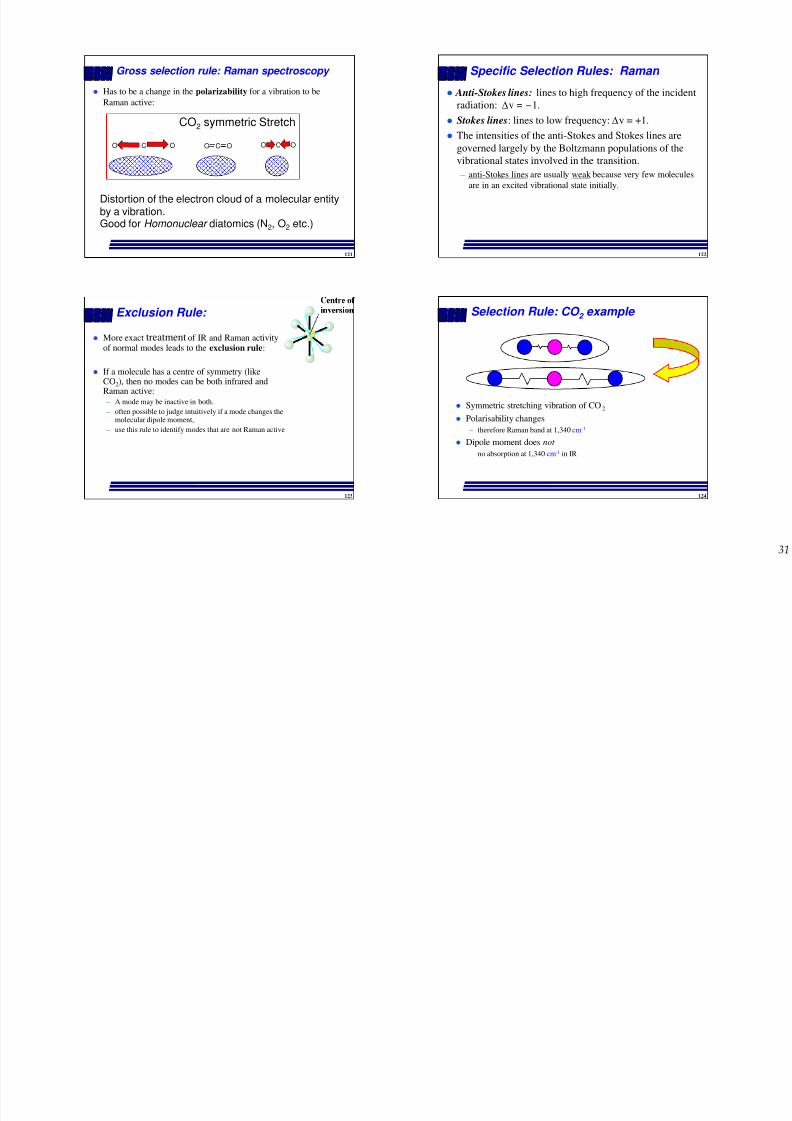
119
Raman spectrum of CCl 4
Spectrum highly symmetrical:
Peaks at ± 218, ± 314 and ± 459 cm-1
– shifted from the original incident radiation at 633 nm (15,800 cm-1).
120
Selection Rules: Raman
Gross selection rule for vibrational Raman transitions: -
the polarizability should change as the molecule vibrates.
As homonuclear and heteronuclear diatomic molecules
swell and contract during a vibration:
– The control of the nuclei over the electrons varies,
– Hence the molecular polarizability changes:
– Both are therefore vibrationally Raman active.
8/14/2019 3rd Year Spectroscopy
http://slidepdf.com/reader/full/3rd-year-spectroscopy 31/36
31
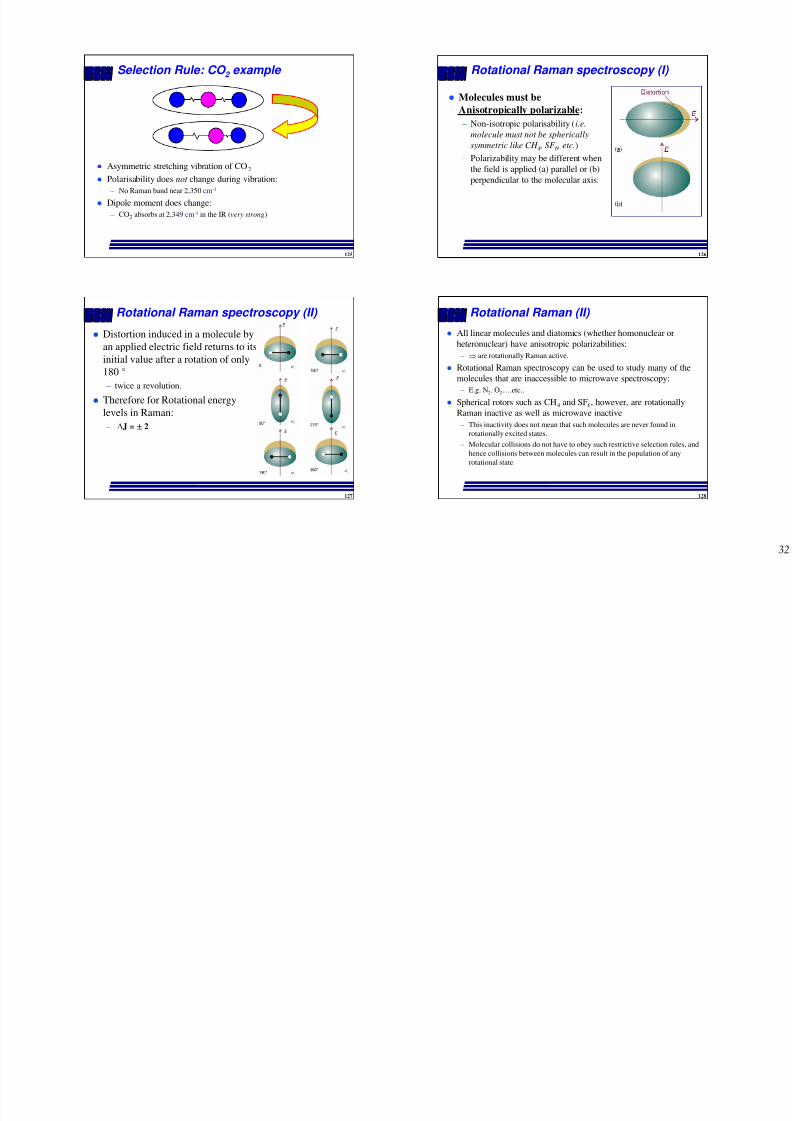
121
Gross selection rule: Raman spectroscopy
Has to be a change in the polarizability for a vibration to be
Raman active:
Distortion of the electron cloud of a molecular entityby a vibration.Good for Homonuclear diatomics (N2, O2 etc.)
C OO O C O C OO
CO2 symmetric Stretch
122
Specific Selection Rules: Raman
Anti-Stokes lines: lines to high frequency of the incident
radiation: v = −1. Stokes lines: lines to low frequency: v = +1.
The intensities of the anti-Stokes and Stokes lines are
governed largely by the Boltzmann populations of the
vibrational states involved in the transition.
– anti-Stokes lines are usually weak because very few molecules
are in an excited vibrational state initially.
123
Exclusion Rule:
More exact treatment of IR and Raman activityof normal modes leads to the exclusion rule:
If a molecule has a centre of symmetry (likeCO2), then no modes can be both infrared andRaman active:– A mode may be inactive in both.
– often possible to judge intuitively if a mode changes themolecular dipole moment,
– use this rule to identify modes that are not Raman active
124
Selection Rule: CO 2 example
Symmetric stretching vibration of CO2
Polarisability changes
– therefore Raman band at 1,340 cm-1
Dipole moment does not
– no absorption at 1,340 cm-1 in IR
8/14/2019 3rd Year Spectroscopy
http://slidepdf.com/reader/full/3rd-year-spectroscopy 32/36
32
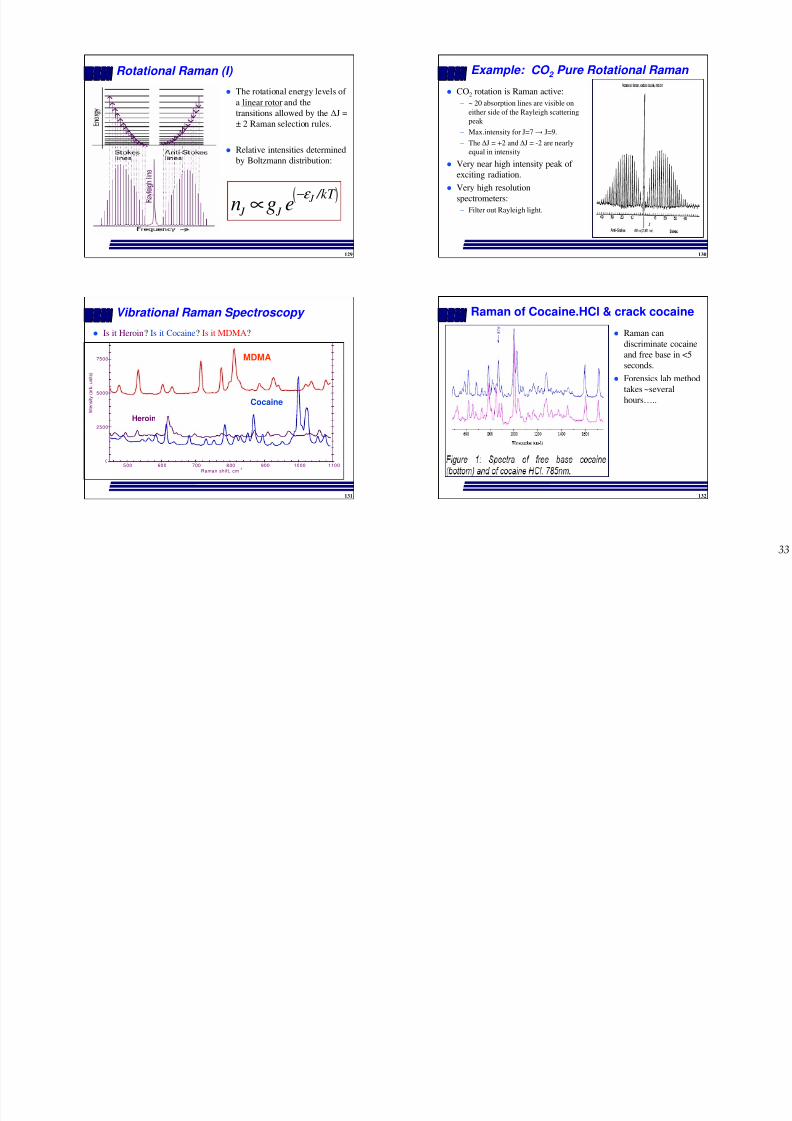
125
Selection Rule: CO 2 example
Asymmetric stretching vibration of CO2
Polarisability does not change during vibration:
– No Raman band near 2,350 cm-1
Dipole moment does change:– CO2 absorbs at 2,349 cm-1 in the IR (very strong)
126
Rotational Raman spectroscopy (I)
Molecules must be
Anisotropically polarizable:
– Non-isotropic polarisability (i.e.
molecule must not be spherically
symmetric like CH 4 , SF 6 , etc.)
– Polarizability may be different when
the field is applied (a) parallel or (b)
perpendicular to the molecular axis:
127
Rotational Raman spectroscopy (II)
Distortion induced in a molecule by
an applied electric field returns to its
initial value after a rotation of only
180 °
– twice a revolution.
Therefore for Rotational energylevels in Raman:
– ∆J = ± 2
128
Rotational Raman (II)
All linear molecules and diatomics (whether homonuclear or
heteronuclear) have anisotropic polarizabilities:
– ⇒ are rotationally Raman active.
Rotational Raman spectroscopy can be used to study many of the
molecules that are inaccessible to microwave spectroscopy:
– E.g. N2. O2….etc..
Spherical rotors such as CH4 and SF6, however, are rotationally
Raman inactive as well as microwave inactive
– This inactivity does not mean that such molecules are never found in
rotationally excited states.
– Molecular collisions do not have to obey such restrictive selection rules, and
hence collisions between molecules can result in the population of any
rotational state.
8/14/2019 3rd Year Spectroscopy
http://slidepdf.com/reader/full/3rd-year-spectroscopy 33/36
33
129
Rotational Raman (I)
The rotational energy levels of
a linear rotor and thetransitions allowed by the ∆J =
± 2 Raman selection rules.
Relative intensities determined
by Boltzmann distribution:
( ) J J J
/kT
n g eε −
∝
130
Example: CO 2 Pure Rotational Raman
CO2 rotation is Raman active:
– ~ 20 absorption lines are visible oneither side of the Rayleigh scattering
peak
– Max.intensity for J=7 → J=9.
– The ∆J = +2 and ∆J = -2 are nearly
equal in intensity
Very near high intensity peak of
exciting radiation.
Very high resolution
spectrometers:– Filter out Rayleigh light.
131
Vibrational Raman Spectroscopy
Is it Heroin? Is it Cocaine? Is it MDMA?
0
2500
5000
7500
500 600 700 800 900 1000 1100Raman shift, cm
-1
I n t e n s i t y
( a r b . u n i t s )
MDMA
Heroin
Cocaine
132
Raman of Cocaine.HCl & crack cocaine
Raman can
discriminate cocaine
and free base in <5
seconds.
Forensics lab method
takes ~several
hours…..

8/14/2019 3rd Year Spectroscopy
http://slidepdf.com/reader/full/3rd-year-spectroscopy 34/36
34
133
Advantages of Raman spectroscopy
Light does not have to pass through sample:
– Allows facile analysis of wide variety of materials.– NO SAMPLE PREPARATION .
Spectra are unique so can be used to ID materialsconclusively (high specificity).
Non-destructive analysis on the nm to nm scale.
Can analyse aqueous solutions easily.
Operates in UV-VIS-NIR region of EM spectrum:
– Simple optics, fibre probes, microscopy, etc.
Fast….analyses in ~1 second or less are possible.
134
Drawbacks of Raman spectroscopy
Inherently very weak:
– Billion of photons in…..maybe one back with information.
Coloured samples can absorb laser light & burn:
– Particularly bad for FT-Raman, λ ex = 1064 nm.
Fluorescence of sample can obscure Raman data:
– Many materials are naturally fluorescent.
– Fluorescence more efficient than Raman.
Instrumentation more expensive than FT-IR.
135
Raman vs. IR spectroscopy
How do the 2 different vibrational techniques compare?
How do the selection rules work in practice for
polyatomic molecules?
– Changes in polarizability vs. dipole?
What are the advantages/disadvantages?
– Which samples work best?
How can we use the techniques for advanced studies?
136
Raman vs IR; case 1 --- CHCl 3
Which is which?
– Go back to fundamentals.
Very similar:
– Why?
Differences?– Selection rules…

8/14/2019 3rd Year Spectroscopy
http://slidepdf.com/reader/full/3rd-year-spectroscopy 35/36
35
137
Ethanol (C 2 H 5 OH)
O-H
stretch
O-H
bend
Scales not exact match
Polar groups givestrongIR bands….weaker inRaman
Different selectionrules
Data from: ww.aist.go.jp/RIODB/SDBS
Weak O-H bands
mean can use OHcontaining solvents
138
2,4-Pentanedione
IR-Absorption RamanCH
3
CCH
2
CCH
3
O O
WeakC-H
StrongC-H
WeakC=O
StrongC=O
Data from: ww.aist.go.jp/RIODB/SDBS
139
Octane: CH 3 -(CH 2 ) 6 -CH 3
C-H stretch
Data from: ww.aist.go.jp/RIODB/SDBS
Raman
140
Spectral Ranges
IR is usually limited to the window materials used:
– KBr, CsI, NaCl.
– Can’t measure very weak vibrations (<400-600 cm-1).
Cataliotti et al. Phys. Chem. Chem. Phys. 4, 2774-2779, (2002).
Raman mainly operates in visible EM region:
– Optics transparent in 0 - 4000 cm-1 range– Use good optical filters…
– Can measure down to ~ 5 cm-1.
– Materials characterisation
8/14/2019 3rd Year Spectroscopy
http://slidepdf.com/reader/full/3rd-year-spectroscopy 36/36
36
141
IR versus Raman: comparison
Better (200-4000 cm-1)Typically (600-4000 cm-1) Normal Spectral
range
Very weak GoodSensitivity
Any regionIR region of spectrumWavelength
Very weak scatteringVery strong absorptionWater
Non-polar molecules (e.g. N2)Polar molecules (e.g. HCl)Good for
Change in polarizabilityChange in Dipole momentSelection rule
RamanIR-absorption
142
Applications in Microscopy
Can use IR and Raman in microscopy:
IR radiation = long wavelength = large spot size:– In practice spot ~10 µm
UV-Vis = shorter wavelength = smaller spot size:
– For 488 nm excitation, spot < 1 µm
Water is a weak Raman scatterer:
– Can use Raman for analysis of cells & tissue.
– Can do aqueous vibrational spectroscopy.
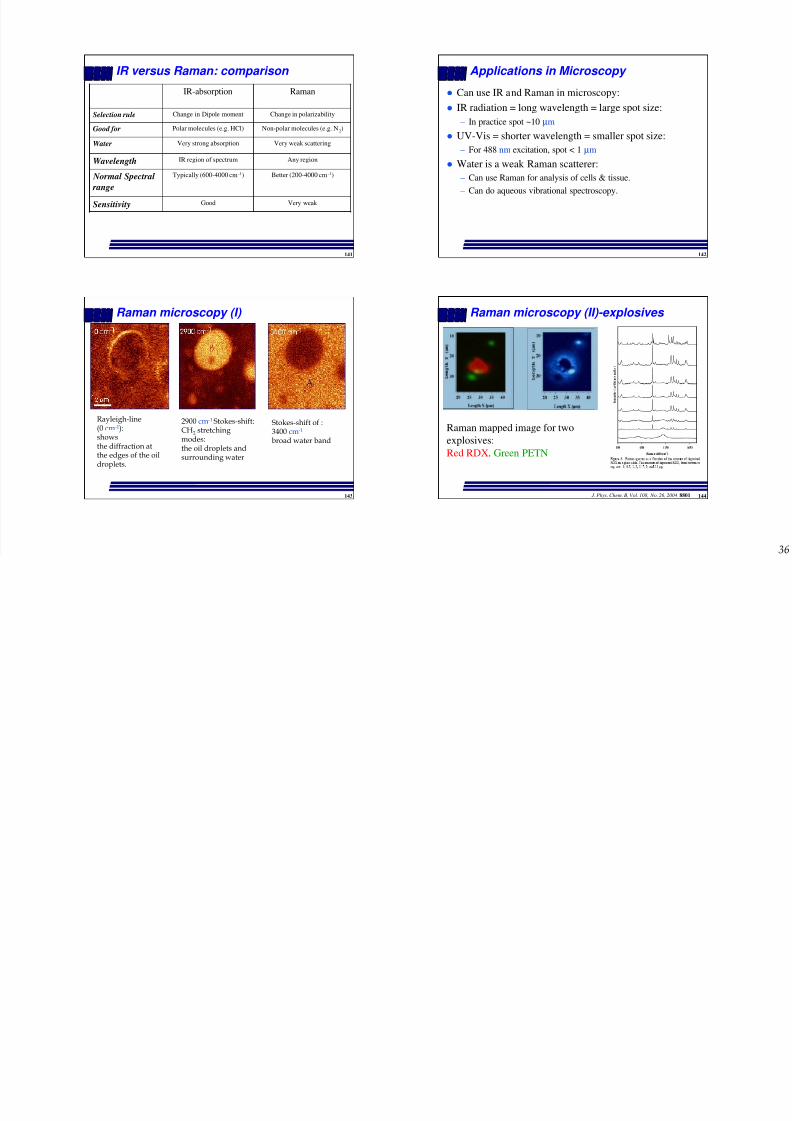
143
Raman microscopy (I)
Stokes-shift of :3400 cm-1
broad water band
2900 cm-1 Stokes-shift:CH2 stretchingmodes:the oil droplets andsurrounding water
Rayleigh-line(0 cm-1):showsthe diffraction atthe edges of the oildroplets.
144
Raman microscopy (II)-explosives
J. Phys. Chem. B, Vol. 108, No. 26, 2004 8801
Raman mapped image for two
explosives:
Red RDX. Green PETN