3rd Astana M&M International Congress -...
17
3 rd Astana M&M International Congress William Husband Head of Metals and Mining Russia and CIS
Transcript of 3rd Astana M&M International Congress -...

3rd Astana M&M International Congress
William Husband
Head of Metals and Mining
Russia and CIS

Kazakhstan is Well Positioned to Continue M&M Industry Growth
One of the most promising Metals & Mining geographies globally
- 2nd largest uranium reserves in the world
- More than 10% of global copper and iron reserves
- More than 13% of global lead and zinc reserves
- About 30% and 25% of global reserves of chromium and manganese respectively
Kazakhstan‟s Metals & Mining industry produces more than 20% of the country‟s overall industrial output
Higher than 5% real GDP growth is expected over the next 5 years
Kazakhstan‟s Metals & Mining sector has established national champions with the global scale:
- ENRC, the leading producer of marketable iron ore, ferrous alloys, pellets and aluminium
- Kazakhmys, the major copper producer with more than 90% of Kazakhstan‟s copper production
- Kazzinc, the leading zinc producer in Kazakhstan
- KazAtomProm, the leading global producer of uranium and rare metals
The largest foreign companies including Rio Tinto, Glencore, Vale, Mechel and Ivanhoe have been operating in
Kazakhstan for years
1

Kazakhstan Metals & Mining Landscape Having a lot of world class deposits of various metals already in operation, Kazakhstan has enormous exploration
potential through existing and not yet discovered greenfield deposits.
Gold Copper / Zinc Coal Ferroaloys Iron Ore Aluminium Uranium
2
Astana
Akzhal
Aksu Bestobe
Zholymbet
Varvarinskoye
Komarovskoye Elevatornoye Raigorodok Novodneprovskoye
Suzdal Maleevsky
Central Mukur
Ridder-Sokolny Tishinsky Shubinsky
Shaimerden
Kyzyl
Zhomart
South Annensky East North
Stepnoy
Orlovsky Artemyevsky
Mizek
Shatyrkul
Sayak
Abyz
Akbastau
Nurkazgan Molodezhny
Kusheki
Donskoy
Zhairem
Sokolov-Sarbai
Turgai
Shubarkol
Uvanas
Kanzhugan Moinkum
Northern Karamurun Southern Karamurun
Vostok
Voskhod
Irtyshsky
Nikolayevsky
Yubileyno-Snegirikhinsky
Almaty
Bogatyr
Severny Vostochny Vasilkovskoye
Zarechnoe
Akbastau
Akbastau Akdala South Inkai
Karatau
Polymetal CAMMEX Polyus Nordgold
Kazzinc (Glencore) Altynalmas (Ivanhoe) Kazakhmys ENRC Kazatomprom
Mechel
Samruk-Energy / Rusal
Uranium one Cameco
Inkai

‟s Dedicated Global Metals and Mining Team
Australia
South Africa
Russia & CIS
Strib Koster
Managing Director
Chairman of Global Industrials Group
Head of Global Metals & Mining Sector
Japan
India
Europe
North America
Nick Pagden
Managing Director
Asia / China
Richard Zhang
Managing Director
Irackly Mtibelishvily
Managing Director
Brennan Smith
Managing Director
Pramit Jhaveri
Managing Director
Shun Uchikawa
Managing Director
Tom Massey
Managing Director
Jason Johnson
Managing Director
Paul Harris
Managing Director
Citi has an established, highly connected global network of relationship bankers and product specialists to access
decision makers in the Metals & Mining industry and investment community in relevant geographies.
John Messina
Director
Ivan Leung
Director – M&A
Nathan Eldridge
Managing Director – M&A
Sean Wegerhoff
Director
Mark Doller
Director
Eugene Qian
Managing Director
James Hu
Director
Sukbong Kim
Director
Korea
Sumit Parikh
Vice President
Arash Mahdaviani
Director
Mike Cramer
Managing & Senior
Technical Director
Mining Specialist
Jason Hutchings
Managing Director
Christian Hoessrich
Director
Richy Xie
Director
William Husband
Director
Asif Zaidi
Managing Director
3

Citi‟s Commitment and Insight into Kazakhstan Long standing commitment to Kazakhstan Major Transactions in Kazakhstan
Citi is the most committed foreign bank in Kazakhstan as evidenced by:
our history of on the ground presence since 1994;
over 120 full time employees in Kazakhstan;
a branch in Astana since 2006;
continuous support to our clients during the economic downturn, and
expansion in Kazakhstan during the Global economic downturn with hiring
new bankers, increasing capitalization of Citibank Kazakhstan to over
US$150mn as of end 2010 and opening of 2 new Representative Offices in
the Caspian region in 2009,
Citi has proven to be the leading arranger of debt financing for Kazakh issuers - Citi
arranged in total more than US$20bn financing for Kazakh clients during 2005-
2011
Citibank Kazakhstan offers a wide range of products and services: from lending,
transaction services, trade finance and foreign exchange – to derivatives, hedging,
capital markets and custody services
Citibank Kazakhstan takes full advantage of Citi‟s unique banking platforms and
global reach and delivers the best-in-class banking service to its clients in
Kazakhstan with a wide range of comprehensive, most innovative and client-
focused financial solutions
Citi has an in-depth market knowledge of Kazakhstan and well-balanced customer
base with over 380 clients
Citibank Kazakhstan has a banking team of 11 Relationship Managers on the
ground in Kazakhstan, who closely cooperate with London-based Investment
Banking, Debt/ Equity Capital Markets, Treasury and other product and industry
teams
Joint Acquisition of
MangistauMunayGas
Advisor to CNPCI
US$2.6bn
2009
CNPC/ KazMunayGas
Development Bank of
Kazakhstan
Lead Arranger, Lender and
Agent
JBIC Buyer‟s Credit Facility
JPY 3.4bn
2009
Halyk Bank
7.25% due 2021
Joint Bookrunner
US$500mn
2011
Samruk-Energy
Balkhash Thermal
Power Plant Project
Financial Advisor
2011
Kazmunaygas
Kazakhstan Caspian
Transportation System Project
Financial Advisor
2009
Zhaikmunai
10.5% due 2015
Joint Bookrunner
US$450mn
2010
Kazmunaygas
7.0% due 2020
Joint Bookrunner
Eurobond
US$1.5bn
2010
Samruk-Kazyna
“People‟s IPO” Project
Lead Financial
Advisor & Coordinator
2011
Acquisition of 50% of CCPL
(formerly Nations Energy)
from CITIC Group
Advisor to KazMunaiGas EP
US$930mn
2007
Acquisition of
Nations Energy
Adviser to CNOOC
US$2.0bn
2006
Kegoc
“People‟s IPO” Project
Financial
Advisor
2012
Zhaikmunai
10.5% due 2015
Consent Solicitation
2012
4

Key Themes in Global Metals and Mining Industry

Current Macro Uncertainty Has Not Diminished Long-term Views
Theme Comments
Increasing Uncertainty
Rising Price Volatility
Macroeconomic uncertainty / heightened market volatility have impacted real commodity demand
Some indication customers have sought to delay shipments of iron ore and copper in response to falling spot prices
Weakening demand has translated into price declines across commodities
Equity prices seem to be leading commodity prices down although some recent bounce-back
Capex Efficiency /
Shareholder Needs
Long dated projects create significant capex requirements
Shareholders want cash returned in short term vs. significant capex needs of miners
Capital deployment to create shareholder value not just volume
Political Risks Growing as
Focus Increases on
Developing Countries
A significant percentage of the growth pipeline is increasingly reliant on higher political risk jurisdictions
Resource nationalism has been on the rise around the world, resulting in increased threats of both taxation and
incremental nationalisations
Supply Chain /
Procurement Issues
Remain Challenging
Demand for equipment / labour has re-created supply shortages
Key suppliers are remaining cautious in outlook
Increasingly sensitive to customer credit profiles, less inclined to supply smaller or weaker customers
Cost Inflation Will Intensify
Pressure on Projects and
Sponsors
Shortages of key inputs, elevated fuel costs and declining grades drive declining efficiency of capital expenditure
Despite capex levels estimated to be ~70% higher than pre-GFC actual mine output still declining given rising input
costs
Rising input costs likely to continue given supply chain lead times and continued megaproject development
Long-Term Outlook
Remains Strong,
Particularly for Supply-
Challenged Commodities
Chinese demand remains strong
Market conviction on long-term strength remains: copper, aluminium, iron ore demand to double over 15-20 years
Confidence in the supercycle remains largely intact
1
2
3
4
5
6
5
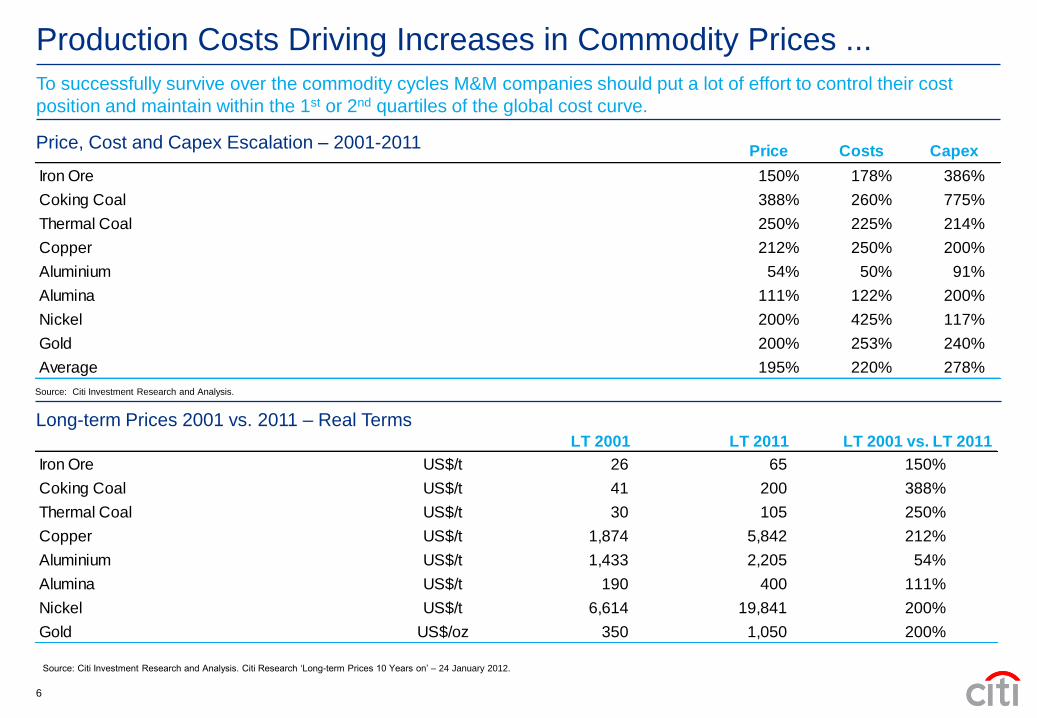
Production Costs Driving Increases in Commodity Prices ...
Price, Cost and Capex Escalation – 2001-2011 Price Costs Capex
Iron Ore 150% 178% 386%
Coking Coal 388% 260% 775%
Thermal Coal 250% 225% 214%
Copper 212% 250% 200%
Aluminium 54% 50% 91%
Alumina 111% 122% 200%
Nickel 200% 425% 117%
Gold 200% 253% 240%
Average 195% 220% 278%
Long-term Prices 2001 vs. 2011 – Real Terms LT 2001 LT 2011 LT 2001 vs. LT 2011
Iron Ore US$/t 26 65 150%
Coking Coal US$/t 41 200 388%
Thermal Coal US$/t 30 105 250%
Copper US$/t 1,874 5,842 212%
Aluminium US$/t 1,433 2,205 54%
Alumina US$/t 190 400 111%
Nickel US$/t 6,614 19,841 200%
Gold US$/oz 350 1,050 200%
Source: Citi Investment Research and Analysis.
Source: Citi Investment Research and Analysis. Citi Research „Long-term Prices 10 Years on‟ – 24 January 2012.
To successfully survive over the commodity cycles M&M companies should put a lot of effort to control their cost
position and maintain within the 1st or 2nd quartiles of the global cost curve.
6

… Without Corresponding Increases in Returns
Project IRR – 2001 vs. 2011
Source: Citi Investment Research and Analysis.
0%
5%
10%
15%
20%
25%
30%
35%
40%
Iron Ore Coking Coal Thermal Coal Copper Aluminium Alumina Nickel Gold
2001 2011
The Long Term commodity prices have on average risen by almost 200% over 2001-2011 period, but IRR for projects
have actually declined on average from 18% to 16%.
7

… and with Significantly Higher Capex Requirements
Going forward, the mining companies are expected to spend more on capex over the next five years then they have
in the past twenty years.
Global capex – Metals and Mining Citi coverage
According to Citi Research calculations, the Return on Incremental Invested Capital (ROIIC) will be significantly below vs. the currently enjoyed by the mining
sector
The mining sector bought earnings momentum through M&A from the period between 2006 and 2008, and the mining sector is now buying earnings
momentum through unprecedented capex spend
Source: Citi Investment Research and Analysis.
0
50,000
100,000
150,000
200,000
1998 1999 2000 2001 2002 2003 2004 2005 2006 2007 2008 2009 2010 2011E 2012E 2013E 2014E
North America Australia Latin America EMEA Asia Europe
8

Company 2009 2010 2011
38.2% 48.4% 44.3%
n/a 43.9% 38.1%
50.4% 59.7% 55.0%
EBITDA margins
Stable Margins but Significant Challenges to Sustain Them Margins for the mining industry peaked around 2006 and have subsequently fallen but have remained relatively
stable. M&M Companies estimate that the returns will continue to be at the current levels in the years to come,
however there are significant factors that might challenge / compress the margins.
Global metals and mining sector margins
Going forward we expect further margin compression coming from higher depreciation costs, higher operating costs, higher oil
prices, higher exchange rates, higher capex costs and higher salaries, all this suggests that margins will continue to come under
pressure
Significant downward
pressure
Source: Citi Investment Research and Analysis.
0%
5%
10%
15%
20%
25%
30%
35%
2000 2001 2002 2003 2004 2005 2006 2007 2008 2009 2010 2011 2012E2013E2014E
EBITDA Margins EBIT Margins
9

Resource Funding of Global M&M Universe

Capital Structure Evolution
Ready Access / Execution Intermediate Access /
Execution
No Access
Life-Cycle Stage Exploration Development Emerging
Producer
Established
Producer
By Market
Equity
Hybrid Capital
Convertible Bond
Bond
Bank - Project
Finance
Bank - Revolving
Credit Facility
Commodity Finance
Transaction Services
10
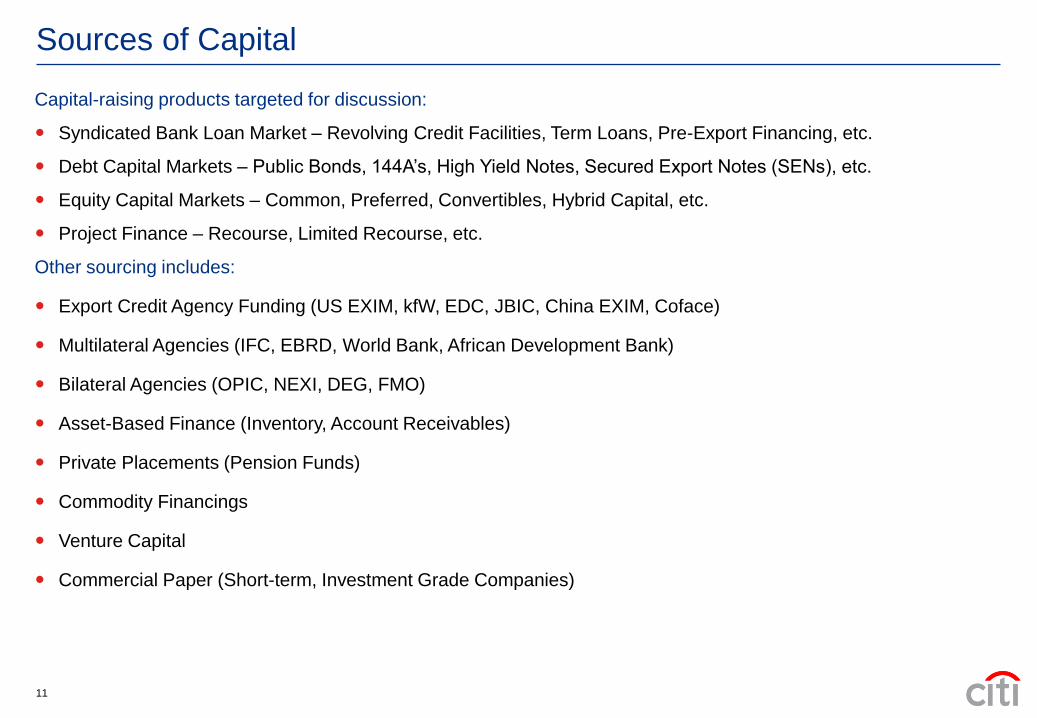
Sources of Capital
Capital-raising products targeted for discussion:
Syndicated Bank Loan Market – Revolving Credit Facilities, Term Loans, Pre-Export Financing, etc.
Debt Capital Markets – Public Bonds, 144A‟s, High Yield Notes, Secured Export Notes (SENs), etc.
Equity Capital Markets – Common, Preferred, Convertibles, Hybrid Capital, etc.
Project Finance – Recourse, Limited Recourse, etc.
Other sourcing includes:
Export Credit Agency Funding (US EXIM, kfW, EDC, JBIC, China EXIM, Coface)
Multilateral Agencies (IFC, EBRD, World Bank, African Development Bank)
Bilateral Agencies (OPIC, NEXI, DEG, FMO)
Asset-Based Finance (Inventory, Account Receivables)
Private Placements (Pension Funds)
Commodity Financings
Venture Capital
Commercial Paper (Short-term, Investment Grade Companies)
11

Situation in The European Banking System
Significant Risk of Global Contagion
682
519
374
189139
9967 53
0
100
200
300
400
500
600
700
800
FRAN GER UK US SPN JPN SWTZ ITLY
Ban
k E
xp
osu
re t
o G
IIP
S, $B
n
Greece
Portugal
Ireland
Spain
Italy
Current Eurozone stress is believed to be putting tremendous funding pressure on European banks, especially those
domiciled in impaired sovereigns
Even in non-breakup scenarios, European banks may need incremental capital of €100-330Bn(1)
In the event of a Eurozone break-up, the impact of incremental FX-linked asset write downs as well as broader economic
spillover effects could cause global financial market distress comparable to the post-Lehman period
A number of European banks could find USD funding challenging – and worse in the event of a break-up
Significant Capital Needs for European Banks
0
70
140
210
280
€350
GRC, IRE,
PORT Banks
ITLY and SPN
Banks
GER, AUS, FIN,
NETHS
Other EM U Banks of
Europe ex EM U
All European
Banks
A. EBA Oct 26 M ark to M arket of sov'n debt
B. Case A + 10% writedown for private exposure to GRC, 5% in IRE and PORT
C. Case B + 1% writedown on exposure to EU private sector ex GRC, IRE, PORT
D. Case C + 10% writedown on sov'n debt of GRC, PORT, IRE, FRAN, ITLY, SPN, BELG
Source: BIS. The data is reported on consolidated foreign claims that are not adjusted for risk mitigants
(guarantees and collateral) vis-à-vis individual countries by nationality of reporting banks. Data as of 06/2011. Source: Source: CIRA, EBA.
(1) Capital estimates are based on the target Core Tier 1 Ratio of 9%.
Historically European banks have been very active in funding of Metals & Mining industry across CIS. However they
now face funding pressure on the back of Eurozone crisis.
12

Russian and Chinese Banks Advancing in Kazakhstan
On the back of European banks‟ problems as well as troubling quality of Kazakh banks‟ assets, Chinese and Russian
banks become more aggressive and increase their presence in Kazakhstan.
Quality of assets in Kazakhstan‟s banking sector, %
0
10
20
30
40
50
60
70
80
90
100
Jan2007
Jan2008
Jan2009
Jan2010
Jan2011
Jan2012
May2012
Standard Doubtful Loss
Kazakhstan‟s banking system faces difficulties with the asset
quality and decreased profitability
Moody‟s outlook on Kazakhstan's banking system remains
negative. The agency says that most of problematic loans are
unlikely to recover and will have to be written off
Kazakh banks' total provisions for loan-loss reserves stood at
32% of gross loans at year-end 2011 and these reserves are
insufficient to cover all expected losses
Kazakhstan‟s authorities are trying to provide support for its
lenders to compete with the local units of foreign banks that
receive funding and balance sheet support from their parent
institutions.
“Foreign banks shouldn‟t control over 30 percent of the
financial services in Kazakhstan”, Mr. Nazarbayev said recently
On the back of Kazakh banks difficulties as well as problems in
Eurozone, Chinese and Russian banks become more
aggressive and increase their presence in Kazakhstan
Russian state-run Sberbank‟s unit became the 6th largest
lender by assets in Kazakhstan with market share of 4.8% as
of May 2012, while it was the 8th largest a year earlier
23.4%
76.6%
Total assets split in Kazakhstan‟s banking system, %
Jan 2010
30.8%
69.2%
Jan 2012
Source: Committee for The Control and Supervision of The Financial Organizations of
The National Bank of The Republic of Kazakhstan. 13
Domestic banks Foreign banks

Disclaimer
© 2012 Citigroup Global Markets Limited. Authorized and regulated by the Financial Services Authority. All rights reserved. Citi and Citi and Arc Design are trademarks and service marks of Citigroup Inc. or its affiliates and are used
and registered throughout the world.
IRS Circular 230 Disclosure: Citigroup Inc. and its affiliates do not provide tax or legal advice. Any discussion of tax matters in these materials (i) is not intended or written to be used, and cannot be used or relied
upon, by you for the purpose of avoiding any tax penalties and ( ii) may have been written in connection with the "promotion or m arketing" of any transaction contemplated hereby ("Transaction") . Accordingly, you
should seek advice based on your particular circumstances from an independent tax advisor.
Any terms set forth herein are intended for discussion purposes only and are subject to the final terms as set forth in separate definitive written agreements. This presentation is not a comm itment to lend, syndicate a financing,
underwrite or purchase securities, or commit capital nor does it obligate us to enter into such a commitment, nor are we acting as a fiduciary to you. By accepting this presentation, subject t o applicable law or regulation, you agree to
keep confidential the information contained herein and the exist ence of and proposed terms for any Transaction.
Prior to entering into any Transaction, you should determine, wi thout reliance upon us or our affiliates, the economic risks and merits (and independently determine that you are able to assume these risks) as well as the legal, tax and
accounting characterizations and consequences of any such Transa ction. In this regard, by accepting this presentation, you ackn owledge that (a) we are not in the business of providing (and yo u are not relying on us for) legal, tax or
accounting advice, (b) there may be legal, tax or accounting ris ks associated with any Transaction, (c) you should receive (and rely on) separate and qualified legal, tax and accounting advice and (d) you should apprise senior
management in your organization as to such legal, tax and accoun ting advice (and any risks associated with any Transaction) and our disclaimer as to these matters. By acceptance of these mate rials, you and we hereby agree that
from the commencement of discussions with respect to any Transac tion, and notwithstanding any other provision in this presentati on, we hereby confirm that no participant in any Transaction sha ll be limited from disclosing the U.S. tax
treatment or U.S. tax structure of such Transaction.
We are required to obtain, verify and record certain information that identifies each entity that enters into a formal business relationship with us. We will ask for your complete name, stree t address, and taxpayer ID number. We may
also request corporate formation documents, or other forms of id entification, to verify information provided.
Any prices or levels contained herein are preliminary and indica tive only and do not represent bids or offers. These indications are provided solely for your information and consideration, ar e subject to change at any time without notice
and are not intended as a solicitation with respect to the purch ase or sale of any instrument. The information contained in thi s presentation may include results of analyses from a quantitati ve model which represent potential future
events that may or may not be realized, and is not a complete an alysis of every material fact representing any product. Any est imates included herein constitute our judgment as of the date he reof and are subject to change without
any notice. We and/or our affiliates may make a market in these instruments for our customers and for our own account. Accordi ngly, we may have a position in any such instrument at any time.
Although this material may contain publicly available informatio n about Citi corporate bond research, fixed income strategy or e conomic and market analysis, Citi policy (i) prohibits employees from offering, directly or indirectly, a
favorable or negative research opinion or offering to change an opinion a s consideration or inducement for the receipt of business or for compensation; and (ii) prohibits analysts from being compensate d for specific recommendations
or views contained in research reports. So as to reduce the pot ential for conflicts of interest, as well as to reduce any appea rance of conflicts of interest, Citi has enacted policies and procedures designed to limit communications
between its investment banking and research personnel to specifi cally prescribed circumstances.


![New E-Books January 2016 - European University Institute · # 59 The burdens of empire [electronic resource] : 1539 to the present / Anthony Pagden Pagden, Anthony Cambridge : Cambridge](https://static.fdocuments.net/doc/165x107/5ec0d2bb16a9b179cf12bf2d/new-e-books-january-2016-european-university-institute-59-the-burdens-of-empire.jpg)
![[Anthony Pagden (Ed.)] the Languages of Political](https://static.fdocuments.net/doc/165x107/54509996af795903098b4dba/anthony-pagden-ed-the-languages-of-political.jpg)