3Q15 Earnings Release
24
JBS S.A. (BVM&FBOVESPA: JBSS3; OTCQX: JBSAY) São Paulo, November 11 th , 2015 JBS reports Net Income of R$3.4 billion and Sales of R$43.0 billion in 3Q15 JBS reports net income of R$3.4 billion in the third quarter of 2015 (3Q15) equivalent to R$1.19 per share. Adjusted Net Income in the period was R$4.2 billion, considering goodwill amortization of R$805.3 million at Parent Company and at JBS Foods which is non cash. Net sales totaled R$43.0 billion, an increase of 39.8% compared with 3Q14. “We had a quarter of sustainable sales growth, consistent operating results and robust cash generation and net income”, stated Wesley Batista, Global CEO of JBS. “We have great confidence in our global food production platform which is being boosted by stronger an increased value added product portfolio and with well recognized brands. We envisage several opportunities to expand our business in the prepared foods and value added segment. To achieve this goal, we will continue to invest in high quality products, innovation and brands”, concluded Wesley Batista. 3Q15 Results
Transcript of 3Q15 Earnings Release

JBS S.A. (BVM&FBOVESPA: JBSS3; OTCQX: JBSAY) São Paulo, November 11th, 2015
JBS reports Net Income of R$3.4 billion
and Sales of R$43.0 billion in 3Q15
JBS reports net income of R$3.4 billion in the third quarter of 2015 (3Q15) equivalent to
R$1.19 per share. Adjusted Net Income in the period was R$4.2 billion, considering
goodwill amortization of R$805.3 million at Parent Company and at JBS Foods which is
non cash. Net sales totaled R$43.0 billion, an increase of 39.8% compared with 3Q14.
“We had a quarter of sustainable sales growth, consistent operating results and robust
cash generation and net income”, stated Wesley Batista, Global CEO of JBS.
“We have great confidence in our global food production platform which is being
boosted by stronger an increased value added product portfolio and with well
recognized brands. We envisage several opportunities to expand our business in the
prepared foods and value added segment. To achieve this goal, we will continue to
invest in high quality products, innovation and brands”, concluded Wesley Batista.
3Q15 Results

3,617.9 3,833.9
11.8%8.9%
3Q14 3Q15
5,560.56,245.4
18.1%14.5%
3Q14 3Q15
30,778.6
43,028.9
3Q14 3Q15
JBS posted net income of R$3.4 billion, equivalent to R$1.19
per share. Adjusted net income was R$4.2 billion in 3Q15.
Consolidated EBITDA (R$ Million)
Consolidated Net Revenue (R$ Million) Consolidated Gross Profit (R$ Million)
Consolidated Net Income (R$ Million)
EBITDA margin (%) Earnings per share (R$)
Gross margin (%)
Net revenue in the period was R$43.0 billion, which
represents an increase of 39.8% compared with 3Q14.
Gross profit in 3Q15 was R$6.2 billion, 12.3% higher than
the same period last year.
EBITDA in 3Q15 was R$3.8 billion, an increase of 6.0%
over 3Q14. EBITDA margin was 8.9%.
3Q15 Highlights
39.8%12.3%
6.0%1,092.9
3,441.4
0.38
1.19
3Q14 3Q15
4,246.7
Adjusted
net
income
Reported net income
288.6%

25,848.3
41,707.1
2.54x 2.55x
3Q14 3Q15
3,015.2
12,415.1
3Q14 3Q15
In 3Q15, the Company generated net operating cash of R$12.4 billion, an
increase of 311.7% in relation to 3Q14. Free Cash Flow Generation was R$5.1
billion, after paying approximately R$6.0 billion for Moy Park at the end of the
quarter.
JBS ended 3Q15 with net debt of R$41.7 billion. Net debt translated to
US dollars was US$10.5 billion at the end of 3Q15, stable when
compared with 3Q14.
Leverage at the end of this quarter was 2.55x. Including proforma results
from Moy Park and other recent acquisitions, leverage was 2.32x.
Net Debt (R$ Million) and Leverage
Free Cash Flow Generation (R$ million)Net Operating Cash Generation (R$ Million)
Net Debt (US$ Million)
311.7%
Leverage
3Q15 Highlights
137.8%
2.32x
Adjusted Leverage¹
Note 1: Adjusted leverage including the proforma results of Tyson in Brazil and Mexico, Céu Azul, Primo and Moy Park.
10,546.0 10,497.9
3Q14 3Q15
2,130.5
5,066.2
3Q14 3Q15

7.1% 6.9% 6.6%
8.4%11.8% 9.6%
8.2%9.2% 8.9%
Net Revenue and EBITDA Evolution
EBITDA Margin (%)EBITDA (R$ million)Net revenue (R$ million)
Highlights
LTM, JBS reached R$150.1 billion in net revenue with EBITDA of
R$13.5 billion, equivalent to an EBITDA margin of 9.0%.
Consistent results with sustainable growth, thanks to geographic and
product diversification, including various proteins and a range of value
added products as well as access to a global costumer base.
Updating the results using FX at the end of 3Q15 and adding proforma
results from recent acquisitions, LTM net revenue reached R$204.2 billion
with LTM EBITDA of R$18.0 billion
24,222 27,222 26,419 28,969 30,77934,303 33,819
38,90543,029
1,710 1,874 1,750 2,4333,618 3,290 2,758 3,577 3,834
3T13 3T13 4T13 4T13 1T14 1T14 2T14 2T14 3T14 3T14 4T14 4T14 1T15 1T15 2T15 2T15 3T15 3T153Q13 4Q13 1Q14 2Q14 3Q14 4Q14 1Q15 2Q15 3Q15
% of Total Revenue
Production Footprint
Note 1. Revenues by region includes domestic sales and imports.
Revenue Breakdown by Region

3,376.8
5,012.2
3Q14 3Q15
2,268.02,112.5
3Q14 3Q15
937.8785.4
3Q14 3Q15
5,849.3 5,750.9
3Q14 3Q15
6,470.5
7,146.9
3Q14 3Q15
JBS USA Beef (Including Canada and Australia)
JBS Mercosul
JBS USA Chicken – Pilgrim’s Pride (PPC)
JBS USA Pork
In 3Q15, JBS Mercosul had net revenue of R$7.1
billion, an increase of 10.5% compared to 3Q14.
EBITDA in the quarter was R$640.8 million, an
increase of 15.5% over 3Q14. EBITDA margin was
9.0%.
JBS Foods
Net Revenue (R$ million) EBITDA (R$ million) and Margin (%)
In 3Q15, JBS Foods net revenue reached R$5.0
billion, an increase of 48.4% over 3Q14.
EBITDA in the quarter was R$1,040.0 million, 80.5%
higher than 3Q15. EBITDA margin was 20.7%.
Net Revenue (R$ million) EBITDA (R$ million) and Margin (%)
Net Revenue (US$ million) EBITDA (US$ million) and Margin (%)
Net Revenue (US$ million) EBITDA (US$ million) and Margin (%)
Net Revenue (US$ million) EBITDA (US$ million) and Margin (%)
In 3Q15, JBS USA Beef posted net revenue of
US$5.8 billion, a decrease of 1.7% over 3Q14.
EBITDA in the quarter was US$196.8 million, a
decrease of 61.0% over 3Q14. EBITDA margin was
3.4%.
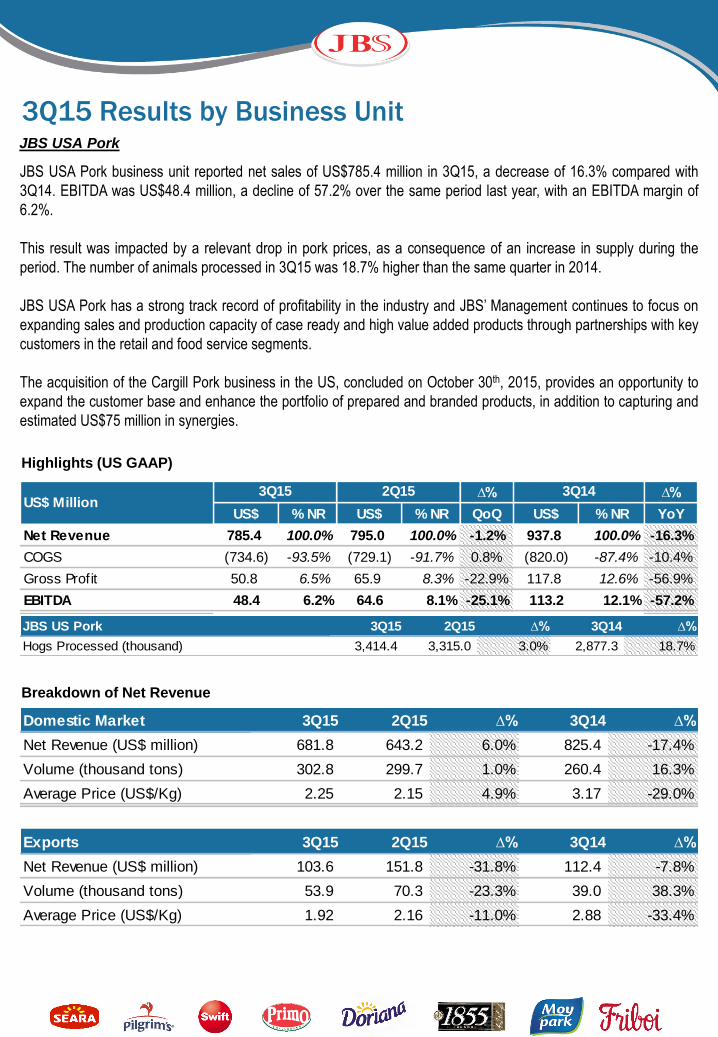
In 3Q15, JBS USA Pork net revenue was US$785.4
million, a decrease of 16.3% in relation to 3Q14.
EBITDA was US$48.4 million in the quarter, 57.2%
lower than 3Q14. EBITDA margin was 6.2%.
In 3Q15, PPC reported net revenue of US$2.1 billion,
reduction of 6.9% in relation to 3Q14.
EBITDA in the period was US$274.3 million, 37.0%
lower than 3Q14. EBITDA margin was 13.0%.
48.4%
10.5%
-1.7%
-16.3%
-6.9%
3Q15 Highlights by Business Units
576.0
1,040.017.1%
20.7%
3Q14 3Q15
554.6 640.8
8.6%9.0%
3Q14 3Q15
504.9
196.8
8.6%
3.4%
3Q14 3Q15
113.2
48.4
12.1%
6.2%
3Q14 3Q15
435.4
274.3
19.2%13.0%
3Q14 3Q15

Analysis of the main financial indicators of JBS by Business Unit (in local currency)
Performance by Business Unit
3Q15 Consolidated Results
Million 3Q15 2Q15 ∆% 3Q14 ∆%
Net Revenue
JBS Foods R$ 5,012.2 4,459.6 12.4% 3,376.8 48.4%
JBS Mercosul R$ 7,146.9 7,205.4 -0.8% 6,470.5 10.5%
JBS USA Beef US$ 5,750.9 5,941.9 -3.2% 5,849.3 -1.7%
JBS USA Pork US$ 785.4 795.0 -1.2% 937.8 -16.3%
JBS USA Chicken US$ 2,112.5 2,053.9 2.9% 2,268.0 -6.9%
EBITDA
JBS Foods R$ 1,040.0 789.4 31.7% 576.0 80.5%
JBS Mercosul R$ 640.8 376.8 70.1% 554.6 15.5%
JBS USA Beef US$ 196.8 228.5 -13.9% 504.9 -61.0%
JBS USA Pork US$ 48.4 64.6 -25.1% 113.2 -57.2%
JBS USA Chicken US$ 274.3 425.8 -35.6% 435.4 -37.0%
EBITDA Margin
JBS Foods % 20.7% 17.7% 3.05 p.p. 17.1% 3.69 p.p.
JBS Mercosul % 9.0% 5.2% 3.74 p.p. 8.6% 0.39 p.p.
JBS USA Beef % 3.4% 3.8% -0.42 p.p. 8.6% -5.21 p.p.
JBS USA Pork % 6.2% 8.1% -1.96 p.p. 12.1% -5.90 p.p.
JBS USA Chicken % 13.0% 20.7% -7.75 p.p. 19.2% -6.21 p.p.

Consolidated analysis of the main operational indicators of JBS
Net Revenue
JBS consolidated net revenue in 3Q15 totaled R$43,028.9 million, an increase of R$12,250.4 million or 39.8% above
3Q14.
The business units that reported sales growth in 3Q15 were JBS Foods, which registered 48.4%, and JBS Mercosul,
with 10.5% growth compared to 3Q14.
In 3Q15, approximately 69% of JBS global sales were came from the markets where the company operates and
31% through exports.
3Q15 Consolidated Results
∆% ∆%
R$ million R$ MM % NR R$ MM % NR 3Q15 vs 2Q15 R$ MM % NR 3Q15 vs 3Q14
Net Revenue 43,028.9 100.0% 38,905.4 100.0% 10.6% 30,778.6 100.0% 39.8%
Cost of Goods Sold (36,783.5) -85.5% (33,032.6) -84.9% 11.4% (25,218.1) -81.9% 45.9%
Gross Income 6,245.4 14.5% 5,872.7 15.1% 6.3% 5,560.5 18.1% 12.3%
Selling Expenses (2,400.4) -5.6% (2,205.7) -5.7% 8.8% (1,744.4) -5.7% 37.6%
General and Adm. Expenses (1,023.3) -2.4% (942.6) -2.4% 8.6% (787.8) -2.6% 29.9%
Net Financial Income (expense) 2,652.6 6.2% (2,300.5) -5.9% - (978.7) -3.2% -
Equity in earnings of subsidiaries 16.5 0.0% 7.7 0.0% 115.0% 8.2 0.0% 99.8%
Other Income (expense) 47.6 0.1% (4.2) 0.0% - (241.4) -0.8% -
Operating Income 5,538.5 12.9% 427.5 1.1% 1195.5% 1,816.4 5.9% 204.9%
Income and social contribution taxes (1,980.4) -4.6% (175.3) -0.5% 1029.8% (588.4) -1.9% 236.6%
Participation of non-controlling shareholders (116.6) -0.3% (172.1) -0.4% -32.2% (135.2) -0.4% -13.7%
Net Income (Loss) 3,441.4 8.0% 80.1 0.2% 4194.7% 1,092.9 3.6% 214.9%
Adjusted EBITDA 3,833.9 8.9% 3,577.1 9.2% 7.2% 3,617.9 11.8% 6.0%
Net Income per share (R$) 1.19 0.03 4186.7% 0.38 215.2%
3Q15 2Q15 3Q14

EBITDA
EBITDA for the quarter was R$3,833.9 million, an increase of 6.0% compared with 3Q14, with an EBITDA margin of
8.9%. This result was driven by a strong growth in EBITDA at JBS Foods and JBS Mercosul, which recorded an
increase of 80.5% and 15.5%, respectively, when compared with 3Q14.
Net Financial Results
JBS registered net financial income of R$2,652.6 million in 3Q15. Expense from FX variation was R$6,074.7 million,
while derivative results which include expenses related to the Company’s instruments to protect its balance sheet
from FX variation, amounted to a positive R$9,455.7 million. Interest expense was R$948.3 million, while interest
revenue was R$266.5 million. Taxes, contributions, tariffs and others resulted in an expense of R$46.7 million.
Income Tax and Social Contribution
In 3Q15, income tax and social contribution (IT/SC) were R$1,980.4 million, equivalent to an effective tax rate of
35.8%.
Current income taxes were R$698.2 million, while deferred income taxes were R$1,282.2 million.
Net Income
Net income in 3Q15 was R$3,441.4 million, equivalent to R$1.19 per share (EPS).
Adjusted net income was R$4,246.7 million in the quarter, excluding the portion of deferred income tax related to
goodwill amounting to R$805.3 million (R$750.5 million at the parent Company and another R$54.8 million at JBS
Foods) which does not represent a cash disbursement.
CAPEX
In 3Q15, total Capital Expenditure (CAPEX) was R$7,348.9 million, of which R$5,353.2 million is related to the
acquisition of Moy Park, including the equity effect from acquired companies. From the remaining balance,
approximately 24% was related to other acquisitions and 76% to maintenance, expansion and facility modernization.
3Q15 Consolidated Results
R$ million 3Q15 2Q15 ∆% 3Q14 ∆%
Net income for the period 3,558.0 252.2 1310.6% 1,228.0 189.7%
Financial income (expense), net (2,652.6) 2,300.5 - 978.7 -
Current and diferred income taxes 1,980.4 175.3 1029.8% 588.4 236.6%
Depreciation and amortization 955.4 839.2 13.8% 611.1 56.4%
Equity in subsidiaries (16.5) (7.7) 115.0% (8.2) 99.8%
Restructuring, reorganization, donations and indemnity 9.1 17.6 -48.2% 220.0 -95.9%
(=) EBITDA 3,833.9 3,577.1 7.2% 3,617.9 6.0%

25,848.3 25,168.733,221.1 34,824.1
41,707.1
2.54x
2.10x2.29x
2.46x 2.55x
3Q14 4Q14 1Q15 2Q15 3Q15
Cash Generation
In 3Q15, JBS generated R$12,415.1 million in net cash from operations. Free Cash Flow after CAPEX was
R$5,066.2 million, after paying approximately R$6.0 billion for Moy Park at the end of the quarter (~US$1.5 billion).
Indebtedness
JBS ended 3Q15 with net debt of R$41,707.1 million and leverage of 2.55x. Including the proforma results of recent
acquisitions, leverage was 2.32x.
Net Debt (US$ million)Net Debt (R$ Million) and Leverage
Leverage
2.32x
Adjusted Leverage¹
Note 1: Adjusted leverage including the proforma results of Tyson in Brazil and Mexico, Céu Azul, Primo and Moy Park.
3Q15 Consolidated Results
R$ million 09/30/15 06/30/15 Var.%
Gross debt 65,715.4 48,731.8 34.9%
(+) Short Term Debt 18,950.2 15,982.6 18.6%
(+) Long Term Debt 46,765.2 32,749.2 42.8%
(-) Cash and Equivalents 24,008.3 13,907.7 72.6%
Net debt 41,707.1 34,824.1 19.8%
Net debt/EBITDA 2.55x 2.46x
10,546.0 9,475.5 10,355.7 11,224.2 10,497.9
3Q14 4Q14 1Q15 2Q15 3Q15

30%
34%
29%
33%
29%
70%
66%
71%
67%
71%
3Q14
4Q14
1Q15
2Q15
3Q15
Short Term Long Term
Indebtedness (cont.)
The Company ended the quarter with R$24,008.3 million in cash. This amount includes the credit facility raised in
September to finance the acquisition of Cargill Pork. This acquisition was concluded on the 30th of October, with the
consequent disbursement of R$5.5 billion. Additionally, JBS USA has a US$1.36 billion fully available unencumbered
line under its revolving credit facilities which, if added to the current cash position, represents 155% of short term
debt.
The percentage of short-term debt (ST) in relation to total debt was 29% at the end of 3Q15.
At the end of the period, 91% of JBS consolidated debt was denominated in U.S. dollars, with an average cost of
4.76% per annum. The proportion of debt denominated in BRL, 9% of the consolidated, carried an average cost of
13.61% per annum.
JBS S.A.41%
JBS Foods11%
JBS USA Holdings
48%
Debt profile ST / LT
US$91%
R$9%
Breakdown by Currency &
Average Cost Breakdown by Company
13.61% p.a.
4.76% p.a.
Breakdown by Source
Capital Markets45.0%
Commercial Banks54.9%
BNDES0.1%
3Q15 Consolidated Results

JBS Foods reported net sales of R$5,012.2 million for the quarter, an increase of 48.4% in relation to 3Q14, as a result of
organic growth and the incorporation of acquired companies. Compared to 2Q15, net sales expanded 12.4%, with growth in the
domestic market and a strong performance in exports, which presented an increment of volume sold in fresh poultry and pork,
combined with higher sales prices due to the exchange rate variation in the period.
In the domestic market, one of the highlights was the fresh poultry sales and volume growth of 83.2% and 97.6%, respectively,
comparing to 3Q14. This was primarily related to the incorporation of Big Frango, Tyson do Brasil and Céu Azul, in addition to
an increase of volume sold of higher value added products, that have a higher degree of practicality and convenience to
consumers. In relation to 2Q15, the fresh poultry segment reported a slight increase in sales, as a result of lower volumes (due
to increased exports), compensated by an increase of 11.1% in sales prices.
In the processed foods segment sales grew by 5.4% in volumes and 7.7% on average prices. In comparison with 2Q15, sales
increased by 6.0% and volume sold by 5.8%, with stable pricing. This demonstrates the Company’s focus on profitability by
managing its product mix, prioritizing the profitability of the business. Despite the high level of promotion in the market during the
quarter, JBS Foods continued to present expansion in market share, a reflection of a consistent strategic discipline in value
creation with the focus on winning over consumer preference with higher quality products, innovation, strong and well-know
brands and consistent evolution of service levels and execution at the point of sale.
The export market posted robust expansion in net sales, 71.1% higher compared with 3Q14. The highlight was the fresh poultry
segment, where sales grew by 88.0%, 41.6% of which from incremental volume and 32.8% from higher sales prices. The fresh
pork segment also posted an increase in sales, primarily due to higher volume sold, while the processed foods segment had
lower volume sold partially compensated by an increase of sales prices of 39.2% in BRL, related to product mix sold and
markets. In the quarter, the main destinations were Middle East, Asia and the Americas.
The Company’s Management restate its commitment with the profitability of this business unit and focus on gaining costumer
preference through quality and innovation of its products, excellence in service levels with the consequent expansion of its
customer base.
Highlights
JBS Foods
3Q15 Results by Business Unit
∆% ∆%
R$ % NR R$ % NR QoQ R$ % NR YoY
Net Revenue 5,012.2 100.0% 4,459.6 100.0% 12.4% 3,376.8 100.0% 48.4%
COGS (3,464.3) -69.1% (3,241.5) -72.7% 6.9% (2,413.9) -71.5% 43.5%
Gross Profit 1,548.0 30.9% 1,218.1 27.3% 27.1% 962.9 28.5% 60.8%
EBITDA 1,040.0 20.7% 789.4 17.7% 31.7% 576.0 17.1% 80.5%
3Q15 2Q15 3Q14R$ Million
JBS Foods 3Q15 2Q15 ∆% 3Q14 ∆%
Birds Processed (thousand) 343,645.6 327,357.5 5.0% 241,167.5 42.5%
Hogs processed (thousand) 1,327.7 1,208.2 9.9% 1,138.5 16.6%

Breakdown of Net Revenue¹
JBS Foods
3Q15 Results by Business Unit
Domestic Market 3Q15 2Q15 ∆% 3Q14 ∆%
Net Revenue (million R$)
Fresh Poultry 755.3 748.0 1.0% 412.3 83.2%
Fresh Pork 86.2 108.7 -20.7% 113.7 -24.1%
Processed / Prepared Products 1,162.0 1,096.0 6.0% 1,024.0 13.5%
Others 49.3 64.2 -23.2% 97.1 -49.2%
TOTAL 2,052.9 2,016.9 1.8% 1,647.1 24.6%
Volume (thousand tons)
Fresh Poultry 141.6 155.9 -9.2% 71.7 97.6%
Fresh Pork 13.9 15.9 -12.9% 15.7 -11.6%
Processed / Prepared Products 177.9 168.1 5.8% 168.8 5.4%
Others - 24.1 - 10.0 -
TOTAL 333.4 364.0 -8.4% 266.2 25.3%
Average Price (R$/Kg)
Fresh Poultry 5.33 4.80 11.1% 5.75 -7.3%
Fresh Pork 6.22 6.82 -8.9% 7.25 -14.2%
Processed / Prepared Products 6.53 6.52 0.2% 6.07 7.6%
Others - 2.67 - 9.70 -
Exports 3Q15 2Q15 ∆% 3Q14 ∆%
Net Revenue (million R$)
Fresh Poultry 2,532.7 2,109.0 20.1% 1,347.0 88.0%
Fresh Pork 328.0 231.9 41.5% 288.7 13.6%
Processed / Prepared Products 98.7 101.8 -3.1% 82.7 19.3%
Others - - - 11.3 -
TOTAL 2,959.4 2,442.7 21.2% 1,729.7 71.1%
Volume (thousand tons)
Fresh Poultry 402.4 366.1 9.9% 284.3 41.6%
Fresh Pork 35.9 28.8 24.8% 31.4 14.5%
Processed / Prepared Products 10.8 11.7 -7.6% 12.6 -14.3%
Others - - - 2.9 -
TOTAL 449.2 406.6 10.5% 331.1 35.6%
Average Price (R$/Kg)
Fresh Poultry 6.29 5.76 9.3% 4.74 32.8%
Fresh Pork 9.13 8.06 13.3% 9.20 -0.8%
Processed / Prepared Products 9.11 8.69 4.8% 6.55 39.2%
Others - - - 3.93 -
Note 1: certain categories were reclassified due to a change in the criteria of classification.

JBS Mercosul had net sales of R$7,146.9 million, 10.5% higher than 3Q14, boosted by higher sales pries compared
to 3Q14, both in the domestic and international markets, compensated by lower volume of fresh beef sold. The
number of livestock processed was 14.3% lower than the same period in 2014.
EBITDA at JBS Mercosul was R$640.8 million, an expansion of 15.5% over 3Q14, due to an improvement in the
gross margin. EBITDA margin was 9.0%. Compared to 3Q15, EBITDA increased 70.1%.
The performance of JBS Mercosul is a result of a better balance between raw material costs and the prices of good
sold.
Exports recovered gradually throughout the year and main destinations were South America, Asia – primarily China –
Middle East, Europe and Russia.
JBS Mercosul
Highlights
3Q15 Results by Business Unit
∆% ∆%
R$ % NR R$ % NR QoQ R$ % NR YoY
Net Revenue 7,146.9 100.0% 7,205.4 100.0% -0.8% 6,470.5 100.0% 10.5%
COGS (5,462.0) -76.4% (5,801.8) -80.5% -5.9% (4,979.2) -77.0% 9.7%
Gross Profit 1,685.0 23.6% 1,403.6 19.5% 20.0% 1,491.3 23.0% 13.0%
EBITDA 640.8 9.0% 376.8 5.2% 70.1% 554.6 8.6% 15.5%
R$ Million3Q15 2Q15 3Q14
JBS Mercosul 3Q15 2Q15 ∆% 3Q14 ∆%
Bovines processed (thousand) 1,986.2 2,165.9 -8.3% 2,316.7 -14.3%

JBS Mercosul
Breakdown of Net Revenue
3Q15 Results by Business Unit
Domestic Market 3Q15 2Q15 ∆% 3Q14 ∆%
Net Revenue (million R$)
Fresh and Chilled Products 2,584.3 3,130.5 -17.4% 2,605.9 -0.8%
Processed Products 389.9 405.1 -3.7% 335.6 16.2%
Others 436.0 521.4 -16.4% 449.0 -2.9%
TOTAL 3,410.2 4,056.9 -15.9% 3,390.5 0.6%
Volume (thousand tons)
Fresh and Chilled Products 264.9 314.2 -15.7% 322.7 -17.9%
Processed Products 44.0 45.9 -4.2% 45.6 -3.5%
Others 151.3 144.0 5.1% 161.3 -6.2%
TOTAL 460.2 504.1 -8.7% 529.6 -13.1%
Average Price (R$/Kg)
Fresh and Chilled Product 9.76 9.96 -2.0% 8.08 20.8%
Processed Items 8.87 8.83 0.5% 7.36 20.5%
Others 2.88 3.62 -20.4% 2.78 3.6%
Exports 3Q15 2Q15 ∆% 3Q14 ∆%
Net Revenue (million R$)
Fresh and Chilled Products 2,172.7 1,982.9 9.6% 1,980.7 9.7%
Processed Products 232.6 254.7 -8.7% 201.1 15.6%
Others 1,331.5 910.7 46.2% 898.1 48.3%
TOTAL 3,736.8 3,148.4 18.7% 3,080.0 21.3%
Volume (thousand tons)
Fresh and Chilled Products 167.0 146.2 14.3% 187.9 -11.1%
Processed Products 18.4 18.7 -1.7% 15.6 18.3%
Others 100.8 57.7 74.8% 74.0 36.4%
TOTAL 286.3 222.6 28.6% 277.4 3.2%
Average Price (R$/Kg)
Fresh and Chilled Beef 13.01 13.56 -4.1% 10.54 23.4%
Processed Beef 12.63 13.60 -7.1% 12.92 -2.2%
Others 13.20 15.79 -16.3% 12.14 8.7%

Net sales at this business unit totaled US$5,750.9 million, a decrease of 1.7% over 3Q14, due to a decline in export
prices, coupled with the devaluation of the Australian dollar against the US dollar. In the domestic markets, volumes
sold increased primarily related to the consolidation of Primo Smallgoods in Australia.
EBITDA was US$196.8 million, 61.0% lower compared with the same quarter last year, with an EBITDA margin of
3.4%. The performance of this business unit reflects a scenario of better stability in the US industry, with softening
cattle prices, after a capacity reduction in the sector and consequent lower beef sales prices, reflecting in higher
imports in the period.
In Australia export volumes declined, reflecting less availability of cattle there. An increase in cattle prices in Australia
has been partially compensated by the devaluation of the Australian dollar. Primo integration is advanced and
management remains positive that the target to capture AU$30 million in synergies in the short term will be reached.
Highlights (US GAAP)
Breakdown of Net Revenue
JBS USA Beef (including Australia and Canada)
3Q15 Results by Business Unit
∆% ∆%
US$ % NR US$ % NR QoQ US$ % NR YoY
Net Revenue 5,750.9 100.0% 5,941.9 100.0% -3.2% 5,849.3 100.0% -1.7%
COGS (5,553.3) -96.6% (5,694.7) -95.8% -2.5% (5,343.0) -91.3% 3.9%
Gross Profit 197.6 3.4% 247.2 4.2% -20.1% 506.3 8.7% -
EBITDA 196.8 3.4% 228.5 3.8% -13.9% 504.9 8.6% -61.0%
3Q15US$ Million
2Q15 3Q14
JBS USA Beef (including AUS and CAN) 3Q15 2Q15 ∆% 3Q14 ∆%
Bovines processed (thousand) 2,426.7 2,422.1 0.2% 2,411.7 0.6%
Domestic Market 3Q15 2Q15 ∆% 3Q14 ∆%
Net Revenue (US$ million) 4,271.1 4,338.4 -1.6% 4,203.8 1.6%
Volume (tons) 985.4 952.3 3.5% 903.3 9.1%
Average Price (US$/Kg) 4.33 4.56 -4.9% 4.65 -6.9%
Exports 3Q15 2Q15 ∆% 3Q14 ∆%
Net Revenue (US$ million) 1,479.8 1,603.5 -7.7% 1,645.5 -10.1%
Volume (tons) 333.6 349.1 -4.4% 332.0 0.5%
Average Price (US$/Kg) 4.44 4.59 -3.4% 4.96 -10.5%
JBS USA Pork business unit reported net sales of US$785.4 million in 3Q15, a decrease of 16.3% compared with
3Q14. EBITDA was US$48.4 million, a decline of 57.2% over the same period last year, with an EBITDA margin of
6.2%.
This result was impacted by a relevant drop in pork prices, as a consequence of an increase in supply during the
period. The number of animals processed in 3Q15 was 18.7% higher than the same quarter in 2014.
JBS USA Pork has a strong track record of profitability in the industry and JBS’ Management continues to focus on
expanding sales and production capacity of case ready and high value added products through partnerships with key
customers in the retail and food service segments.
The acquisition of the Cargill Pork business in the US, concluded on October 30th, 2015, provides an opportunity to
expand the customer base and enhance the portfolio of prepared and branded products, in addition to capturing and
estimated US$75 million in synergies.
JBS USA Pork
3Q15 Results by Business Unit
∆% ∆%
US$ % NR US$ % NR QoQ US$ % NR YoY
Net Revenue 785.4 100.0% 795.0 100.0% -1.2% 937.8 100.0% -16.3%
COGS (734.6) -93.5% (729.1) -91.7% 0.8% (820.0) -87.4% -10.4%
Gross Profit 50.8 6.5% 65.9 8.3% -22.9% 117.8 12.6% -56.9%
EBITDA 48.4 6.2% 64.6 8.1% -25.1% 113.2 12.1% -57.2%
US$ Million3Q15 2Q15 3Q14
Highlights (US GAAP)
JBS US Pork 3Q15 2Q15 ∆% 3Q14 ∆%
Hogs Processed (thousand) 3,414.4 3,315.0 3.0% 2,877.3 18.7%
Breakdown of Net Revenue
Domestic Market 3Q15 2Q15 ∆% 3Q14 ∆%
Net Revenue (US$ million) 681.8 643.2 6.0% 825.4 -17.4%
Volume (thousand tons) 302.8 299.7 1.0% 260.4 16.3%
Average Price (US$/Kg) 2.25 2.15 4.9% 3.17 -29.0%
Exports 3Q15 2Q15 ∆% 3Q14 ∆%
Net Revenue (US$ million) 103.6 151.8 -31.8% 112.4 -7.8%
Volume (thousand tons) 53.9 70.3 -23.3% 39.0 38.3%
Average Price (US$/Kg) 1.92 2.16 -11.0% 2.88 -33.4%
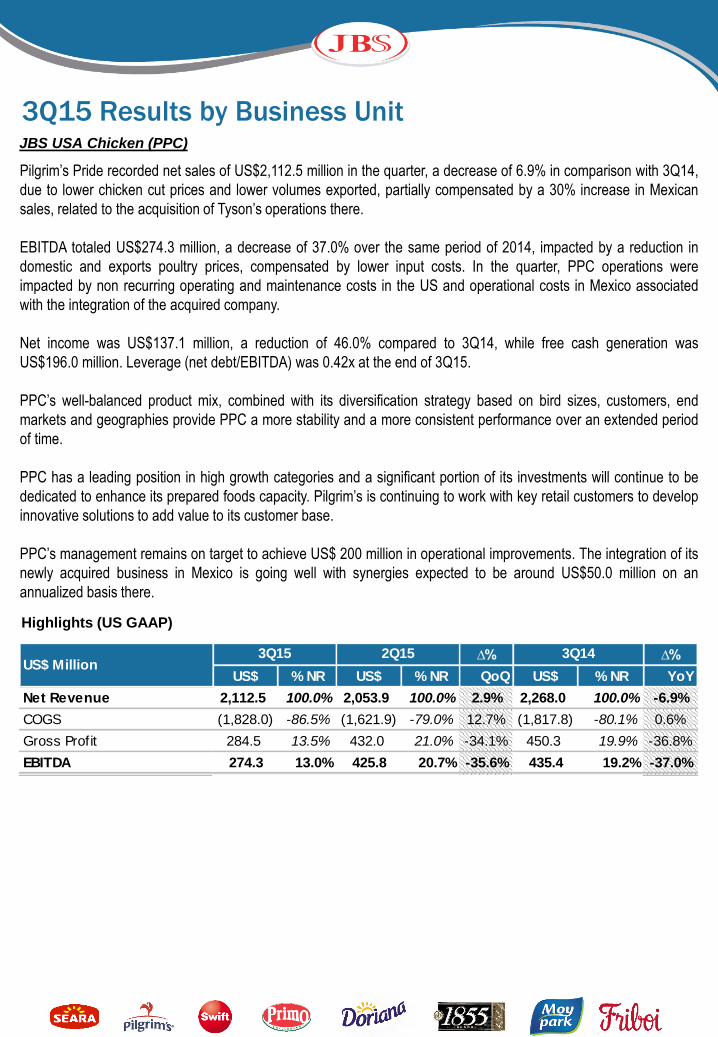
Pilgrim’s Pride recorded net sales of US$2,112.5 million in the quarter, a decrease of 6.9% in comparison with 3Q14,
due to lower chicken cut prices and lower volumes exported, partially compensated by a 30% increase in Mexican
sales, related to the acquisition of Tyson’s operations there.
EBITDA totaled US$274.3 million, a decrease of 37.0% over the same period of 2014, impacted by a reduction in
domestic and exports poultry prices, compensated by lower input costs. In the quarter, PPC operations were
impacted by non recurring operating and maintenance costs in the US and operational costs in Mexico associated
with the integration of the acquired company.
Net income was US$137.1 million, a reduction of 46.0% compared to 3Q14, while free cash generation was
US$196.0 million. Leverage (net debt/EBITDA) was 0.42x at the end of 3Q15.
PPC’s well-balanced product mix, combined with its diversification strategy based on bird sizes, customers, end
markets and geographies provide PPC a more stability and a more consistent performance over an extended period
of time.
PPC has a leading position in high growth categories and a significant portion of its investments will continue to be
dedicated to enhance its prepared foods capacity. Pilgrim’s is continuing to work with key retail customers to develop
innovative solutions to add value to its customer base.
PPC’s management remains on target to achieve US$ 200 million in operational improvements. The integration of its
newly acquired business in Mexico is going well with synergies expected to be around US$50.0 million on an
annualized basis there.
Highlights (US GAAP)
JBS USA Chicken (PPC)
3Q15 Results by Business Unit
∆% ∆%
US$ % NR US$ % NR QoQ US$ % NR YoY
Net Revenue 2,112.5 100.0% 2,053.9 100.0% 2.9% 2,268.0 100.0% -6.9%
COGS (1,828.0) -86.5% (1,621.9) -79.0% 12.7% (1,817.8) -80.1% 0.6%
Gross Profit 284.5 13.5% 432.0 21.0% -34.1% 450.3 19.9% -36.8%
EBITDA 274.3 13.0% 425.8 20.7% -35.6% 435.4 19.2% -37.0%
US$ Million2Q15 3Q143Q15

Table I – 3Q15 Breakdown of Production Costs by Business Unit (%)
Note 1. Considers China and Hong Kong
Graph I - JBS Consolidated Exports Breakdown in 2Q14 and 2Q15
South America16.8%
Greater China¹15.1%
Africa & Middle East12.6%
Mexico12.2%
USA9.5%
Japan9.4%
E.U.5.2%
South Korea4.9%
Russia3.8%
Canada2.1%
Others8.3%
3Q15
US$ 3,941.3
million
Tables and Charts
Greater China¹16.8%
Mexico11.0%
Japan10.9%
South America10.5%
Africa & Middle East10.5%
USA9.5%
Russia9.1%
E.U.6.5%
South Korea4.7%
Canada2.4%
Others8.2%
3Q14
US$4,361.1
million
3Q15 (%) Consolidated JBS Mercosul JBS Foods USA Beef USA Pork USA Chicken
Raw material (livestock) 82.2% 86.8% 66.7% 87.3% 82.1% 56.7%
Processing (including
ingredients and packaging)8.8% 7.4% 21.4% 5.1% 7.6% 25.8%
Labor Cost 9.0% 5.8% 11.9% 7.6% 10.3% 17.5%

Head Office
Avenida Marginal Direita do Tietê, 500
ZIP Code: 05118-100 – São Paulo – SP
Brasil
Phone.: (55 11) 3144-4000
www.jbs.com.br
Investor Relations
Phone.: (55 11) 3144-4224
E-mail: [email protected]
www.jbs.com.br/ir
Indexes
Contact

3Q15 Results

3Q15 Results

3Q15 Results

3Q15 Results
JBS S.A.
(In thousands of Reais)
2015 2014 2015 2014
Cash flow from operating activities
Net income attributable to controlling interest 3,441,410 1,092,885 3,441,410 1,092,885
Adjustments to reconcile net income to cash provided on operating activities
. Depreciation and amortization 170,548 143,404 955,415 611,063
. Allowance for doubtful accounts - - (12,421) (25,436)
. Equity in earnings of subsidiaries (1,142,861) (1,611,957) (16,478) (8,248)
. Loss (gain) on assets sales 1,963 3,404 (44,016) 1,604
. Deferred income taxes 1,260,445 (157,380) 1,282,197 (233,686)
. Current and non-current financial charges 5,750,563 1,853,539 6,549,042 1,980,268
. Provision for lawsuits risk 4,659 3,913 (4,983) (85,730)
9,486,727 1,327,808 12,150,166 3,332,720
Decrease (increase) in operating assets
Trade accounts receivable (101,873) 37,799 348,270 (104,641)
Inventories (491,037) (232,567) (649,060) (816,783)
Recoverable taxes (62,065) (22,830) 2,059 (83,778)
Other current and non-current assets 61,656 (53,184) (399,035) (195,848)
Related party receivable 758,254 923,810 (998,832) 5,488
Biological assets - - (409,783) (127,031)
Increase (decrease) operating liabilities
Trade accounts payable 788,407 26,378 589,949 397,367
Other current and non-current liabilities 433,499 (160,655) 889,340 368,367
Noncontrolling interest - - 116,637 135,155
Valuation adjustments to equity in subsidiaries - - 775,354 104,218
Changes in operating assets and liabilities 1,386,841 518,751 264,899 (317,486)
Net cash provided by operating activities 10,873,568 1,846,559 12,415,065 3,015,234
Cash flow from investing activities
Additions to property, plant and equipment and intangible assets (4,286,036) (451,207) (6,134,012) (878,648)
Decrease (increase) in investments in subsidiaries (1,256,429) 1,482,027 (266) -
Equity effect of acquired company - - (1,214,578) (6,094)
Net cash provided by (used in) investing activities (5,542,465) 1,030,820 (7,348,856) (884,742)
Cash flow from financing activities
Proceeds from loans and financings 398,464 1,420,391 13,284,329 5,961,498
Payments of loans and financings (2,736,076) (2,541,561) (8,891,637) (6,120,629)
Payments of dividends - - (501,758) -
Premium received from share options 1,435 - 1,435 -
Capital transactions - - 7,540 2,763
Shares acquisition of own emission (496,131) - (496,131) -
Net cash provided by (used in) financing activities (2,832,308) (1,121,170) 3,403,778 (156,368)
Effect of exchange variation on cash and cash equivalents - - 1,630,577 306,598
Variance in cash and cash equivalents 2,498,795 1,756,209 10,100,564 2,280,722
Cash and cash equivalents at the beginning of the period 9,322,215 5,511,099 13,907,712 10,297,747
Cash and cash equivalents at the end of the period 11,821,010 7,267,308 24,008,276 12,578,469
Statements of cash flows for the three months period ended on September 30, 2015 and 2014
Company Consolidated

Disclaimer
This release contains forward-looking statements relating to the prospects of the business,
estimates for operating and financial results, and those related to growth prospects of JBS.
These are merely projections and, as such, are based exclusively on the expectations of JBS’
management concerning the future of the business and its continued access to capital to fund
the Company’s business plan. Such forward-looking statements depend, substantially, on
changes in market conditions, government regulations, competitive pressures, the
performance of the Brazilian economy and the industry, among other factors and risks
disclosed in JBS’ filed disclosure documents and are, therefore, subject to change without prior
notice.