
3June 2013, Düsseldorf - Privatkunden: IKB · Market leader in public programmeloan schemes ......
38
3 June 2013, Düsseldorf IKB Deutsche Industriebank AG
Transcript of 3June 2013, Düsseldorf - Privatkunden: IKB · Market leader in public programmeloan schemes ......

3 June 2013, Düsseldorf
IKB Deutsche Industriebank AG

Disclaimer2
This document has been prepared by IKB Deutsche Industriebank AG („IKB“) as an Investor Relation presentation for your information only. Thepresentation is designed to provide an outline of IKB and its business segments for professional and institutional counterparties.
IKB assumes no liability for the accuracy or completeness of any given Balance Sheet or Profit and Loss figures. Please refer to IKB’s annual reports aspublished on our internet website (www.ikb.de) for current and audited financial figures.
This presentation is no substitute for any specific product information or any other information relevant for business purposes. Accordingly IKBexpresses no intent to enter into any contract or even pre-contract negotiation. Hence, IKB assumes no responsibility or liability whatsoever for anyexpense, loss or damage directly or indirectly incurred in connection with the use of this presentation or parts of it.
This presentation may contain forward-looking statements. You are cautioned not to place undue reliance on such statements regarding, e.g.expectations, projections or estimations, because the statements are based on current beliefs and expectations which may transpire as materiallywrong.
This document is copyright protected. It must not be amended or modified. It must not be used for commercial purposes, in whole or in part, without theprior written consent of IKB.
IKB assumes no obligation or guarantee to update this presentation regularly. IKB reserves the right to amend or adjust the presentation or any of itscontent at any time without further notice.

At a Glance3
Focus on Mittelstand companies (SME)
Long-standing, stable client relationships
High lending competence
Market leader in public programme loan schemes
Capital markets and advisory services
„Bank for the Mittelstand“
Financials
1,489 employees (FTE), thereof 420 at IKB Leasing
Locations: Düsseldorf, Berlin, Frankfurt, Hamburg, Munich, Stuttgart; London, Madrid, Milan, Paris
Staff, locations
Founded in 1924
Headquarter in Düsseldorf, Germany
Shareholders: Lone Star: 91.5%, Free float: 8.5%
Financial year: 1 April until 31 March
IKB Deutsche Industriebank AG
Total assets: € 31.1 billion
Group Tier I ratio: 9.4%
SoFFin-guarantees redeemed in full and ahead of time
Key figures per 30 September 2012.

The Business Strategy at a Glance4
Focus on companies of the Mittelstand (SME)
Regional and sectoral client coverage with product competence
Lending only with price and risk discipline
Advisory and capital markets related services
Cost
Business model
Basis
Long-standing client relationships, understanding the needs of the Mittelstand
Ca. 2,500 clients, 18,000 German leasing customers
Ca. 12% market share in relevant KfW public programme loans
Ca. 7% market share in long-term loans to the manufacturing industry
Sustainable cost reductions
EU requirements practically fulfilled
SoFFin guarantees redeemed in full and ahead of time
Capital/Liquidity
Risk
Conservative risk provisioning
Loan book diversified by sector and geography
Low market risk profile
Tier I ratio of 9.4% and overall capital ratio of 13.5% as of 30 September 2012 on Group level
Comfortable liquidity position
Access to the money market via private and corporate customer deposits
Capital market access via secured funding or promissory notes

Well Defined Target Segments*
* excl. Leasing clients
5
Big Enterprises
SME
SME II
LargeSME
Client revenues Banking products
> € 1 billion Complete range of banking products
€ 250 million -€ 1 billion
Broad range of banking products incl. capital markets
€ 50 million -€ 250 million
Advisory, derivatives, acquisition financing, long-term loans
€ 10 million -€ 50 million
Payment processing, long-term loans, overdrafts
IKB’s target clients

Client Focused Coverage6
Principal Loans
Public Programme Loan Schemes
Acquisition Financing
Leasing
Coverage/industry teams
Ca. 40 industry bankers
Corporate finance
Supporting risk management
Three Pillar Client Coverage
Diversified Product Portfolio
Mergers & Acquisitions
Restructuring
Structure/Yield Optimisation
Fund Management
Credit Products Advisory
Equity CM
Debt CM
Derivatives
Syndication
Trading
Securitization
Sales
Capital Markets
Ca. 50 product experts
Support of coverage officers
Ca. 50 German and international coverage officers
Regional Product Industry
Streamlined Client Focus
Clients
Credit Products Capital Markets Advisory
Key Highlights
Focus on clients with annual sales above € 50 million
Phasing out non-target clients
Strengthening industry teams
Expansion of product teams
Regional presence: 6 German and 4 international branches

Lending Business7
CorporateLoans
Existing clients and target clients allow IKB to grow the lending business
Focus on leading and structuring syndicated loans
Complex transactions generate better margins
Selective new business with increasing margin and fee generation
AcquisitionFinancing
IKB is a leading provider of acquisition financing in the German mid-cap market
Structuring, underwriting and syndication of loan volumes up to € 500 million
Public Programme
Loan Schemes
IKB is the leading bank in public programme loan schemes
Close relationships to KfW and the regional development banks
Public programme loan schemes account for roughly one third of new loans
(no funding risk/sometimes credit risk transfer)
Lending Related Fee
Income
Lending related fee income supported by rísing demand for advisory and underwriting services

Refinancing and Liquidity 8
Public programme loan schemes
Channeling loans by KfW,regional development agencies and EIB
Roughly one third of new lending in 2011/12
Protected by Deposit Protection Fund of the Association of German Banks
Promissory note loans: € 3.8 billion
Customer deposits: € 6.8 billion
Othercomponents
Cash securitisation/asset-based funding
Debt Issuance Programme/Senior Unsecured Debt
Selective newbusiness
Stringent criteria for term and profitability
New lending linked to fee income
Structure of funding (as of 31 December 2012)
Open market
operations with ECB
and EUREX
Customer deposits
Promissory notes
Public programme
loansSenior
unsecured bonds
1%
12%
17%
26%
14%
30%
Hybrids, Subordinated, Others

Liquidity Plan9
€ million
Tie-up of liquidity of all assets and liabilities by maturity
Prolongation of customer deposits assumed in the basis scenario
Net liquidity effect of new business and drawing of liquidity
commitments
Modelling of the business loan portfolio (unscheduled repayments,
insolvencies, etc.) based on back-testing
ECB collateral pool
Liquidity plan
-1.500
0
1.500
3.000
4.500
Jun2013
Sep2013
Dec2013
Mar2014
Jun2014
Sep2014
Dec2014
Mar2015
Jun2015
4,500
-1,500
Run-off scenario Basis scenario
3,000
1,500

September 2012
Regulatory Equity Position of IKB Group
* RWA + market risk equivalent + operational risk
10
Core capital ratios
Tier I ratio above statutory requirement (4%)
€ million 30 Sep2012
31 Mar 2012
31 Mar 2011
31 Mar 2010
31 Mar 2009
31 Mar 2008
Tier I 1,594 1,698 2,120 2,257 2,276 1,941
Tier II 704 695 919 1,030 1,245 1,191
Tier III 0 0 0 0 35 45
Deductions -70 -137 -149 -216 -236 -18
Equity 2,228 2,256 2,890 3,071 3,320 3,159
Total RWA* 16,513 17,301 18,221 20,678 26,655 32,394
Tier I ratioin % 9.4 9.4 11.2 10.4 8.1 6.0
Capital ratioin % 13.5 13.0 15.9 14.9 12.5 9.8
Core Tier I3.8%
6.6%
6.0%
9.4%
Hybrids
March 2008

Actively Reduced Risk Exposure11
Value at Risk
- Active reduction after IKB‘s crisis
- Increase due to the financial/government debt crisis
- Current VaR driven by credit spread exposure of liquidityportfolio
Key HighlightsValue at Risk (99% confidence level with a holding period of one day)
Book Value of Portfolio Investments
25.9
43.9
56.150.0
0
25
50
75
31 Mar2010
31 Mar2011
31 Mar2012
30 Sep2012
€ million
€ million
1,352
862692 707
0
500
1000
1500
31 Mar2010
31 Mar2011
31 Mar2012
30 Sep2012
Securitisations ofIKB‘s core business 127
Synthetic CDOs of Lehman (mainly legal risk)
Synthetic CDOs ofCorporates
Rio Debt Holdings
Current Structure of Portfolio Investments
€ million
83
343
154

Risk Costs and Coverage
* NPL ratio: (NPLs + Valuation discount on securities)/credit volume; NLP coverage: (Loan loss charges and provisions + Valuation discount on securities)/NPLs** calculation changed: figures based on the former basis as of 31 March 2010: 7.9% NPL, 48% NPL coverage
12
Provision for possible loan losses NPL ratio and coverage*
Since 2010: Decrease due to the strong economic development,
particularly in Germany and RWA reduction
As of 30 September 2012
- NPLs: € 1,134 million
- Loan loss charges and provisions: € 412 million
- Valuation discount on securities: € 59 million
% %
6.76.0
5.5
4.03.6
4947 47 46
41
0
10
20
30
40
50
60
0
2
4
6
8
10
12
31 Mar2009
31 Mar2010**
31 Mar2011
31 Mar2012
30 Sep2012
NPL ratio NPL coverage
590
494
7926
-26
12
-100
0
100
200
300
400
500
600
700
2008/09 2009/10 2010/11 2011/12 2012/13
FY 6 months
€ million
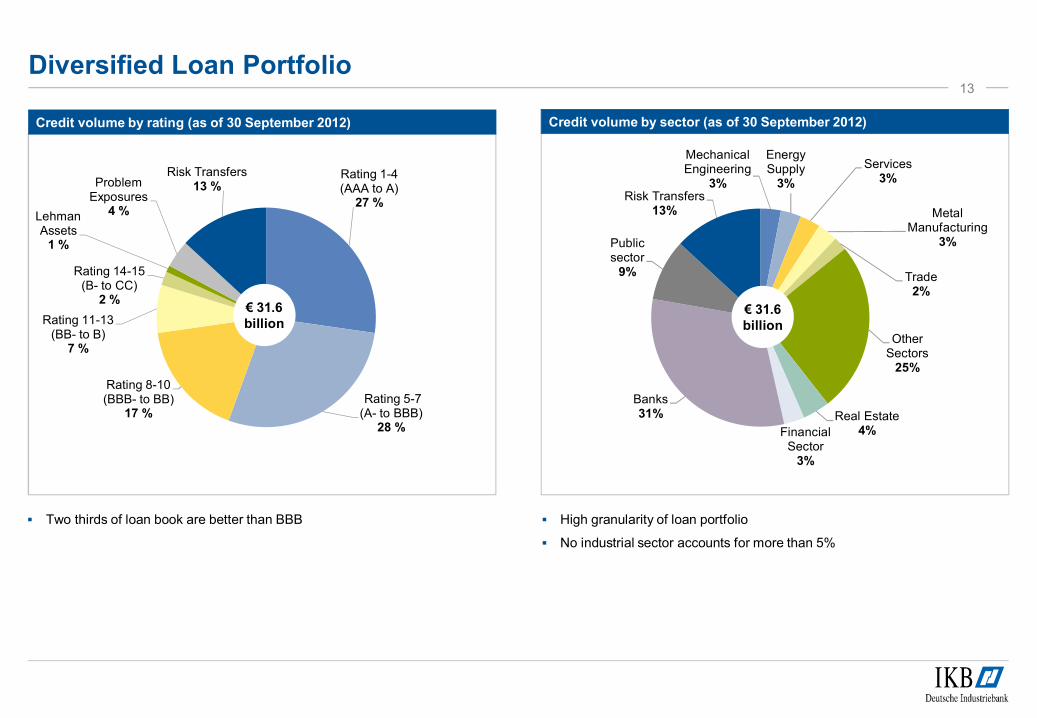
Diversified Loan Portfolio13
Credit volume by rating (as of 30 September 2012) Credit volume by sector (as of 30 September 2012)
Two thirds of loan book are better than BBB High granularity of loan portfolio
No industrial sector accounts for more than 5%
MechanicalEngineering
3%
EnergySupply
3%
Services3%
MetalManufacturing
3%
Trade2%
OtherSectors
25%
Real Estate4%Financial
Sector3%
Banks31%
Publicsector
9%
Risk Transfers13%
€ 31.6billion
Rating 1-4 (AAA to A)
27 %
Rating 5-7 (A- to BBB)
28 %
Rating 8-10 (BBB- to BB)
17 %
Rating 11-13 (BB- to B)
7 %
Rating 14-15 (B- to CC)
2 %
Lehman Assets
1 %
Problem Exposures
4 %
Risk Transfers13 %
€ 31.6billion

Legal Issues14
Damages Claimed
Havenrock I,Havenrock II, Rhinebridge
Legal risks of major portfolio investments settled
Continuing third party indemnification
Special Audit
Assessment whether there is negligence by the former Board of Managing Directors and the
Supervisory Board in connection with the IKB crisis
No direct damage claims
Investors in IKB securities
About 20 individual suits with a volume of ca. € 8 million
Lehman
Settlement of synthetic transactions due to the Lehman insolvency (nominal € 339 million)
Lehman disputes payments waterfall
Timing unclear

Results (IFRS and German GAAP)15
Consolidated net result IKB Group (IFRS) Net result IKB AG (German GAAP: HGB)
-11
-580
-967
21
-517
-312
-78
-2000
-1800
-1600
-1400
-1200
-1000
-800
-600
-400
-200
0
2002007/08 2008/09 2009/10 2010/11 2011/12 2012/13
FY 6 months
(-459)
(-30)
(-327)
-1,761
-861
-349
-190-255
-2000
-1800
-1600
-1400
-1200
-1000
-800
-600
-400
-200
0
2002007/08 2008/09 2009/10 2010/11 2011/12
€ million € million
(161)
thereof extraordi-nary factors (-457)

(29)
33
-52-93 -63
-31
-12
-100
-50
0
50
100
2008/09 2009/10 2010/11 2011/12 2012/13
FY 6 months
Profit Components16
Net interest income Net fee and commission income
Reduced income from equity investments
Increased refinancing costs
Reduced credit volume due to EU requirements
SoFFin fees are fee and commission expenses
€ 340 million SoFFin fees until 30 September 2012
Increase of commission income net of SoFFin expenses
€ million € millionthereof SoFFin fees
(77) (126) (102)
303
179
144 154
8058
0
200
400
2008/09 2009/10 2010/11 2011/12 2012/13
FY 6 months
(5) (55)

New Business with Increased Profit17
€ million
Present value and funding of new business (without leasing))
%
656
318263 292
417 445403
453511
381 351
491535
477
371
581519
7.8
9.0
10.8
8.9
9.6
10.510.9
9.3
10.7 10.5
11.4
12.1
9.2
10.29.9
8.1
10.4
0
2,5
5
7,5
10
12,5
0
250
500
750
Q308/09
Q408/09
Q109/10
Q209/10
Q309/10
Q409/10
Q110/11
Q210/11
Q310/11
Q410/11
Q111/12
Q211/12
Q311/12
Q411/12
Q112/13
Q212/13
Q312/13
New business volume Present value / new business volume
12.5
10.0
7.5
5.0
2.5
0

Administrative Expenses
* FTE as of period end
18
Staff expenses Other administrative expenses
Employees*€ million € million
Reduction of staff since 2007/08 by 25% (excl. Leasing)
New redundancy scheme in 2012: staff reduction of
ca. 200 employees
Hiring of specialists to execute the business model
Process optimisation projects
Legal and consultancy costs
Increasing costs due to new product/team offers
Costs triggered by EU requirements
179164 167 159
81 78
1,718
1,537 1,557 1,516 1,489
0
500
1.000
1.500
2.000
0
100
200
300
2008/09 2009/10 2010/11 2011/12 2012/13
FY 6 months Employees*
196
137154
138
68 68
0
50
100
150
200
250
2008/09 2009/10 2010/11 2011/12 2012/13
FY 6 months
2,000
1,500
1,000
500
0

Volatile Profit Components under IFRS19
-162
45
-305
-11
-282
159
42
-17
29
164
243
4924
-600
-450
-300
-150
0
150
300
2008/09 2009/10 2010/11 2011/12 6 M 2012/13
Net income from financial instruments atfair value
Income from investment securities
Other operating income
131
-599
Valuation gains/losses related to public debt
crisis in the Euro zone
Valuation gains/losses from own liabilities
Positive market value developments and
disposals of portfolio investments
Other Operating Result gains, mainly due to
changed planning (valuation of liabilities)
Valuation of liabilities according to IAS 39 AG8
Important factors€ million

IKB Today – A Strong Franchise20
Decreasing NPL ratio
Structured credit investments limited
Low interest rate, FX and volatility risks
Risks
Long-standing client relationships
Leading position in public programme loan schemes
Increasing strength in mid-cap acquisition financing
Lending
Derivatives and capital markets services
M&A and restructuring advice
More than 50 product specialists
Advisory and Capital Markets
Diversified funding
€ 6.8 billion customer deposits, € 3.8 billion promissory notes
SoFFin guarantees redeemed in full and ahead of time
Sufficient Funding
Broad business expertise
Profound market knowledge
Deep industry insight
Expertise
Ca. 2,500 clients with increasing need for broader product range
Less than 1% of assets of German banks
Ca. 7% market share in long-term loans to the manufacturing industry
Ca. 12% market share in relevant KfW public programme loans
Strong Client Franchise
Tier I ratio of 9.4% on Group level
Tier I ratio of 9.7% on solo level
Solid Capital Base

Outlook21
Focus on SME clients
Increasing revenues
- Profitable new lending business
- Increasing share of advisory, derivative and capital markets revenues
Reducing costs
- Process optimisation
- Reducing complexity
- Sustainable reduction of administrative expenses
- Client coverage integrating regional, sectoral and product competence
Risk management
- Restrictive management of market risks
- Transparency and open culture of communication
- Conservative criteria for new loans

Appendix

Fundamentally Transformed23
Stabilisation
Restructuring
Restoring Profitability
IKB today
2007 2010 20122008 2009 2011 2013 2014
Ring-fencing of structured investments
KfW stabilisation measures
Protecting franchise
Liquidity secured
Secured capital position
Cleaned-up asset base
Improved risk management
EU requirements practically fulfilled
Reduced costs
Realigned business model
Use of market potential
- From credit focus to client focus- Client base in line with potential
Efficient use of resources
- Funding: public programme loan schemes, syndication, deposits, repos
- Capital: securitisation, sale of risk assets, risk transfers to third parties

SoFFin-Guarantee Framework24
5.00
12.00
10.009.80 9.70 9.60 9.50
8.60
7.30
6.10
5.00
4.504.25
4.003.75
1.751.50
0.85 0.750.35
0,000,00
2,50
5,00
7,50
10,00
12,50
Dec2008
Aug2009
Feb2010
Nov2010
Dec2010
Feb2011
Mar2011
Apr2011
Aug2011
Jan2012
Mar2012
Mar2012
May2012
Aug2012
Aug2012
Sep2012
Sep2012
Oct2012
Oct2012
Nov2012
Dec2012
€ billion
early per day of maturity
Rückgaben
Ca. € 343 million fee expenses in total
No restrictions in future due to early and full redemption, regarding:
- Tier I ratio (SoFFin)
- Restriction for repurchase of own liabilities (EU)
- Proprietary trading (EU)
SoFFin returns
12.50
10.00
7.50
5.00
2.50
0

EU Conditions of no further relevance 25
Reduction of total assets to € 33.5 billion
Winding up non-strategic assetsBalance Sheet
Liquidation of IKB Capital Corporation (N.Y.)
Closure of Amsterdam office
Closure of Luxemburg operations
International Operations
Discontinuation of new business
Reduction of portfolio
Closure of real estate related subsidiaries
Real Estate Finance
Limited buyback of own liabilities
Limited proprietary trading
Further Conditions
Reduction of Assets
Winding Up of Certain
Operations
Discontinuation of Operations
Further Restrictions

Consolidated Income Statement HY1 2012/13
* Previous year‘s figures adjusted
26
€ million 1 Apr 2012 –
30 Sep 2012
1 Apr 2011 –
30 Sep 2011*
Change
Net interest income 58.0 79.8 -21.8
Provisions for possible loan losses 11.9 -26.4 38.3
Net interest income after provision for possible loan losses 46.1 106.2 -60.1
Net fee and commission income -12.1 -30.8 18.7
Net income from financial instruments at fair value -11.4 -272.6 261.2
Net income from investment securities 29.1 -9.7 38.8
Net income from investments accounted for using
the equity method 0.7 1.3 -0.6
Administrative expenses 145.9 148.2 -2.3
Personnel expenses 77.6 80.5 -2.9
Other administrative expenses 68.3 67.7 0.6
Net other operating result 24.3 42.0 -17.7
Operating result -69.2 -311.8 242.6
Tax expenses 8.5 0.2 8.3
Consolidated net loss -77.7 -312.0 234.3

Consolidated Income Statement 2011/12
* Previous year‘s figures adjusted
27
€ million 1 Apr 2011 –
31 Mar 2012
1 Apr 2010 –
31 Mar 2011*
Change
Net interest income 153.5 143.6 9.9
Provisions for possible loan losses 26.3 78.8 -52.5
Net interest income after provision for possible loan losses 127.2 64.8 62.4
Net fee and commission income -63.2 -93.0 29.8
Net income from financial instruments at fair value -304.8 45.2 -350.0
Net income from investment securities -16.8 42.3 -59.1
Net income from investments accounted for using
the equity method 0.2 1.6 -1.4
Administrative expenses 297.4 321.3 -23.9
Staff expenses 158.7 167.2 -8.5
Other administrative expenses 138.7 154.1 -15.4
Net other operating result 49.4 242.9 -193.5
Operating result -505.4 -17.5 -487.9
Tax expenses 11.5 -38.8 50.3
Consolidated net loss/profit -516.9 21.3 -538.2

Segment Reporting HY1 2012/13
* Figures adjusted
28
€ million Credit Products Advisory &
Capital Markets
Treasury
and Investments
Head Office/
Consolidation
Total
1 Apr 2012 –
30 Sep 2012
1 Apr 2011 –
30 Sep 2011*
1 Apr 2012 –
30 Sep 2012
1 Apr 2011 –
30 Sep 2011
1 Apr 2012 –
30 Sep 2012
1 Apr 2011 –
30 Sep 2011*
1 Apr 2012 –
30 Sep 2012
1 Apr 2011 –
30 Sep 2011
1 Apr 2012 –
30 Sep 2012
1 Apr 2011 –
30 Sep 2011*
Net interest income 97.9 100.8 0.7 0.9 -14.5 -9.5 -26.1 -12.4 58.0 79.8
Provisions for possible loan losses 10.5 -8.8 0.0 0.0 1.6 -17.2 -0.2 -0.4 11.9 -26.4
Net interest income after provision for possible loanlosses 87.4 109.6 0.7 0.9 -16.1 7.7 -25.9 -12.0 46.1 106.2
Net fee and commission income 4.9 6.1 11.6 16.6 -29.3 -54.5 0.7 1.0 -12.1 -30.8
Net income from financial
instruments at fair value -0.2 0.5 3.0 3.3 11.9 -344.4 -26.1 68.0 -11.4 -272.6
Net income from investment
securities 0.0 0.0 0.0 0.0 29.0 -10.4 0.1 0.7 29.1 -9.7
Net income from investment
securities accounted for using the
equity method 0.7 1.3 0.0 0.0 0.0 0.0 0.0 0.0 0.7 1.3
Administrative expenses 55.6 55.7 32.6 33.5 22.6 28.5 35.1 30.5 145.9 148.2
Other operating result 8.6 4.9 1.4 1.3 5.9 2.2 8.4 33.6 24.3 42.0
Operating result 45.8 66.7 -15.9 -11.4 -21.2 -427.9 -77.9 60.8 -69.2 -311.8
Cost/income ratio in % 49.6 49.0 195.2 151.6 753.3 -6.8 – – 164.7 -78.0
Return on equity in % 15.3 24.3 0.0 0.0 -8.7 -153.9 – – -32.6 -66.1
Average allocated equity 600 548 0 0 488 556 -663 -161 425 943
Credit volume 13,707 14,714 0 0 17,470 17,123 412 169 31,589 32,006
Volume of new business 1,461 1,577 0 0 12 33 0 0 1,473 1,610

Segment Reporting 2011/12
* Figures adjusted
29
€ million Credit Products Advisory & Capital
Markets
Treasury
and Investments
Head Office/
Consolidation
Total
1 Apr 2011 –
31 Mar 2012
1 Apr 2010 –
31 Mar 2011*
1 Apr 2011 –
31 Mar 2012
1 Apr 2010 –
31 Mar 2011
1 Apr 2011 –
31 Mar 2012
1 Apr 2010 –
31 Mar 2011*
1 Apr 2011 –
31 Mar 2012
1 Apr 2010 –
31 Mar 2011*
1 Apr 2011 –
31 Mar 2012
1 Apr 2010 –
31 Mar 2011*
Net interest income 205.6 199.5 1.6 2.9 -19.3 64.5 -34.4 -123.3 153.5 143.6
Provisions for possible loan losses 10.1 23.2 0 0 17.3 52.8 -1.1 2.8 26.3 78.8
Net interest income after provision for possible loanlosses 195.5 176.3 1.6 2.9 -36.6 11.7 -33.3 -126.1 127.2 64.8
Net fee and commission income 9.5 19.5 27.4 8.3 -101.3 -122.6 1.2 1.8 -63.2 -93.0
Net income from financial
instruments at fair value 20.9 -2.1 3.3 23.3 -376.4 -140.7 47.4 164.7 -304.8 45.2
Net income from investment
securities 0 0 0 0 -17.4 42.7 0.6 -0.4 -16.8 42.3
Net income from investment
securities accounted for using the
equity method 0.4 1.7 0 0 0 0 -0.2 -0.1 0.2 1.6
Administrative expenses 117.1 117.8 63.5 70.8 56.0 58.5 60.8 74.2 297.4 321.3
Other operating result 3.3 8.1 2.8 3.0 -13.8 -65.3 57.1 297.1 49.4 242.9
Operating result 112.5 85.7 -28.4 -33.3 -601.5 -332.7 12.0 262.8 -505.4 -17.5
Cost/income ratio in % 48.9 52.0 180.9 188.8 -10.6 -26.4 – – -163.7 84.0
Return on equity in % 20.3 14.8 0 0 -104.4 -51.7 – – -53.6 -1.9
Average allocated equity 555 578 0 0 576 643 -188 -282 943 939
Credit volume* 14,253 15,428 0 0 17,023 16,589 437 58 31,713 32,076
Volume of new business 3,270 3,477 0 0 46 235 0 0 3,316 3,712

Extraordinary Factors of IKB Group HY1 2012/13
• Previous year‘s figures adjusted
30
€ million Unadjusted
Profit & Loss
account
Change
absolute
Thereof extraordinary factors Adjusted
Profit & Loss
account
1 Apr 2012 –
30 Sep 2012
Portfolio
Invest-
ments
Long-term
invest-
ments,
obligations
and
derivatives
Measure-
ment of
liabilities
due to credit
rating
changes
Measure-
ment of
liabilities
according to
IAS 39 AG 8
Other
factors
1 Apr 2012 –
30 Sep 2012
1 Apr 2011 –
30 Sep 2011
Net interest income 58.0 79.8 -21.8 – – – -14.8 – 72.8
Provision for possible loan
losses 11.9 -26.4 38.3 – – – – – 11.9
Net interest income after provision for possibleloan losses 46.1 106.2 -60.1 – – – -14.8 – 60.9
Net fee and commission
income -12.1 -30.8 18.7 – – – – -29.4 17.3
Net income from financial
instruments at fair value -11.4 -272.6 261.2 16.8 -5.0 -23.0 – – -0.2
Income from investment
securities 29.1 -9.7 38.8 3.3 17.1 – – – 8.7
Result of investments
accounted for at equity 0.7 1.3 -0.6 – – – – – 0.7
Administrative expenses 145.9 148.2 -2.3 – – – – 3.0 142.9
Net other operating income 24.3 42.0 -17.7 – – – 10.1 3.2 11.0
Operating result -69.2 -311.8 242.6 20.1 12.1 -23.0 -4.7 -29.2 -44.5
Tax expense 8.5 0.2 8.3 – – – – 4.6 3.9
Consolidated net income/
loss -77.7 -312.0 234.3 20.1 12.1 -23.0 -4.7 -33.8 -48.4

Extraordinary Factors of IKB Group 2011/12
• Previous year‘s figures adjusted
31
€ million Unadjusted
Profit & Loss
account
Change
absolute
Thereof extraordinary factors Adjusted
Profit & Loss
account
1 Apr 2011 –
31 Mar 2012
Portfolio
Invest-
ments
Long-term
invest-
ments and
derivatives
Measure-
ment of
liabilities
due to credit
rating
changes
Measure-
ment of
liabilities
according to
IAS 39 AG 8
Other
factors
1 Apr 2010 –
31 Mar 2011*
1 Apr 2011 –
31 Mar 2012
Net interest income 143.6 153.5 9.9 -30.5 184.0
Provision for possible loan
losses 78.8 26.3 -52.5 26.3
Net interest income after provision for possibleloan losses 64.8 127.2 62.4 -30.5 157.7
Net fee and commission
income -93.0 -63.2 29.8 -102.3 39.1
Net income from financial
instruments at fair value 45.2 -304.8 -350.0 -52.5 -323.8 50.9 20.6
Income from investment
securities 42.3 -16.8 -59.1 -27.1 -3.2 13.5
Result of investments
accounted for at equity 1.6 0.2 -1.4 0.2
Administrative expenses 321.3 297.4 -23.9 10.3 287.1
Net other operating income 242.9 49.4 -193.5 -10.3 65.4 -14.9 9.2
Operating result -17.5 -505.4 -487.9 -89.9 -327.0 50.9 34.9 -127.6 -46.7
Tax expense -38.8 11.5 50.3 11.5
Consolidated net income/
loss 21.3 -516.9 -538.2 -89.9 -327.0 50.9 34.9 -127.6 -58.2

Balance Sheet of IKB Group as of 30 September 201232
ASSETS
€ million
30 Sep
2012
31 Mar
2012
EQUITY AND LIABILITIES
€ million
30 Sep
2012
31 Mar
2012
Cash reserve 78.4 19.1 Liabilities to banks 13,670.6 13,221.8
Loans and advances to banks 2,538.8 3,023.6 Liabilities to customers 10,398.0 9,997.4
Loans and advances to customers 17,163.9 17,783.6 Securitised liabilities 355.4 2,277,2
Provisions for possible loan losses -466.6 -508.1 Liabilities held for trading 4,487.8 3,835.6
Assets held for trading 2,971.8 2,479.2 Provisions 210.2 164.4
Investment securities 7,951.2 7,941.3 Current tax liabilities 103.3 103.9
Investments accounted for using the equity
method 10.7 10.5
Deferred tax liabilities 68.4 67.4
Intangible assets 24.3 24.9 Other liabilities 456.3 483.5
Property, plant and equipment 191.6 183.5 Subordinated capital 999.6 1,017.7
Current tax assets 24.7 22.3 Equity 340.5 424.8
Deferred tax assets 218.4 218.0 Issued capital 1,621.5 1,621.3
Other assets 377.6 381.2 Capital reserve 597.8 597.8
Non-current assets held for sale 5.3 14.6 Retained earnings -1,804.8 -1,242.9
Currency translation reserve -18.0 -19.1
Revaluation surplus 21.7 -15.4
Consolidated income/cumulative loss -77.7 -516.9
Total 31,090.1 31,593.7 Total 31,090.1 31,593.7

Balance Sheet of IKB Group as of 31 March 2012
* Figures adjusted
33
ASSETS
€ million
31 Mar
2012
31 Mar
2011*
EQUITY AND LIABILITIES
€ million
31 Mar
2012
31 Mar
2011*
Cash reserve 19.1 84.8 Liabilities to banks 13,221.8 11,193.6
Loans and advances to banks 3,023.6 2,316.2 Liabilities to customers 9,997.4 7,693.7
Loans and advances to customers 17,783.6 20,330.9 Securitised liabilities 2,277.2 7,710.5
Provisions for possible loan losses -508.1 -818.5 Liabilities held for trading 3,835.6 2,003.6
Assets held for trading 2,479.2 815.5 Provisions 164.4 137.1
Investment securities 7,941.3 7,892.3 Current tax liabilities 103.9 107.0
Investments accounted for using the equity
method 10.5 10.8
Deferred tax liabilities 67.4 30.3
Intangible assets 24.9 19.3 Other liabilities 483.5 468.1
Property, plant and equipment 183.5 167.5 Subordinated capital 1,017.7 1,144.4
Current tax assets 22.3 36.1 Equity 424.8 943.4
Deferred tax assets 218.0 190.8 Issued capital 1,621.3 1,621.3
Other assets 381.2 386.0 Capital reserve 597.8 597.8
Non-current assets held for sale 14.6 - Retained earnings -1,242.9 -1,243.0
Currency translation reserve -19.1 -17.5
Revaluation surplus -15.4 -36.5
Consolidated income/cumulative loss -516.9 21.3
Total 31,593.7 31,431.7 Total 31,593.7 31,431.7

Income statement of IKB AG 2011/12 (German GAAP)34
€ million Unadjusted
income
statement
2011/12
Extraordinary factors Adjusted
income
statement
2011/12
Unadjusted
income
statement
2010/11
Restruc-
turing
Other
Net interest income (not including current income from shares,
investments, etc.)102 102 226
Net fee and commission income -51 -102 51 -71
Net trading portfolio expenses 1 1 -13
Current income from shares, equity participation and shares in affiliated
companies and income from profit transfer agreements 404 192 199 13 8
Personnel expenses -128 -128 -125
Other administrative expenses -127 -4 -123 -143
Write-downs and value adjustments on receivables and additions to
provisions in the lending business -14 9 -23 -64
Write-downs/reversals of write-downs on securities in the liquidity
reserve 9 -14 -4 27 8
Write-downs and losses on/reversals of write-downs and income from
securities held as fixed assets -257 -262 5 10
Write-downs, value adjustments and reversals of write-downs on equity
participations and shares in affiliated companies -192 -193 1 0 -56
Net other operating income (including costs of loss absorption) 20 10 10 -15
Result from ordinary business activities -233 -121 -47 -65 -235
Extraordinary result -14 -8 -6 0 -6
Tax income -8 -8 51
Net profit/loss for the year -255 -129 -53 -73 -190
Loss participation of profit-participation certificates and silent
partnership contributions14 32
Loss carryforward from previous year -1,789 -1,631
Net accumulated losses -2,030 -1,789

Loss Participation of the Hybrids35
Maturity ISIN Total repayment
amount before loss
participation
in €
Denomination to
original nominal
amount before
loss participation
in €
Repayment amount
per item after loss participation
2007/08
in €
2008/09
in €
2009/10
in €
2010/11
in €
2011/12
in €
2015 DE0002731197 30,000,000 100.00 52.72 17.53 3.94 0.14 0.00
2017 DE0002731429 50,000,000 1,000.00 527.17 457.30 387.48 349.45 298.28
2017 DE0002731569 70,000,000 50,000.00 26,358.25 22,865.15 19,373.81 17,472.39 14,913.82
2015 DE000A0GF758
(ProPart Funding) 150,000,000 50,000.00 26,358.25 8,766.12 1,972.27 71.53 0.00
Final
Maturity
ISIN Total repayment
amount before loss
participation
in €
Repayment
amount
per security before
loss participation
in €
Proportionate repayment amount of silent partner contributions per
security after loss participation
2007/08
in €
2008/09
in €
2009/10
in €
2010/11
in €
2011/12
in €
Open DE0007490724
(Capital Raising) 200,000,000 100.00 52.72 17.53 3.94 0.14 0.00
Open DE000A0AMCG6
(Hybrid Raising) 200,000,000 100.00 52.72 17.53 3.94 0.14 0.00

€ million Credit volumeafter risk
mitigation
thereof public sector
thereof banks and
financial sector1)
thereof other counterparty
risks
France 2,336 251 1,299 786
UK 2,158 – 1,276 833
Italy 1,559 905 256 399
Spain 1,326 78 656 592
EU2) 1,173 504 668 –
Netherlands 424 105 181 138
Ireland 327 – 1903) 137
Austria 226 77 105 44
Switzerland 218 – 104 114
Sweden 139 – 100 39
Denmark 122 97 25 1
Finland 95 – 18 78
Portugal 72 – 30 42
Other 183 – 51 132
Total 10,359 2,018 4,958 3,384
Credit Volume in Western Europe by Risks (as of 30 September 2012)
Some totals may be subject to discrepancies due to rounding differences.1) Bank exposures in Spain and Italy contain primarily covered bonds2) European Commission, European Financial Stability Facility (EFSF) and European Investment Bank3) Portfolio investments of € 182 million by special purpose entities are included in the figure for Ireland
36

Selected Transactions37
Corporate
Debt/Equity Capital Markets
Leveraged Buy-Out
Promissory Note
Maturities: 2015, 2017, 2019
Arranger
€ 70,000,000
Promissory Note
€ 30,000,000
Maturities: 2015, 2017, 2019
Sole Arranger
2012 2012
2012
Acquisition of
€ 475,000,000
by
Senior Debt
MLA & Bookrunner
Mid Cap Bond
€ 15,000,000
Coupon: 7.125% Sole Selling Agent
Maturity: 2016
2012
Leveraged Buy-out of
USD 150,000,000
through funds advised by
Senior Debt
Mandated Lead Arranger
2012Refinancing of
€ 203,000,000
through funds advised by
Senior Debt
MLA & Bookrunner
2012
through funds advised by
Senior Debt
Leveraged Buy-out of
€ 770,000,000
Mandated Lead Arranger
2012Leveraged Buy-out of
€ 500,000,000
through funds advised by
Senior Debt & Second Lien
MLA & Bookrunner
2011
Syndicated Loan
€ 225,000,000 MLA & Bookrunner
General Corporate Purpose
2012
Refinancing
€ 260,000,000
Syndicated Loan
MLA & Bookrunner
2012 2012
Refinancing
€ 500,000,000
Syndicated Loan
Mandated Lead Arranger
Refinancing
€ 82,400,000
Syndicated Loan
Mandated Lead Arranger
2012
2012
Promissory Note
€ 75,000,000
Maturities: 2015, 2017, 2019
Joint-Arranger
2012
Mid Cap Bond
€ 30,000,000
Coupon: 7.375%
Paying & Selling Agent
Maturity: 2017
Leveraged Buy-out of
€ 830,000,000
through funds advised by
Senior Debt
MLA & Bookrunner
2012
Promissory Note
€ 75,000,000
Maturites: 2017, 2019
Arranger
2012
General Corporate Purpose
€ 60,000,000
Syndicated Loan
Manager Lead Arranger
2012
Syndicated Loan (KfW)
€ 119,000,000 Sole MLA & Bookrunner
Investment Financing
2013

Contact38
Copyright:June 2013Publisher: IKB Deutsche Industriebank AG, Wilhelm-Bötzkes-Straße 1, 40474 Düsseldorf, GermanyLegal Form: AktiengesellschaftRegistered Office: DüsseldorfCommercial Register (Handelsregister): Amtsgericht Düsseldorf, HR B 1130Chairman of the Supervisory Board: Bruno ScherrerChairman of the Board of Managing Directors: Hans Jörg SchüttlerBoard of Managing Directors: Dr Dieter Glüder, Claus Momburg, Dr Michael H. Wiedmann
Armin Baltzer
IKB Deutsche Industriebank AG
Wilhelm-Bötzkes-Straße 1
40474 Düsseldorf
GERMANY
Telephone +49 211 8221-6236
Fax +49 211 8221-6336
E-mail [email protected]


![ikB @ LESSON-17 · 2019-07-17 · 120 ikB @ LESSON-17 1.0 TEXT - ^paik] i](https://static.fdocuments.net/doc/165x107/5f7db1ad5e2aeb5b5f14a55d/ikb-lesson-17-2019-07-17-120-ikb-lesson-17-10-text-paik-i.jpg)
