3DFS Data Center Pilot Project Information Packet
24
Direct link to the project details at: WWW.3DFS.COM/PILOT Pittsboro, North Carolina, USA © Copyright, 2008-2017 - 3DFS LLC All Rights Reserved
-
Upload
chris-doerfler -
Category
Technology
-
view
68 -
download
0
Transcript of 3DFS Data Center Pilot Project Information Packet

Direct link to the project details at: WWW.3DFS.COM/PILOT
Pittsboro, North Carolina, USA © Copyright, 2008-2017 - 3DFS LLC
All Rights Reserved
WWW.3DFS.COM/PILOT © Copyright, 2008-2017 - 3DFS LLC
All Rights Reserved
Document : 3DFS VectorQ2 PilotProjectDescription v07 01262017
Page 2 of 22
VectorQ2 Data Center Pilot Project
Table of Contents
Open Letter from 3DFS ........................................................................................................... 3
Executive Summary ................................................................................................................ 4
VectorQ2 Pilot Project Overview ............................................................................................ 6
Qualifications for this VectorQ2 Pilot Project ....................................................................... 7
Term of Pilot Project................................................................................................................ 8
Return on Investment .............................................................................................................. 9
Instant Payback .................................................................................................................................. 9
Short Term ROI ................................................................................................................................ 10
Long Term ROI ................................................................................................................................ 11
Data and ROI ................................................................................................................................... 11
Installation .............................................................................................................................. 12
Zero Risk Installation Strategy ............................................................................................. 15
Tracking Improvement Metrics ............................................................................................. 16
Energy Data and Individual Asset Tracking ........................................................................ 17
Predictive Performance Analytics ........................................................................................ 17
Individual Asset Tracking ................................................................................................................. 17
Predictive Performance Analytics ..................................................................................................... 17
Real Time and Historical Energy Consumption and Awareness ....................................................... 17
Steps to Move Forward with the Pilot Project ..................................................................... 18
VectorQ2 Specifications ....................................................................................................... 19
Onboarding Qualification Form ............................................................................................ 22
Attachments
Attachment A - How Demand Charges Double Utility Bills in Data Centers
Attachment B - Ground Currents in Data Center Environments

WWW.3DFS.COM/PILOT © Copyright, 2008-2017 - 3DFS LLC
All Rights Reserved
Document : 3DFS VectorQ2 PilotProjectDescription v07 01262017
Page 3 of 22
VectorQ2 Data Center Pilot Project
Open Letter from 3DFS
3DFS is a research, development, and manufacturing company located in Pittsboro, NC specializing in
the energy market sector. We are the inventors of a patented technology we call “Software-Defined
Power” which is a combination of very sophisticated hardware and software. Software-Defined Power
is the first digital approach that cleans, optimizes and balances electricity as it is distributed through an
electrical network. The advantages of this technology are indisputable and we are very pleased to
announce that our flagship product, the VectorQ2 power controller, which is suitable for a variety of low-
voltage applications, is now available for our Data Center Pilot Project.
This is the culmination of nearly a decade of design, development, testing, perfecting and validation
both in the United State and Europe. The Company is transitioning from small batch pre-production
units to an early production run designed to meet the needs of the United States mainland electrical
code.
This pilot project is designed for your company to safely experience the known power network
performance improvement of 3DFS Software-Defined Power. For clarification, this is a paid
pilot project and is NOT intended to test or validate 3DFS Technology.
We are vertically integrated and proudly manufacture and rigorously test all of our products in Chatham
County, Pittsboro, North Carolina in the United States of America. Each VectorQ2 power controller is
individually inspected, tested and certified by 3DFS before ever leaving the door. At your request, we
will be present to observe any installation.
We are excited to introduce the VectorQ2 into the market, and are looking for visionaries like you, to be
a strategic partner. 3DFS technology is an evolutionary advancement in the way electricity is
distributed and our vision is to transform America to a new economy based on precision use of
electricity which will strengthen our homes and businesses and ensure our energy independent future.
Please review this document to better understand the opportunity and contact us to get started.
Thank you for your time and attention,
Chris Doerfler
Cofounder, 3DFS

WWW.3DFS.COM/PILOT © Copyright, 2008-2017 - 3DFS LLC
All Rights Reserved
Document : 3DFS VectorQ2 PilotProjectDescription v07 01262017
Page 4 of 22
VectorQ2 Data Center Pilot Project
Executive Summary
3DFS is a vertically integrated product development
company that specializes in adapting Software-Defined
Power to products that manage and protect electrical
environments. We offer turnkey production from design
through mass manufacturing to help clients leverage the
competitive advantages for higher profitability, more
reliability, and a greener energy profile.
All 3DFS products are manufactured in the United States.
This document describes how data centers can participate in
the VectorQ2 Pilot Project. While Software-Defined Power is
a significant benefit for any data center, we are seeking
partners with a long term horizon that focuses on both
growth and efficiency of operations. For more information on
the qualifications and terms for this pilot project, turn to
pages 7 and 8.
As a new category of technology, the benefits of installing Software-Defined Power with respect to
energy efficiency and balanced electrical energy flow are relatively new concepts, brought forth by the
development of this technology. The improvements to the electrical network and connected devices
are indisputable and you can learn more about the benefits in the Return on Investment section
beginning on page 9.
Page 16 reviews the types of energy usage data and what can be gleaned from the Software-Defined
Power approach and finally, Page 18 reviews how to contact us and move forward with the VectorQ2
Pilot Project.
To learn more information please visit the website at 3DFS.com
WWW.3DFS.COM/PILOT © Copyright, 2008-2017 - 3DFS LLC
All Rights Reserved
Document : 3DFS VectorQ2 PilotProjectDescription v07 01262017
Page 5 of 22
VectorQ2 Data Center Pilot Project
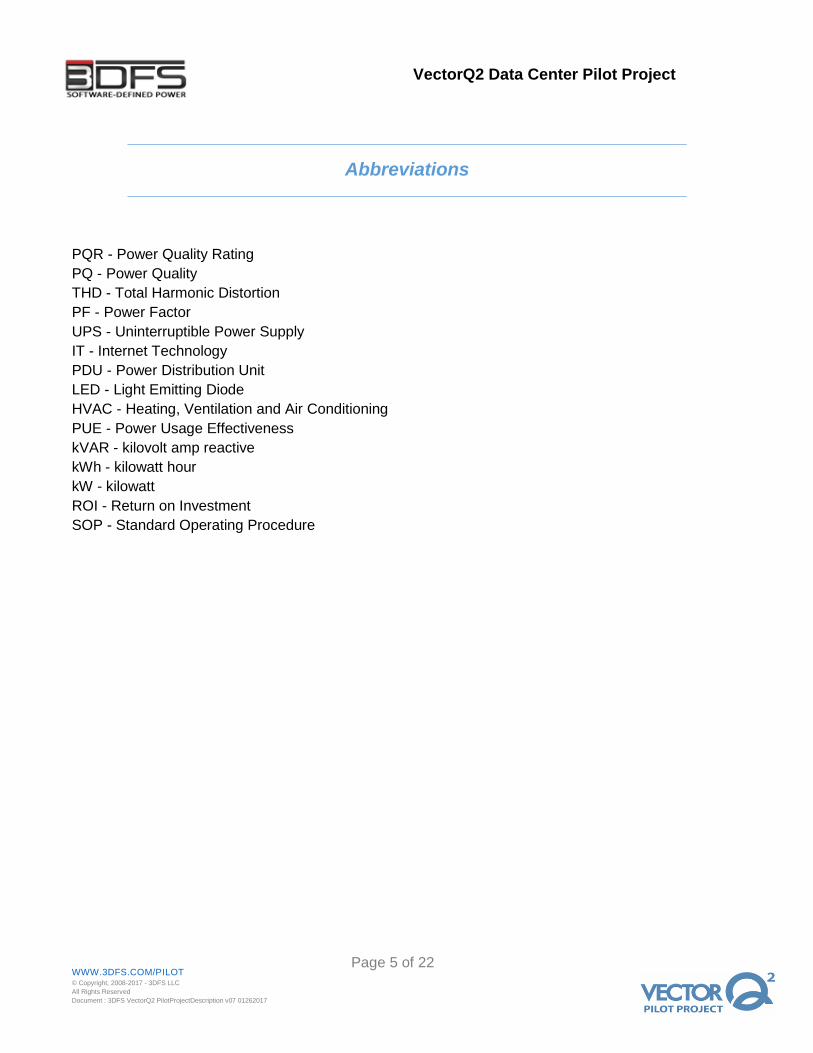
Abbreviations
PQR - Power Quality Rating
PQ - Power Quality
THD - Total Harmonic Distortion
PF - Power Factor
UPS - Uninterruptible Power Supply
IT - Internet Technology
PDU - Power Distribution Unit
LED - Light Emitting Diode
HVAC - Heating, Ventilation and Air Conditioning
PUE - Power Usage Effectiveness
kVAR - kilovolt amp reactive
kWh - kilowatt hour
kW - kilowatt
ROI - Return on Investment
SOP - Standard Operating Procedure
WWW.3DFS.COM/PILOT © Copyright, 2008-2017 - 3DFS LLC
All Rights Reserved
Document : 3DFS VectorQ2 PilotProjectDescription v07 01262017
Page 6 of 22
VectorQ2 Data Center Pilot Project
VectorQ2 Pilot Project Overview
This pilot project is a paid opportunity to evaluate 3DFS’ emerging energy efficiency technology. The
VectorQ2 is an advanced computing device that maximizes the quality and efficiency of the passing
electricity by maintaining optimal electrical energy flow and ideal balance.
Electricity touches nearly every facet of a data center, so optimized electrical energy flow brings
countless benefits to the entire network, some of which we are aware (i.e. increased longevity of UPS
and power supplies, improved performance of HVAC) and others which we will discover over time.
By optimizing the electrical energy flow down to the load level, the overall safety and stability of the
whole power network is increased, which is the number one purpose of the VectorQ2. The dynamic
stability and performance improvement provided to the electrical network will add a powerful layer of
uptime protection.
Truly clean power results in energy and cost savings. There will be a substantial reduction in the kW
consumption of each aisle. Including the rate optimization that occurs during demand charges, we
anticipate that each unit will have an ROI within 12-18 months.
Throughout the pilot project, we will periodically update the Improvement Metrics that will assist in
quantifying the improvement of the overall facility. We encourage each participant in the data center to
track performance of any particular devices/areas within your data center that you would like to see if
there was an improvement in operation.
We are certain that after installation, you will realize that this technology is a necessary component to a
data center electrical network. The goal of this pilot project is to demonstrate the dramatic
improvement and protection capabilities in a data server aisle and open up discussions to outfitting the
entire data center operation. From there, we would begin working together on developing the
advanced data functionality that comes with the VectorQ2.

WWW.3DFS.COM/PILOT © Copyright, 2008-2017 - 3DFS LLC
All Rights Reserved
Document : 3DFS VectorQ2 PilotProjectDescription v07 01262017
Page 7 of 22
VectorQ2 Data Center Pilot Project
Qualifications for this VectorQ2 Pilot Project
The VectorQ2 is guaranteed to improve electrical networks, whether through stability of power delivery,
improved efficiency, reduced electrical waste, or real time data. While any electrical network will
benefit, this pilot is specifically designed to target strong data center partners who have a lot to benefit
from improving their electrical networks and who are interested in working together over the next few
years to develop the comprehensive energy data, individual asset tracking, and predictive performance
analytics functionality that the VectorQ2 technology opens up.
The ideal candidate for this Pilot Project has the following:
Data center operation with more than 6 power redundant aisles
Paying a demand charge, kVAR or other penalties
Have known power quality or asset related issues such as the ones listed in Improvement
Metrics section
Have known issues maintaining power when transitioning from grid power to generator power
and/or back or other electrical power or data stability issues
Our recommendation is to implement this pilot project in the data center test site, or “Sandbox.” In a
functioning sandbox aisle the pilot installation has virtually zero risks and the user can collect very
valuable performance information by simulating electrical network supply service and failure conditions.
A further recommendation for this pilot project is to monitor in house or contract with a third party
monitoring service for independent data on power quality, temperature, data rate, transfer error rate,
etc. before and after the installation.
WWW.3DFS.COM/PILOT © Copyright, 2008-2017 - 3DFS LLC
All Rights Reserved
Document : 3DFS VectorQ2 PilotProjectDescription v07 01262017
Page 8 of 22
VectorQ2 Data Center Pilot Project
Term of Pilot Project
Once the VectorQ2 is installed at the data center aisle, the improvement in performance and stability will be so apparent that you will want the remaining server aisles protected by the VectorQ2 system. For this reason, we align the pilot project with the utility billing cycle in order to show the real financial impact.
It should be noted that Utilities apply a variety of multiplying and additive coefficients to the meter which can obscure true electricity consumption numbers and are only known to them. This is one of the reasons we recommend third party monitoring and verification. Prior to beginning the pilot project, together with you we will determine the existing performance and efficiency of the server aisle, and identify targets that you would like to see consistently met. Some of these may be covered by the Improvement Metrics and there may be other metrics that you would like to track. We will schedule the installation of the VectorQ2 at least a few days before the utility billing cycle begins. This will allow us to receive baseline data and ensure operation for the duration of the billing cycle. After the billing cycle ends and the utility bill are received, we will schedule a time to review the utility bill and Improvement Metrics and calculate the final results and cost savings associated with the installation. Hitting the data center aisle pre-determined targets would trigger discussions on the cost and timelines associated with protecting the rest of the data center server aisles with VectorQ2 power controllers. We typically target that the term of the pilot project to last 45 days to cover the entire monthly billing cycle and the length of time to receive the Utility bill. At the conclusion of the term, we will perform an “Improvements Review” to determine the impact. Different data centers may require different terms according to SOP.
Upon completion of the pilot project, the VectorQ2 will NOT be removed. You will continue to receive
protection and will continue to track the Improvement Metrics over a 12 month time frame. We will then
schedule an “Annual Improvements Review” where we will review the annual data and discuss in detail.

WWW.3DFS.COM/PILOT © Copyright, 2008-2017 - 3DFS LLC
All Rights Reserved
Document : 3DFS VectorQ2 PilotProjectDescription v07 01262017
Page 9 of 22
VectorQ2 Data Center Pilot Project
Return on Investment
The instant that the VectorQ2 is turned ON you will begin saving power and money. These must be looked at separately because the amount of money you are charged is only partly determined by the amount of power you consume. When and how your Data Center consumes power is factored into how you are charged, i.e. demand charges, kVAR penalties, day and night rates, etc. Savings on IT equipment through reduced maintenance and replacement costs will be distributed across both capital and operational expenses and will be visible over time.
The ROI for the VectorQ2 must be considered in three different ways:
Instant Payback
The most immediate payback from the data center perspective is
Increase in uptime
Increase in quality of data in both communication and storage
Near elimination of downtime during power source transitions
Immediate protection of server aisle from variations in the electricity flow
The VectorQ2 is a computer that constantly cleans and balances the electricity in the server aisle. This automatic protection from fluctuations and distortions will stabilize the server aisle power network, prevent disruption and eliminate the need for human interaction in the power network. The immediate and sustained benefits result in greater uptime and:
o Maintains lowest possible utility rate during all demand charges (See “Demand Charges” diagram in Appendix A
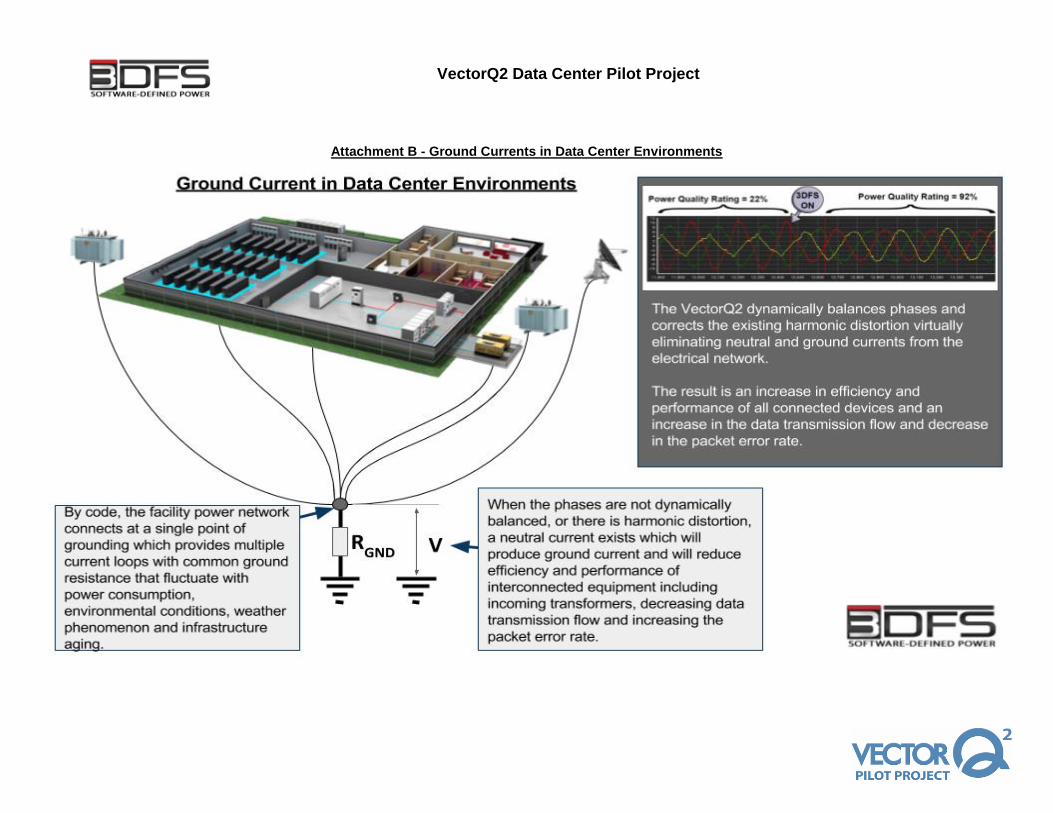
o Eliminates overloading and imbalance in UPS outputs, by providing almost ideal load. o Improves data transmission rate, reduces data re-transmission rate, and decreases error
rates in data storage by nullifying Neutral currents and significantly reducing Ground currents (See “Ground Current” diagram in Appendix B)
o Provides instant availability of energy usage data in details o Automatic and dynamic impedance matching for the electrical network o Reduction in heat generated by servers, distribution wiring, switches, fuses and power
supplies o Greenest consumption of electricity possible o Full row real-time Class B surge protection o Increased safety of the facilities including by improving the quality of the grounding
WWW.3DFS.COM/PILOT © Copyright, 2008-2017 - 3DFS LLC
All Rights Reserved
Document : 3DFS VectorQ2 PilotProjectDescription v07 01262017
Page 10 of 22
VectorQ2 Data Center Pilot Project
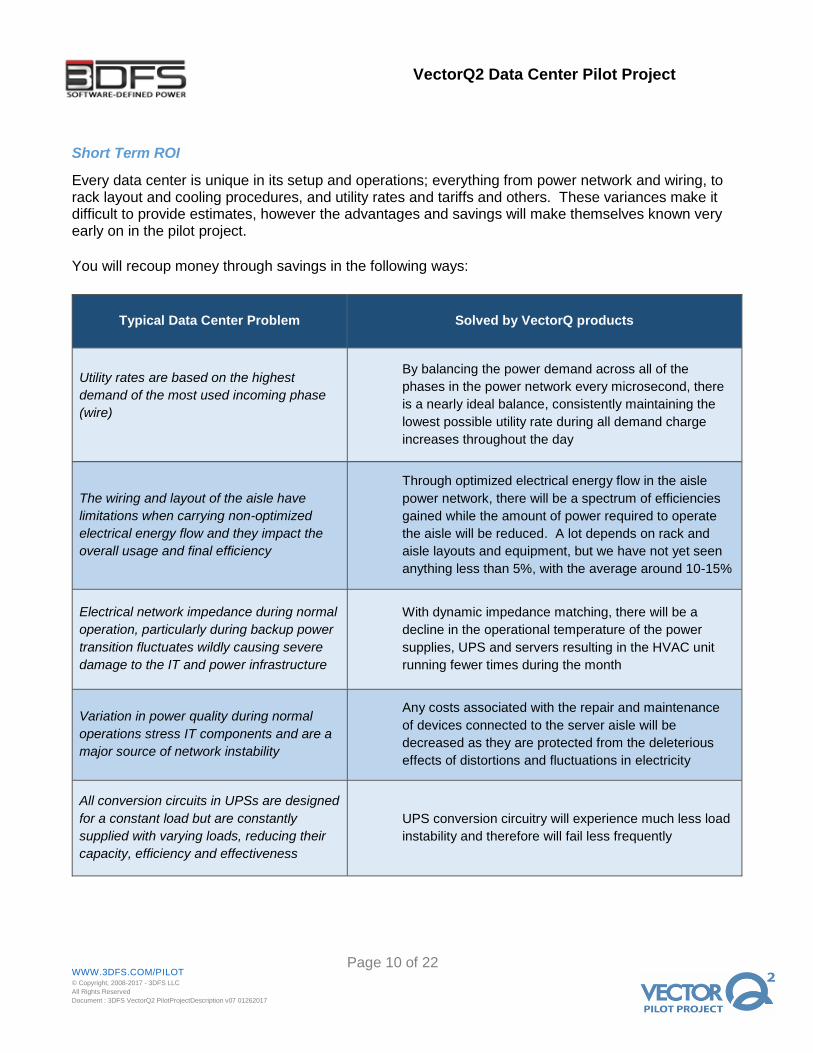
Short Term ROI
Every data center is unique in its setup and operations; everything from power network and wiring, to rack layout and cooling procedures, and utility rates and tariffs and others. These variances make it difficult to provide estimates, however the advantages and savings will make themselves known very early on in the pilot project.
You will recoup money through savings in the following ways:
Typical Data Center Problem
Solved by VectorQ products
Utility rates are based on the highest
demand of the most used incoming phase
(wire)
By balancing the power demand across all of the
phases in the power network every microsecond, there
is a nearly ideal balance, consistently maintaining the
lowest possible utility rate during all demand charge
increases throughout the day
The wiring and layout of the aisle have
limitations when carrying non-optimized
electrical energy flow and they impact the
overall usage and final efficiency
Through optimized electrical energy flow in the aisle
power network, there will be a spectrum of efficiencies
gained while the amount of power required to operate
the aisle will be reduced. A lot depends on rack and
aisle layouts and equipment, but we have not yet seen
anything less than 5%, with the average around 10-15%
Electrical network impedance during normal
operation, particularly during backup power
transition fluctuates wildly causing severe
damage to the IT and power infrastructure
With dynamic impedance matching, there will be a
decline in the operational temperature of the power
supplies, UPS and servers resulting in the HVAC unit
running fewer times during the month
Variation in power quality during normal
operations stress IT components and are a
major source of network instability
Any costs associated with the repair and maintenance
of devices connected to the server aisle will be
decreased as they are protected from the deleterious
effects of distortions and fluctuations in electricity
All conversion circuits in UPSs are designed
for a constant load but are constantly
supplied with varying loads, reducing their
capacity, efficiency and effectiveness
UPS conversion circuitry will experience much less load
instability and therefore will fail less frequently
WWW.3DFS.COM/PILOT © Copyright, 2008-2017 - 3DFS LLC
All Rights Reserved
Document : 3DFS VectorQ2 PilotProjectDescription v07 01262017
Page 11 of 22
VectorQ2 Data Center Pilot Project
Long Term ROI
The direct link between longevity of sensitive electronics and precision delivery of power is well established and pretty clear. Poor power quality can cause long term degradation in infrastructure and loads causing failure at unpredictable times. Since the most critical feature of any data center is stability and predictability, sudden failure is extremely detrimental and imposes a significant operational cost. The servers, UPS, PDU, routers, switches, and all of the associated devices that draw power from the
electrical network protected by the VectorQ2 will operate more efficiently, perform more consistently
and last much longer than the data center has experienced in the past. Further, the power network
infrastructure will operate more reliably and consistently increasing the trust level of their operation.
Data and ROI
The other half of improved performance and efficiency is the access to real time and historical energy data accessible through the VectorQ2. Over time, the data center will collect granular critical electrical performance data on each device in the server aisle. This data will divulge virtually anything that the data center would like to know about the devices operating in the power network.
Over time, knowing the idle and operating efficiency and performance of each device will provide relevant information to make future purchasing decisions knowing the lifetime power consumption costs.
This true data will provide direct guidelines for maintenance operation of the server aisle. Tracking
trends in device energy consumption, operating efficiency and performance reveals patterns indicative
of wear and tear. These patterns become part of preventative maintenance and predictive failure
databases that the data center will use to identify ahead of time when devices require repair,
maintenance or replacement. Shifting asset management to predictive as opposed to reactive will save
operational and capital expenses.

WWW.3DFS.COM/PILOT © Copyright, 2008-2017 - 3DFS LLC
All Rights Reserved
Document : 3DFS VectorQ2 PilotProjectDescription v07 01262017
Page 12 of 22
VectorQ2 Data Center Pilot Project
Installation
The installation of each VectorQ2 power controller is safe and will not interrupt power to the electrical network. Electrically, each VectorQ2 is installed in parallel to the existing network with built-in double fused protection and advanced filtration to comply with electrical codes, and can be installed by an electrician in about 25 minutes. The only noticeable difference from the working VectorQ2 will be an improvement in the power quality and stability of the power network. VectorQ2’s efficiency is over 98% and operates on 120W or less of AC power. For detailed instructions about installation, please see the VectorQ2 manual. Below is a synopsis of the installation procedure. Each unit comes with 3pc. FlexoCoil™ current transformers which are flexible and are able to be installed around cables up to 3.1inch (80mm). FlexoCoil™ is color coded to each phase (Black-L1, Red-L2, Blue-L3). Installation includes connection of the FlexoCoil™ current transformers, and connection of the Ground (Green) and Neutral (white) wires, with sequential connection to Power lines L1(Black), L2(Red), L3(Blue). Each unit is hardwired to the internet and will connect to the server with AES256 encryption, where energy usage and historical data is collected and analyzed. The connection is done via Ethernet adapter on the VectorQ2 with a standard RJ45 jack.
WWW.3DFS.COM/PILOT © Copyright, 2008-2017 - 3DFS LLC
All Rights Reserved
Document : 3DFS VectorQ2 PilotProjectDescription v07 01262017
Page 13 of 22
VectorQ2 Data Center Pilot Project
The internal workings of the VectorQ2 are sophisticated, but the beauty of the design is that for end users, installation and operation is simple and non-invasive. All operation of the VectorQ2 can be communicated with ease through the 3 color LED array on the front of the device. Each of the 3 color LED on the front of the device indicate a status. Once the device is properly installed it will go through the process of verification, confirmation and configurations. The total configuration process should take 1.5 minutes or less
1. During the first a few moments, the device will conduct power-on internal procedures and functionality verification (Green LED on front panel is ON).
2. It will begin a verification cycle of installation and connection confirmation (intermediate Red LED blinking).
3. Once initial configuration is set, the device will begin soft correction to further verify installation and power-on procedures (Red LED is OFF and Yellow LED intermediate blinking).
4. Once the process is complete the Yellow LED will confirm full operation protocol is fully engaged.
Unusual Procedure Protocol
If any unusual operation is detected, the unit will conduct “soft disengagement” procedures. The Red LED will indicate such process. It typically takes a few moments to clear the situation and return to normal operation. In case of device failure, a report will be generated and delivered to the server and the device will be disconnected from service. Please call us for the next step.
WWW.3DFS.COM/PILOT © Copyright, 2008-2017 - 3DFS LLC
All Rights Reserved
Document : 3DFS VectorQ2 PilotProjectDescription v07 01262017
Page 14 of 22
VectorQ2 Data Center Pilot Project
What are the risks of installing the VectorQ2?
While there is always some degree of risk when installing early market technology, the risks associated with the VectorQ2 are essentially nullified because it is installed in parallel with the electrical environment.
The default position of the VectorQ2 is OFF, which means disconnected from electrical network. If there is any unexpected error or if the VectorQ2 fails to work for any reason, the unit defaults to the OFF position leaving the electrical environment untouched. In other words, there are two options upon installation of the VectorQ2, the electrical environment will either improve or remain the exact same.
The VectorQ2 was built with safety in mind and has gone through rigorous internal testing. It was
designed and manufactured to exceed all of the current codes, regulations, and certifications that are
required for the market. There are no serviceable components within the VectorQ2, which will be
sealed for your protection.
Warranty Information
Safety for the operation and the people is paramount. We will replace the unit with no obligations in 7
days or less, under the standard warranty agreement, in the case where the VectorQ2 unit ceases to
operate. This warranty obligation is for 18 months starting from delivery day and is in effect for the
entire term of the pilot program. We offer an advanced variation of the Standard Warranty – please
contact your salesman for details and options.
WWW.3DFS.COM/PILOT © Copyright, 2008-2017 - 3DFS LLC
All Rights Reserved
Document : 3DFS VectorQ2 PilotProjectDescription v07 01262017
Page 15 of 22
VectorQ2 Data Center Pilot Project
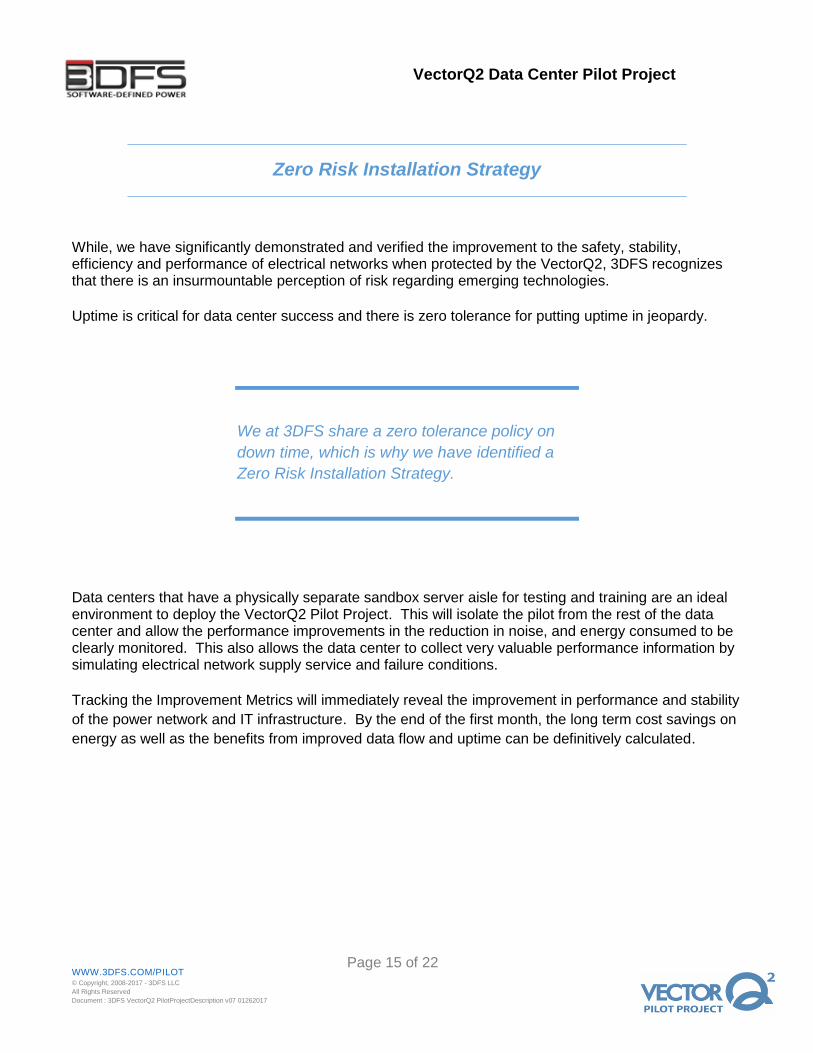
Zero Risk Installation Strategy
While, we have significantly demonstrated and verified the improvement to the safety, stability, efficiency and performance of electrical networks when protected by the VectorQ2, 3DFS recognizes that there is an insurmountable perception of risk regarding emerging technologies.
Uptime is critical for data center success and there is zero tolerance for putting uptime in jeopardy.
Data centers that have a physically separate sandbox server aisle for testing and training are an ideal environment to deploy the VectorQ2 Pilot Project. This will isolate the pilot from the rest of the data center and allow the performance improvements in the reduction in noise, and energy consumed to be clearly monitored. This also allows the data center to collect very valuable performance information by simulating electrical network supply service and failure conditions.
Tracking the Improvement Metrics will immediately reveal the improvement in performance and stability
of the power network and IT infrastructure. By the end of the first month, the long term cost savings on
energy as well as the benefits from improved data flow and uptime can be definitively calculated.
We at 3DFS share a zero tolerance policy on
down time, which is why we have identified a
Zero Risk Installation Strategy.
WWW.3DFS.COM/PILOT © Copyright, 2008-2017 - 3DFS LLC
All Rights Reserved
Document : 3DFS VectorQ2 PilotProjectDescription v07 01262017
Page 16 of 22
VectorQ2 Data Center Pilot Project
Tracking Improvement Metrics
The VectorQ2 employs unique and proprietary technologies in order to acquire dynamic real-time
calculations, and is able to show both the corrected “after” and calculated “before,” allowing the
observer to easily compare. Below are some of the parameters that we will track as well as some
suggested metrics for the data center to internally track when the VectorQ2 is installed to demonstrate
the wide ranging improvements that the data center will experience.
Electric Power Network Improvement Metrics
Power Quality Rating™
Power quality
Number of surges, and their metric
Voltage, current, total harmonic distortion, power factor, kW/h
Phase balance
Calculated neutral wire current
Power Equipment Improvement Metrics
Power supply fails rate, and their dynamic metric
UPS fail rate and dynamic rate
UPS output rating
In order to understand fully the impact that Software-Defined Power will have on your electrical network, we recommend that the data center or a third party track the following metrics.
IT Network Improvement Metrics
Packet Error Rate
Server traffic flow
Retransmission rate
Router fail rate
Facility Improvement Metrics
HVAC Repair and maintenance
HVAC Cycling Rate
HVAC Cooling Efficiency
Lighting Replacement schedule
Operations Improvement Metrics
PUE
Temperature of adjacent hot aisle
Temperature of adjacent cold aisle

WWW.3DFS.COM/PILOT © Copyright, 2008-2017 - 3DFS LLC
All Rights Reserved
Document : 3DFS VectorQ2 PilotProjectDescription v07 01262017
Page 17 of 22
VectorQ2 Data Center Pilot Project
Energy Data and Individual Asset Tracking
Predictive Performance Analytics
The VectorQ2 power controller consistently distributes ideal power throughout your protected data
center aisles which establishes dynamic stability, improves uptime and decreases operational costs. In
order to accomplish this, each VectorQ2 is constantly acquiring, digitizing and processing massive
amounts of data on the electrical energy flow.
This data contains the electrical signature for every event that occurs in the electrical network and the
VectorQ2 provides access to that information through an internet based User Interface. Access to this
fidelity of energy usage data in a real time stream can be leveraged for the ultimate in energy data
functionality including:
Individual Asset Tracking
Each server, storage system, power supply, router, etc. has an electrical signature that can be
identified in real time and tracked for historical performance assessments. This visibility into the
electrical network allows the data center to drill down to where the electricity in the network is
being consumed and when, providing an invaluable data set for identifying conservation and
efficiency opportunities without requiring additional sensors.
Predictive Performance Analytics
The electrical signature slightly shifts over time as the device ages and components wear and
tear. Analysis of this signature over time reveals specific patterns that are indicative of
maintenance requirements or impending failure. This feature when fully deployed will be a
~98% accurate detector of failing servers, power supplies, UPS, etc. alerting the operators
weeks or months prior to a visible sign.
Real Time and Historical Energy Consumption and Awareness
Real time understanding of electricity consumption in the data center server aisle broken down
by IT infrastructure provides valuable insight into the second to second operations of the data
center. Historical understanding of this data gives clarity on energy consumption and efficiency
trends that will inform the data center facility operations and guide the growth projections.
WWW.3DFS.COM/PILOT © Copyright, 2008-2017 - 3DFS LLC
All Rights Reserved
Document : 3DFS VectorQ2 PilotProjectDescription v07 01262017
Page 18 of 22
VectorQ2 Data Center Pilot Project
Working Together on Software Development
To Fully Develop Data Functionality
The 45 day pilot project also serves as a baseline for operational performance and asset electrical signature identification. With the conclusion of the pilot project and your renewed interest in outfitting the remaining server aisles we will finalize the purchasing and installation of the remaining VectorQ2 devices in the data center. At that point, we can begin to jointly collaborate on developing the specific desired data functionality.
Steps to Move Forward with the Pilot Project
1. Sign NDA 2. Fill out Onboarding Qualification Form 3. Provide One-line wiring diagram of installation environment 4. Review and Qualification by 3DFS, and review details with you 5. Secure an order 6. Production and Delivery by 3DFS 7. Data center installation, metrics identified and data collected 8. Improvement Review Conference Call 9. Discuss further data center improvements 10. Annual Improvements Review Conference Call
WWW.3DFS.COM/PILOT © Copyright, 2008-2017 - 3DFS LLC
All Rights Reserved
Document : 3DFS VectorQ2 PilotProjectDescription v07 01262017
Page 19 of 22
VectorQ2 Data Center Pilot Project
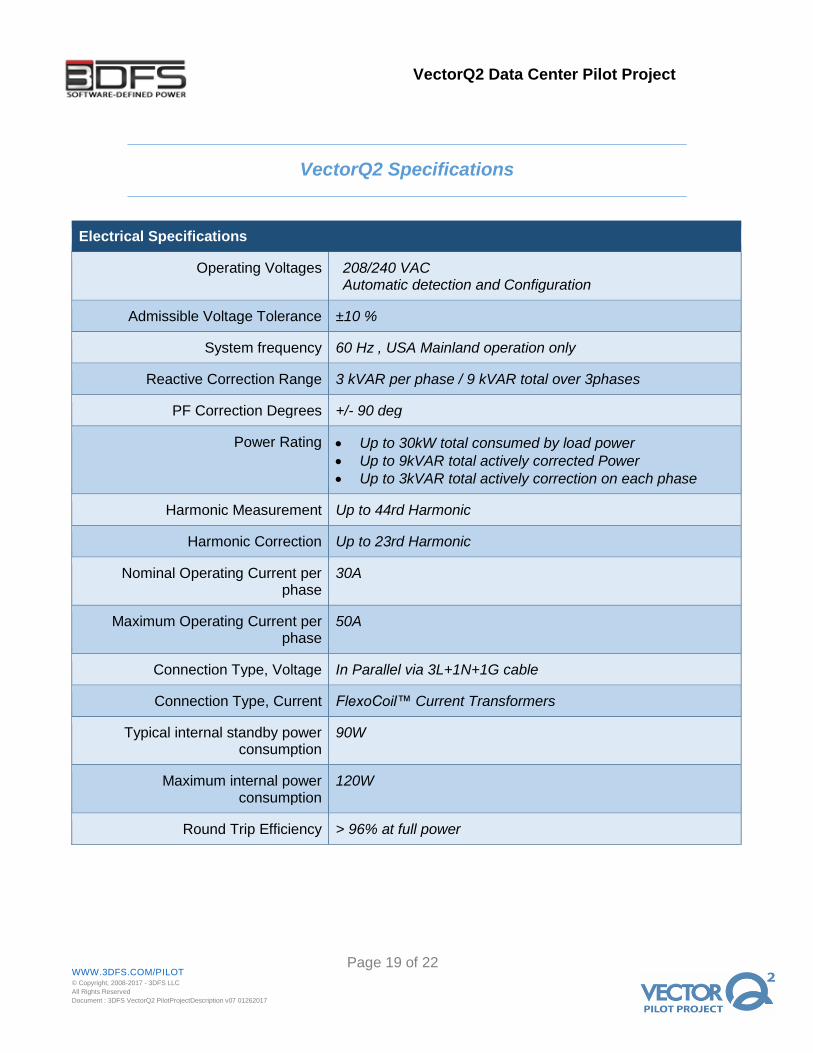
VectorQ2 Specifications
Electrical Specifications
Operating Voltages 208/240 VAC Automatic detection and Configuration
Admissible Voltage Tolerance ±10 %
System frequency 60 Hz , USA Mainland operation only
Reactive Correction Range 3 kVAR per phase / 9 kVAR total over 3phases
PF Correction Degrees +/- 90 deg
Power Rating Up to 30kW total consumed by load power
Up to 9kVAR total actively corrected Power
Up to 3kVAR total actively correction on each phase
Harmonic Measurement Up to 44rd Harmonic
Harmonic Correction Up to 23rd Harmonic
Nominal Operating Current per phase
30A
Maximum Operating Current per phase
50A
Connection Type, Voltage In Parallel via 3L+1N+1G cable
Connection Type, Current FlexoCoil™ Current Transformers
Typical internal standby power consumption
90W
Maximum internal power consumption
120W
Round Trip Efficiency > 96% at full power

WWW.3DFS.COM/PILOT © Copyright, 2008-2017 - 3DFS LLC
All Rights Reserved
Document : 3DFS VectorQ2 PilotProjectDescription v07 01262017
Page 20 of 22
VectorQ2 Data Center Pilot Project
Functions
Power Factor Range 0.01 (D) – 1.00 – 0.01 (G)
Power Factor Correction PF corrected to 1.00 ± 0.1
THD Range correction Up to 23rd Harmonic is fully corrected
Power Conditioning / Noise Elimination
Less than 0.1% THD output on 1st Harmonic
Phase Load Balancing Within 20% of Average
Surge Protection Class C - Instantaneous and continuous with no degradation over time
Time Response Corrections performed on a real-time basis
Electrical Parameters
Operating Voltage 208/240 VAC
Input phases Three Phase
Voltage Tolerance ± 10% on indicated supply voltages
Frequency Range, Tolerance 60 Hz ± 1%
Reactive Component Compensation, nominal
9 kVAR total / 3 kVAR per phase
Correction Limits - % THD Under 0.5% - Up to the 23rd Harmonic of the input frequency
Correction Limits - Power Factor 1.0 (± 1%) for Inductive and Capacitive load
Correction Limits - Non Harmonic Distortions, Dynamic
Range
Amplitude up to +300% of input voltage Current up to 200% of maximum level
PF & THD Sensing and Measurement
Flexible, Dynamic, Fuzzy Logic, 1,000 times per sine wave or better
Response Time Microseconds regime
Operating Current Up to 50A per phase
Power Efficiency 97+%
WWW.3DFS.COM/PILOT © Copyright, 2008-2017 - 3DFS LLC
All Rights Reserved
Document : 3DFS VectorQ2 PilotProjectDescription v07 01262017
Page 21 of 22
VectorQ2 Data Center Pilot Project
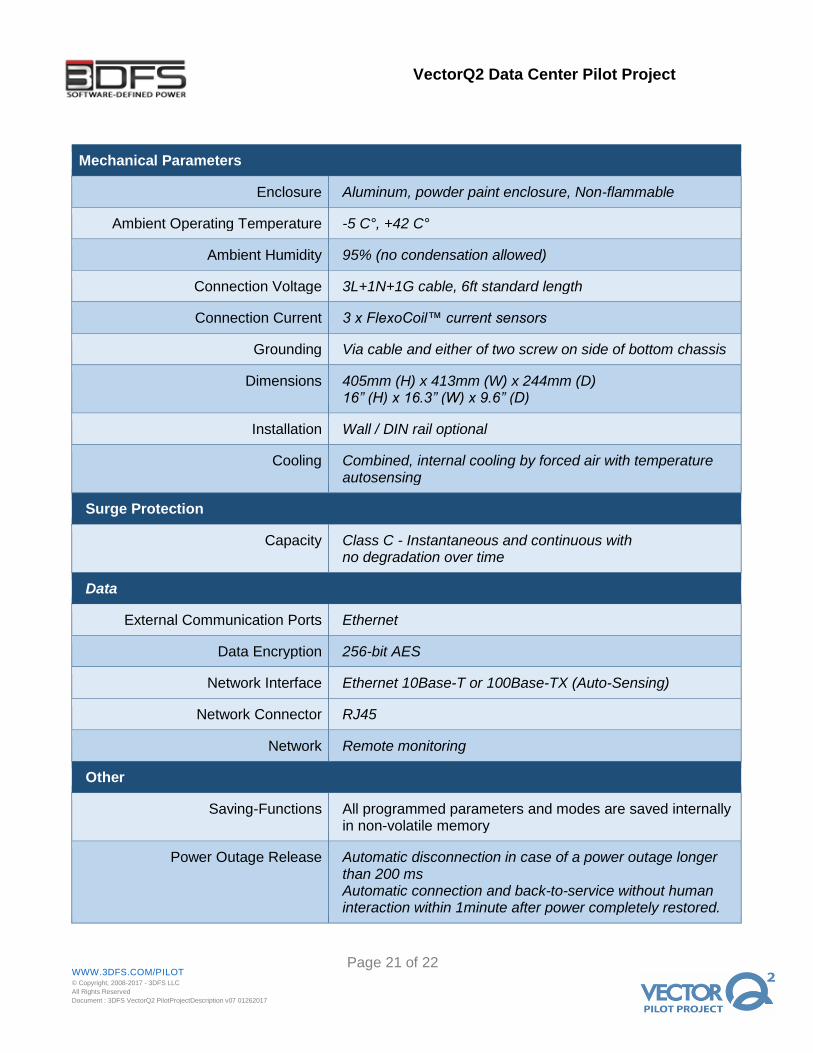
Mechanical Parameters
Enclosure Aluminum, powder paint enclosure, Non-flammable
Ambient Operating Temperature -5 C°, +42 C°
Ambient Humidity 95% (no condensation allowed)
Connection Voltage 3L+1N+1G cable, 6ft standard length
Connection Current 3 x FlexoCoil™ current sensors
Grounding Via cable and either of two screw on side of bottom chassis
Dimensions 405mm (H) x 413mm (W) x 244mm (D) 16” (H) x 16.3” (W) x 9.6” (D)
Installation Wall / DIN rail optional
Cooling Combined, internal cooling by forced air with temperature autosensing
Surge Protection
Capacity Class C - Instantaneous and continuous with no degradation over time
Data
External Communication Ports Ethernet
Data Encryption 256-bit AES
Network Interface Ethernet 10Base-T or 100Base-TX (Auto-Sensing)
Network Connector RJ45
Network Remote monitoring
Other
Saving-Functions All programmed parameters and modes are saved internally in non-volatile memory
Power Outage Release Automatic disconnection in case of a power outage longer than 200 ms Automatic connection and back-to-service without human interaction within 1minute after power completely restored.
WWW.3DFS.COM/PILOT © Copyright, 2008-2017 - 3DFS LLC
All Rights Reserved
Document : 3DFS VectorQ2 PilotProjectDescription v07 01262017
Page 22 of 22
VectorQ2 Data Center Pilot Project
Onboarding Qualification Form
Can be found at http://3dfs.com/pilot-q
Contact information:
3DFS Software-Defined Power
1911 NC HWY 902 W
Pittsboro, NC 27312
919.807.1884

VectorQ2 Data Center Pilot Project
Attachment A - How Demand Charges Double Utility Bills in Data Centers
VectorQ2 Data Center Pilot Project
Attachment B - Ground Currents in Data Center Environments