3D Printing Technology Introduction to 3D Printing 3D printing is a ...

Slide 1
3D Printing/ Process Parameters
Sung HaHanyang Structures and Composites Lab. (HSCL)
Dept. of Mechanical Engineering
Hanyang University, KOREAStanford Composite Design Team
June, 2016

Slide 2
3D Printing Technology
Design, Material & Process Parameters
• Nozzle movement system
• Material heating system
• Material feeding process
SLS - Selective laser sintering
(thermoplastics, metals, Ceramics)
FDM – Fused Deposition Modeling
(thermoplastics, ABS and Nylon)
3D Ink Jet Printing
LENS-Laser Engineering Net
Shaping (metal)
Items
Items
ItemsItemsMaterialItemsItemsMetal
PlasticsCeramics
ItemsProcess Parameters
ItemsItemsSpeed & path
ItemsItemsLoadings ItemsDesign
ItemsHeat Source

Slide 3
Optimal Design of Automotive Lower Arm, for 3D-Printing
60 % volumeTopology optimization
Conventional design
Constrained by manufacturing
Process,100 % volume

Slide 4
Conventional Process vs 3D Printing
Design, Material & Process Parameters
Items
Items
ItemsItemsMaterialItemsItemsMetal
PlasticsCeramics
ItemsProcess Parameters
ItemsItemsSpeed & path
ItemsItemsLoadings ItemsDesign
ItemsHeat Source
• Conventional Process
100 %
• 3D Printing
60 %
100 %+waste 60 %+0
Automotive Lower Arm
• Two aspects in saving materials in 3D printing:
1. In the design process; 2. In the printing process.
• For 3D printing, redesign to save more material.

Slide 5
The 3D in the 3D printing is 2D by 1D...
courtesy of APWorks, 2016
3D printing
• FDM, SLS, SLA, LENS, EBM,
InkJet, ...
• Enable to escape the constraints of
traditional production process...
May cause slow process and weak materials
Need to Optimize PROCESS PARAMETERS
• However, 3D in the 3D printing is
achieved by 2D multiplied by 1D.

Slide 6
Process parameters and Key Performance Indicators (KPI)
Items
Items
ItemsItemsMaterialItemsItemsMetal
PlasticsCeramics
ItemsProcess Parameters
ItemsItemsSpeed & path
ItemsItemsLoadings ItemsDesign
ItemsHeat Source
ItemsItemsProduction Rates
ItemsItemsDimensional Precision
ItemsItemsWaste & Scraps
ItemsItemsQuality of Product
Key Performance Indicators
• Nozzle path and speed
• Thermal heating & cooling
• Layering direction
Parts
Stiff & strong
Cycle time
High precision
Zero waste
Balance Process parameters
To achieve the best KPI
Slide 7
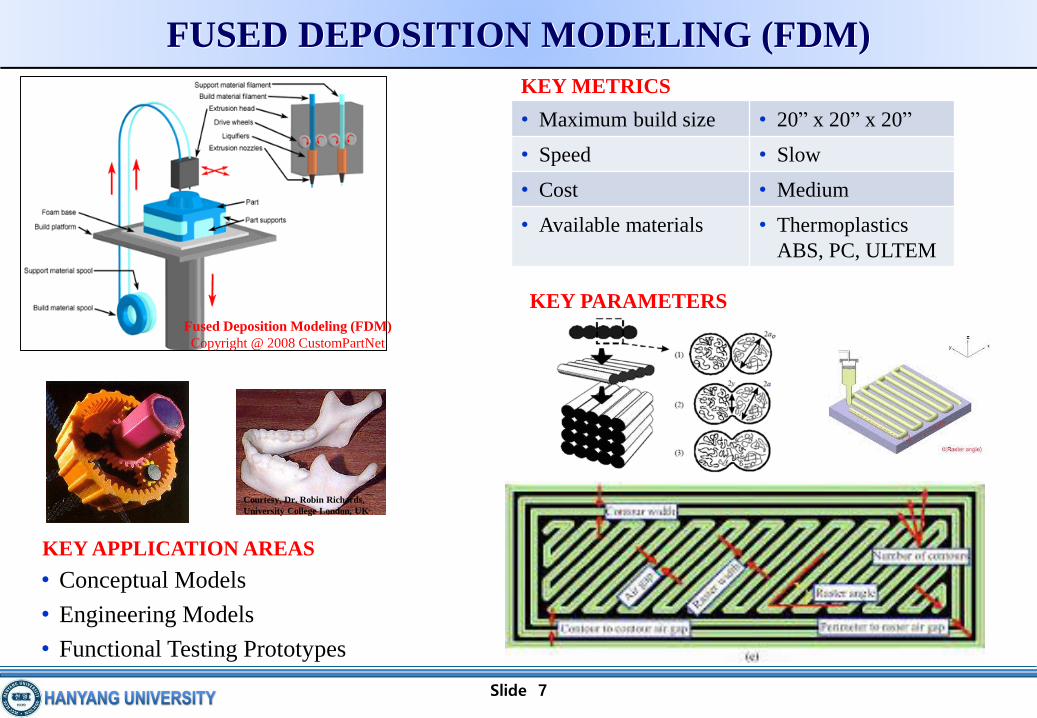
FUSED DEPOSITION MODELING (FDM)
KEY APPLICATION AREAS
• Maximum build size • 20” x 20” x 20”
• Speed • Slow
• Cost • Medium
• Available materials • Thermoplastics
ABS, PC, ULTEM
KEY METRICS
• Conceptual Models
• Engineering Models
• Functional Testing Prototypes
Fused Deposition Modeling (FDM)
Copyright @ 2008 CustomPartNet
Courtesy, Dr. Robin Richards,
University College London, UK
KEY PARAMETERS

Slide 8
Overall Process Parameters in FDM 3D printing
ref: Optimization of fused deposition modeling process parameters, 2015, Advances in Manufacturing
Cause and Effect Diagram
Concept Models
Topology
Optimization
STL File
Materials
FDM MachineEnvironmental
Factors
Temperature
Humidity
Part Build Orientation
Model build temp
Envelope temp
Machine calibration
Nozzle diameter
Z-direction
Y-direction
X-direction
Working Parameters
KEY PERFORMANCE
INDICATOR (KPI)
Raster angle
Raster width & gap
Part interior StylePart fill style
Layer thickness
Part shrinkageContour width & gap
x
y
z
Melt & Cool
Color
Density

Slide 9
Effects of Print Speed and Layer thickness on Coalescence
Influences of Print Speed and
Layer Thickness on
Coalescence in FDM
ref: alternate slicing and deposition strategies for FDM-Huang thesis
mm/sec mm/sec
coa
lesc
ence
coa
lesc
ence
The formation of bonds in the
FDM process is driven by the
thermal energy of the semi-
molten materials.
Print Speed Print Speed
Layer thickness =0.5 mm Layer thickness =1.0 mm
Co
ale
scen
ce
Co
ale
scen
ce

Slide 10
Effects of Build Orientation on Tensile Strength in FDM
MECHANICAL PROPERTIES OF FUSED DEPOSITION MODELING
PARTS MANUFACTURED WITH ULTEM*9085, ANTEC 2011, Boston
FLAT
UPRIGHT
ON-EDGE
Material: ULTEM 9085
0
10
20
30
40
50
60
70
80
90
ON-EDGE UPRIGHT FLAT
ULTIMATE TENSILE STRENGTH (MPa)
c1 c2 optimal
ON-EDGE UPRIGHT FLAT
default 1
default 2
Optimal
Machine settings
STRENGTH of INJECTION MOLDED (84 MPa)

Slide 11
SELECTIVE LASER SINTERING (SLS)
KEY APPLICATION AREAS
• Structural components
Maximum build size 700 mm x 380 mm x 560 mm
Speed Medium
Cost Medium
Available materials Powdered plastics (nylon),
metals (steel, titanium, tungsten),
ceramics (silicon carbide) and
fiber-reinforced PMCs
KEY METRICS
Metal Technology Co. 3D Systems
•A focused laser beam is used to fuse/sinter powder particles in a
small volume within the layer.
KEY PARAMETERS (Laser Source)
La
ser
Po
wer
(W
)
Exposure time
Point Distance

Slide 12
Process parameters in SLS
High-energy laser beam to fuse
metal (plastics or ceramic) powder
Laser Parameters Laser Power / Laser Energy
Spot Size
Scanning Speed
Scanning Mode
Interval Time
Exposure Time
Part Bed Temperature
Materials: TP, metal, Ceramics
Cause and Effect Diagram
Geometric Parameters Hatch Spacing
Scan Pattern
Layer Thickness
Building Direction
Part Orientation
Point Distance

Slide 13
Effects of SLS PROCESS PARAMETERS on Strength & Density
ET=92us, SP=87mm/sET=100us, SP=84.5mm/s
Exposure Time, length of time
when laser spots in one point
Point Distance, distance
between laser spots
Material: Direct Steel H20
SLS process parameters: Laser Power, Scanning speed, Exposure Time, Point Distance, etc
A. Stwora, G. Skrabalak, Influence of selected parameters of Selective Laser Sintering process on properties of
sintered materials, Journal of Achievements in Materials and Manufacturing Engineering 61/2 (2013) 375-380.
Co
mp
ress
ive
Str
eng
th (
MP
a)
Den
sity
• Effects of Point Distance
& Laser Power Output

Slide 14
Research Areas to improve 3D printing
• Multi-scale approach to select
best process parameters
Optimization of process parameters: raster angles and gaps; laser power, scanning
speed, exposure time, point distance, etc
• Measurement of mechanical attributes
for various process parameters
• Thermal-chemical-mechanical simulation
of material melting and cooling process
• Need to perform Topology
optimization considering material
anisotropy, layer direction
Need to develop Models for predicting the KPI in terms of Process Parameters
• Fiber reinforced composites

Slide 15
CONCLUSION: Integrated Processes to Achieve the best KPI
Tools 2-4Tools 2-3
Tools 2-1
Tools 2-2
Tools 2-5
Tools 1-2
Tools 1-1
Tools 1-3
Tools 3-1
Tools 3-2
Tools 3-3
Tools 3-4
• Integration of Design and Process Parameters
Items
Items
ItemsItemsMaterialItemsItemsMetal
PlasticsCeramics
ItemsProcess Parameters
ItemsItemsSpeed & path
ItemsItemsLoadings ItemsDesign
ItemsHeat Source
• Nozzle movement system
• Material heating system
• Material feeding process
Parts
Design, Material & Process Parameters Simulation Tools KPI
DetectionXSeverity OccurrenceX = RPN(Risk Priority Number)
ItemsItemsQuality of Product
ItemsItemsProduction Rates
ItemsItemsDimensional Precision
ItemsItemsWaste & Scraps
Key Performance Indicators
Stiff & strong
Cycle time
High precision
Zero waste
Balance Process parameters
To achieve the best KPI

Slide 16
Composites for 3D-printing
• Nanocomposites
• Short fibers
• Continuous fiber
• Long fibers
PlasticsNano fiber strengthen • Resin reinforced with
chopped carbon fiber is
placed layer by layer.
• Temperature difference and
cohesion between the
individual beads, resulting
in asymmetric shrinkage
and bending moments
To enhance material properties of 3D printing:
Develop a 3D printing of continuous-fiber composites


![The 3D printing ‘revolution’ · 3D printing ‘Bigger than internet’ FT 21.6.12 3D printing: ‘The PC all over again?’ Economist 1.12.12 ‘3D printing [..] has the potential](https://static.fdocuments.net/doc/165x107/5f08eac77e708231d42459a8/the-3d-printing-arevolutiona-3d-printing-abigger-than-interneta-ft-21612.jpg)