3D open-pit mining model(ing) of drill-holes-prospected ... · 3D open-pit mining model(ing) of...
10
1 3D open-pit mining model(ing) of drill-holes-prospected ore-bodies Bruno Manuel Prates Catarino, Instituto Superior Técnico. Abstract The exploitation of mineral deposits requires the creation of representative models, involving their lithological, structural, geometric, mineralogical, physical and chemical characteristics, as well as the distribution of ore grades and their spatial relationships inside the ore-body. This article will present a short review of the fundamental concepts of the various steps taken in the preparation of these models as well as an illustration of the practical application of these procedures through the use of appropriate software (Rockworks 14). Thus, the modeling of a small area belonging to the iron ore deposit of Mua (Moncorvo) was conducted by a three-dimensional array of blocks, with the purpose of developing their geological model, followed by the mineral inventory and subsequent determination of their economically exploitable reserves in an open-pit mine. This was made by using the floating cone mathematical algorithm in order to determine the optimum pit, taking into account the constraints of a certain cut-off grade and safe excavation bench slope angles at the end of mining. The obtained results for mineral inventory data (a geological resource of 36.37 Mt with 43.0% Fe and 0.43 % P), and economic mineable reserve (15.4 Mt with 43.55% Fe and 0.41% P) are showing that the models developed for that study area reflect the general characteristics of the deposit and are consistent with the available information taken from past reports on the economic feasibility of that mining project. Keywords: Three-dimensional array of blocks; Geological model; Mineral inventory; Economically exploitable reserves; Floating cone method; Optimum pit. 1 – INTRODUCTION The geological reconnaissance of a mineral deposit can be materialized by models of various types (Gama, 1974). Thus, the initial problem relates to the development of an appropriate model for the mineralized body, which is based on information gathered through geological exploration techniques, of which the drill-holes (and their lithological, chemical and physical analyzes) are the most common sources of information. The creation of a three-dimensional model of a mineral deposit is a common aspect with regard to the assessment of their possible economic potential (Sinclair & Blackwell, 2002). According with Barnes (1980) evaluation process is based on several fundamental aspects: a) Geographic and geological situation; b) Three-dimensional geometry and average content of the deposit; c) Spatial distribution of grades within the deposit; d) Constraints (political, environmental, technical, etc.). This process usually ends with an economic feasibility study in order to answer questions concerning financial aspects about the possibility of opening a mine. Therefore, the feasibility study is essential to determine if ore can be extracted in a cost-effective way in such a deposit. 2 – MAJOR STEPS INVOLVED IN EVALUATION AND ECONOMIC FEASIBILITY STUDY OF A MINERAL DEPOSIT Fig. 1 illustrates the key steps to carry out the evaluation and economic feasibility study of a mineral deposit. According to that figure the first steps to be accomplished are concerned with mapping and sampling the mineral deposit. Sampling can be done directly by means of drill-holes or other methods, (such as trenches, wells, galleries, etc.) depending, for example, on the specific site characteristics. When using drill-holes, usually logs are made in order to give information about the lithological types drilled and the grades corresponding to the intersected mineralization. This kind of data is fundamental to all of the subsequent steps involved in the process of a mineral deposit appraisal (Barnes, 1980).
Transcript of 3D open-pit mining model(ing) of drill-holes-prospected ... · 3D open-pit mining model(ing) of...

1
3D open-pit mining model(ing) of drill-holes-prospected ore-bodies
Bruno Manuel Prates Catarino, Instituto Superior Técnico.
Abstract
The exploitation of mineral deposits requires the creation of representative models, involving their lithological, structural, geometric, mineralogical, physical and chemical characteristics, as well as the distribution of ore grades and their spatial relationships inside the ore-body. This article will present a short review of the fundamental concepts of the various steps taken in the preparation of these models as well as an illustration of the practical application of these procedures through the use of appropriate software (Rockworks 14). Thus, the modeling of a small area belonging to the iron ore deposit of Mua (Moncorvo) was conducted by a three-dimensional array of blocks, with the purpose of developing their geological model, followed by the mineral inventory and subsequent determination of their economically exploitable reserves in an open-pit mine. This was made by using the floating cone mathematical algorithm in order to determine the optimum pit, taking into account the constraints of a certain cut-off grade and safe excavation bench slope angles at the end of mining. The obtained results for mineral inventory data (a geological resource of 36.37 Mt with 43.0% Fe and 0.43 % P), and economic mineable reserve (15.4 Mt with 43.55% Fe and 0.41% P) are showing that the models developed for that study area reflect the general characteristics of the deposit and are consistent with the available information taken from past reports on the economic feasibility of that mining project.
Keywords: Three-dimensional array of blocks; Geological model; Mineral inventory; Economically exploitable reserves; Floating cone method; Optimum pit.
1 – INTRODUCTION
The geological reconnaissance of a mineral deposit can be materialized by models of various types (Gama, 1974). Thus, the initial problem relates to the development of an appropriate model for the mineralized body, which is based on information gathered through geological exploration techniques, of which the drill-holes (and their lithological, chemical and physical analyzes) are the most common sources of information. The creation of a three-dimensional model of a mineral deposit is a common aspect with regard to the assessment of their possible economic potential (Sinclair & Blackwell, 2002). According with Barnes (1980) evaluation process is based on several fundamental aspects: a) Geographic and geological situation; b) Three-dimensional geometry and average content of the deposit; c) Spatial distribution of grades within the deposit; d) Constraints (political, environmental, technical, etc.). This process usually ends with an economic feasibility study in order to answer questions concerning financial aspects about
the possibility of opening a mine. Therefore, the feasibility study is essential to determine if ore can be extracted in a cost-effective way in such a deposit.
2 – MAJOR STEPS INVOLVED IN EVALUATION AND ECONOMIC FEASIBILITY STUDY OF A MINERAL DEPOSIT
Fig. 1 illustrates the key steps to carry out the evaluation and economic feasibility study of a mineral deposit. According to that figure the first steps to be accomplished are concerned with mapping and sampling the mineral deposit. Sampling can be done directly by means of drill-holes or other methods, (such as trenches, wells, galleries, etc.) depending, for example, on the specific site characteristics. When using drill-holes, usually logs are made in order to give information about the lithological types drilled and the grades corresponding to the intersected mineralization. This kind of data is fundamental to all of the subsequent steps involved in the process of a mineral deposit appraisal (Barnes, 1980).

2
Fig. 1 – Mineral evaluation flowsheet: phases of mineral appraisal and feasibility (after Barnes, 1980). The data from each drill-hole (grades) has to be worked on through a process called composition, in which the sample values are weighted together in a logical sequence, so that they represent a specific thickness of the mineralized body. For example, in an open pit mine, the range of composition is usually corresponding to the height of the benches in the future excavation (Gama, 1986 b).
On the next stage, composite values determined for each drill-hole are used in order to give the grades to the volume of rock surrounding them. In Fig. 1, this step is called extension. The transfer of values derived from drill-holes, with a particular spacing between them, to a geometrically regular mesh composed of three-dimensional blocks, which in turn cover the entire volume of the deposit, is the more complicated and sensitive stage of the whole evaluation process (Barnes, 1980). This difficulty does not relate to the use of the extension method itself, but aims to obtain realistic estimates for each block, according to the always limited number of samples provided by drilling campaigns.
Before the development of computers the so-called classical (or manual) techniques such as the method of polygons, rectangles, triangles, sections, etc., were the most commonly used extension methodologies. The speed of process computers have brought to this (and other) area, combined with its ability to represent a more accurate and sophisticated distributions of the grades occurring in mineral
deposits meant that its use became increasingly widespread within the mining community (Revuelta & Jimeno, 1997).
The weighted sum of several blocks (into which grades are assigned through extension techniques) was given the designation of mineral reserves. However, in most cases, the most correct is to consider this sum as a mineral inventory (or geological resources) (Sinclair & Blacwell, 2002). The term mineral reserve implies that the ore in situ can be exploited in an economically profitable way (Barnes, 1980). Therefore, the fact of being economically exploited means that an appropriate mining method is necessary: here lies the difference between mineral reserve and mineral inventory (Sinclair & Blacwell, 2002). The mineral inventory is thus a representation of the mineralized blocks defined by an extension function which may or may not be submitted to a mining operation (Gama, 1974). For example, a mineral inventory can represent a number of mineralized blocks greater than those that are capable to be extracted in practice (Barnes, 1980).
The conversion of mineral inventory into mineral reserve (or of geological resource into economically exploitable reserve) is a problem that mine planning constantly faces. Mainly in open pit workings, it cannot be said that there is only one solution to this problem, since there are numerous possibilities to design an

3
exploration of this kind (Sinclair & Blacwell, 2002).
Each project will have its own grade vs. tonnage ratios, corresponding to exploration of the deposit. Taking into account the numerous design possibilities for the same deposit, the various grade vs. tonnage ratios will allow the determination of the amount and quality inherent to that deposit with a satisfactory degree of certainty, and therefore, the economic benefit that can be obtained. With such data, and knowing those mineralized blocks that can be extracted in a cost-effective way, it becomes possible to optimize the production process, in order to ensure the recovery of ore at high grades, allowing the return on investment. This is crucial in the early years of a mine, since the aim is to reduce the time of return on investment in order to make possible (in a relative short period of time) the mining project itself (Barnes, 1980).
3 – CASE STUDY
The developed case study aims the practical application of concepts discussed in previous chapter, taking as starting point a pre-feasibility study (made thirty years ago) on the economic exploitation of Cabeço da Mua (Moncorvo, Portugal) iron ore deposit. Thus, the challenge was to try to "modernize" that study using computer tools. In this case, the software used was Rockworks 14.
3.1 – Available data and collected data
The available information to develop this case study includes the following elements:
• Geological Report, which is part of the pre-feasibility study prepared jointly by FERROMINAS, SA and LKAB International;
• Logs from 7 drill-holes made in 1961/62, with information about their spatial coordinates, reached depth, crossed lithologies and laboratory results carried out on samples taken from the borehole.
Several other data was collected In order to complete that information:
• Satellite image covering the studied area;
• Elevation points, in order to generate the topography of the area;
• Several bibliographic elements about the iron deposit of Cabeço da Mua.
3.2 – Methodology
Fig. 2 summarizes the methodological procedures adopted to work on the data in order to get the expected results and consequent interpretations.
3.3 – Study area
The study area is placed in Cabeço da Mua iron ore-body, which is located east of Torre de Moncorvo (Trás-os-Montes, Bragança district, Portugal) (Fig. 3). This ore-body was prospected by drill-holes in two different campaigns (in 1961/62 and again in 1979/80). The study area is shown in Fig. 4.
3.3.1 – Geology: general features
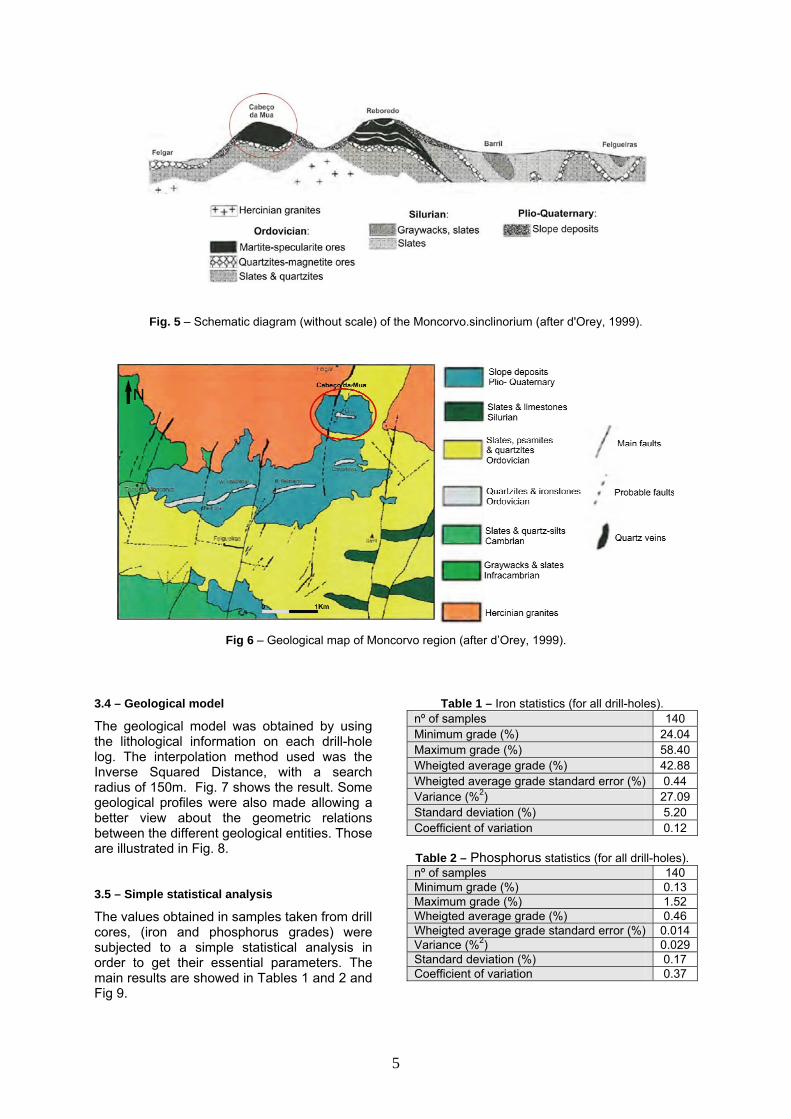
According to Ribeiro & Rebelo (1971), this ore-body was originated in a detritic environment and is an asymmetric syncline (Fig. 5), the axial plane oriented approximately E – W, which represents an Ordovician stratigraphic unit composed mainly by iron-rich quartzites (Fig. 6) whose total thickness exceeds 90m (d’Orey, 1999). The slopes in Cabeço da Mua are covered by deposits of considerable thickness composed mainly of quartz and shale pebbles originated by weathering and decomposition of iron ore lithologies, (d’Orey, 1999).
According with mineralogical and textural aspects, three types of ore were identified (d’Orey, 1999): compact ore (magnetite and quartzite); granular ore (martite and specularite) and limonitic ore, the second one being the most important in terms of quantity. The iron and phosphorous average grades (approximately 44% Fe and 0.5% P) where determined in past studies about the economical feasibility on this deposit.

4
Fig. 2 – Methodological procedures (main steps).
Fig. 3 – Localization of the study area.
Fig. 4 – Localization of drill-holes at Cabeço da Mua iron ore-body (blue: 1961/62 campaign, red: 1978/79
campaign) and delimitation of the study area.
5
Fig. 5 – Schematic diagram (without scale) of the Moncorvo.sinclinorium (after d'Orey, 1999).
Fig 6 – Geological map of Moncorvo region (after d’Orey, 1999).
3.4 – Geological model
The geological model was obtained by using the lithological information on each drill-hole log. The interpolation method used was the Inverse Squared Distance, with a search radius of 150m. Fig. 7 shows the result. Some geological profiles were also made allowing a better view about the geometric relations between the different geological entities. Those are illustrated in Fig. 8.
3.5 – Simple statistical analysis
The values obtained in samples taken from drill cores, (iron and phosphorus grades) were subjected to a simple statistical analysis in order to get their essential parameters. The main results are showed in Tables 1 and 2 and Fig 9.
Table 1 – Iron statistics (for all drill-holes). nº of samples 140 Minimum grade (%) 24.04 Maximum grade (%) 58.40 Wheigted average grade (%) 42.88 Wheigted average grade standard error (%) 0.44 Variance (%2) 27.09 Standard deviation (%) 5.20 Coefficient of variation 0.12
Table 2 – Phosphorus statistics (for all drill-holes). nº of samples 140 Minimum grade (%) 0.13 Maximum grade (%) 1.52 Wheigted average grade (%) 0.46 Wheigted average grade standard error (%) 0.014 Variance (%2) 0.029 Standard deviation (%) 0.17 Coefficient of variation 0.37

6
The results show that there is a relative small variation of grade values in both elements. The average grades obtained are according with the information taken from the available geological report. In that report is also written that there is no correlation between iron and phosphorous grades inside the deposit. In
order to confirm that fact, correlation graphics were made and the results obtained were consentaneous with that information. In conclusion, it can be assumed that the dispersion of those elements among the deposit have no kind of preferential direction.
Fig. 7 – Geological model.
Fig. 8 – Geological profiles.

7
Fig. 9 – Histograms for iron (left side) and phosphorous (right side).
3.6 – Mineral Inventory (geological resources)
The creation of the Mineral Inventory followed a series of steps. In the first one a three-dimensional mesh of blocks (Fig. 10) was established. After that was made the composition of the samples in each drillhole log. For that it was adopted a 10m interval length which is equal to the height of the benches in the future open pit mine. Therefore, the extension of the samples to blocks was made from their new composite values. The interpolation method used to estimate iron and phosphorus grades in each block was also the Inverse Squared Distance (search radius = 150m). The results are shown in Fig. 11.
The Mineral Inventory (geological resources) obtained is composed by the total tonnage of ore and its iron and phosphorous grade (see Table 3). These resources are considered measured because the error of estimation was very small (0.02%).
Knowing the phosphorous content is an important issue because this element is a contaminant of iron which is a serious problem during its subsequent metallurgical processing.
Table 3 –Geological resources.
Total tonnage of ore (material density = 3.83 t/m3) 36 371 840 t
Iron average grade 43.0 % Phosphorous average grade 0.43 %
3.7 – Economic mineable reserve
Before getting the economic mineable reseve a cut-off grade was established as well as a safe excavation bench slope angles at the end of mining. The first one was calculated through the well known equation:
Production costs ($ / t )oreCut - off grade = Mill efficiency × Selling price ($ / t )Fe
Production cost = 40 $ / t oreMill efficiency = 0.9Selling price = 120 $ / tFe
= 0.37 = 40
Cut - off grade = 0.9 × 120
37%
The geometry of the pit is a function of the overall bench excavation slope angle at the end of mining (among other several and not less important factors). In this case the value adopted was the same presented in the available geological report ie 35º.
To get the economic mineable reserve is also necessary the use of a technique that choose the subset of blocks to extract according to the numbers above (cut-off grade of 37% Fe and overall slope angle = 35º) to generate the so-called optimal pit. The software (Rockworks 14) only permits the use of the floating cone technique. Table 4 shows the main geometric characteristics of the open pit mine obtained with such a technique.
Table 4 – Geometric characteristics of the open pit
mine. Superficial area (m2) 107 500
Last level elevation (m) 780 Overall slope angle 35º Bench height (m) 10
Overall bench slope ≈ 45º nº of benches 10
The ore that can be extracted with such excavation geometry (see Fig. 12) and their values in terms of total tonnage with a certain iron and phosphorous average grade (see

8
Table 5) are the economically exploitable reserves in the studied area. These reserves were considered proven, because the standard error of estimation was almost insignificant (<1%).
The resulting profit with this small exploitation is 108.28 M$ and it was calculated taking in account the production cost as well as the sailing price and mill efficiency.
Table 5 – Economically exploitable reserve. Total tonnage of ore
(material density = 3.83 t/m3) 15 394 398 t
Iron average grade 43.55 % Phosphorous average grade 0.41 %
Striping ratio (t/t) 0.37/1
Fig. 10 – Three-dimensional array of blocks adopted.
Fig. 11 – Iron (total iron, FeT) and phosphorous (P) grade distributions inside the studied area (up: iron; down: phosphorous).

9
Fig. 12 – A: topographic map of the open pit at the end of exploitation; B: three – dimensional view of the open pit; C: representation of the total exploitable amount of ore.
4 – CONCLUSIONS & FURTHER DEVELOPMENTS
The models presented in this paper are only approaches to reality since they deal with estimations of something that will only be known in detail after exploitation takes place. Hence the interaction between theoretical predictions and the information obtained during industrial extraction is considered essential to make the necessary adjustments in order to minimize the differences between those estimations and the real tonnage and grades values obtained during mining practice.
However, it is very important to improve the acquired knowledge trying to search for results more detailed and reliable as possible. This can only be achieved by obtaining more and better data about the variables we want to know in a rigorous way which should be incorporated in those models built in order to complement them in terms of quality.
This should be taken into account in any future work on the iron deposit of Cabeço da Mua. Therefore, the results obtained in this case study require confirmation in a larger scale when supplemented by further available exploration and recognition data. Only then is possible to create a new mineral inventory and to determine accurately its economically exploitable reserves. In this sense, as future lines of research on the topic, it’s suggested:
• Completion of the database used in this study with information from the test of available logs made after 1961/62;
• Get more data from a future drill-hole campaign whose implementation will soon be made;
• Scrutiny of the various computer programs (available on market) to determine the optimum pit in opencast, searching for those whose performance is more consistent with data from direct/real observation.
5 – ACKNOWLEDGMENTS
The author would like to thank Dr. Carlos Dinis da Gama, Dr. Xie Qiang (University of Chongqing, China), Dr. Acúrcio Parra (INETI), Dr. Antero Ferreira da Silva, Dr. Duarte Soares and Eng. Pedro Correia, for friendship and support.
6 – REFERENCES
Barnes M. P. (1980), Computer-Assisted Mineral Appraisal and Feasibility. Society of Mining Engineers, American Institute of Mining, Metallurgical and Petroleum Engineers, Inc. New York, 167 p.
d’Orey, F. L. C. (1999), The detrital origin of the Moncorvo ordovician ironstones. Centro de Estudos Geológicos, Departamento de Ciências da Terra, Faculdade de Ciências e Tecnologia. Caparica, Portugal. nº 13, 131 – 140 pp.

10
FERROMINAS,E.P; LKAB INTERNATIONAL, A.B. & SCANDIACONSULT, A.B., Geological Report. Moncorvo Iron Ore Project. Feasibility Study, volume III. 71p.
Gama, C.A.J.V.D., et al (1986,b), Programas para microcomputadores utilizáveis em pequenas e médias empresas do sector mineral. Programa de Desenvolvimento de Recursos Minerais – Pró Minério. Secretaria da Indústria, Comércio, Ciência e Tecnologia do Estado de São Paulo – Sicct. São Paulo. 73-77 pp. Gama, C. A. J. V. D. (1974), Modelo computacional de uma exploração mineira. IV Simpósio Brasileiro de Mineração, Revista “Geologia e Metalurgia”, nº 35, São Paulo. 289 – 324 pp.
Revuelta M.B. & Jimeno C.L. (1997), Manual de Evaluación y Diseño de Explotaciones Mineras. Entorno Gráfico, S.L., Madrid, 705 p.
Ribeiro, A.R. & Rebelo, J.L.A. (1971), Estudo geológico da região de Moncorvo e em especial do seu jazigo de ferro. I Congresso. Hispano-Luso-Americano de Geologia Económica. Tomo II, secção 4: Investigação Mineira. 983-994 pp.
Sinclair A.J. & Blackwell G.H. (2002), Applied Mineral Inventory Estimation. Cambridge University Press, 381p.