3D MRI of impaired hyperpolarized 129 Xe uptake in a rat model of...
13
3D MRI of impaired hyperpolarized 129 Xe uptake in a rat model of pulmonary fibrosis Zackary I. Cleveland a† , Rohan S. Virgincar a,b , Yi Qi a , Scott H. Robertson a,c , Simone Degan a,d and Bastiaan Driehuys a,b,c * A variety of pulmonary pathologies, in particular interstitial lung diseases, are characterized by thickening of the pulmonary blood–gas barrier, and this thickening results in reduced gas exchange. Such diffusive impairment is challenging to quantify spatially, because the distributions of the metabolically relevant gases (CO 2 and O 2 ) cannot be detected directly within the lungs. Hyperpolarized (HP) 129 Xe is a promising surrogate for these metabolic gases, because MR spectroscopy and imaging allow gaseous alveolar 129 Xe to be detected separately from 129 Xe dissolved in the red blood cells (RBCs) and the adjacent tissues, which comprise blood plasma and lung interstitium. Because 129 Xe reaches the RBCs by diffusing across the same barrier tissues (blood plasma and interstitium) as O 2 , barrier thickening will delay 129 Xe transit and, thus, reduce RBC-specific 129 Xe MR signal. Here we have exploited these properties to generate 3D, MR images of 129 Xe uptake by the RBCs in two groups of rats. In the experimental group, unilateral fibrotic injury was generated prior to imaging by instilling bleomycin into one lung. In the control group, a unilateral sham instillation of saline was performed. Uptake of 129 Xe by the RBCs, quantified as the fraction of RBC signal relative to total dissolved 129 Xe signal, was significantly reduced (P = 0.03) in the injured lungs of bleomycin- treated animals. In contrast, no significant difference (P = 0.56) was observed between the saline-treated and untreated lungs of control animals. Together, these results indicate that 3D MRI of HP 129 Xe dissolved in the pulmo- nary tissues can provide useful biomarkers of impaired diffusive gas exchange resulting from fibrotic thickening. Copyright © 2014 John Wiley & Sons, Ltd. Keywords: gas exchange; xenon-129; interstitial lung disease; diffusion impairment; Dixon imaging; chemical shift; IPF; ILD INTRODUCTION Under most circumstances, the exchange of metabolic gases (i.e. CO 2 and O 2 ) in the lungs is determined by pulmonary ventilation (V) and perfusion (Q) (1). Because both of these components of lung function vary spatially, it is increasingly recognized that the regional heterogeneity of V and Q and also the matching of the V and Q distributions must be characterized to fully understand pulmonary physiology in health and disease (2). To this end MR imaging – which is non-invasive, delivers no ionizing radiation, and benefits from an abundance of contrast mechanisms – has emerged as a viable modality for imaging both ventilation (3) and perfusion (4). However, circumstances can arise in which gas exchange is limited not by V/Q matching, but rather by the diffusive processes that couple ventilation and perfusion. In particular, gas exchange is impaired in a variety of pathological conditions, collectively referred to as interstitial lung disease (ILD). In ILD, the interstitial tissues between the alveoli and the capillary blood become thickened by inflammation and fibrosis, increasing the physical barrier to gas diffusion (5). Moreover, inflammation and fibrosis can be spatially heterogeneous in these disorders (6), and, like ventilation and perfusion abnormalities, the diffusive abnormalities resulting from ILD are also expected to be spatially heterogeneous. Thus, diagnosing and characterizing diffusive abnormalities in ILD, as well as assessing potential therapies, will likely require functional imaging. Unfortunately, visualizing regional diffusion impairment is exceedingly challenging for two reasons: 1) interstitial thickening occurs on the scale of micrometers (well below the resolution of current, in vivo imaging modalities), and 2) CO 2 and O 2 within the lungs cannot be imaged directly. It is therefore necessary to * Correspondence to: B. Driehuys, Center for In Vivo Microscopy, Department of Radiology, Duke University Medical Center, Durham, NC, USA. E-mail: [email protected] a Z. I. Cleveland, R. S. Virgincar, Y. Qi, S. H. Robertson, S. Degan, B. Driehuys Center for In Vivo Microscopy, Department of Radiology, Duke University Med- ical Center, Durham, NC, USA b R. S. Virgincar, B. Driehuys Department of Biomedical Engineering, Duke University, Durham, NC, USA c S. H. Robertson, B. Driehuys Graduate Program in Medical Physics, Duke University Medical Center, Dur- ham, NC, USA d S. Degan Center for Molecular and Biomolecular Imaging, Duke University, Durham, NC, USA † Present Address: Center for Pulmonary Imaging Research, Cincinnati Children’s Hospital Medical Center, Cincinnati, OH, USA Abbreviations used: CV, coefficient of variation; D L , diffusing capacity of the lung; D M , membrane diffusing capacity of the lung; Δf, frequency difference between red blood cell and barrier tissue resonances of dissolved 129 Xe; Δφ, phase difference between red blood cell and barrier tissue resonances of 129 Xe; FOV, field of view; HP, hyperpolarized; ILD, interstitial lung disease; IP, in- traperitoneal; LPS, lipopolysaccharide; RBC, red blood cell; T E90 , nominal echo time needed for RBC and barrier tissue resonances to achieve a 90° phase sep- aration; UTE, ultra-short echo time; XTC, xenon polarization transfer contrast. Special issue research article Received: 03 December 2013, Revised: 17 February 2014, Accepted: 31 March 2014, Published online in Wiley Online Library (wileyonlinelibrary.com) DOI: 10.1002/nbm.3127 NMR Biomed. 2014 Copyright © 2014 John Wiley & Sons, Ltd.
Transcript of 3D MRI of impaired hyperpolarized 129 Xe uptake in a rat model of...

3D MRI of impaired hyperpolarized 129Xeuptake in a rat model of pulmonary fibrosisZackary I. Clevelanda†, Rohan S. Virgincara,b, Yi Qia, Scott H. Robertsona,c,Simone Degana,d and Bastiaan Driehuysa,b,c*
A variety of pulmonary pathologies, in particular interstitial lung diseases, are characterized by thickening of thepulmonary blood–gas barrier, and this thickening results in reduced gas exchange. Such diffusive impairment ischallenging to quantify spatially, because the distributions of the metabolically relevant gases (CO2 and O2) cannotbe detected directly within the lungs. Hyperpolarized (HP) 129Xe is a promising surrogate for these metabolic gases,because MR spectroscopy and imaging allow gaseous alveolar 129Xe to be detected separately from 129Xe dissolvedin the red blood cells (RBCs) and the adjacent tissues, which comprise blood plasma and lung interstitium. Because129Xe reaches the RBCs by diffusing across the same barrier tissues (blood plasma and interstitium) as O2, barrierthickening will delay 129Xe transit and, thus, reduce RBC-specific 129Xe MR signal. Here we have exploited theseproperties to generate 3D, MR images of 129Xe uptake by the RBCs in two groups of rats. In the experimental group,unilateral fibrotic injury was generated prior to imaging by instilling bleomycin into one lung. In the control group, aunilateral sham instillation of saline was performed. Uptake of 129Xe by the RBCs, quantified as the fraction of RBCsignal relative to total dissolved 129Xe signal, was significantly reduced (P=0.03) in the injured lungs of bleomycin-treated animals. In contrast, no significant difference (P=0.56) was observed between the saline-treated anduntreated lungs of control animals. Together, these results indicate that 3D MRI of HP 129Xe dissolved in the pulmo-nary tissues can provide useful biomarkers of impaired diffusive gas exchange resulting from fibrotic thickening.Copyright © 2014 John Wiley & Sons, Ltd.
Keywords: gas exchange; xenon-129; interstitial lung disease; diffusion impairment; Dixon imaging; chemical shift; IPF; ILD
INTRODUCTION
Under most circumstances, the exchange of metabolic gases(i.e. CO2 and O2) in the lungs is determined by pulmonaryventilation (V) and perfusion (Q) (1). Because both of thesecomponents of lung function vary spatially, it is increasinglyrecognized that the regional heterogeneity of V and Q and alsothe matching of the V and Q distributions must be characterizedto fully understand pulmonary physiology in health and disease(2). To this end MR imaging – which is non-invasive, delivers noionizing radiation, and benefits from an abundance of contrastmechanisms – has emerged as a viable modality for imagingboth ventilation (3) and perfusion (4).However, circumstances can arise in which gas exchange is
limited not by V/Q matching, but rather by the diffusiveprocesses that couple ventilation and perfusion. In particular,gas exchange is impaired in a variety of pathological conditions,collectively referred to as interstitial lung disease (ILD). In ILD, theinterstitial tissues between the alveoli and the capillary bloodbecome thickened by inflammation and fibrosis, increasing thephysical barrier to gas diffusion (5). Moreover, inflammationand fibrosis can be spatially heterogeneous in these disorders(6), and, like ventilation and perfusion abnormalities, thediffusive abnormalities resulting from ILD are also expected tobe spatially heterogeneous. Thus, diagnosing and characterizingdiffusive abnormalities in ILD, as well as assessing potentialtherapies, will likely require functional imaging.Unfortunately, visualizing regional diffusion impairment is
exceedingly challenging for two reasons: 1) interstitial thickening
occurs on the scale of micrometers (well below the resolution ofcurrent, in vivo imaging modalities), and 2) CO2 and O2 withinthe lungs cannot be imaged directly. It is therefore necessary to
* Correspondence to: B. Driehuys, Center for In Vivo Microscopy, Department ofRadiology, Duke University Medical Center, Durham, NC, USA.E-mail: [email protected]
a Z. I. Cleveland, R. S. Virgincar, Y. Qi, S. H. Robertson, S. Degan, B. DriehuysCenter for In Vivo Microscopy, Department of Radiology, Duke University Med-ical Center, Durham, NC, USA
b R. S. Virgincar, B. DriehuysDepartment of Biomedical Engineering, Duke University, Durham, NC, USA
c S. H. Robertson, B. DriehuysGraduate Program in Medical Physics, Duke University Medical Center, Dur-ham, NC, USA
d S. DeganCenter for Molecular and Biomolecular Imaging, Duke University, Durham, NC,USA
† Present Address: Center for Pulmonary Imaging Research, Cincinnati Children’sHospital Medical Center, Cincinnati, OH, USA
Abbreviations used: CV, coefficient of variation; DL, diffusing capacity of thelung; DM, membrane diffusing capacity of the lung; Δf, frequency differencebetween red blood cell and barrier tissue resonances of dissolved 129Xe; Δφ,phase difference between red blood cell and barrier tissue resonances of129Xe; FOV, field of view; HP, hyperpolarized; ILD, interstitial lung disease; IP, in-traperitoneal; LPS, lipopolysaccharide; RBC, red blood cell; TE90, nominal echotime needed for RBC and barrier tissue resonances to achieve a 90° phase sep-aration; UTE, ultra-short echo time; XTC, xenon polarization transfer contrast.
Special issue research article
Received: 03 December 2013, Revised: 17 February 2014, Accepted: 31 March 2014, Published online in Wiley Online Library
(wileyonlinelibrary.com) DOI: 10.1002/nbm.3127
NMR Biomed. 2014 Copyright © 2014 John Wiley & Sons, Ltd.

develop approaches based on non-metabolic, surrogate gases thatare more amenable to imaging and possess physical propertiesthat can be used to probe micrometer-scale barrier thickening. Aparticularly promising candidate for imaging impaired gas-exchange is HP 129Xe, which is well tolerated by human subjects(7,8) and has already demonstrated utility for MR imaging ofpulmonary microstructure (9–11) and ventilation (12–15).
Immediately after being inhaled, 129Xe begins to diffuse into thegas-exchange tissues and displays three distinct resonance peaksassociated with 1) gaseous 129Xe (by convention referenced to0ppm), 2) 129Xe dissolved in the RBCs (~211ppm in rats), and 3)129Xe dissolved in adjacent blood plasma and interstitial tissues(197pm), which are collectively referred to here as “barrier tissues.”Importantly for investigating diffusive gas exchange, the timescaleat which non-equilibrium HP 129Xe magnetization is detectedas it dissolves into the gas-exchange tissues can be variedfrom milliseconds to seconds, with additional peaks from129Xe dissolved in extrapulmonary tissues appearing atsufficiently long times (16,17). Therefore, using appropriateMR techniques, the HP 129Xe signal can be made sensitiveto either pulmonary perfusion (second-timescale dynamics)or tissue-level diffusion (millisecond-timescale dynamics),depending on the experimental conditions.
These unique spectral properties have previously beenexploited to visualize the spatial distribution of diffusive gasexchange both indirectly, using a technique called xenon polar-ization transfer contrast (XTC) (18,19), and directly, by imagingHP 129Xe magnetization as it dissolves into the gas-exchangetissues (20–22). When the dynamics of these dissolutionprocesses are examined spectroscopically, HP 129Xe affords theopportunity to probe global microstructural details, such as thesurface-to-volume ratio of the gas-exchange region and septalthickness (23,24). However, even more detailed information canbe extracted by spatially separating the total dissolved HP129Xe signal into spectral components arising from 129Xedissolved in the RBCs and barrier tissues. The advantage ofspectrally separating the dissolved signal into RBC and barriercomponents was previously demonstrated in rats withbleomycin-induced lung injury using a 2D MRI acquisition (25).
Here we take advantage of the ~330Hz separating the 129Xe-RBC and 129Xe-barrier tissue peaks to extend this approach inrats to three dimensions using a one-point variant of the Dixontechnique (26). By essentially combing the information that canbe obtained from 129Xe spectroscopy with spatial informationprovided by 129Xe imaging, this approach provides new avenuesfor quantifying gas-exchange impairment. Further, we examineseveral quantitative metrics to characterize these dissolved129Xe images, and demonstrate that one of these metrics is apromising candidate biomarker for impaired gas exchangecaused by fibrotic injury.
BACKGROUND
Diffusing capacity of the lung
From the standpoint of classical pulmonary physiology, it may besurprising that a chemically inert gas such as HP 129Xe could besensitive to impaired gas exchange, because it is uniformlytaught that the conventional metric of gas uptake, the diffusingcapacity of the lung (DL), can only be measured by reactive gasessuch as CO (1,27). More specifically, the amount of gas taken upby the pulmonary tissues, conventionally given in terms of gas
volume at standard temperature and pressure per unit time (v),is typically expressed as v=DL(PA� PC), where PA is the alveolarpartial pressure of the gas and PC is the corresponding partial pres-sure in capillary blood. Because reactive gases bind strongly tohemoglobin, the capillary RBC serves as a nearly infinite “sink” formass transport, and a high partial pressure gradient (i.e. PA≫ PC)is maintained throughout the transit of blood through the pulmo-nary capillaries. Thus, gas uptake is limited only by the rate atwhich diffusion transports mass across the alveolar membrane.In contrast to these “diffusion limited” gases, inert gases
rapidly saturate the gas-exchange membrane and, thus, cannotmaintain significant partial pressure gradients. Rather, inert gasuptake is dominated by blood flow away from the gas-exchangetissues, making inert gases “perfusion limited.” To reconcile thisapparent discrepancy between physiological theory and empiricalresults demonstrating the sensitivity of HP 129Xe to pathologicalconditions causing impaired diffusion (24,25,28,29), it is instructiveto consider the physical origins of DL.According to the classic Roughton and Forster model (30), DL
(conventional units of ml/min/mm Hg) consists of two seriallyordered components and is defined by
1DL
¼ 1DM
þ 1θ�vc
whereDM is the diffusing capacity of the gas-exchangemembrane,θ is the reaction rate of the gas with the blood, and vc is thecapillary blood volume. Because inert gases such as xenon lack areactive component, their diffusing capacity will be dominatedby DM. Thus, the relevant “diffusing capacity for 129Xe” is expectedto be similar to that of NO, previously measured in rats to be DM~0.7ml/min/mm Hg (31). A small value for DLXe coupled with thevanishingly small partial pressure gradient indicates that net masstransfer into the capillary blood will be quite small. Alternately, gastransfer can be considered using amore kinetic approach. Previousspectroscopy studies suggest that HP 129Xe saturates the alveolarseptum in rats with a characteristic time constant of ~30ms(24,25), which is one-tenth of the ~0.3 s transit time of bloodthrough the gas-exchange region (24). Together, both lines of ar-gument suggest that HP 129Xe will saturate the capillary bloodmore rapidly than blood transit through the gas-exchange region,exactly as expected from classical physiology.
Uptake of non-equilibrium magnetization by the pulmonarytissues
When considering HP 129Xe uptake, it must be remembered thatdetecting dissolved magnetization via MR is radically differentfrom conventional measurements of reactive gases. That is, DL ismeasured at the mouth as a difference between the inspired ver-sus expired gas content. Further, it is measured on a timescale ofa breath hold (~10 s in humans). In contrast, HP 129Xe uptake isdetected within the gas-exchange tissues, and this measurementcan readily be made on a timescale less than the ~100ms neededfor xenon to saturate these tissues in rats (24,25). More importantly,whereas traditional DL measurements involve detecting partial-pressure-driven changes in gas volume, MR detects changes inthe HP 129Xe magnetic moment within the gas-exchange tissues.Immediately after reaching the alveolar spaces, HP 129Xe will
follow the partial pressure gradient and diffuse into the gas-exchange tissues until they are saturated. From a thermodynamicstandpoint, the concentration of xenon in the tissues and airspaceswill (neglecting blood flow) remain in a constant, dynamic
Z. I. CLEVELAND ET AL.
wileyonlinelibrary.com/journal/nbm Copyright © 2014 John Wiley & Sons, Ltd. NMR Biomed. 2014

equilibrium after ~100ms. However, application of an RF pulseconsumes the non-equilibrium magnetization, which is thenreplenished as fresh HP 129Xe diffuses into the tissues due to thedynamic nature of the chemical equilibrium. Stated differently,once the tissues are saturated with xenon, the uptake that is rele-vant for generating MR signal is driven not by partial pressure gra-dients, but rather by gradients in HP 129Xe magnetization. Giventhe highly non-equilibrium state of HP 129Xe, RF pulses can beexploited to maintain large magnetization gradients, even in theabsence of a partial pressure gradient.As an analogy to more classical notions of gas exchange, RF
excitation can be used to generate a magnetization “sink” forHP 129Xe, in a manner analogous to the partial pressure sinkthat hemoglobin provides for reactive gases. Specifically, whenusing a large flip angle and a short TR, HP
129Xe magnetizationwill be confined to, but never fully saturate, the gas-exchangetissues. Conversely, when using a small flip angle and a longTR, sufficient HP
129Xe magnetization remains that blood flowwill have sufficient time to carry it away from thegas-exchange region. Thus, the rate at which HP 129Xe magne-tization is eliminated and detected is – aside from minor hard-ware limitations and the physiological constraints of interest –entirely within experimental control and can act as either aperfusion limited or a diffusion limited probe depending onexperimental conditions.
EXPERIMENTAL DETAILS
Animal preparation
Two groups (bleomycin-treated group, N=5; saline-controlgroup N= 4) of female Fisher rats (average weight = 170± 8 g,Charles River, Wilmington, MA, USA) were prepared for experi-ments following procedures approved by the Duke UniversityInstitutional Animal Care and Use Committee. Animals were firstanesthetized with 55mg/kg ketamine, positioned supine on a45° slant board, and perorally intubated with an 18-G catheter(Abbocath-T, Hospira Venisystems, Lake Forest, IL, USA). Throughthis endotracheal catheter, a PE50 catheter was placed in theright pulmonary main bronchus. Animals in the treatment groupreceived a unilateral right lung instillation of a 0.20ml solution ofbleomycin (3.0 units/kg body weight, Hospira, Lake Forest, IL,USA) followed by 0.30ml room air over a period of ~10 s. Animalsin the control group were prepared identically except that theyreceived a 0.20-ml sham instillation of normal saline.MR experiments were performed 25± 2days (range: 22� 28
days) after treatment. Prior to MR experiments, animals wereanesthetized by intraperitoneal (IP) injection of 55mg/kg sodiumpentobarbital (Nembutal, Lundbeck, Deerfield, IL, USA), andanesthesia was maintained with periodic injections of Nembutal(15mg/kg) administered via a 23-G IP catheter. To deliver HP129Xe, rats were intubated with an 18-G catheter (Abbocath) toprovide an airtight seal for mechanical ventilation. Animals wereventilated (75% N2 and 25% O2) at a rate of 1 breath/s on anHP-gas compatible, constant-volume, mechanical ventilator (32)with a tidal volume of 1.0ml/100g body mass. During 129Xe MRimaging and spectroscopy, O2 concentration in the breathing gasmixture was kept constant, but N2 was replacedwith an equivalentvolume of HP 129Xe. Each breath cycle comprised a 250ms inhala-tion, a 50ms breath-hold, and 750ms of passive exhalation.While animals were in the MR magnet, their body temperature
was monitored via a rectal thermistor and maintained at ~37 °C
by warm air flowing through the magnet bore. Airway pressurewas monitored by a pressure transducer attached to the ventila-tion tube. Heart rate was monitored via electrocardiogramreadings using custom LabVIEW 8.1 software (National InstrumentsCorporation, Austin, TX, USA). This software also controlled thetiming of the ventilator and MR acquisition.
Lung histology and analysis
After imaging, rats were exsanguinated by opening the abdom-inal cavity and severing the abdominal aorta and inferior venacava. Lungs were fixed within the thoracic cavity, by instilling10% buffered formalin at a pressure of 25 cm H2O via the endo-tracheal tube for 30minutes. Trachea, lungs, and heart were thenexcised en bloc and stored in 10% formalin for at least 24 h.Following fixation, lungs were cut into 5μm thick slices, andadjacent slices were processed for hematoxylin–eosin andMasson’s trichrome staining. Both sets of stained slides werequalitatively assessed by an expert observer (S.D.), who wasblinded to treatment group. Additionally, Masson’s trichrome-stained slides were used to quantitatively assess collagencontent as a metric of fibrotic injury, using an approach similarto that described previously (33,34).
Briefly, 15 non-overlapping photomicrographs were obtainedfrom each animal using a 20× objective to cover the maximumarea of each lung section. Regions containing tissue at the edgeof the pulmonary parenchyma, including the pleura, wereexcluded from selection. Additionally, any RBCs remaining inthe capillary beds were manually segmented and excluded fromfurther analysis. The level of fibrosis was calculated by applying acolor threshold in ImageJ (version 1.47t, National Institutes ofHealth, Bethesda, MD, USA, http://rsb.info.nih.gov/ij/) to deter-mine the collagen tissue area (blue -stained regions) and the to-tal tissue area visible in each photomicrograph. To avoid a biasedquantification, two macros were created, and all images wereprocessed by the same macros. Collagen content was thenexpressed as a percent of the total tissue area. Collagen area per-centages from the bleomycin- and saline-treated groups weretested for statistical significance using a single-sided, Wilcoxonrank-sum test.
MR and polarization hardware
Isotopically enriched xenon (83% 129Xe, in a 1% Xe, 10% N2, 89%He mixture, Spectra Gases, Alpha, NJ, USA) was hyperpolarizedby spin exchange optical pumping (35) using a prototypecommercial polarizer (model 9800, MITI, Durham, NC, USA).Following cryogenic accumulation (35), HP 129Xe (polarization~ 10%) was thawed into 300-ml Tedlar bags (Jensen InertProducts, Coral Springs, FL, USA) and placed inside a Plexiglascylinder. From this cylinder, HP 129Xe was then delivered to ratsas described previously (32). A detailed discussion of polarizationdynamics occurring in this system is provided in references (36)and (37).
MR spectroscopy and imaging was performed at 2.0 T using ahorizontal, 30-cm bore magnet (Oxford Instruments, Oxford, UK)equipped with 180-mT/m shielded gradients. This magnet was op-erated with a GE EXCITE 12.0 console (GE Healthcare, Milwaukee,WI, USA) modified to interface with the 23.65-MHz (i.e. the 129Xeresonance frequency), quadrature birdcage coil (length=8 cm;diameter= 7 cm) using a frequency up/down converter asdescribed previously (38).
MRI OF HP 129XE UPTAKE IN A RAT MODEL OF PULMONARY FIBROSIS
NMR Biomed. 2014 Copyright © 2014 John Wiley & Sons, Ltd. wileyonlinelibrary.com/journal/nbm

MR spectroscopy
To prepare for HP 129Xe studies, rats were first ventilated with amixture of 1% HP 129Xe flowing directly from the polarizer (36).This direct-flow gaseous 129Xe was used to localize the lungswithin the field of view (FOV), set the RF flip angle, and performin vivo shimming (36). Shimming was considered satisfactorywhen the gaseous 129Xe linewidth (full width at half maximum)was reduced to 15Hz or less. Direct-flow spectroscopy was alsoused to 1) determine the frequencies of the RBC, barrier, andgaseous 129Xe resonances, 2) determine the global phase offsetbetween the RBC peak and the in-phase receiver channel, and3) determine the nominal echo time (TE) required for thedissolved resonances to accumulate the 90° phase difference(TE90) necessary for one-point Dixon separation (25). (Note thatthe nominal TE is defined here as the time between the end ofthe RF pulse and the beginning of data acquisition.) Thisempirical determination was accomplished by acquiring 129Xespectra at end-expiration using varying TE values (TE = 250� 700μs, 8 spectra/breath, 500 spectra total, bandwidth (BW) = 8 kHz,repetition time (TR) = 75ms) with a selective, 1200-μs, three-lobesinc pulse.
Spectral data at each TE were averaged, and complex spectrawere fit as a linear combination of two Lorentzians usingroutines written in MATLAB (MathWorks, Natick, MA, USA). Thephase difference between the two dissolved 129Xe peakswas fit as a function of TE, and TE90 was determined by linearregression (see Fig. 1).
MR imaging
All images were acquired using the same 1200-μs, three-lobesinc pulse as was used for spectroscopy. Ventilation images wereacquired over multiple breaths at end-expiration using a 3D ra-dial sequence. Axial slab excitation matching the 50mm FOVwas performed to avoid wraparound artifacts from HP 129Xe inthe trachea. HP 129Xe was excited using a variable flip anglescheme (39) that provided constant, view-to-view MR signalintensity and consumed all available magnetization. Additionalparameters included radial views = 4291, views/breath = 20,points per view= 64, BW=8 kHz, TR = 10ms, and TE = 860μs.Using a second volume of HP 129Xe, dissolved 129Xe images wereacquired at end-expiration using the same 3D radial sequence.Both the receiver and excitation frequencies were set on-resonance with the 129Xe RBC peak, and TE was set to the spec-troscopically determined TE90 (additional parameters: NEX= 4,FOV= 50mm, radial views = 1073, views/breath = 8, points perview=32, BW=15.6 kHz, flip angle = 90°, and TR = 75ms). Notethat TR = 75ms was chosen because it was expected to allownearly complete saturation of a healthy alveolar septum, was lessthan the expected capillary transit time (24), and permittedreasonably rapid sampling of k space.
Images were reconstructed using a conjugate phase approachwith the open source MATLAB toolbox of Fessler and coworkers(40). Radial k-space data were transformed into Cartesian imagesby a non-uniform fast Fourier transform with min–max interpola-tion (41), and each k-space data point was weighted by densitycompensation factors calculated via the iterative method ofPipe et al. (42). HP 129Xe ventilation data were reconstructedwith a 64 × 64 × 64 matrix as conventional magnitude images.Dissolved 129Xe data could be reconstructed as magnitude im-ages (matrix = 32× 32× 32), representing the total 129Xe signal
originating from the gas-exchange tissues, and are referred toas “dissolved” 129Xe images. Images reconstructed using onlythe real component of the complex dissolved 129Xe data arereferred to as RBC images. Similarly, images obtained fromimaginary data are referred to as barrier- tissue images.
Image analysis
Image analysis was performed using routines written inMATLAB. Analysis was confined to the ventilated portions ofthe lung by applying a signal intensity threshold equal to themean of the background noise outside the lungs plus twiceits standard deviation. The resulting gas-phase images werethen manually segmented to generate masks of the right andleft lungs. Manual segmentation was also used to create masksof the trachea and other visible major airways, and theseregions were omitted from further analysis. Prior to airwayremoval and subsequent analysis, complex dissolved 129Xe
Figure 1. Empirical determination of the nominal echo time required toaccumulate a 90° phase difference (TE90) between
129Xe dissolved in theRBCs and the barrier tissues (blood plasma and lung parenchyma). (a)Dissolved 129Xe spectrum at TE = 250μs. (b) Dissolved 129Xe spectrumprocessed identically, but at TE = 700μs. (c) Dissolved 129Xe phase evolu-tion as a function of time. Linear regression (black line) shows that 90°phase difference is achieved at TE = 373μs rather than the ~730μsexpected from TE90 = 1/(4 Δf ).
Z. I. CLEVELAND ET AL.
wileyonlinelibrary.com/journal/nbm Copyright © 2014 John Wiley & Sons, Ltd. NMR Biomed. 2014
images were linearly interpolated to match the matrix size ofthe ventilation images. Maps of the RBC-to-barrier tissue andRBC-to-total dissolved signal distributions were generated bydividing the relevant images on a voxel-by-voxel basis. Becausegas-phase and total dissolved 129Xe differ substantially in T2*values (43–45) and because of potential batch-to-batch differ-ences in HP 129Xe polarization, the ratios of the gas- anddissolved-phase signals could not be compared directly.Therefore, the total dissolved-phase images and the gas-phaseimages were first normalized by the sum of their respective voxelintensities before generating ‘gas-transfer’ maps of the dissolved-to-ventilation-ratio distribution (20).Differences between the bleomycin- and saline-treated
groups in the whole-lung metrics were assessed for statisticalsignificance of using a single-sided, Wilcoxon rank-sum test.Within experimental groups, differences between the treatedand untreated lungs of individual animals were assessed usingone-sided, Wilcoxon signed-rank test test. Finally, differences be-tween the RBC-to-barrier ratios obtained from spectroscopy andimaging were evaluated using a two-sided, Wilcoxon signed-rank test.
RESULTS
Validation of fibrotic injury
Using blinded, qualitative examination of the histology slides, allanimals were correctly classified into the saline-treated orbleomycin-treated groups. Furthermore, within the bleomycin-treated animals, treated and untreated lungs were also correctlyidentified by qualitative examination. When the tissue was quanti-tatively assessedwithMasson’s trichrome staining (see Table 1 andFig. 2), a significantly higher percentage of collagen-containingtissue (P=0.008) was observed in the bleomycin-treated animals.These results indicate that unilateral fibrotic injury was successfullygenerated in all bleomycin-treated animals, but no injury wasgenerated in saline-treated control animals.
Spectroscopic determination of dissolved 129Xe phase evolution
In all animals, the phase difference between the RBC and barriertissue peaks (Δφ) evolved linearly with nominal echo time (see,e.g., Fig. 1). The average slope derived from linear, least squaresfitting of these data was 0.123 ± 0.003° μs�1 – in good agree-ment with the 0.118 ± 0.003° μs�1 expected from the frequencydifferences (Δf=328±9Hz, range: 310� 335Hz) observed betweenthe two peaks. However, as can be seen in Figure 1, linear fits ofphase evolution as a function of TE are also characterized bypronounced, non-zero y intercepts that differed between animals(mean: 43± 5°; range: 32� 48º). These intercepts did not
correlate well with the Δf (P=0.2), obscuring their mechanistic or-igins. However, the highly linear phase evolution of the dissolved129Xe signal allowed the time needed to achieve the one-pointDixon imaging condition (i.e., TE = TE90) to be determined empiri-cally. Across all animals, the mean TE90 was 372±41μs (range:302� 410μs).
Distribution of dissolved 129Xe signal
3D images of both gaseous and dissolved 129Xe were success-fully obtained from all animals (see, e.g., Fig. 3). In controlanimals, the total dissolved 129Xe signal (i.e., the intensity ofthe dissolved 129Xe magnitude image) within both right and leftlungs tended to be higher in central regions and decreased inboth the cranial and caudal directions. A similar signal intensitypattern was also observed in the corresponding ventilationimages, indicating that, despite regional heterogeneity,significant matching existed between the gaseous and dissolved129Xe signal distributions.
When the relation between the gaseous and dissolved 129Xedistributions was examined quantitatively using the 129Xegas-transfer ratio – defined as the normalized dissolved tonormalized gas-phase signal intensity ratio (20) – a relativelynarrow distribution was observed. For example, Figure 4(a)shows the total dissolved/ventilation distribution from a controlanimal. Although somewhat bimodal (a pattern observed intwo of the four control animals), the displayed 129Xe gas-transfer-ratio distribution was centered around a value of unity.In fact, the mean gas-transfer ratio was ~1 for all animals, regard-less of treatment (see Table 1), similar to the gas-transfer patternrecently observed in humans (20). Further, no significantdifference in mean 129Xe gas-transfer ratio was observedbetween the saline- and bleomycin-treated groups (P=0.73).
In fibrotic injury, the total uptake of gases by all pulmonarytissues is less straightforward to interpret than the transfer ofgases from the alveolar spaces specifically to the RBCs. Thus,the most interesting aspect of dissolved 129Xe MR is the abilityto separate the total dissolved 129Xe signal into its RBC andbarrier tissue components. An example of this separation,achieved using one-point Dixon imaging in a control animal, isshown in Figure 3(c), (d). As expected for an animal withoutinterstitial thickening (25), 129Xe signal is observed from boththe RBC and barrier tissue images throughout the ventilatedregion of the lungs (green outline).
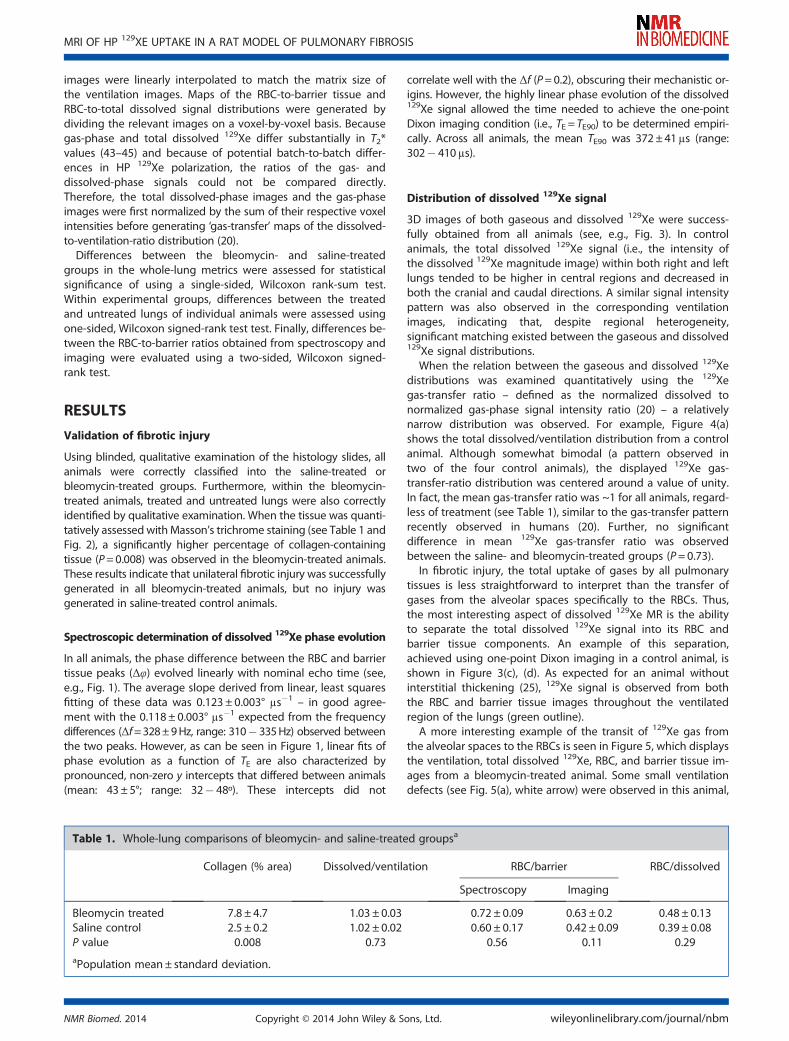
A more interesting example of the transit of 129Xe gas fromthe alveolar spaces to the RBCs is seen in Figure 5, which displaysthe ventilation, total dissolved 129Xe, RBC, and barrier tissue im-ages from a bleomycin-treated animal. Some small ventilationdefects (see Fig. 5(a), white arrow) were observed in this animal,
Table 1. Whole-lung comparisons of bleomycin- and saline-treated groupsa
Collagen (% area) Dissolved/ventilation RBC/barrier RBC/dissolved
Spectroscopy Imaging
Bleomycin treated 7.8 ± 4.7 1.03 ± 0.03 0.72 ± 0.09 0.63 ± 0.2 0.48 ± 0.13Saline control 2.5 ± 0.2 1.02 ± 0.02 0.60 ± 0.17 0.42 ± 0.09 0.39 ± 0.08P value 0.008 0.73 0.56 0.11 0.29aPopulation mean± standard deviation.
MRI OF HP 129XE UPTAKE IN A RAT MODEL OF PULMONARY FIBROSIS
NMR Biomed. 2014 Copyright © 2014 John Wiley & Sons, Ltd. wileyonlinelibrary.com/journal/nbm

Figure 2. Histological assessment of fibrotic injury. (a) Masson’s trichrome stained lung tissue from a saline-treated control rat. Alveolar walls are thinand intact; little collagen (blue-stained tissue) is present. (b) Identically stained tissue from a bleomycin-treated rat. Thickened alveolar walls andcollagen accumulation indicate fibrotic injury. (c) Image from (a), color thresholded such than only the blue, collagen-containing areas were retained.(d) Color-thresholded image displaying the blue, collagen-containing area from (b). (e) Comparison of percent average collagen-containing area fromsaline- and bleomycin-treated groups. The percentage of collagen-containing area was significantly greater in the bleomycin-treated group relative tothe saline control group (P=0.008).
Z. I. CLEVELAND ET AL.
wileyonlinelibrary.com/journal/nbm Copyright © 2014 John Wiley & Sons, Ltd. NMR Biomed. 2014

and indeed most of the bleomycin-treated animals. However,these defects represented a relatively modest fraction of the totallung volume (~5% or less), suggesting that they were of limitedphysiological importance. Moreover as was seen for the controlanimal, there is qualitative agreement between the location ofthe gas-phase signal in the ventilation image and total dissolved-phase signal. Unlike in the control animal, the central portions ofthe lungs do not display noticeably elevated dissolved signalrelative to the lung periphery. Further, the 129Xe signal from thebarrier is substantially mismatched with that observed fromthe RBC compartment, largely due to reduced RBC signal in thebleomycin-treated, right lung.
Comparison of HP 129Xe uptake from spectroscopy and imaging
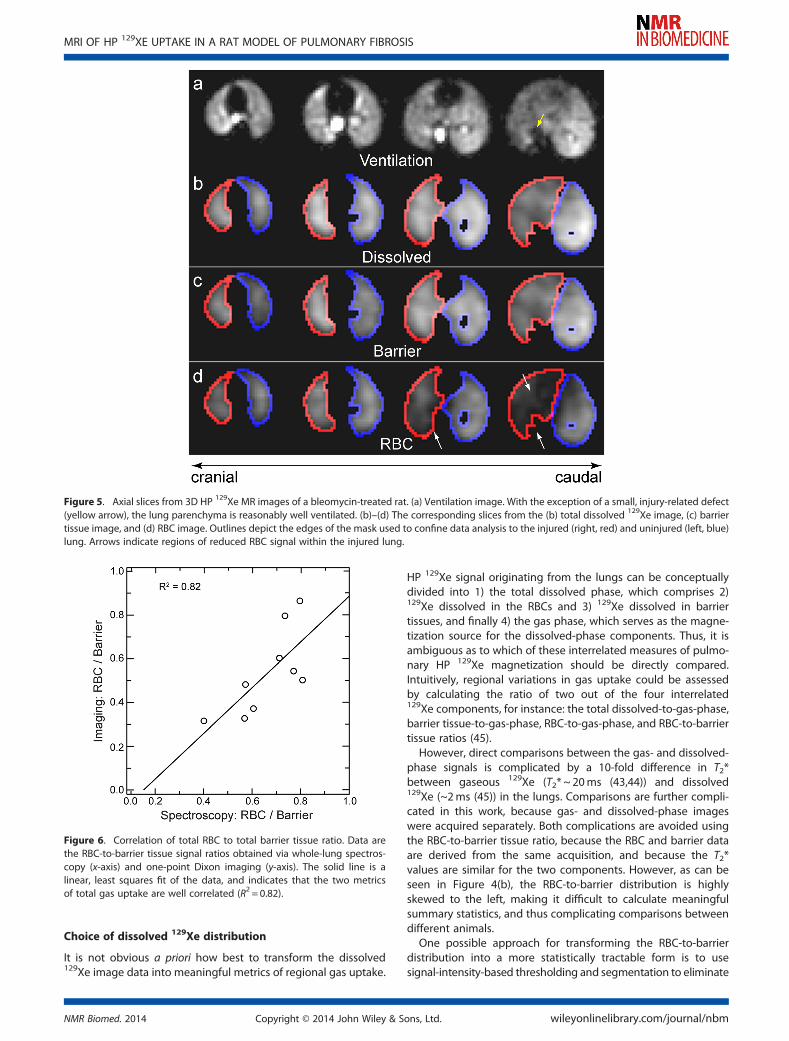
HP 129Xe transfer metrics obtained from imaging were wellcorrelated with their spectroscopic counterparts for allanimals. Specifically, the image-derived, global RBC-to-barriersignal ratio (the voxel-by-voxel sum of the RBC signal dividedby the voxel-by-voxel sum of the barrier tissue signal)correlated strongly with the spectroscopic RBC-to-barrier ratio(R2 = 0.82; see Fig. 6). Furthermore, the slope of the best-fitline correlating these two metrics was near unity (1.1 ± 0.1),and the intercept was approximately zero (�0.007 ± 0.04).Together these results argue that the one-point Dixonapproach correctly captured the global signal characteristicsprovided by spectroscopy, while adding more detailed,regional information.
Regional 129Xe uptake
Somewhat surprisingly, whole-lungmetrics of gas uptake, whetherthe dissolved-to-ventilation, RBC-to-barrier, or RBC-to-dissolved ra-tios, did not differentiate the saline- and bleomycin-treated groups(see Table 1). However, examining spatial variations in the RBC-to-dissolved distribution reveals obvious differences betweenthese groups. For instance, Figure 7 displays representative slicesfrom the RBC-to-dissolved maps of a saline-control (Fig. 7(a)) anda bleomycin-treated animal (Fig. 7(b)). Specifically, the controlanimal displays a relatively homogeneous RBC-to-dissolveddistribution in both lungs, with most values falling in the rangeof 0.4–0.6 and extreme values near either zero or unity beinglocated primarily near the lung periphery. A similar pattern is alsoobserved in the untreated lung of the bleomycin-injured animal.
Substantially reduced RBC-to-dissolved values are observedthroughout much of the injured, right lung. Moreover, the regionaltrends displayed in the RBC-to-dissolved maps are reflected in thehistograms of the whole-lung, RBC-to-dissolved distributions (Fig. 7(c), (d)). That is, while the control animal displays a relatively symmet-ric whole-lung RBC-to-dissolved distribution, similar to the one seenin Figure 4(c), the bleomycin-treated animal displays a left-skeweddistribution, indicating that regions of the lung experienced reduced129Xe transfer to the RBCs on the TR =75ms timescale.
In bleomycin-treated animals, the average RBC-to-dissolvedratio was significantly reduced in the treated versus untreatedlung (P= 0.03; see Fig. 8(a)). In no instance was the oppositepattern observed within the injured lung (i.e. higher meanRBC-to-dissolved ratio relative to the untreated lung) for any of
Figure 3. Axial slices from 3D HP 129Xe MR images of a control rat, which received a saline treatment in the right lung. (a) Ventilation image. Arrowsindicate the location of the larger airways. (b)–(d) The corresponding slices from the total dissolved 129Xe image (b), barrier tissue image, (c) and RBCimage (d). The green outlines depict the edges of the mask used to confine data analysis to the ventilated regions of the lung parenchyma.
MRI OF HP 129XE UPTAKE IN A RAT MODEL OF PULMONARY FIBROSIS
NMR Biomed. 2014 Copyright © 2014 John Wiley & Sons, Ltd. wileyonlinelibrary.com/journal/nbm

the bleomycin-treated animals. In contrast, the saline-treatedanimals displayed no significant difference in RBC-to-dissolveddistribution between the saline-treated and untreated lungs(P= 0.31, Fig. 8(a)). Together, these results are in excellent agree-ment with the expectation that exposing a lung to bleomycinwould generate fibrotic thickening, resulting in reduced gastransport to the RBCs.
Beyond the mean RBC-to-dissolved values, we also investi-gated the heterogeneity of the RBC-to-dissolved distribution.Fig. 8(b) displays a comparison of the heterogeneity, asmeasured by the coefficient of variation (CV), in the treatedversus untreated lungs for both the saline- and bleomycin-treatedgroups. (Note that CV is defined as the standard deviation of the
RBC-to-dissolved-ratio distribution from a given lung divided bythe mean of this distribution.) In all bleomycin-treated animals,the CV of the RBC-to-dissolved distribution was significantly higherin the treated versus untreated lungs (P=0.03). However, in thesaline control animals, no significant difference in CVwas observedfor the RBC-to-dissolved (P=0.56) distribution between the treatedand untreated lungs. Together, these results suggest that,compared with both untreated and saline-treated lungs, thepresence of fibrotic tissue in bleomycin-treated lungs reduced129Xe exchange and increased its spatial heterogeneity.
DISCUSSION
Implications of non-TE-dependent phase evolution
The accumulation of phase differences between the twodissolved 129Xe resonances increased linearly with the productof TE and the frequency difference between the two peaks, Δf.This observation, despite the known rapid diffusive 129Xeexchange (46), suggests that the pre-imaging spectroscopyprotocol used in this work could be simplified by acquiring asingle spectrum to measure Δf and then using this informationto calculate TE90.However, plots of Δφ versus TE, while showing excellent
linearity, also exhibited pronounced, non-zero intercepts thatdiffered between animals. As a result, naively using themeasured Δf to calculate TE90 will not yield the expected phasedifference. In fact, to do so in this work would have led tophase offsets that exceeded the target 90° by 36� 53% (total phaseevolution 122� 138º). In turn, this excess phase accumulationwould have prevented meaningful separation of the RBC andbarrier components of the 129Xe signal, and thus preventedthe regions in which gas-exchange was impaired from beingcorrectly identified.Because the phase difference between the two dissolved
129Xe resonances cannot be attributed solely to TE, substantialphase evolution must also have occurred during the RF pulse.In fact, such an effect is consistent with the RF-induced phasecontrast observed in the ultra-short echo time (UTE) imaging ofconnective tissues (47). However, unlike the case of 1H-basedstructural UTE imaging, RF-induced phase evolution cannot beavoided when exciting dissolved HP 129Xe simply by using smallflip angle, hard pulses. That is, to generate sufficient dissolved129Xe signal intensity and to confine its magnetization to thegas-exchange tissues (21,22), large flip angle RF pulses arerequired. Additionally, these RF pulses must be relatively long(~1ms), so that they are sufficiently selective to avoid excitingthe 100 times larger gaseous magnetization pool. Thus, whenstandard pulse shapes are employed, RF-induced phaseevolution is likely an unavoidable complication when using TE-dependent phase evolution to separate the RBC and barrier tis-sue components of the dissolved 129Xe signal.This RF-induced phase dispersion has important practical
consequences for separating the two dissolved 129Xe resonances.In particular, it represents an additional offset from the receiverphase that cannot be rewound to zero. Moreover, this complica-tion will be present regardless of whether Dixon-based (25) orconventional IDEAL-based (45) approaches are used to achieve thisspectral separation. However, in future work, it should be possibleto model RF-induced phase evolution using a rigorous treatmentof the Bloch–McConnell equations or potentially avoid them usingmore sophisticated, binomial composite RF pulses (48).
Figure 4. Histograms displaying the distributions of dissolved 129Xe sig-nal from a saline-treated control rat. (a) Dissolved-to-ventilation (i.e. gas-transfer) ratio distribution, showing a mean near unity. (b) RBC-to-barrierratio, displaying a highly left-skewed distribution. (c) RBC-to-dissolved ra-tio, displaying a relatively uniform distribution, with values ranging fromzero to unity.
Z. I. CLEVELAND ET AL.
wileyonlinelibrary.com/journal/nbm Copyright © 2014 John Wiley & Sons, Ltd. NMR Biomed. 2014
Choice of dissolved 129Xe distribution
It is not obvious a priori how best to transform the dissolved129Xe image data into meaningful metrics of regional gas uptake.
HP 129Xe signal originating from the lungs can be conceptuallydivided into 1) the total dissolved phase, which comprises 2)129Xe dissolved in the RBCs and 3) 129Xe dissolved in barriertissues, and finally 4) the gas phase, which serves as the magne-tization source for the dissolved-phase components. Thus, it isambiguous as to which of these interrelated measures of pulmo-nary HP 129Xe magnetization should be directly compared.Intuitively, regional variations in gas uptake could be assessedby calculating the ratio of two out of the four interrelated129Xe components, for instance: the total dissolved-to-gas-phase,barrier tissue-to-gas-phase, RBC-to-gas-phase, and RBC-to-barriertissue ratios (45).
However, direct comparisons between the gas- and dissolved-phase signals is complicated by a 10-fold difference in T2*between gaseous 129Xe (T2* ~ 20ms (43,44)) and dissolved129Xe (~2ms (45)) in the lungs. Comparisons are further compli-cated in this work, because gas- and dissolved-phase imageswere acquired separately. Both complications are avoided usingthe RBC-to-barrier tissue ratio, because the RBC and barrier dataare derived from the same acquisition, and because the T2*values are similar for the two components. However, as can beseen in Figure 4(b), the RBC-to-barrier distribution is highlyskewed to the left, making it difficult to calculate meaningfulsummary statistics, and thus complicating comparisons betweendifferent animals.
One possible approach for transforming the RBC-to-barrierdistribution into a more statistically tractable form is to usesignal-intensity-based thresholding and segmentation to eliminate
Figure 5. Axial slices from 3D HP 129Xe MR images of a bleomycin-treated rat. (a) Ventilation image. With the exception of a small, injury-related defect(yellow arrow), the lung parenchyma is reasonably well ventilated. (b)–(d) The corresponding slices from the (b) total dissolved 129Xe image, (c) barriertissue image, and (d) RBC image. Outlines depict the edges of the mask used to confine data analysis to the injured (right, red) and uninjured (left, blue)lung. Arrows indicate regions of reduced RBC signal within the injured lung.
Figure 6. Correlation of total RBC to total barrier tissue ratio. Data arethe RBC-to-barrier tissue signal ratios obtained via whole-lung spectros-copy (x-axis) and one-point Dixon imaging (y-axis). The solid line is alinear, least squares fit of the data, and indicates that the two metricsof total gas uptake are well correlated (R2 = 0.82).
MRI OF HP 129XE UPTAKE IN A RAT MODEL OF PULMONARY FIBROSIS
NMR Biomed. 2014 Copyright © 2014 John Wiley & Sons, Ltd. wileyonlinelibrary.com/journal/nbm

regions with low barrier tissue signal such as the heart and largervasculature (45). However, so long as a sufficiently large flip angleRF pulse and short TR are used in the image acquisition (e.g. the75ms TR and 90° pulse used in this work), HP 129Xe magnetizationin these “downstream” regions will be eliminated by RF-induceddepolarization during image acquisition. Therefore, the appear-ance of high RBC-to-barrier tissue values in Figure 4(b) (and indeedin the RBC-to-barrier tissue distributions of all animals studied inthis work) indicate that, at least in some instances, high RBC-to-barrier tissue ratios reflect physiologically meaningful data.Furthermore, the Ostwald solubility of Xe in RBCs is two to threetimes higher than in blood plasma (49,50), suggesting thatregions displaying RBC-to-barrier ratios greater than unity areindeed quite plausible.
To retain gas-exchange information from regions withreduced barrier signal, we examined 129Xe gas uptake via theRBC-to-total dissolved ratio. This metric ultimately contains thesame information as the RBC-to-barrier ratio, but the resultingdistributions are much less skewed (see, e.g., Fig. 4(c)) andinnately constrained to values ranging from zero to unity. Thismakes the RBC-to-dissolved ratio more amenable to statisticalanalysis. Moreover, this metric should also be more robustagainst imperfect separation of the RBC and barrier signals thanthe RBC-to-barrier ratio, where experimental errors arecompounded because they are present with opposite signs inboth the numerator and denominator. In contrast, separationerror is only present in the numerator of the RBC-to-dissolvedratio. Together, these features make the RBC-to-dissolved ratioa more promising candidate for being a useful biomarker ofimpaired gas exchange than the RBC-to-barrier ratio.
Global imaging metrics and regional injury
Previous spectroscopic studies demonstrated diminished RBCrelative to barrier tissue signal in rats subjected to pulmonaryinjury with lipopolysaccharide (LPS) (24), infected withStachybotrys chartarum (29), and exposed to bleomycin (25).Thus, it is interesting to note that the whole-lung metricsobtained in this work, whether derived from spectroscopy orimaging (see Table 1), did not statistically differentiate thebleomycin- and saline-treated groups. However, both the fungalinfection and the LPS treatments in prior studies were acuteinsults that elicit substantial, and ongoing, inflammatoryresponses. Similarly, the bleomycin-injured animals reported previ-ously (25) were imaged much sooner (10.6± 4.0 days) after injurycompared with our current work, in which animals were imaged~1month after injury. This timing is relevant, because bleomycininjury involves an initial inflammatory stage that, in rats, does notfully subside into the fibrotic stage until after approximately21 days after injury (51,52). Thus, it is likely that the earlier 129Xe–bleomycin study, as well as the prior infection and LPS studies,were conducted during a primarily inflammatory stage, whereasour current study assessed the fibrotic phase of injury.Together, these observations suggest a possible origin for the
apparent 129Xe–bleomycin discrepancy between the whole-lungdata of this and earlier works. Previous studies of pulmonary per-fusion using computed tomography have demonstrated thatblood flow is preferentially redistributed to inflamed regionswithin the lungs (53). However, these inflamed regions areexpected to display more pronounced gas-exchange impair-ment relative to non-inflamed regions. Thus, this combination
saline-treated Bleomycin-treated
0.0 1.00.5
a b
RBC/Dissolved
50
100
150
200
250
300
350
400
0
RBC/Dissolved
0 0.2 0.4 0.6 0.8 1
c
50
100
150
200
250
300
350
00 0.2 0.4 0.6 0.8 1
RBC/Dissolved
d
Vox
el C
ount
Figure 7. (a), (b) Axial slices from the RBC-to-dissolved maps of a saline control animal (a) and a bleomycin-treated animal (b). (c), (d) Correspondingwhole lung, RBC-to-dissolved 129Xe histograms from the saline control animal (c) and bleomycin-treated animal (d) shown in (a) and (b), respectively.The distribution displayed by the control animal is quantitatively similar to that displayed in Figure 4(c). The distributions from the bleomycin-treatedanimals, however, display markedly different character, reflecting reduced 129Xe transfer to RBCs and substantial regional variability.
Z. I. CLEVELAND ET AL.
wileyonlinelibrary.com/journal/nbm Copyright © 2014 John Wiley & Sons, Ltd. NMR Biomed. 2014

of increased blood flow and impaired gas exchange within theinflamed regions likely reduced the RBC-to-barrier tissue ratioin the injured animals. Regardless of the mechanism causingthe discrepancy between whole-lung observations in this andprevious studies, Figures 5, 7, and 8 clearly indicate that 3D,one-point Dixon imaging of dissolved 129Xe can correctly iden-tify fibrotic regions of the lungs where gas exchange is impaired.Such sensitivity is needed to study pathophysiology in intrinsi-cally heterogeneous injury models, such as bleomycin-inducedfibrosis. Moreover, the observed discrepancy between regionaland global information clearly highlights the need to resolvegas exchange regionally when quantifying diffusion impairmentin these models.
Study limitations
Ventilation images were manually segmented, which may haveintroduced subjectivity into the image analysis. Furthermore,restricting analysis to the ventilated regions made the approachinsensitive to injury-induced ventilation defects, which will alsoplay a role in overall gas exchange. Fortunately, both issuescould be avoided in future work using a dual-tuned 1H–129Xe coilto acquire 1H images of the thoracic cavities, and then usingthese anatomic images to define regions of interest for quantita-tive analysis (54).
Additionally, several assumptions were made in applying one-point Dixon imaging: 1) B0 is homogeneous across the lungs, 2)chemical-shift-induced phase evolution during acquisition isnegligible, and 3) differential, imaging-gradient-dependentoff-resonance phase evolution is also negligible. The first as-sumption is likely valid, because the short TE values used willhave made the imaging relatively robust to the minor B0 varia-tion expected in a preclinical magnet. The second and third as-sumptions are more problematic, because some phaseevolution continues during the ~1ms data acquisition period,and gradient-induced, off-resonance dephasing is known to con-tribute to the phase contrast observed in UTE imaging (47). How-ever, RBC signal was only reduced in the injured lungs,suggesting that this 3D, one-point Dixon approach capturedthe key features of diffusive exchange and any additional phaseevolution contributed only secondary blurring effects.
Perhaps the greatest limitation of the methods presented inthe current study, and indeed virtually all HP gas-derived metricsreported to date, is that that they yield only semi-quantitativeinformation about pulmonary function. That is, while the ratiosreported here enable statistical comparisons to be madebetween individuals and between the lungs of a given subject, thesemetrics lack the conventional units (e.g., ml/min/g or ml/min/mmHg) used in the physiological literature. Fortunately, several quantita-tive models that account for both blood flow and diffusion havebeen developed to describe HP 129Xe uptake by the gas-exchangetissues (23,25,28). With proper development, it should be possibleto adapt these models such that they can provide regional metricsof both normal and pathological pulmonary gas exchange.
CONCLUSIONS
We have described a 3D MR imaging approach that allows HP129Xe in the alveolar spaces to be detected separately from129Xe dissolved in both the RBCs and the barrier tissues of thelungs of small animals. By applying RF pulses with sufficientlylarge flip angle (i.e., 90° ) and short repetition time, the dissolvedsignal was confined almost exclusively to the gas-exchangetissues. As a result, the contribution of perfusion to signalintensity can be neglected, making this imaging approachsensitive to diffusive impairment caused by fibrotic thickeningof the barrier tissues.
Additionally, we have demonstrated that regional differencesin diffusive 129Xe exchange are readily detected by the RBC-to-total dissolved signal ratio, a metric that is readily amenableto statistical analysis. Interestingly, global, whole-lung spectro-scopic measures of the HP 129Xe uptake did not discriminatethe saline- and bleomycin-treated groups. However, regionalanalysis of the RBC-to-total dissolved signal ratio readilyseparated the two groups, making a compelling argument forthe need to spatially resolve impaired gas uptake in this model.
Figure 8. Dissolved signal distribution in treated versus untreatedlungs. (a) Mean RBC-to-dissolved ratio. In the bleomycin-treated group,the mean RBC-to-dissolved ratio was significantly lower than in theuntreated lung (P=0.03), but no significant difference was observed inthe saline-treated control group between the treated and untreatedlungs (P=0.31). (b) CV for the RBC-to-dissolved ratio shown in (a). A sig-nificantly higher treated-lung CV was observed in the bleomycin group(P=0.03), but not in the saline control group (P=0.56).
MRI OF HP 129XE UPTAKE IN A RAT MODEL OF PULMONARY FIBROSIS
NMR Biomed. 2014 Copyright © 2014 John Wiley & Sons, Ltd. wileyonlinelibrary.com/journal/nbm

Although this imaging approach was applied to rats here, itcould in principle also be implemented in transgenic mice thatexclusively express human hemoglobin (55), allowing it to beextended to a wider variety of preclinical models. Moreover, asingle breath variant of this technique could enable clinical inves-tigations of gas-exchange impairment in patients, providing aunique method to evaluate the efficacy of therapeutic agents inhuman diseases that involve impaired gas diffusion, such asidiopathic pulmonary fibrosis.
Acknowledgements
This study was funded by the National Institutes of Health (NHLBIR01HL105643, NCI R01-CA-142842, and NHLBI 1K99-HL-111217-01A1) and performed at the Duke Center for In Vivo Microscopy,a national Biomedical Technology Resource Center (NIBIB P41EB015897). The authors wish to thank Laurence Hedlund forsuggestions regarding experimental design, Judith Voynow andBernard Fischer for providing access to the microscope usedfor histology, Gary Cofer and Sally Gewalt for assistance withimage reconstruction and acquisition, S. Sivaram Kaushik andMatthew Freeman for helpful discussions regarding dataanalysis, and Sally Zimney for proofreading the manuscript.
REFERENCES1. West JB. Respiratory Physiology: the Essentials, 9th edn. Lippincott
Williams and Wilkins: Baltimore, MD, 2012.2. Robertson HT, Buxton RB. Imaging for lung physiology: what do we
wish we could measure? J. Appl. Physiol. 2012; 113(2): 317–327.3. Fain S, Schiebler ML, McCormack DG, Parraga G. Imaging of lung
function using hyperpolarized helium-3 magnetic resonanceimaging: review of current and emerging translational methodsand applications. J. Magn. Reson. Imaging 2010; 32(6): 1398–1408.
4. Hopkins SR, Prisk GK. Lung perfusion measured using magneticresonance imaging: new tools for physiological insights into thepulmonary circulation. J. Magn. Reson. Imaging 2010; 32(6): 1287–1301.
5. Hegewald MJ. Diffusing capacity. Clin. Rev. Allergy Immunol. 2009;37(3): 159–166.
6. Fishbein MC. Assessing the role of surgical lung biopsy in the diagnosisof idiopathic pulmonary fibrosis. Chest 2005; 128(5): 520S–525S.
7. Shukla Y, Wheatley A, Kirby M, Svenningsen S, Farag A, Santyr GE,Paterson NAM, McCormack DG, Parraga G. Hyperpolarized 129Xemagnetic resonance imaging: tolerability in healthy volunteers andsubjects with pulmonary disease. Acad. Radiol. 2012; 19(8): 941–951.
8. Driehuys B, Martinez-Jimenez S, Cleveland ZI, Metz GM, Beaver DM,Nouls JC, Kaushik SS, Firszt R, Willis C, Kelly KT, Wolber J, Kraft M,McAdams HP. Chronic obstructive pulmonary disease: safety andtolerability of hyperpolarized 129Xe MR imaging in healthy volun-teers and patients. Radiology 2012; 262(1): 279–289.
9. Kaushik SS, Cleveland ZI, Cofer GP, Metz G, Beaver D, Nouls J, Kraft M,Wolber J, Kelly KT, Auffermann W, McAdams HP, Driehuys B. Diffu-sion weighted imaging of hyperpolarized 129Xe in patients withchronic obstructive pulmonary disease. Magn. Reson. Med. 2011;65(4): 1154–1165.
10. Mata JF, Altes TA, Cai J, Ruppert K, Mitzner W, Hagspiel KD, Patel B,Salerno M, Brookeman JR, de Lange EE, Tobias WA, Wang HTJ, CatesGD, Mugler JP. Evaluation of emphysema severity and progression ina rabbit model: comparison of hyperpolarized He-3 and Xe-129diffusion MRI with lung morphometry. J. Appl. Physiol. 2007; 102(3):1273–1280.
11. Boudreau M, Xu XJ, Santyr GE. Measurement of 129Xe gas apparentdiffusion coefficient anisotropy in an elastase-instilled rat model ofemphysema. Magn. Reson. Med. 2013; 69(1): 211–220.
12. Virgincar RS, Cleveland ZI, Kaushik SS, Freeman MS, Nouls J, Cofer G,Martinez-Jimenez S, He M, Kraft M, Wolber J, McAdams HP, DriehuysB. Quantitative analysis of hyperpolarized 129Xe ventilation imagingin healthy volunteers and subjects with chronic obstructive pulmo-nary disease. NMR Biomed. 2013; 26(4): 424–435.
13. Kirby M, Svenningsen S, Kanhere N, Owrangi A, Wheatley A, CoxsonHO, Santyr GE, Paterson NAM, McCormack DG, Parraga G. Pulmonaryventilation visualized using hyperpolarized helium-3 and xenon-129magnetic resonance imaging: differences in COPD and relationshipto emphysema. J. Appl. Physiol. 2013; 114(6): 707–715.
14. Kirby M, Svenningsen S, Owrangi A, Wheatley A, Farag A, Ouriadov A,Santyr GE, Etemad-Rezai R, Coxson HO, McCormack DG, Parraga G.Hyperpolarized 3He and 129Xe MR imaging in healthy volunteersand patients with chronic obstructive pulmonary disease. Radiology2012; 265(2): 600–610.
15. Mugler JP, Driehuys B, Brookeman JR, Cates GD, Berr SS, Bryant RG,Daniel TM, deLange EE, Downs JH, Erickson CJ, Happer W, HintonDP, Kassel NF, Maier T, Phillips CD, Saam BT, Sauer KL, Wagshul ME.MR imaging and spectroscopy using hyperpolarized Xe-129 gas:preliminary human results. Magn. Reson. Med. 1997; 37(6): 809-815.
16. Swanson SD, Rosen MS, Coulter KP, Welsh RC, Chupp TE. Distributionand dynamics of laser-polarized 129Xe magnetization In vivo. Magn.Reson. Med. 1999; 42(6): 1137–1145.
17. Kershaw J, Nakamura K, Kondoh Y, Wakai A, Suzuki N, Kanno I.Confirming the existence of five peaks in 129Xe rat head spectra.Magn. Reson. Med. 2007; 57(4): 791–797.
18. Ruppert K, Brookeman JR, Hagspiel KD, Mugler JP. Probing lungphysiology with xenon polarization transfer contrast (XTC). Magn.Reson. Med. 2000; 44(3): 349–357.
19. Dregely I, Ruset IC, Mata JF, Ketel J, Ketel S, Distelbrink J, Altes TA,Mugler JP, Miller GW, Hersman FW, Ruppert K. Multiple-exchange-timexenon polarization transfer contrast (MXTC) MRI: initial results in ani-mals and healthy volunteers. Magn. Reson. Med. 2012; 67(4): 943–953.
20. Kaushik SS, Freeman MS, Cleveland ZI, Davies J, Stiles J, Virgincar RS,Robertson SH, He M, Kelly KT, Foster WM, McAdams HP, Driehuys B.Probing the regional distribution of pulmonary gas exchangethrough single-breath gas- and dissolved-phase 129Xe MR imaging.J. Appl. Physiol. 2013; 115(6): 850–860.
21. Cleveland ZI, Cofer GP, Metz G, Beaver D, Nouls J, Kaushik SS, Kraft M,Wolber J, Kelly KT, McAdams HP, Driehuys B. Hyperpolarized 129Xe MRimaging of alveolar gas uptake in humans. PLoS One 2010; 5(8): e12192.
22. Mugler JP, Altes TA, Ruset IC, Dregely IM, Mata JF, Miller GW, Ketel S,Ketel J, Hersman FW, Ruppert K. Simultaneous magnetic resonanceimaging of ventilation distribution and gas uptake in the humanlung using hyperpolarized xenon-129. Proc. Natl. Acad. Sci. U. S. A.2010; 107(50): 21707–21712.
23. Chang YLV. MOXE: A model of gas exchange for hyperpolarized 129Xemagnetic resonance of the lung.Magn. Reson.Med. 2013; 69(3): 884–890.
24. Mansson S, Wolber J, Driehuys B, Wollmer P, Golman K. Characteriza-tion of diffusing capacity and perfusion of the rat lung in alipopolysaccaride disease model using hyperpolarized 129Xe. Magn.Reson. Med. 2003; 50(6): 1170–1179.
25. Driehuys B, Cofer GP, Pollaro J, Mackel JB, Hedlund LW, Johnson GA.Imaging alveolar-capillary gas transfer using hyperpolarized 129XeMRI. Proc. Natl. Acad. Sci. U. S. A. 2006; 103(48): 18278–18283.
26. Ma JF. Dixon techniques for water and fat imaging. J. Magn. Reson.Imaging 2008; 28(3): 543–558.
27. Forster RE. Diffusion of gases across the alveolar membrane. In Com-prehensive Physiology. 2011; 71–88.
28. Patz S, Muradyan I, Hrovat MI, Dabaghyan M, Washko GR, Hatabu H,Butler JP. Diffusion of hyperpolarized 129Xe in the lung: a simplifiedmodel of 129Xe septal uptake and experimental results. New J. Phys.2011; 13: 015009.
29. Abdeen N, Cross A, Cron G, White S, Rand T, Miller D, Santyr G. Mea-surement of xenon diffusing capacity in the rat lung byhyperpolarized 129Xe MRI and dynamic spectroscopy in a singlebreath-hold. Magn. Reson. Med. 2006; 56(2): 255–264.
30. Roughton FJW, Forster RE. Relative importance of diffusion andchemical reaction rates in determining rate of exchange of gasesin the human lung, with special reference to true diffusing capacityof pulmonary membrane and volume of blood in the lung capillaries.J. Appl. Physiol. 1957; 11(2): 290–302.
31. Stitt JT, DuBois AB. The lung diffusing capacity for nitric oxide in rats isincreased during endotoxemia. J. Appl. Physiol. 2001; 90(3): 1049–1056.
32. Nouls J, Fanarjian M, Hedlund L, Driehuys B. A Constant-volume ven-tilator and gas recapture system for hyperpolarized gas MRI ofmouse and rat lungs. Concepts Magn. Reson. B 2011; 39(2): 78–88.
33. Lin R, Degan S, Theriot BS, Fischer BM, Strachan RT, Liang JR, PierceRA, Sunday ME, Noble PW, Kraft M, Brody AR, Walker JKL. Chronictreatment In vivo with beta-adrenoceptor agonists induces
Z. I. CLEVELAND ET AL.
wileyonlinelibrary.com/journal/nbm Copyright © 2014 John Wiley & Sons, Ltd. NMR Biomed. 2014

dysfunction of airway beta(2)-adrenoceptors and exacerbates lunginflammation in mice. Br. J. Pharmacol. 2012; 165(7): 2365–2377.
34. Fischer BM, Wong JK, Degan S, Kummarapurugu AB, Zheng S,Haridass P, Voynow JA. Increased expression of senescence markersin cystic fibrosis airways. Am. J. Physiol. Lung Cell. Mol. Physiol. 2013;304(6): L394–L400.
35. Driehuys B, Cates GD, Miron E, Sauer K, Walter DK, Happer W.High-volume production of laser-polarized 129Xe. Appl. Phys. Lett.1996; 69(12): 1668–1670.
36. Driehuys B, Pollaro J, Cofer GP. In vivoMRI using real-time productionof hyperpolarized 129Xe. Magn. Reson. Med. 2008; 60(1): 14–20.
37. Moller HE, Cleveland ZI, Driehuys B. Relaxation of hyperpolarized 129Xein a deflating polymer bag. J. Magn. Reson. 2011; 212(1): 109–115.
38. Cleveland ZI, Moller HE, Hedlund LW, Nouls JC, Freeman MS, Qi Y,Driehuys B. In vivo MR imaging of pulmonary perfusion and gas ex-change in rats via continuous extracorporeal infusion ofhyperpolarized 129Xe. PLoS One 2012; 7(2): e12192.
39. Zhao L, Mulkern R, Tseng CH, Williamson D, Patz S, Kraft R, WalsworthRL, Jolesz FA, Albert MS. Gradient-echo imaging considerations forhyperpolarized 129Xe MR. J. Magn. Reson. B 1996; 113(2): 179–183.
40. Fessler JA. Matlab Tomography Toolbox. http://web.eecs.umich.edu/~fessler/code [11 May 2012].
41. Fessler JA, Sutton BP. Nonuniform fast Fourier transforms using min–max interpolation. IEEE Trans. Signal Process. 2003; 51(2): 560–574.
42. Pipe JG, Menon P. Sampling density compensation in MRI: rationaleand an iterative numerical solution. Magn. Reson. Med. 1999; 41(1):179–186.
43. Xu XJ, Norquay G, Parnell SR, Deppe MH, Ajraoui S, Hashoian R,Marshall H, Griffiths PD, Parra-Robles J, Wild JM. Hyperpolarized129Xe gas lung MRI-SNR and T2*comparisons at 1.5 T and 3 T. Magn.Reson. Med. 2012; 68(6): 1900–1904.
44. Chen XJ, Moller HE, Chawla MS, Cofer GP, Driehuys B, Hedlund LW,MacFall JR, Johnson GA. Spatially resolved measurements ofhyperpolarized gas properties in the lung In vivo. Part II: T2*. Magn.Reson. Med. 1999; 42(4): 729–737.
45. Qing K, Ruppert K, Jiang Y, Mata JF, Miller GW, Shim YM, Wang C,Ruset IC, Hersman FW, Altes TA, Mugler JP. Regional mapping of
gas uptake by blood and tissue in the human lung usinghyperpolarized xenon-129 MRI. J. Magn. Reson. Imaging 2014; 39(2):346–359.
46. Bifone A, Song YQ, Seydoux R, Taylor RE, Goodson BM, Pietrass T,Budinger TF, Navon G, Pines A. NMR of laser-polarized xenon in humanblood. Proc. Natl. Acad. Sci. U. S. A. 1996; 93(23): 12932–12936.
47. Carl M, Chiang JTA. Investigations of the origin of phase differencesseen with ultrashort TE imaging of short T2 meniscal tissue. Magn.Reson. Med. 2012; 67(4): 991–1003.
48. Leung G, Norquay G, Schulte RF, Wild JM. Radiofrequency pulsedesign for the selective excitation of dissolved 129Xe. Magn. Reson.Med. 2014. DOI: 10.1002/mrm.25089.
49. Chen RYZ, Fan FC, Kim S, Jan KM, Usami S, Chien S. Tissue–bloodpartition-coefficient for xenon – temperature and hematocritdependence. J. Appl. Physiol. 1980; 49(2): 178–183.
50. Ladefoge J, Andersen AM. Solubility of xenon-133 at 37 °C in water,saline, olive oil, liquid paraffin, solutions of albumin, and blood. Phys.Med. Biol. 1967; 12(3): 353–358.
51. Babin AL, Cannet C, Gerard C, Wyss D, Page CP, Beckmann N.Noninvasive assessment of bleomycin-induced lung injury and theeffects of short-term glucocorticosteroid treatment in rats usingMRI. J. Magn. Reson. Imaging 2011; 33(3): 603–614.
52. Chaudhary NI, Schnapp A, Park JE. Pharmacologic differentiation ofinflammation and fibrosis in the rat bleomycin model. Am. J. Respir.Crit. Care Med. 2006; 173(7): 769–776.
53. Fuld MK, Halaweish AF, Haynes SE, Divekar AA, Guo JF, Hoffman EA.Pulmonary perfused blood volume with dual-energy CT as surrogatefor pulmonary perfusion assessed with dynamic multidetector CT.Radiology 2013; 267(3): 747–756.
54. Kirby M, Heydarian M, Svenningsen S, Wheatley A, McCormack DG,Etemad-Rezai R, Parraga G. Hyperpolarized 3He magnetic resonancefunctional imaging semiautomated segmentation. Acad. Radiol.2012; 19(2): 141–152.
55. Freeman MS, Cleveland ZI, Qi Y, Driehuys B. Enabling hyperpolarized129Xe MR spectroscopy and imaging of pulmonary gas transfer tothe red blood cells in transgenic mice expressing human hemoglo-bin. Magn. Reson. Med. 2013; 70(5): 1192–1199.
MRI OF HP 129XE UPTAKE IN A RAT MODEL OF PULMONARY FIBROSIS
NMR Biomed. 2014 Copyright © 2014 John Wiley & Sons, Ltd. wileyonlinelibrary.com/journal/nbm
![Pulmonary 18F-FDG uptake helps refine current risk ... · self-propagating scar formation and end-stage fibrosis [10]. 18F-FDG uptake by tissues is a marker of glucose utilization,](https://static.fdocuments.net/doc/165x107/6035c829b976e577c9150e6c/pulmonary-18f-fdg-uptake-helps-refine-current-risk-self-propagating-scar-formation.jpg)