381 QSCI 381 - Winter 2012 Introduction to Probability and Statistics.
24
38 1 QSCI 381 - Winter 2012 Introduction to Probability and Statistics
-
Upload
collin-lindsey -
Category
Documents
-
view
236 -
download
1
Transcript of 381 QSCI 381 - Winter 2012 Introduction to Probability and Statistics.

381 QSCI 381 - Winter 2012
Introduction to Probability and Statistics

381
Basic Information Instructor:
Dr André Punt (FISH 206A; aepunt@u) Office hours: Contact directly
Teaching Assistant Mr Thomas Pool ([email protected]) Office hours: See web-site
Class web-site http://courses.washington.edu/qc381aep/
Prerequisites for this course MATH 120, a score of 2 on the advanced placement test, or or a score of 67% on the MATHPC placement test

381
Class Structure Lectures (BNS 117BNS 117): M, Tu, W, Th
(9.30-10.20) Computer laboratory sessions
(MGH 044MGH 044): F (9:30-10:20) Weekly homework assignments.

381
Class Evaluation Submission of homework
assignments. Homework assignments (30%;
based on the best 8 of 9). Mid-term examination (30%). Final examination (40%).

381
Course Overview Introduction (2 lectures) Summarizing data (4 lectures) Probability (3 lectures) Probability distributions (6
lectures) Making inferences from data (17
lectures)

381
Course Textbooks Required
Elementary Statistics by Larson and Farber
Optional An EXCEL manual

381
The Course and the Web Page The slides for each day’s lecture
will be placed on the web-page at the start of the day.
The readings for the week are already on the web-page.

381
What is Statistics About?
Statistics is the science of collecting, organizing, analyzing and interpreting
data in order to make decisions
Statistics is the science of data-based decision making in the face of
uncertainty

381
The Statistical Cycle1. Identify the questions that are to be
addressed.2. Select a set of hypotheses related to
the question.3. Collect data appropriate to the
question.4. Summarize and analyze the data.5. Do the results make sense / are they
consistent with other information.6. Repeat steps 2-5.

381
Statistics and the Natural Sciences
Statistics are a key part of the doing business in the natural sciences today: “Eliminating harvesting will reduce the risk
of extinction by 20%”; “50% of fish caught in the fishery are
immature”; and “80% of fish mature by age 5”.
Statistics is not just summarizing data.

381
Some definitions-I - information coming from
observations, counts, measurements, or responses.
The data you will be analyzing will almost always be a sample from a population.
381
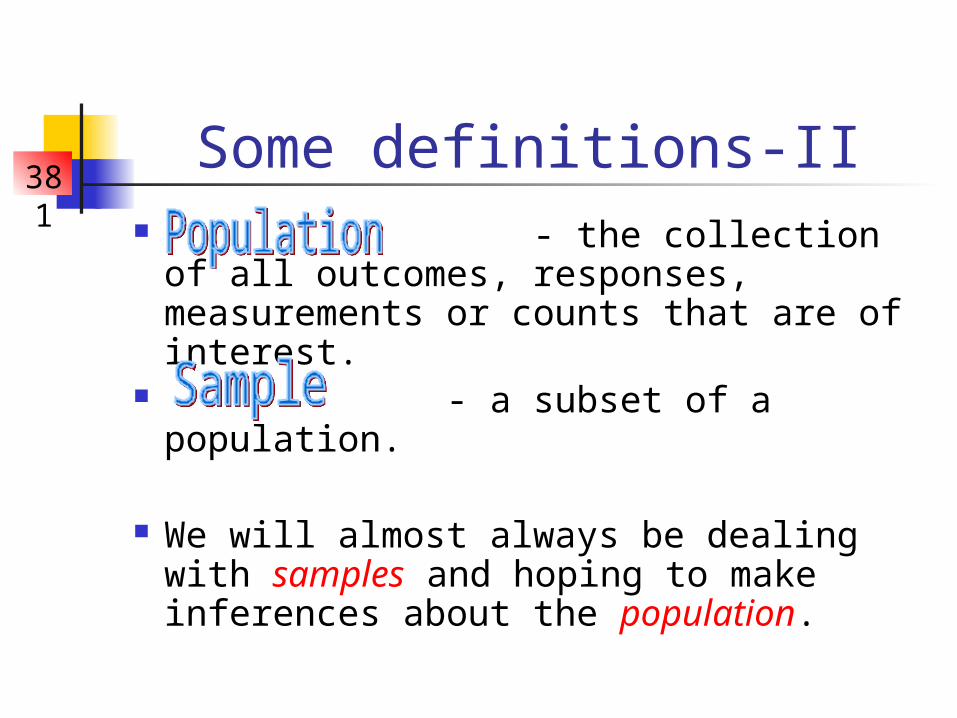
Some definitions-II - the collection of all
outcomes, responses, measurements or counts that are of interest.
- a subset of a population.
We will almost always be dealing with samples and hoping to make inferences about the population.

381
Samples and Populations

381
Samples and Populations It is important to be able to identify: a)
the data set, b) the sample, and c) the population.
This isn’t always so easy: Data = 10 counts of predator numbers in
West coast Marine Reserves. Populations = a) West coast marine
reserves, b) U.S. marine reserves, c) World marine reserves, d) Marine reserves off the west coast that can be sampled?

381
Parameters and Statistics-I - a numerical description of
a characteristic of the population. - a numerical description of a
characteristic of the sample.
We will often wish to make inferences about parameters based on statistics.

381
Parameters and Statistics-II
Whether you are dealing with a parameter or a statistic depends on whether the data relate to the whole population or only a subset of it.
Examples: Average length of all fish passing a weir. Average length of a sample of the fish passing
the same weir. Note: sometimes a quantity could be both
a parameter and a statistic depending the definition of the population (and the question being addressed).

381
Branches of Statistics - relate to
organizing, summarizing, and displaying data.
- relate to using a sample to draw conclusions about a population.
Inferential statistics involves drawing a conclusion from some data.

381
Inferences vs Summaries This can be quite subtle. Consider:
Average length of females and males: 90cm and 100cm respectively.
Descriptive statistics: the values. Inference: males are (in general)
larger than females.

381
Data Classification-I - attributes, labels, non-
numerical values. - numerical
measurements or counts.
Note: Numbers can be “qualitative” (e.g. when analyzing data from surveys, the haul number is qualitative)

381
Data Classification-II
Species Species#
Ocean Basin
Maximum Age
Merluccius capensis 1 Atlantic 7
Merluccius paradoxus 2 Atlantic 5
Merluccius productus 3 Pacific 20
Which fields are qualitative and which are quantitative?

381
Levels of Measurement-I A data set can be classified according
to the highest level of measurement that applies. The four levels of measurement, listed from lowest to highest are:
1. Nominal2. Ordinal3. Interval4. Ratio

381
Levels of Measurement-II - Categories, names, labels,
or qualities. Species name, maturity state, river sampled
- The data can be arranged
in order, but there is no way to assign numerical values to the differences among levels. Condition of a released fish (live, dubious,
dead).

381
Levels of Measurement-III - Data can be ordered and
values subtracted, but ratios make little sense / zero is simply a “reference” level. Year, Month, Temperature
- As for interval data, but zero and ratios of values have meaning. Height, length, weight, speed, number of
recaptures.

381
Levels of Measurement-IV(Cheat sheet)
Level Put in categorie
s
Arrange in order
Subtract values
Divide values
Nominal Yes No No No
Ordinal Yes Yes No No
Interval Yes Yes Yes No
Ratio Yes Yes Yes Yes