3.60 160 Ascendas Real Estate Investment Trust engages in ...
12
August 3, 2021 REITs Singapore THIS REPORT HAS BEEN PREPARED BY MAYBANK KIM ENG RESEARCH SEE PAGE 9 FOR IMPORTANT DISCLOSURES AND ANALYST CERTIFICATIONS Co. Reg No: 198700034E MICA (P) : 099/03/2012 Tear Sheet Insert Chua Su Tye [email protected] (65) 6231 5842 Ascendas REIT (AREIT SP) Growth And Resilience Still our top pick, BUY AREIT achieved DPU growth of 5.4% YoY and 3.3% HoH in 1H21, with stronger portfolio rental reversions in 2Q21, which were under-pinned by its under-rented US business park assets, and growth from its Singapore portfolio. Its occupancy improved in Singapore and Australia, with rental recovery into FY21 well underway. We have kept our forecasts intact. Fundamentals remain strong, backed by scale, rising DPU visibility, upside from acquisitions and/or redevelopments, and further overseas diversification. Valuations are undemanding at 5.1% FY21 yield. Maintain BUY, with SGD3.65 DDM-based TP (COE: 6.2%, LTG: 2.0%). Better occupancies in Singapore, Australia Portfolio occupancy improved QoQ to 91.3% (from 90.6% in 1Q21) as better occupancies in Singapore (86.9% to 87.9%) and Australia (94.9% to 98.4%) offset a dip in the UK/ Europe (from 98.6% to 97.5%), due to transitory downtime. Tenants in the biomedical, IT/ data centres, and lifestyle/ retail/ consumer trade segments accounted for the highest proportion of new demand by gross rental income in 1H21, at c.34%, c.20% and c.9% respectively. Expansion activity in Singapore saw a single tenant fully lease a light industrial property (at 31 Joo Koon Circle) on a 20-year term. Rental reversion strong at +8.9% Its portfolio delivered a +8.9% rental reversion in 2Q21, up from +3.0% in 1Q21 and +2.5% in 4Q20. Reversions in Singapore were stronger at +3.4%, versus +2.9% in 1Q21 and +0.9% in 4Q20, led by growth for its business & science parks at +3.7% (from +2.8%), high-specs at +4.8% (from -0.9%), and logistics & distribution centres at +4.9% (versus +5.6%), and a +26.3% jump in the US (from +6.2% in 1Q21). With leasing sentiment having improved from six months ago, and its US properties being under-rented by 10-30%, we maintain an optimistic outlook for its rental growth, with reversions tracking to its low single-digit positive guidance for 2021. An AUM boost, redevelopment upside Its AUM rose 16% HoH to SGD15.9b with the completion of its c.SGD905m European data centre portfolio and c.SGD534m Galaxis acquisitions, and as a result, gearing rose to 37.6% (from 32.8%). AREIT has secured approval from the URA for the redevelopment of its Science Park property (TÜV SÜD PSB Building), which should gain from a 3.5x in plot ratio and expansion in GFA to c.112k sqm (from c.32k sqm). We await details in 4Q for the SGD0.8- 1.0b project, which we expect, to be supported by its sponsor. Share Price SGD 3.12 12m Price Target SGD 3.65 (+22%) Previous Price Target SGD 3.65 BUY Company Description Statistics 52w high/low (SGD) 3m avg turnover (USDm) Free float (%) Issued shares (m) Market capitalisation Major shareholders: 17.7% na 2,925 28.5 Ascendas Real Estate Investment Trust engages in the investment in a portfolio of properties and property related assets. Temasek na 3.54/2.85 82.0 SGD9.1B USD6.7B Price Performance 90 100 110 120 130 140 150 160 2.20 2.40 2.60 2.80 3.00 3.20 3.40 3.60 Aug-19 Nov-19 Feb-20 May-20 Aug-20 Nov-20 Feb-21 May-21 Ascendas REIT - (LHS, SGD) Ascendas REIT / Straits Times Index - (RHS, %) -1M -3M -12M Absolute (%) 6 0 (12) Relative to index (%) 5 2 (30) Source: FactSet FYE Mar (SGD m) FY19A FY20A FY21E FY22E FY23E Revenue 886 1,049 1,192 1,283 1,318 Net property income 650 776 908 979 1,007 Core net profit 432 431 654 687 712 Core EPU (cts) 15.6 12.5 15.3 15.9 16.4 Core EPU growth (%) (7.6) (20.1) 22.4 4.3 3.0 DPU (cts) 15.1 14.7 15.8 16.5 17.1 DPU growth (%) (5.8) (2.5) 7.5 4.3 3.6 P/NTA (x) 1.3 1.3 1.3 1.3 1.3 DPU yield (%) 5.3 4.9 5.1 5.3 5.5 ROAE (%) 6.9 5.3 6.6 6.6 6.7 ROAA (%) 3.6 3.0 4.1 4.1 4.2 Debt/Assets (x) 0.33 0.31 0.33 0.32 0.32 Consensus DPU - - 15.9 16.7 17.0 MKE vs. Consensus (%) - - (0.7) (1.2) 0.4
Transcript of 3.60 160 Ascendas Real Estate Investment Trust engages in ...

3.12
August 3, 2021
R
EIT
s Sin
gapore
THIS REPORT HAS BEEN PREPARED BY MAYBANK KIM ENG RESEARCH
SEE PAGE 9 FOR IMPORTANT DISCLOSURES AND ANALYST CERTIFICATIONS
Co. Reg No: 198700034E MICA (P) : 099/03/2012
Tear Sheet Insert
Chua Su Tye [email protected] (65) 6231 5842
Ascendas REIT (AREIT SP)
Growth And Resilience
Still our top pick, BUY
AREIT achieved DPU growth of 5.4% YoY and 3.3% HoH in 1H21, with
stronger portfolio rental reversions in 2Q21, which were under-pinned by
its under-rented US business park assets, and growth from its Singapore
portfolio. Its occupancy improved in Singapore and Australia, with rental
recovery into FY21 well underway. We have kept our forecasts intact.
Fundamentals remain strong, backed by scale, rising DPU visibility, upside
from acquisitions and/or redevelopments, and further overseas
diversification. Valuations are undemanding at 5.1% FY21 yield. Maintain
BUY, with SGD3.65 DDM-based TP (COE: 6.2%, LTG: 2.0%).
Better occupancies in Singapore, Australia
Portfolio occupancy improved QoQ to 91.3% (from 90.6% in 1Q21) as better
occupancies in Singapore (86.9% to 87.9%) and Australia (94.9% to 98.4%)
offset a dip in the UK/ Europe (from 98.6% to 97.5%), due to transitory
downtime. Tenants in the biomedical, IT/ data centres, and lifestyle/
retail/ consumer trade segments accounted for the highest proportion of
new demand by gross rental income in 1H21, at c.34%, c.20% and c.9%
respectively. Expansion activity in Singapore saw a single tenant fully lease
a light industrial property (at 31 Joo Koon Circle) on a 20-year term.
Rental reversion strong at +8.9%
Its portfolio delivered a +8.9% rental reversion in 2Q21, up from +3.0% in
1Q21 and +2.5% in 4Q20. Reversions in Singapore were stronger at +3.4%,
versus +2.9% in 1Q21 and +0.9% in 4Q20, led by growth for its business &
science parks at +3.7% (from +2.8%), high-specs at +4.8% (from -0.9%), and
logistics & distribution centres at +4.9% (versus +5.6%), and a +26.3% jump
in the US (from +6.2% in 1Q21). With leasing sentiment having improved
from six months ago, and its US properties being under-rented by 10-30%,
we maintain an optimistic outlook for its rental growth, with reversions
tracking to its low single-digit positive guidance for 2021.
An AUM boost, redevelopment upside
Its AUM rose 16% HoH to SGD15.9b with the completion of its c.SGD905m
European data centre portfolio and c.SGD534m Galaxis acquisitions, and
as a result, gearing rose to 37.6% (from 32.8%). AREIT has secured approval
from the URA for the redevelopment of its Science Park property (TÜV SÜD
PSB Building), which should gain from a 3.5x in plot ratio and expansion in
GFA to c.112k sqm (from c.32k sqm). We await details in 4Q for the SGD0.8-
1.0b project, which we expect, to be supported by its sponsor.
Share Price SGD 3.12
12m Price Target SGD 3.65 (+22%)
Previous Price Target SGD 3.65
BUY
Company Description
Statistics
52w high/low (SGD)
3m avg turnover (USDm)
Free float (%)
Issued shares (m)
Market capitalisation
Major shareholders:
17.7%
na
na
2,925
28.5
Ascendas Real Estate Investment Trust engages in the
investment in a portfolio of properties and property
related assets.
Temasek
na
na
3.54/2.85
82.0
SGD9.1B
USD6.7B
Price Performance
90
100
110
120
130
140
150
160
2.20
2.40
2.60
2.80
3.00
3.20
3.40
3.60
Aug-19 Nov-19 Feb-20 May-20 Aug-20 Nov-20 Feb-21 May-21
Ascendas REIT - (LHS, SGD) Ascendas REIT / Straits Times Index - (RHS, %)
-1M -3M -12M
Absolute (%) 6 0 (12)
Relative to index (%) 5 2 (30)
Source: FactSet
FYE Mar (SGD m) FY19A FY20A FY21E FY22E FY23E
Revenue 886 1,049 1,192 1,283 1,318
Net property income 650 776 908 979 1,007
Core net profit 432 431 654 687 712
Core EPU (cts) 15.6 12.5 15.3 15.9 16.4
Core EPU growth (%) (7.6) (20.1) 22.4 4.3 3.0
DPU (cts) 15.1 14.7 15.8 16.5 17.1
DPU growth (%) (5.8) (2.5) 7.5 4.3 3.6
P/NTA (x) 1.3 1.3 1.3 1.3 1.3
DPU yield (%) 5.3 4.9 5.1 5.3 5.5
ROAE (%) 6.9 5.3 6.6 6.6 6.7
ROAA (%) 3.6 3.0 4.1 4.1 4.2
Debt/Assets (x) 0.33 0.31 0.33 0.32 0.32
Consensus DPU - - 15.9 16.7 17.0
MKE vs. Consensus (%) - - (0.7) (1.2) 0.4
August 3, 2021 2
Ascendas REIT
Value Proposition
Largest listed S-REIT, and first and largest listed within the
industrial sub-sector. AREIT is backed by sponsor Ascendas-
Singbridge, acquired by CapitaLand (CAPL SP, Not-rated) in
Jul 2019, and now boasts a SGD133b AUM.
Offers prominent exposure to Singapore business parks and
hi-spec buildings (50% of portfolio), which are geared
towards ‘growth sector’ tenancies.
Greater clarity on acquisitive growth trajectory, with
Australian, UK and US assets driving earnings visibility and
Singapore properties entrenching business park footprint.
Proactive portfolio reconstitution has strengthened balance
sheet. We expect management will endeavour to recycle
capital into higher-yielding and newer assets.
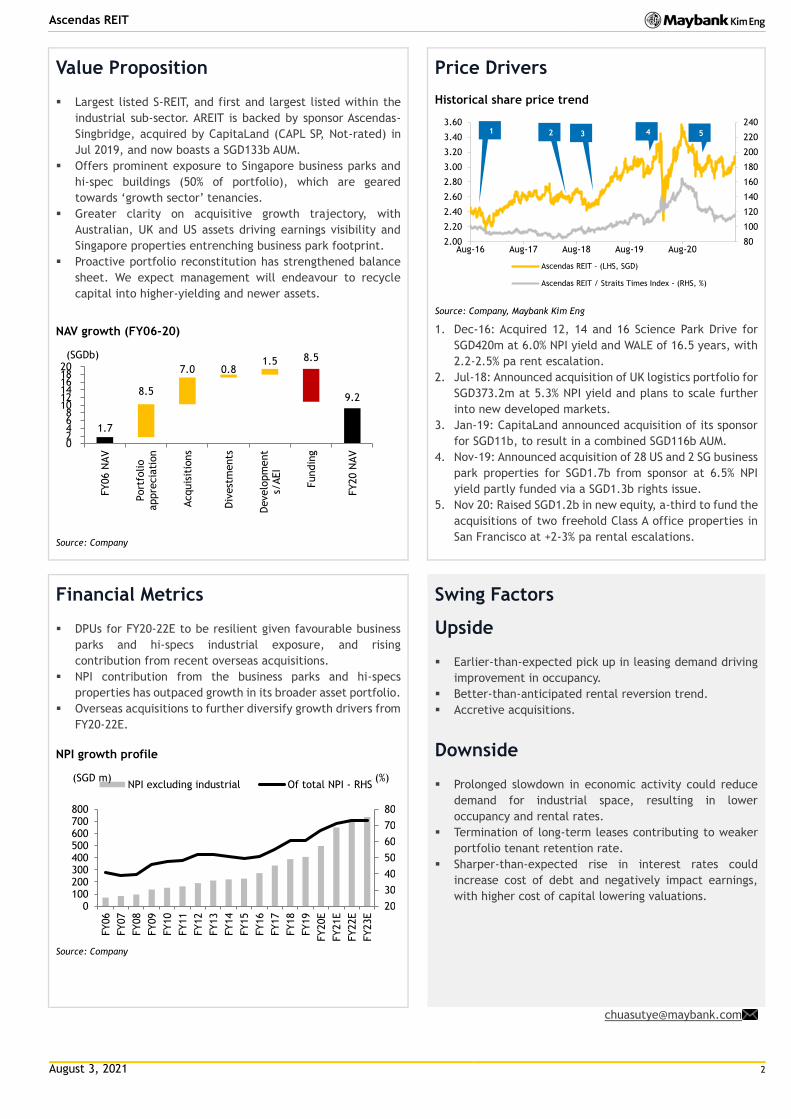
NAV growth (FY06-20)
Source: Company
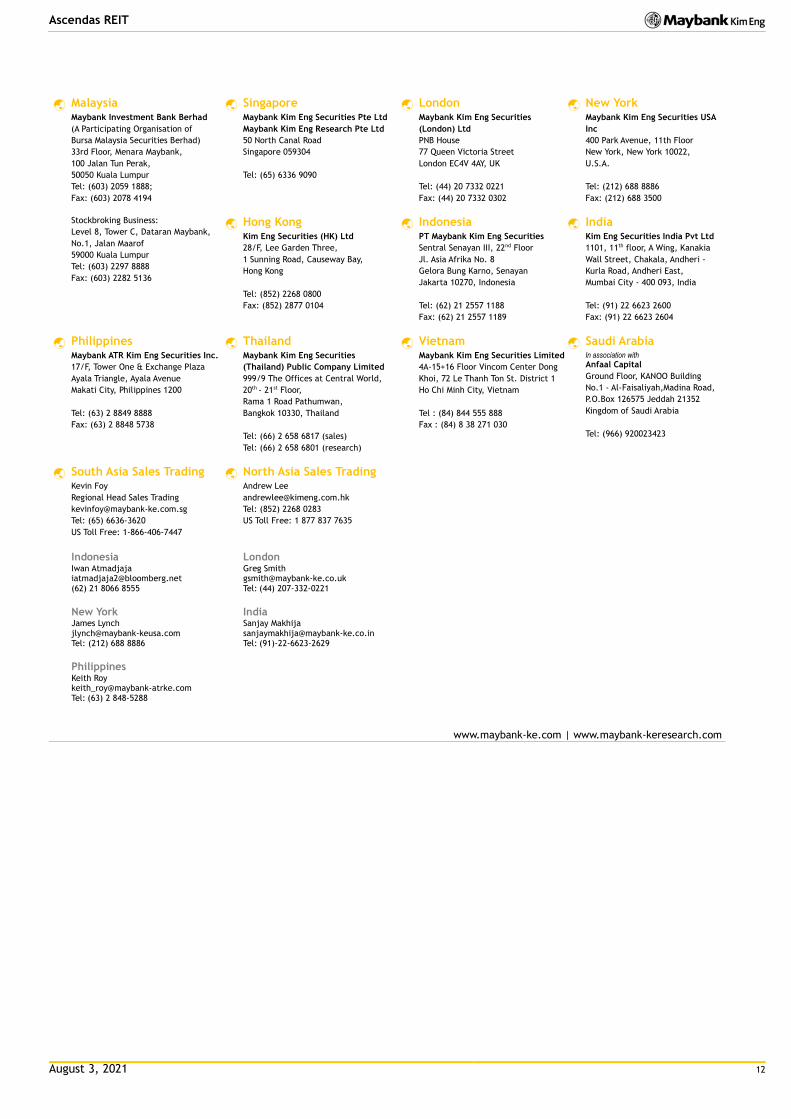
Price Drivers
Historical share price trend
Source: Company, Maybank Kim Eng
1. Dec-16: Acquired 12, 14 and 16 Science Park Drive for
SGD420m at 6.0% NPI yield and WALE of 16.5 years, with
2.2-2.5% pa rent escalation.
2. Jul-18: Announced acquisition of UK logistics portfolio for
SGD373.2m at 5.3% NPI yield and plans to scale further
into new developed markets.
3. Jan-19: CapitaLand announced acquisition of its sponsor
for SGD11b, to result in a combined SGD116b AUM.
4. Nov-19: Announced acquisition of 28 US and 2 SG business
park properties for SGD1.7b from sponsor at 6.5% NPI
yield partly funded via a SGD1.3b rights issue.
5. Nov 20: Raised SGD1.2b in new equity, a-third to fund the
acquisitions of two freehold Class A office properties in
San Francisco at +2-3% pa rental escalations.
Financial Metrics
DPUs for FY20-22E to be resilient given favourable business
parks and hi-specs industrial exposure, and rising
contribution from recent overseas acquisitions.
NPI contribution from the business parks and hi-specs
properties has outpaced growth in its broader asset portfolio.
Overseas acquisitions to further diversify growth drivers from
FY20-22E.
NPI growth profile
Source: Company
Swing Factors
Upside
Earlier-than-expected pick up in leasing demand driving
improvement in occupancy.
Better-than-anticipated rental reversion trend.
Accretive acquisitions.
Downside
Prolonged slowdown in economic activity could reduce
demand for industrial space, resulting in lower
occupancy and rental rates.
Termination of long-term leases contributing to weaker
portfolio tenant retention rate.
Sharper-than-expected rise in interest rates could
increase cost of debt and negatively impact earnings,
with higher cost of capital lowering valuations.
8.5
8.5
7.0 0.81.5
1.7
9.2
02468
101214161820
FY06 N
AV
Port
folio
appre
cia
tion
Acquis
itio
ns
Div
est
ments
Develo
pm
ent
s/AEI
Fundin
g
FY20 N
AV
(SGDb)
80
100
120
140
160
180
200
220
240
2.00
2.20
2.40
2.60
2.80
3.00
3.20
3.40
3.60
Aug-16 Aug-17 Aug-18 Aug-19 Aug-20
Ascendas REIT - (LHS, SGD)
Ascendas REIT / Straits Times Index - (RHS, %)
20
30
40
50
60
70
80
0100200300400500600700800
FY06
FY07
FY08
FY09
FY10
FY11
FY12
FY13
FY14
FY15
FY16
FY17
FY18
FY19
FY20E
FY21E
FY22E
FY23E
NPI excluding industrial Of total NPI - RHS(SGD m) (%)
1 2 3 5 4

August 3, 2021 3
Ascendas REIT
Risk Rating & Score¹ 11.8 (Low)
Score Momentum² -2.6
Last Updated 14 April 2021
Controversy Score³ (Updated: 13 Sep 2013)
0 – No Reported Incident
Business Model & Industry Issues
AREIT draws on its available pool of funds to invest in industrial real estate, carry out asset enhancements, and redevelop
properties to optimise value for its unitholders. It is susceptible to sustainability-focused investors with strong preference for
investing in companies that meet specific ESG criteria, given its incessant need for additional capital.
Its activities relating to permissible investments, leverage limits and annual reporting requirements are closely regulated by
the MAS under Singapore’s code on collective investment schemes. Independence, real estate and capital markets experience
on its board is high, with strong representation by members with international experience, essential in our view, as its overseas
portfolio is increasingly a growth platform.
It has driven a transformation of its portfolio through AEIs, redevelopments and acquisitions, to strengthen its dominance in
Singapore’s business & science park segment and diversify growth overseas, with freehold properties now c.34% of its AUM.
It has intensified efforts to reduce its energy and carbon footprint, and could be encouraged to commit to long-term targets
and explore green financing, to better align with its new sponsor.
Material E issues
36 of its 98 Singapore properties are BCA Green Mark
certified with 28 certified Gold or above.
Achieved in the fourth year a target to reduce energy
intensity for its Singapore buildings by 3% over 5 years from
Mar 2017. No target was set yet for Australia.
Joined SembCorp Ind. to install >21,000 solar panels at 6
properties, to generate 10,000 MWH of renewable energy
and reduce carbon dioxide emissions by 4.3m kg pa.
Water consumption, and waste & material use, have not
been identified as material issues although water usage and
intensity are monitored, and its sponsor has embarked on a
‘paperless’ initiative for its offices in 2020.
Issued its first SGD100m green bond in Aug 2020, and the
first real estate SGD300m green perpetual securities in Asia
under its green finance framework.
Key G metrics and issues
Externally managed by Ascendas Fund Mgt Ltd, a 100%
subsidiary of its sponsor CapitaLand, which supports its
growth via a pipeline of property assets from its
development activities, and access to capital markets.
Board independence is high – it comprises eight members,
five of whom including the Chairman are independent,
with non-finance/ real estate backgrounds. The CEO is the
only executive and non-independent board member.
Revised computation of management fees (in FY15) in
favour of unitholders, with the base fee set at 0.5% of
adjusted deposited property, and the performance fee at
0.1% of adjusted deposited property if DPU growth >2.5%
YoY and 0.2% if >5.0% YoY.
The cumulative remuneration of its key management
team, including the CEO, has represented <0.9% of the
REIT’s distributable income since it was first reported in
FY17.
Payout ratio for taxable income has been consistently
maintained above the minimum 90% threshold for tax
transparency.
Has completed five DPU-accretive overseas portfolio
acquisitions that totalled SGD4.4b since 2015, with its
sponsor supporting the SGD1.3b rights issue in 2020 to fund
the SGD1.7b deal for 28 US and 2 Singapore business park
properties.
Has completed 16 development/ redevelopment projects
since 2006, achieving SGD432.8m in total cumulative
unrealised gains at c.41% over development costs.
Has maintained a sound balance sheet with leverage <38%
historically. Its AUM rose c.44% between from 2018-20 due
to acquisitions, while leverage stayed low at 38.0% (as of
end-Mar 2021) and below the 50% regulatory limit.
Material S issues
Has grown its community-focused capacities with the
expansion of its flexible workspace, while AEIs have added
collaborative spaces, gyms and end-of-trip facilities.
Piloted initiatives at Science Park to support Singapore’s
largest 5G smart estate trial, and develop proof-of-
concepts and prototypes for smart urban technologies.
Its sponsor has committed SGD5m to improve the digital
skills of AREIT’s employees over the next two years, while
its in-house training hub, the CapitaLand Institute of
Management and Business, supports employees’ training
and professional development needs.
Gender diversity is low vs peers with female representation
at 44% amongst all employees and at the management level,
and 2 out of 9 seats on the board.
¹Risk Rating & Score - derived by Sustainalytics and assesses the company’s exposure to unmanaged ESG risks. Scores range between 0 - 50 in order of increasing severity with low/high scores & ratings representing negligible/significant risk to the company’s enterprise value, respectively, from ESG-driven financial impacts. ²Score Momentum - indicates changes to the company's score since the last update – a negative integer indicates a company’s improving risk score; a positive integer indicates a deterioration. ³Controversy Score - reported periodically by Sustainalytics in the event of material ESG-related incident(s), with the impact severity scores of these events ranging from Category 0-5 (0 - no reports; 1 - negligible risks; ...; 5 - poses serious risks & indicative of potential structural deficiencies at the company).

August 3, 2021 4
Ascendas REIT
Fig 1: Summary financials 1H21 comparison
FYE 31 Mar 1H20 2H20 1H21 Change YTD21 % of FYE FY21E
(SGD m) (SGD m) (SGD m) (% YoY) (% HoH) (SGD m) (SGD m)
Gross revenue 521.2 528.2 586.0 12.4 10.9 586.0 49.3 1187.8 Property expenses (133.2) (140.0) (140.4) 5.4 0.3 (140.4) 51.1 (274.9)
Net property income 388.0 388.2 445.6 14.8 14.8 445.6 48.8 912.9 Borrowing costs (84.8) (76.4) (81.9) (3.4) 7.2 (81.9) 51.0 (160.7)
Distributable income to unitholders 263.2 275.2 311.0 18.2 13.0 311.0 49.0 634.4 Distribution per unit (SGD cts) 7.27 7.42 7.66 5.4 3.3 7.66 48.6 15.77 NAV per unit (SGD) 2.20 2.21 2.27 Aggregate leverage (%)^ 36.1 32.8 37.6 150 480 All-in financing cost (%)^ 2.9 2.7 2.4 (50) (30) Occupancy (%)^ 91.5 91.7 91.3 (20) (40) Rental reversion (%)^ 4.3 3.8 8.9 NPI margin (%)^ 74.4 73.5 76.0 159 254
^Change in basis points
Source: Company data, Maybank Kim Eng,
* AREIT has revised its financial year-end to Dec in line with its sponsor
Fig 2: Portfolio occupancy up QoQ to 91.3% (from 90.6%), due
to S’pore (86.9% to 87.9%) and Australia (94.9% to 95.8%)
Source: Company data
* AREIT has revised its financial year-end to Dec in line with its sponsor
Fig 3: Rental reversion was +8.9%, vs +3.0% in 1Q21, while
Singapore’s reversion was +3.4%, from +2.9%
Source: Company data, Maybank Kim Eng estimates
* AREIT has revised its financial year-end to Dec in line with its sponsor
Fig 4: Dividend yield at -1SD below its 18-year average and
could compress further as rental recovery picks up pace
Source: Bloomberg, Maybank Kim Eng
Fig 5: P/BV has pulled back to its 18-year average of 1.2x, and
should rise on the back of AUM growth
Source: Bloomberg, Maybank Kim Eng
80
85
90
95
100
3Q
16
4Q
16
1Q
17
2Q
17
3Q
17
4Q
17
1Q
18
2Q
18
3Q
18
4Q
18
1Q
19
2Q
19
3Q
19
4Q
19
1Q
20
2Q
20
3Q
20
1Q
20*
2Q
20*
3Q
20*
4Q
20*
1Q
21*
2Q
21*
Singapore Australia
UK US
Portfolio
(%)
-20
-10
0
10
20
30
1Q
15
3Q
15
1Q
16
3Q
16
1Q
17
3Q
17
1Q
18
3Q
18
1Q
19
3Q
19
1Q
20
4Q
19*
2Q
20*
4Q
20*
2Q
21*
Business & science parksHi-specs industrial buildingsLight industrial buildingsLogistics & distribution centresIntegrated development, retail & amenities
(%)
3
4
5
6
7
8
9
10
11
12
Feb-0
3
Feb-0
4
Feb-0
5
Feb-0
6
Feb-0
7
Feb-0
8
Feb-0
9
Feb-1
0
Feb-1
1
Feb-1
2
Feb-1
3
Feb-1
4
Feb-1
5
Feb-1
6
Feb-1
7
Feb-1
8
Feb-1
9
Feb-2
0
Feb-2
1
Div Yld -1sd Average +1sd(%)
0.0
0.5
1.0
1.5
2.0
2.5
Feb-0
3
Feb-0
4
Feb-0
5
Feb-0
6
Feb-0
7
Feb-0
8
Feb-0
9
Feb-1
0
Feb-1
1
Feb-1
2
Feb-1
3
Feb-1
4
Feb-1
5
Feb-1
6
Feb-1
7
Feb-1
8
Feb-1
9
Feb-2
0
Feb-2
1
P/BV -1sd Average +1sd(x)

August 3, 2021 5
Ascendas REIT
Fig 6: S-REITs valuation comparison
Company Rec. Price TP Upside Yield Total
return
MC ADTV Free
Float
BVPS P/BV Dividend yield (%) Gearing
(D/A)
(SGD) (SGD) (%) (%) (%) (SGD b) (SGD m) (%) (SGD) (x) 19 20 21E 22E (%)
Retail 8.0 12.0 0.92 6.1 3.9 5.7 6.0 33
Frasers Ctr Trust (FCT) Buy 2.41 2.90 20.3 5.0 25.3 4.1 9.1 59 2.21 1.09 5.0 3.7 5.0 5.3 34
Starhill Global (SGREIT) NR 0.62 1.4 1.6 62 0.81 0.76 7.2 4.9 6.4 6.8 36
SPH REIT (SPHREIT) Hold 0.92 0.80 (12.6) 5.7 (6.8) 2.5 1.4 29 1.02 0.90 6.1 3.0 5.7 5.8 30
Retail & Office 26.3 81.5 1.01 5.1 4.4 5.2 5.5 37
Cap. Int. Comm. Trust (CICT) Buy 2.15 2.55 18.6 5.0 23.6 13.9 38.6 37 2.01 1.07 5.6 4.1 5.0 5.5 34
Mapletree Comm. (MCT) Buy 2.14 2.35 9.8 4.6 14.4 7.1 17.0 61 1.72 1.24 3.8 4.3 4.6 4.6 34
Suntec REIT (SUN) Hold 1.47 1.25 (15.0) 5.8 (9.2) 4.2 26.0 46 2.18 0.67 6.5 4.8 5.8 6.2 43
Lendlease REIT (LREIT) NR 0.88 1.0 75 0.85 1.04 4.4 4.3 5.4 5.6 35
Office 6.8 11.9 0.71 6.2 5.2 6.1 5.7 38
Keppel REIT (KREIT) Sell 1.20 0.95 (20.8) 4.9 (15.9) 4.4 10.9 58 n.a. n.a. 4.7 4.8 4.9 5.0 39
OUE Comm. (OUECT) NR 0.44 2.4 1.0 27 0.61 0.71 7.6 5.5 7.2 6.4 38
Industrial 44.5 129.8 1.38 5.2 5.0 5.3 5.6 37
Ascendas REIT (AREIT) Buy 3.12 3.65 17.0 5.1 22.0 13.0 39.1 83 2.21 1.41 3.6 4.8 5.1 5.3 38
Mapletree Ind. (MINT) Buy 2.99 3.35 12.0 4.5 16.5 8.0 22.8 77 1.86 1.61 4.2 4.2 4.5 4.7 31
Mapletree Log. (MLT) Buy 2.11 2.35 11.4 4.2 15.5 9.0 24.7 68 1.32 1.60 3.8 3.9 4.2 4.3 38
Keppel DC REIT (KDCREIT) NR 2.60 4.2 18.6 79 1.21 2.15 3.0 3.5 3.9 4.1 37
Frasers Log. & Ind. (FLT) NR 1.53 5.6 15.2 72 1.14 1.35 4.4 4.5 5.0 5.1 35
ARA Logos Trust (ALLT) Buy 0.90 0.95 6.1 6.0 12.2 1.3 2.8 90 0.67 1.33 6.2 5.9 6.0 6.3 40
AIMS APAC (AAREIT) Buy 1.60 1.60 0.0 6.1 6.1 1.1 1.7 60 1.53 1.04 5.9 5.6 6.1 6.2 34
ESR REIT (ESREIT) NR 0.45 1.7 4.5 70 0.40 1.12 8.9 6.4 7.0 7.4 43
Sabana SC REIT (SSREIT) NR 0.44 0.5 0.4 59 0.52 0.84 6.6 6.3 6.5 6.9 35
Hospitality 6.9 7.8 0.82 7.3 6.1 5.4 6.0 40
Ascott Res. Trust (ART) Buy 1.04 1.30 25.0 4.0 29.0 3.2 4.6 59 n.a. n.a. 7.0 7.3 4.0 5.1 36
CDL HT (CDLHT) Hold 1.20 1.20 0.0 4.0 4.0 1.5 2.1 61 1.32 0.91 7.5 4.1 4.0 4.6 39
Far East HT (FEHT) Buy 0.60 0.70 17.6 4.4 22.0 1.2 0.9 47 0.79 0.75 6.4 4.1 4.4 5.0 41
Frasers HT (FHT) Hold 0.53 0.50 (5.7) 9.1 3.5 1.0 0.2 38 0.66 0.81 8.3 8.8 9.1 9.1 42
Offshore REITs 18.4 22.9 0.88 10.1 7.3 7.4 7.6 37
Mapletree N. Asia (MAGIC) NR 1.02 3.6 7.0 59 1.27 0.80 6.9 6.0 6.8 7.2 42
Capita China Trust (CLCT) NR 1.42 2.2 4.0 69 1.57 0.90 6.9 4.5 6.2 6.8 36
Ascendas India Trust (AIT) NR 1.43 1.6 2.9 94 n.a. n.a. 5.0 6.2 6.4 0.0 30
Sasseur REIT (SASSR) Buy 0.97 1.05 8.2 6.9 15.2 1.2 1.4 41 0.92 1.05 6.7 6.7 6.9 7.4 28
Dasin Retail Trust (DASIN) NR 0.50 0.4 0.3 8 1.41 0.35 13.7 8.0 9.1 9.1 37
BHG Retail REIT (BHGREIT) NR 0.59 0.3 0.0 24 0.86 0.68 n.a. n.a. 5.1 5.6 36
Lippo Malls Ind. RT (LMIRT) NR 0.06 0.5 0.2 40 0.10 0.65 34.5 n.a. n.a. n.a. 42
Manulife US REIT (MUST) Buy 0.77 1.00 29.9 7.6 37.5 1.7 1.6 91 0.71 1.08 7.8 7.7 7.6 7.7 41
Prime US REIT (PRIME) Buy 0.84 1.10 31.0 8.5 39.4 1.3 0.9 51 0.84 1.00 5.9 8.2 8.5 8.6 34
Keppel P.O. US REIT (KORE) NR 0.80 1.0 1.1 84 0.82 0.97 7.6 7.8 7.5 7.5 37
Cromwell REIT (CEREIT) NR 2.50 2.2 1.9 83 1.32 0.95 7.2 7.0 7.0 7.2 39
IREIT Global (IREIT) NR 0.64 0.7 0.5 66 0.76 0.84 8.0 8.0 6.4 7.1 35
EC World REIT (ECWREIT) NR 0.82 0.7 0.5 42 0.91 0.90 7.3 6.3 7.3 7.3 38
United Hampshire US (UHU) NR 0.73 0.5 0.2 79 0.74 0.98 5.9 7.1 8.6 8.8 38
Elite Commercial (ELITE) NR 0.68 0.6 0.3 76 0.62 1.08 6.1 6.5 7.5 7.6 42
Healthcare 3.3 4.1 1.45 15.9 17.6 2.9 3.1 36
Parkway Life REIT (PREIT) NR 4.70 2.8 3.4 64 1.98 2.37 2.8 2.9 2.9 3.1 37
First REIT (FIRST) NR 0.27 0.4 0.7 64 0.51 0.53 29.0 32.2 n.a. n.a. 35
Total REITs 114 270 1.04 7.6 6.3 6.0 6.1 37
S-REIT yield spread 2.7
FSTREI Index 4.0
SGS 10Y bond yield 1.3
Prices as of 2 Aug 2021. NR = Not Rated.
Source: Bloomberg, FactSet, Companies, Maybank Kim Eng

August 3, 2021 6
Ascendas REIT
FYE 31 Mar FY19A FY20A FY21E FY22E FY23E
Key Metrics
Price/DPU(x) 18.9 20.3 19.8 18.9 18.3
P/BV (x) 1.3 1.3 1.3 1.3 1.3
P/NTA (x) 1.3 1.3 1.3 1.3 1.3
DPU yield (%) 5.3 4.9 5.1 5.3 5.5
FCF yield (%) 6.4 6.7 6.3 6.8 7.0
INCOME STATEMENT (SGD m)
Revenue 886.2 1,049.5 1,192.3 1,283.1 1,318.4
Net property income 649.6 776.2 907.9 978.9 1,007.0
Management and trustee fees (62.1) (77.3) (83.6) (94.1) (95.2)
Net financing costs (126.5) (159.5) (157.2) (179.4) (184.6)
Associates & JV 0.5 9.6 5.3 0.5 0.5
Exceptionals 45.5 (54.8) 0.0 0.0 0.0
Other pretax income/expenses 10.5 0.0 0.0 0.0 0.0
Pretax profit 517.5 494.2 672.4 705.8 727.7
Income tax (14.4) (37.2) (40.3) (42.4) (43.7)
Minorities 0.0 0.0 0.0 0.0 0.0
Discontinued operations 0.0 0.0 0.0 0.0 0.0
Total return avail to unitholders 503.1 457.1 632.0 663.5 684.0
Core net profit 432.1 430.6 653.8 686.5 712.3
Distributable inc to unitholders 485.7 538.4 653.8 686.5 712.3
BALANCE SHEET (SGD m)
Cash & Short Term Investments 95.7 278.0 58.0 58.0 58.0
Accounts receivable 0.0 0.0 0.0 0.0 0.0
Property, Plant & Equip (net) 0.0 0.0 0.0 0.0 0.0
Inverstment properties 13,543.5 14,577.4 16,523.5 16,683.5 16,683.5
Intangible assets 0.0 0.0 0.0 0.0 0.0
Investment in Associates & JVs 0.2 112.4 0.0 0.0 0.0
Other assets 224.8 155.4 155.4 155.4 155.4
Total assets 13,864.1 15,123.2 16,736.9 16,896.9 16,896.9
ST interest bearing debt 0.0 0.0 0.0 0.0 0.0
Accounts payable 255.8 297.6 297.6 297.6 297.6
LT interest bearing debt 4,611.6 4,682.0 5,482.0 5,482.0 5,482.0
Other liabilities 885.4 953.1 953.1 953.1 953.1
Total Liabilities 5,752.9 5,932.7 6,732.7 6,732.7 6,732.7
Shareholders Equity 8,111.2 9,190.6 10,004.2 10,164.2 10,164.2
Minority Interest 0.0 0.0 0.0 0.0 0.0
Total shareholder equity 8,111.2 9,190.6 10,004.2 10,164.2 10,164.2
Total liabilities and equity 13,864.1 15,123.2 16,736.9 16,896.9 16,896.9
CASH FLOW (SGD m)
Cash flow from operations 589.1 729.5 820.0 879.7 910.6
Capex (0.0) (0.0) (0.0) (0.0) (0.0)
Acquisitions & investments (1,745.6) (889.8) (1,440.0) 0.0 0.0
Disposal of FA & investments 0.0 0.0 0.0 0.0 0.0
Dividend income from associates & JVs 0.0 0.0 0.0 0.0 0.0
Other investing cash flow 20.9 (95.6) 5.3 0.5 0.5
CF from investing activities (1,724.7) (985.4) (1,434.7) 0.5 0.5
Dividends paid (501.9) (597.9) (653.8) (686.5) (712.3)
Interest expense (108.2) (140.9) (157.2) (179.4) (184.6)
Change in debt 512.4 51.9 800.0 0.0 0.0
Equity raised / (purchased) 1,283.5 1,165.4 405.8 (14.3) (14.3)
Other financial activities 0.0 0.0 0.0 0.0 0.0
CF from financing activities 1,185.8 478.5 394.7 (880.2) (911.1)
Effect of exchange rate changes (0.6) 0.8 0.0 0.0 0.0
Net cash flow 49.6 223.4 (220.0) 0.0 0.0

August 3, 2021 7
Ascendas REIT
FYE 31 Mar FY19A FY20A FY21E FY22E FY23E
Key Ratios
Growth ratios (%)
Revenue growth 2.8 18.4 13.6 7.6 2.8
Net property income growth 3.2 19.5 17.0 7.8 2.9
Core net profit growth (1.4) (0.3) 51.9 5.0 3.7
Distributable income growth 3.8 10.9 21.4 5.0 3.7
Profitability ratios (%)
Net property income margin 73.3 74.0 76.1 76.3 76.4
Core net profit margin 48.8 41.0 54.8 53.5 54.0
Payout ratio 96.5 117.8 103.4 103.5 104.1
DuPont analysis
Total return margin (%) 56.8 43.6 53.0 51.7 51.9
Gross revenue/Assets (x) 0.1 0.1 0.1 0.1 0.1
Assets/Equity (x) 1.7 1.6 1.7 1.7 1.7
ROAE (%) 6.9 5.3 6.6 6.6 6.7
ROAA (%) 3.6 3.0 4.1 4.1 4.2
Leverage & Expense Analysis
Asset/Liability (x) 2.4 2.5 2.5 2.5 2.5
Net gearing (%) (excl. perps) 55.7 47.9 54.2 53.4 53.4
Net interest cover (x) 4.6 4.4 5.2 4.9 4.9
Debt/EBITDA (x) 7.8 6.7 6.7 6.2 6.0
Capex/revenue (%) 0.0 0.0 0.0 0.0 0.0
Net debt/ (net cash) 4,515.9 4,404.0 5,424.0 5,424.0 5,424.0
Debt/Assets (x) 0.33 0.31 0.33 0.32 0.32
Source: Company; Maybank

August 3, 2021 8
Ascendas REIT
Research Offices
ECONOMICS
Suhaimi ILIAS Chief Economist Malaysia | Philippines | Global (603) 2297 8682 [email protected]
CHUA Hak Bin Regional Thematic Macroeconomist (65) 6231 5830 [email protected]
LEE Ju Ye Singapore | Thailand | Indonesia (65) 6231 5844 [email protected]
Linda LIU Singapore | Vietnam | Cambodia | Myanmar | Laos (65) 6231 5847 [email protected]
Dr Zamros DZULKAFLI (603) 2082 6818 [email protected]
Ramesh LANKANATHAN (603) 2297 8685 [email protected]
FX
Saktiandi SUPAAT Head of FX Research (65) 6320 1379 [email protected]
Christopher WONG (65) 6320 1347 [email protected]
TAN Yanxi (65) 6320 1378 [email protected]
Fiona LIM (65) 6320 1374 [email protected]
STRATEGY
Anand PATHMAKANTHAN
ASEAN (603) 2297 8783 [email protected]
FIXED INCOME
Winson PHOON, ACA (65) 6340 1079 [email protected]
SE THO Mun Yi (603) 2074 7606 [email protected]
REGIONAL EQUITIES
Anand PATHMAKANTHAN Head of Regional Equity Research (603) 2297 8783 [email protected]
WONG Chew Hann, CA Head of ASEAN Equity Research (603) 2297 8686 [email protected]
ONG Seng Yeow Research, Technology & Innovation (65) 6231 5839 [email protected]
MALAYSIA
Anand PATHMAKANTHAN Head of Research (603) 2297 8783 [email protected] • Strategy
WONG Chew Hann (603) 2297 8686
[email protected] • Non-Bank Financials (stock exchange) • Construction & Infrastructure
Desmond CH’NG, BFP, FCA (603) 2297 8680 [email protected] • Banking & Finance
LIAW Thong Jung (603) 2297 8688 [email protected] • Oil & Gas Services- Regional • Automotive
ONG Chee Ting, CA (603) 2297 8678 [email protected] • Plantations - Regional
YIN Shao Yang, CPA (603) 2297 8916 [email protected] • Gaming – Regional • Media • Aviation • Non-Bank Financials
TAN Chi Wei, CFA (603) 2297 8690 [email protected] • Power • Telcos
WONG Wei Sum, CFA (603) 2297 8679 [email protected] • Property • Glove
Kevin WONG (603) 2082 6824 [email protected] • REITs • Technology
Jade TAM (603) 2297 8687 [email protected] • Consumer Staples & Discretionary
Fahmi FARID (603) 2297 8676 [email protected] • Software
Syifaa’ Nur FARAH (603) 2297 8675 [email protected] • Construction
Arvind JAYARATNAM (603) 2297 8692 [email protected] • Ports • Shipping • Petrochemicals
TEE Sze Chiah Head of Retail Research (603) 2082 6858 [email protected]
Nik Ihsan RAJA ABDULLAH, MSTA, CFTe (603) 2297 8694 [email protected] • Chartist
Amirah AZMI (603) 2082 8769 [email protected] • Retail Research
SINGAPORE
Thilan WICKRAMASINGHE Head of Research (65) 6231 5840 [email protected] • Banking & Finance - Regional • Consumer
CHUA Su Tye (65) 6231 5842 [email protected] • REITs - Regional
LAI Gene Lih, CFA (65) 6231 5832 [email protected] • Technology • Healthcare
Kareen CHAN (65) 6231 5926 [email protected] • Transport • Telcos • Consumer
Eric ONG (65) 6231 5924 [email protected] • SMIDs
Matthew SHIM (65) 6231 5929 [email protected]
• Retail Research
PHILIPPINES
Jacqui de JESUS Head of Research (63) 2 8849 8840 [email protected] • Strategy • Conglomerates
Rachelleen RODRIGUEZ, CFA (63) 2 8849 8843 [email protected] • Banking & Finance • Transport • Telcos
Benedict CLEMENTE (63) 2 8849 8846 [email protected] • Utilities
Daphne SZE (63) 2 8849 8847 [email protected] • Consumer
VIETNAM
Quan Trong Thanh Head of Research (84 28) 44 555 888 ext 8184 [email protected] • Banks
Hoang Huy, CFA (84 28) 44 555 888 ext 8181 [email protected] • Strategy • Technology
Le Nguyen Nhat Chuyen (84 28) 44 555 888 ext 8082 [email protected] • Oil & Gas
Nguyen Thi Sony Tra Mi (84 28) 44 555 888 ext 8084 [email protected] • Consumer
Tyler Manh Dung Nguyen (84 28) 44 555 888 ext 8085 [email protected] • Utilities • Property
Tran Thi Thu Thao (84 28) 44 555 888 ext 8180 [email protected] • Industrials
Nguyen Thi Ngan Tuyen Head of Retail Research (84 28) 44 555 888 ext 8081 [email protected] • Retail Research
Nguyen Thanh Lam (84 28) 44 555 888 ext 8086 [email protected] • Technical Analysis
INDIA
Jigar SHAH Head of Research (91) 22 4223 2632 [email protected] • Strategy • Oil & Gas • Automobile • Cement
Neerav DALAL (91) 22 4223 2606 [email protected] • Software Technology • Telcos
Vikram RAMALINGAM (91) 22 4223 2607 [email protected] • Automobile • Media
INDONESIA
Rahmi MARINA (62) 21 8066 8689 [email protected] • Banking & Finance
Willy GOUTAMA (62) 21 8066 8500 [email protected] • Consumer
Farah OKTAVIANI (62) 21 8066 8691 [email protected] • Construction
THAILAND
Maria LAPIZ Head of Institutional Research Dir (66) 2257 0250 | (66) 2658 6300 ext 1399 [email protected] • Strategy • Consumer • Materials • Services
Jesada TECHAHUSDIN, CFA (66) 2658 6300 ext 1395 [email protected] • Banking & Finance
Kaushal LADHA, CFA (66) 2658 6300 ext 1392 [email protected] • Oil & Gas – Regional • Petrochemicals - Regional • Utilities
Vanida GEISLER, CPA (66) 2658 6300 ext 1394 [email protected] • Property • REITs
Yuwanee PROMMAPORN (66) 2658 6300 ext 1393 Yuwanee.P @maybank-ke.co.th • Services • Healthcare
Ekachai TARAPORNTIP Head of Retail Research (66) 2658 5000 ext 1530 [email protected]
Surachai PRAMUALCHAROENKIT (66) 2658 5000 ext 1470 [email protected] • Auto • Conmat • Contractor • Steel
Suttatip PEERASUB (66) 2658 5000 ext 1430 [email protected] • Food & Beverage • Commerce
Jaroonpan WATTANAWONG (66) 2658 5000 ext 1404 [email protected] • Transportation • Small cap
Thanatphat SUKSRICHAVALIT (66) 2658 5000 ext 1401 [email protected]
• Media • Electronics
Wijit ARAYAPISIT (66) 2658 5000 ext 1450 [email protected] • Strategist
Theerasate PROMPONG (66) 2658 5000 ext 1400 [email protected] • Equity Portfolio Strategist
Apiwat TAVESIRIVATE (66) 2658 5000 ext 1310 [email protected] • Chartist and TFEX

August 3, 2021 9
Ascendas REIT
APPENDIX I: TERMS FOR PROVISION OF REPORT, DISCLAIMERS AND DISCLOSURES
DISCLAIMERS This research report is prepared for general circulation and for information purposes only and under no circumstances should it be considered or intended as an offer to sell or a solicitation of an offer to buy the securities referred to herein. Investors should note that values of such securities, if any, may fluctuate and that each security’s price or value may rise or fall. Opinions or recommendations contained herein are in form of technical ratings and fundamental ratings. Technical ratings may differ from fundamental ratings as technical valuations apply different methodologies and are purely based on price and volume-related information extracted from the relevant jurisdiction’s stock exchange in the equity analysis. Accordingly, investors’ returns may be less than the original sum invested. Past performance is not necessarily a guide to future performance. This report is not intended to provide personal investment advice and does not take into account the specific investment objectives, the financial situation and the particular needs of persons who may receive or read this report. Investors should therefore seek financial, legal and other advice regarding the appropriateness of investing in any securities or the investment strategies discussed or recommended in this report.
The information contained herein has been obtained from sources believed to be reliable but such sources have not been independently verified by Maybank Investment Bank Berhad, its subsidiary and affiliates (collectively, “MKE”) and consequently no representation is made as to the accuracy or completeness of this report by MKE and it should not be relied upon as such. Accordingly, MKE and its officers, directors, associates, connected parties and/or employees (collectively, “Representatives”) shall not be liable for any direct, indirect or consequential losses or damages that may arise from the use or reliance of this report. Any information, opinions or recommendations contained herein are subject to change at any time, without prior notice.
This report may contain forward looking statements which are often but not always identified by the use of words such as “anticipate”, “believe”, “estimate”, “intend”, “plan”, “expect”, “forecast”, “predict” and “project” and statements that an event or result “may”, “will”, “can”, “should”, “could” or “might” occur or be achieved and other similar expressions. Such forward looking statements are based on assumptions made and information currently available to us and are subject to certain risks and uncertainties that could cause the actual results to differ materially from those expressed in any forward looking statements. Readers are cautioned not to place undue relevance on these forward-looking statements. MKE expressly disclaims any obligation to update or revise any such forward looking statements to reflect new information, events or circumstances af ter the date of this publication or to reflect the occurrence of unanticipated events.
MKE and its officers, directors and employees, including persons involved in the preparation or issuance of this report, may, to the extent permitted by law, from time to time participate or invest in financing transactions with the issuer(s) of the securities mentioned in this report, perform services for or solicit business from such issuers, and/or have a position or holding, or other material interest, or effect transactions, in such securities or options thereon, or other investments related thereto. In addition, it may make markets in the securities mentioned in the material presented in this report. One or more directors, officers and/or employees of MKE may be a director of the issue rs of the securities mentioned in this report to the extent permitted by law.
This report is prepared for the use of MKE’s clients and may not be reproduced, altered in any way, transmitted to, copied or distributed to any other party in whole or in part in any form or manner without the prior express written consent of MKE and MKE and its Representatives accepts no liability whatsoever for the actions of third parties in this respect.
This report is not directed to or intended for distribution to or use by any person or entity who is a citizen or resident of or located in any locality, state, country or other jurisdiction where such distribution, publication, availability or use would be contrary to law or regulation. This report is for distribution only under such circumstances as may be permitted by applicable law. The securities described herein may not be eligible for sale in all jurisdictions or to certain categories of investors. Without prejudice to the foregoing, the reader is to note that additional disclaimers, warnings or qualifications may apply based on geographical location of the person or entity receiving this report.
Malaysia Opinions or recommendations contained herein are in the form of technical ratings and fundamental ratings. Technical ratings may differ from fundamental ratings as technical valuations apply different methodologies and are purely based on price and volume-related information extracted from Bursa Malaysia Securities Berhad in the equity analysis.
Singapore This report has been produced as of the date hereof and the information herein may be subject to change. Maybank Kim Eng Research Pte. Ltd. (“Maybank KERPL”) in Singapore has no obligation to update such information for any recipient. For distribution in Singapore, recipients of this report are to contact Maybank KERPL in Singapore in respect of any matters arising from, or in connection with, this report. If the recipient of this report is not an accredited investor, expert investor or institutional investor (as defined under Section 4A of the Singapore Securities and Futures Act), Maybank KERPL shall be legally liable for the contents of this report, with such liability being limited to the extent (if any) as permitted by law.
Thailand Except as specifically permitted, no part of this presentation may be reproduced or distributed in any manner without the prior written permission of Maybank Kim Eng Securities (Thailand) Public Company Limited. Maybank Kim Eng Securities (Thailand) Public Company Limited (“MBKET”) accepts no liability whatsoever for the actions of third parties in this respect.
Due to different characteristics, objectives and strategies of institutional and retail investors, the research products of MBKET Institutional and Retail Research departments may differ in either recommendation or target price, or both. MBKET reserves the rights to disseminate MBKET Retail Research reports to institutional investors who have requested to receive it. If you are an authorised recipient, you hereby tacitly acknowledge that the research reports from MBKET Retail Research are first produced in Thai and there is a time lag in the release of the translated English version.
The disclosure of the survey result of the Thai Institute of Directors Association (“IOD”) regarding corporate governance is made pursuant to the policy of the Office of the Securities and Exchange Commission. The survey of the IOD is based on the information of a company listed on the Stock Exchange of Thailand and the market for Alternative Investment disclosed to the public and able to be accessed by a general public investor. The result, therefore, is from the perspective of a third party. It is not an evaluation of operation and is not based on inside information. The survey result is as of the date appearing in the Corporate Governance Report of Thai Listed Companies. As a result, the survey may be changed after that date. MBKET does not confirm nor certify the accuracy of such survey result.
The disclosure of the Anti-Corruption Progress Indicators of a listed company on the Stock Exchange of Thailand, which is assessed by Thaipat Institute, is made in order to comply with the policy and sustainable development plan for the listed companies of the Office of the Securities and Exchange Commission. Tha ipat Institute made this assessment based on the information received from the listed company, as stipulated in the form for the assessment of Anti-corruption which refers to the Annual Registration Statement (Form 56-1), Annual Report (Form 56-2), or other relevant documents or reports of such listed company. The assessment result is therefore made from the perspective of Thaipat Institute that is a third party. It is not an assessment of operation and is not based on any inside information. Since this assessment is only the assessment result as of the date appearing in the assessment result, it may be changed after that date or when there is any change to the relevant information. Nevertheless, MBKET does not confirm, verify, or certify the accuracy and completeness of the assessment result.
US This third-party research report is distributed in the United States (“US”) to Major US Institutional Investors (as defined in Rule 15a-6 under the Securities Exchange Act of 1934, as amended) only by Maybank Kim Eng Securities USA Inc (“Maybank KESUSA”), a broker-dealer registered in the US (registered under Section 15 of the Securities Exchange Act of 1934, as amended). All responsibility for the distribution of this report by Maybank KESUSA in the US shall be borne by Maybank KESUSA. This report is not directed at you if MKE is prohibited or restricted by any legislation or regulation in any jurisdiction from making it available to you. You should satisfy yourself before reading it that Maybank KESUSA is permitted to provide research material concerning investments to you under relevant legislation and regulations. All U.S. persons receiving and/or accessing this report and wishing to effect transactions in any security mentioned within must do so with: Maybank Kim Eng Securities USA Inc. 400 Park Avenue, 11th Floor, New York, New York 10022, 1-(212) 688-8886 and not with, the issuer of this report.

August 3, 2021 10
Ascendas REIT
Disclosure of Interest
Malaysia: MKE and its Representatives may from time to time have positions or be materially interested in the securities referred to herein and may further act as market maker or may have assumed an underwriting commitment or deal with such securities and may also perform or seek to perform investment banking services, advisory and other services for or relating to those companies. Singapore: As of 3 August 2021, Maybank KERPL and the covering analyst do not have any interest in any companies recommended in this research report. Thailand: MBKET may have a business relationship with or may possibly be an issuer of derivative warrants on the securities /companies mentioned in the research report. Therefore, Investors should exercise their own judgment before making any investment decisions. MBKET, its associates, directors, connected parties and/or employees may from time to time have interests and/or underwriting commitments in the securities mentioned in this report. Hong Kong: As of 3 August 2021, KESHK and the authoring analyst do not have any interest in any companies recommended in this research report. India: As of 3 August 2021, and at the end of the month immediately preceding the date of publication of the research report, KESI, authoring analyst or their associate / relative does not hold any financial interest or any actual or beneficial ownership in any shares or having any conflict of interest in the subject companies except as otherwise disclosed in the research report.
In the past twelve months KESI and authoring analyst or their associate did not receive any compensation or other benefits from the subject companies or third party in connection with the research report on any account what so ever except as otherwise disclosed in the research report.
MKE may have, within the last three years, served as manager or co-manager of a public offering of securities for, or currently may make a primary market in issues of, any or all of the entities mentioned in this report or may be providing, or have provided within the previous 12 months, significant advice or investment services in relation to the investment concerned or a related investment and may receive compensation for the services provided from the companies covered in this report.
OTHERS
Analyst Certification of Independence
The views expressed in this research report accurately reflect the analyst’s personal views about any and all of the subject securities or issuers; and no part of the research analyst’s compensation was, is or will be, directly or indirectly, related to the specific recommendations or views expressed in the report.
Reminder
Structured securities are complex instruments, typically involve a high degree of risk and are intended for sale only to soph isticated investors who are capable of understanding and assuming the risks involved. The market value of any structured security may be affected by changes in economic, financial and politic al factors (including, but not limited to, spot and forward interest and exchange rates), time to maturity, market conditions and volatility and the credit quality of any issuer or reference issuer. Any investor interested in purchasing a structured product should conduct its own analysis of the product and consult with its own professional advisers as to the risks involved in making such a purchase.
No part of this material may be copied, photocopied or duplicated in any form by any means or redistributed without the prior consent of MKE.
UK This document is being distributed by Maybank Kim Eng Securities (London) Ltd (“Maybank KESL”) which is authorized and regulated, by the Financial Conduct Authority and is for Informational Purposes only. This document is not intended for distribution to anyone defined as a Retail Client under the Financial Services and Markets Act 2000 within the UK. Any inclusion of a third party link is for the recipients convenience only, and that the firm does not take any responsibility for its comments or accuracy, and that access to such links is at the individuals own risk. Nothing in this report should be considered as constituting legal, accounting or tax advice, and that for accurate guidance recipients should consult with their own independent tax advisers.
DISCLOSURES
Legal Entities Disclosures Malaysia: This report is issued and distributed in Malaysia by Maybank Investment Bank Berhad (15938- H) which is a Participating Organization of Bursa Malaysia Berhad and a holder of Capital Markets and Services License issued by the Securities Commission in Malaysia. Singapore: This report is distributed in Singapore by Maybank KERPL (Co. Reg No 198700034E) which is regulated by the Monetary Authority of Singapore. Indonesia: PT Maybank Kim Eng Securities (“PTMKES”) (Reg. No. KEP-251/PM/1992) is a member of the Indonesia Stock Exchange and is regulated by the Financial Services Authority (Indonesia). Thailand: MBKET (Reg. No.0107545000314) is a member of the Stock Exchange of Thailand and is regulated by the Ministry of Finance and the Securities and Exchange Commission. Philippines: Maybank ATRKES (Reg. No.01-2004-00019) is a member of the Philippines Stock Exchange and is regulated by the Securities and Exchange Commission. Vietnam: Maybank Kim Eng Securities Limited (License Number: 117/GP-UBCK) is licensed under the State Securities Commission of Vietnam. Hong Kong: KESHK (Central Entity No AAD284) is regulated by the Securities and Futures Commission. India: Kim Eng Securities India Private Limited (“KESI”) is a participant of the National Stock Exchange of India Limited and the Bombay Stock Exchange and is regulated by Securities and Exchange Board of India (“SEBI”) (Reg. No. INZ000010538). KESI is also registered with SEBI as Category 1 Merchant Banker (Reg. No. INM 000011708) and as Research Analyst (Reg No: INH000000057) US: Maybank KESUSA is a member of/ and is authorized and regulated by the FINRA – Broker ID 27861. UK: Maybank KESL (Reg No 2377538) is authorized and regulated by the Financial Conduct Authority.

August 3, 2021 11
Ascendas REIT
Historical recommendations and target price: Ascendas REIT (AREIT SP)
Definition of Ratings
Maybank Kim Eng Research uses the following rating system
BUY Return is expected to be above 10% in the next 12 months (including dividends)
HOLD Return is expected to be between 0% to 10% in the next 12 months (including dividends)
SELL Return is expected to be below 0% in the next 12 months (including dividends)
Applicability of Ratings
The respective analyst maintains a coverage universe of stocks, the list of which may be adjusted according to needs. Investment ratings are only applicable to the stocks which form part of the coverage universe. Reports on companies which are not part of the coverage do not carry investment ratings as we do not actively follow developments in these companies.
2.1
2.4
2.7
3.0
3.3
3.6
Jul-18 Oct-18 Jan-19 Apr-19 Jul-19 Oct-19 Jan-20 Apr-20 Jul-20 Oct-20 Jan-21 May-21 Aug-21
Ascendas REIT
2 Aug Buy : SGD3.0
26 Oct Buy : SGD2.9
4 Apr Buy : SGD3.0
30 Apr Buy : SGD3.1
2 Jul Buy : SGD3.2
4 Nov Buy : SGD3.3
2 Dec Buy : SGD3.4
24 Jul Buy : SGD3.7
25 Aug Buy : SGD4.0
10 Nov Buy : SGD4.0
17 Mar Buy : SGD3.6
26 Apr Buy : SGD3.7
August 3, 2021 12
Ascendas REIT
Malaysia Maybank Investment Bank Berhad
(A Participating Organisation of
Bursa Malaysia Securities Berhad)
33rd Floor, Menara Maybank,
100 Jalan Tun Perak,
50050 Kuala Lumpur
Tel: (603) 2059 1888;
Fax: (603) 2078 4194
Singapore Maybank Kim Eng Securities Pte Ltd
Maybank Kim Eng Research Pte Ltd
50 North Canal Road
Singapore 059304
Tel: (65) 6336 9090
London Maybank Kim Eng Securities
(London) Ltd
PNB House
77 Queen Victoria Street
London EC4V 4AY, UK
Tel: (44) 20 7332 0221
Fax: (44) 20 7332 0302
New York Maybank Kim Eng Securities USA
Inc
400 Park Avenue, 11th Floor
New York, New York 10022,
U.S.A.
Tel: (212) 688 8886
Fax: (212) 688 3500
Stockbroking Business:
Level 8, Tower C, Dataran Maybank,
No.1, Jalan Maarof
59000 Kuala Lumpur
Tel: (603) 2297 8888
Fax: (603) 2282 5136
Hong Kong Kim Eng Securities (HK) Ltd
28/F, Lee Garden Three,
1 Sunning Road, Causeway Bay,
Hong Kong
Tel: (852) 2268 0800
Fax: (852) 2877 0104
Indonesia PT Maybank Kim Eng Securities
Sentral Senayan III, 22nd Floor
Jl. Asia Afrika No. 8
Gelora Bung Karno, Senayan
Jakarta 10270, Indonesia
Tel: (62) 21 2557 1188
Fax: (62) 21 2557 1189
India Kim Eng Securities India Pvt Ltd
1101, 11th floor, A Wing, Kanakia
Wall Street, Chakala, Andheri -
Kurla Road, Andheri East,
Mumbai City - 400 093, India
Tel: (91) 22 6623 2600
Fax: (91) 22 6623 2604
Philippines Maybank ATR Kim Eng Securities Inc.
17/F, Tower One & Exchange Plaza
Ayala Triangle, Ayala Avenue
Makati City, Philippines 1200
Tel: (63) 2 8849 8888
Fax: (63) 2 8848 5738
Thailand Maybank Kim Eng Securities
(Thailand) Public Company Limited
999/9 The Offices at Central World,
20th - 21st Floor,
Rama 1 Road Pathumwan,
Bangkok 10330, Thailand
Tel: (66) 2 658 6817 (sales)
Tel: (66) 2 658 6801 (research)
Vietnam Maybank Kim Eng Securities Limited
4A-15+16 Floor Vincom Center Dong
Khoi, 72 Le Thanh Ton St. District 1
Ho Chi Minh City, Vietnam
Tel : (84) 844 555 888
Fax : (84) 8 38 271 030
Saudi Arabia In association with
Anfaal Capital
Ground Floor, KANOO Building
No.1 - Al-Faisaliyah,Madina Road,
P.O.Box 126575 Jeddah 21352
Kingdom of Saudi Arabia
Tel: (966) 920023423
South Asia Sales Trading Kevin Foy
Regional Head Sales Trading
Tel: (65) 6636-3620
US Toll Free: 1-866-406-7447
North Asia Sales Trading Andrew Lee
Tel: (852) 2268 0283
US Toll Free: 1 877 837 7635
Indonesia Iwan Atmadjaja [email protected] (62) 21 8066 8555
London Greg Smith [email protected] Tel: (44) 207-332-0221
New York James Lynch [email protected] Tel: (212) 688 8886
India Sanjay Makhija [email protected] Tel: (91)-22-6623-2629
Philippines Keith Roy [email protected] Tel: (63) 2 848-5288
www.maybank-ke.com | www.maybank-keresearch.com