Determination of Geotechnical Properties and Stability of ...

Rea, D.K., Basov, I.A., Scholl, D.W., and Allan, J.F. (Eds.), 1995Proceedings of the Ocean Drilling Program, Scientific Results, Vol. 145
35. GEOTECHNICAL PROPERTIES AND CONSOLIDATION CHARACTERISTICSOF NORTH PACIFIC SEDIMENTS, SITES 881, 883, AND 885/8861
Anne K. Rutledge,2 John A. Roberts,3 Thomas H. Orsi,2 William R. Bryant,2 and Aarno T. Kotilainen4
ABSTRACT
Consolidation tests performed on samples representative of the major sediment types recovered during Ocean DrillingProgram Leg 145 indicate that the diatom oozes and clays of Sites 881, 883, and 885/886 may be characterized as normallyconsolidated, moderately to highly compressible, and slightly permeable to impermeable. Comparison of field and laboratoryconsolidation curves reveals a disparity between porosity variations caused by loading (i.e., burial) observed in situ and underlaboratory conditions. The field consolidation curves indicate that the high porosities characteristic of diatomaceous oozes arepreserved in spite of the increasing sediment load, most likely the result of a resistance to consolidation due to the structural strengthof the diatom frustules, whereas the laboratory consolidation curves (e-Log P') reveal a reduction of porosity with increasing loadas expected. Use of the empirical relationship between the ratio of undrained shear strength to effective overburden stress and thestate-of-consolidation for a sediment supports biostratigraphic and gamma-ray attenuation porosity evaluator (GRAPE) correla-tion data, suggesting an erosional unconformity in the upper 20 mbsf of Hole 885 A. A medical CT (or CAT) scanner was found tobe useful in evaluating the suitability of samples selected for consolidation testing. With increased availability, this device couldconceivably replace, or at least provide a valuable supplement to, X-radiography for the nondestructive three-dimensionalexamination of whole core samples.
INTRODUCTION
The application of geotechnical testing methods to marine sedi-ments by geoscientists has become a widely accepted practice over thepast 20 years. These techniques supplement the more common sedi-mentological analyses (e.g., textural and mineralogical analyses, parti-cle identification, and sedimentary structure analyses) used to enhanceour understanding of the dominant geologic processes (Bryant et al.,1974, 1981; Keller, 1974; Bennett and Nelson, 1983; Pittenger et al.,1989; Bryant and Rack, 1990). Standard Ocean Drilling Program(ODP) shipboard physical property measurements include the indexproperties (water content, wet and dry bulk density, GRAPE bulk den-sity, grain density, void ratio, and porosity), sediment shear strength,and compressional-wave velocity. These data are essential as input foracoustic models of the seafloor and sediment mass-accumulation cal-culations. Sediment index properties are closely linked to the sedimen-tological processes that have acted upon the sediment. Realization thatdownhole variations in physical properties often reflect even minorlithologic changes, in addition to the physical state of the sediment, hasled to use of these data as a stratigraphic tool (Taylor, 1984; Pittenger,1992). Shear strength, for example, is a function of mineralogy, grainsize, particle type, water content, diagenesis, depth of burial, and stresshistory. Consequently, information regarding shear strength variationwith increasing depth below the seafloor can contribute to our under-standing of the postdepositional processes affecting marine sediments.In addition to the shipboard physical property analyses, consolidationtesting is used by marine geologists to gain insight into a sediment's
1 Rea, D.K., Basov, LA., Scholl, D.W., and Allan, J.F. (Eds.), 1995. Proc. ODP, Sci.Results, 145: College Station, TX (Ocean Drilling Program).
2 Department of Oceanography, Texas A&M University, College Station, TX 77843,U.S.A.
3 Marine Geoscience Research Group, Department of Earth Sciences, University ofWales College of Cardiff, P.O. Box 914, Cardiff CF1 3YE, United Kingdom.
4 Department of Earth Sciences, University of Cambridge, Downing Street, Cam-bridge CB2 3EQ, United Kingdom.
stress history and to determine the magnitude and timing of theporosity and permeability changes induced by the addition or removalof overburden by sedimentary processes.
The primary objective of Leg 145 was to improve our knowledgeof the paleoceanography and paleoclimatology of the North PacificOcean. The sites selected to meet this objective also presented usan opportunity to expand upon the study of the geotechnical proper-ties and consolidation characteristics of the North Pacific sedimentsbegun on Deep Sea Drilling Project (DSDP) Leg 86. The purpose ofthis study is to examine the extensive set of physical property datafrom Sites 881, 883, and 885/886 and to augment these data withconsolidation and permeability test results.
METHODS
Shipboard Physical Properties
The shipboard physical properties measurements made duringLeg 145 were performed using standard ODP methods as detailed inBoyce (1976) and the "Explanatory Notes" chapter in the Leg 145Initial Reports volume (Rea, Basov, Janecek, Palmer-Julson, et al.,1993). Summaries of the shipboard physical properties results forSites 881,883, and 885/886 may be found in their respective chaptersin Rea, Basov, Janecek, Palmer-Julson, et al. (1993). The samplingstrategy used for these sites was designed to maximize the physicalproperty sampling resolution within the time constraints imposed byshipboard operations. Index property, compressional-wave velocity,and shear strength measurements were made two per section in coresfrom Holes 88IB and 883A, one per section in cores from Holes881C, 883C, 885A, 886A, 886B, and 886C and Cores 145-883B-1Hand -30H through -86X, and one per every two sections in cores fromHole 88 ID.
A continuous record of wet bulk density was generated for all ofthe cores from Sites 881, 883, and 885/886 using the gamma-rayattenuation porosity evaluator (GRAPE) on the multisensor track(MST). Bulk density is calculated from gamma-ray attenuation usingthe relationship (Evans, 1965):
525

A.K. RUTLEDGE ET AL.
Table 1. Grain-size results for consolidation samples from Sites 881, 883, and 885/886.
Core, section,interval (cm) Sediment type
145-886C-2H-4, 140-1503H-5, 140-1504H-4, 138-1506H-1, 140-1507H-5, 138-1508H-5, 138-150
145-881C-3H-4, 138-15012H-3, 138-15021H-5, 138-150
145-883B-6H-5, 138-15010H-2, 138-15048X-5, 138-150
Grain size
Sand Silt Clay
Spiculeclay 7.83 24.96 67.21Diatom ooze with clay 33.01 22.66 44.32Diatom ooze 58.54 8.98 32.48Diatom ooze with clay 49.66 4.57 45.77Clay 0.36 7.16 92.47Red clay 0.59 11.69 87.73
Clayey diatom ooze 10.11 73.60 16.28Clayey diatom ooze 11.83 45.25 42.93Diatom ooze 37.92 26.16 35.93
Clay with diatoms 15.25 31.95 52.79Clayey diatom ooze 23.03 27.53 49.44Diatom ooze with clay and calcite 27.76 39.73 32.51
where:pb = bulk density (Mg/m3),µ = Compton mass attenuation (cm2/g),d = core diameter (cm),/0 = source intensity (counts/s), and/ = intensity through sediment (counts/s).
Using this relationship to calculate sediment density assumes that themass attenuation coefficient of quartz is an acceptable estimation forthe actual mass attenuation coefficient of the sediment. Bulk densityvalues obtained in this manner are approximately 10% higher thanthose obtained using volumetric techniques. Boyce (1976) attributedthis discrepancy to the -10% difference in the Compton mass attenu-ation coefficients of water and quartz. High-porosity sediments, suchas the diatom oozes characteristic of the North Pacific, are particularlysubject to this type of error. The 0.1 g/cm3 offset between the GRAPEdata and the discrete measurements reported in the Initial Reportsvolume (Rea, Basov, Janecek, Palmer-Julson, et al., 1993) resultslargely from the inadvertent omission of this correction from thealgorithm used to calculate bulk density from gamma-ray attenuation(Moran, 1993). The GRAPE data presented here have been correctedfor this offset using the Boyce equation (Boyce, 1976):
(Pbc-Pfc)(pg-Pf)p " (P , - P / , )
P / '
where:p = true bulk density,pbc = calculated bulk density (using mquartz),pf= true fluid density = 1.024 Mg/m3,Pfc = calculated fluid density (using mquartz) = 1.128 Mg/m3,pg = true grain density, andp^c = calculated grain density (using mquartz) = 2.65 Mg/m3.
Before plotting, the GRAPE data were smoothed using a 29-pointrunning average to improve the legibility of the plots while reducingthe resolution as little as possible.
Consolidation Testing
All consolidation test samples were subsampled for percent sand-silt-clay analyses. The grain-size analyses followed standard sieveand pipette analysis techniques as set forth in Folk (1974). The resultsof these analyses are presented in Table 1. Uniaxial consolidation testsand falling-head permeability measurements were performed at the
Texas A&M University (TAMU) Department of Civil EngineeringSoil Mechanics Laboratory using standard Soiltest load frames andfixed-ring oedometers. Twelve samples (6.38 cm diameter × 2.54 cmheight) were loaded incrementally to 800 kPa, unloaded to 50 kPa,then reloaded to a maximum of 3200 kPa on a 24-hr loading schedule.Time-compression curves were produced for each load using thetechniques discussed in Head (1988). The void ratio at 24-hr (e24),coefficient of consolidation (cv), coefficient of volume compressibil-ity (mv), and the permeability (k) were calculated based on the datacontained in the time-compression curves. At the end of each test,plots of void ratio vs. the logarithm of the effective stress (e-Log P')were generated. The preconsolidation (PJ) stress of each consolida-tion sample was determined from the e-Log P' plot using the Casa-grande technique (Casagrande, 1936). The overconsolidation ratio(OCR), defined as the ratio of the preconsolidation stress to the exist-ing effective overburden (Pj), provides insight into the stress historyof the area and can reveal the presence of erosional or nondepositionalhiatuses that are otherwise undetectable. By determining the degreeof consolidation, we can estimate the amount of overburden removedin the case of overconsolidated sediments, and detect areas subject torapid sedimentation or excess pore pressures in the case of undercon-solidated sediments. A thorough discussion of the limitations of theCasagrande technique as applied to marine sediments may be foundin Bryant and Rack (1990). Plots of the ratio of undrained shearstrength to effective overburden stress (SJPJ) vs. depth have beengenerated to supplement the state-of-consolidation data obtained fromthe uniaxial consolidation tests (Skempton, 1970). In general, thepermeability values calculated from the cv for each load applied dur-ing the test are indicative of the magnitude of change in permeabilitythat occurred as a result of burial.
CT Scan Examination
Terzaghi's (1943) theory of consolidation is based on a number ofassumptions, one of which is sample homogeneity. The possible effectsof inhomogeneities on test results are many. Gravel or shells, forinstance, can produce anomalously low compressibility, whereas un-usually high compressibility and permeability could result from openburrows or cracks. Furthermore, the quality of consolidation test re-sults are strongly influenced by sample quality. As a result, the abilityto assess the degree of sample disturbance prior to testing is highlydesirable. Worst case in these scenarios is an invalidation of test results.
Verifying the homogeneity of a consolidation sample is difficultand accomplished mainly through visual inspection. Unfortunately,structures may be internal or so subtle they remain invisible to theunaided eye. X-radiography has long been used to examine wholeround samples, but superimposing three-dimensional structures ontotwo-dimensional photographic film complicates interpretation. In a
526

GEOTECHNICAL PROPERTIES OF NORTH PACIFIC SEDIMENTS
different approach, we used X-ray computed tomography (CT or CATscanning) to evaluate the internal structure of consolidation samplesfrom Hole 886C. The technique is fast, quantitative, and extremelysensitive to subtle density contrasts. Moreover, visualizing internalstructures (if present) may help evaluate the consolidation test results.
The Technicare Δ-100 CT scanner used for this study (PI. 1)is a second-generation translate-rotate brain scanner (Vinegar andWellington, 1987). The sample is centered within a circular gantrysupporting the X-ray source and detectors. Rotating about the testsample, each source-receiver location provides a line integral mea-surement of X-ray attenuation called a ray sum. After measuring andcombining over a span of locations greater than 180°, transformationof the ray sums by a filtered back-projection reconstruction algorithmresults in a two-dimensional grid of X-ray attenuation values (Brooksand Di Chiro, 1975). The density of the material is the predominantfactor determining X-ray attenuation at the energies of 120 kV usedfor most medical scanners (McCullough, 1975). CT scanners convertX-ray attenuation to a parameter called the Hounsfield unit (HU) bynormalizing it to the attenuation coefficient of water, and linearize thescale by arbitrarily assigning HUwater to a value of zero and HUair to-1000 HU. (The Hounsfield unit is named after G.N. Hounsfield, theNobel prize-winning inventor of the CT scanner; Hounsfield, 1973).CT studies of unconsolidated sediments have all verified the stronglinear correlation between sediment bulk density and X-ray attenu-ation, usually reporting correlation coefficients greater than 0.9 (e.g.,Petrovic et al., 1982; Anderson et al., 1988; Warner et al., 1989; Orsiet al., 1992; Orsi, 1994).
The scanner has an automatic micropositioning table to move thesample in and out of the image plane with a precision of about 60 µm.The sediment core was positioned horizontally and fixed to the CTscanner positioning table in the center of the imaging plane. A slicethickness of 7 mm full width, half maximum (FWHM) and an in-plane resolution of 0.4 mm were used for the samples in this study.All images were acquired at 120 kV/25 mA as the sample position wasmoved incrementally through the image plane at 7-mm steps. Theresulting nonoverlapping images are aligned perpendicular to thecylindrical axis of each core. Each reconstructed CT data file is a 256× 256 numerical array that was downloaded from magnetic tape foranalysis on a Macintosh II computer using Spyglass Transform visu-alization software.
RESULTS
Shipboard Physical Properties
A complete set of the shipboard physical property results may befound in Rea, Basov, Janecek, Palmer-Julson, et al. (1993). Profilesof sediment shear strength, wet and dry bulk density, water content,and porosity for Holes 88 IC, 883B, 883C, and 886C are presented inFigures 1-8. In general, the profiles exhibit the types of changesexpected with increasing depth: decreasing water content, porosity,and void ratio values and increasing shear strength and density. Theproperties correlate well with lithologic variations, and a comparisonof the index property profiles with the lithologic units (ShipboardScientific Party, 1993a, 1993b, 1993c) shows that strong inflectionpoints on the profiles occur at major lithologic boundaries. Variationscontrary to the expected downcore trends reflect changing ratios ofbiogenic silica to terrigenous clay. The diatom oozes recovered at allthree sites are characterized by low values for wet bulk density, drybulk density, grain density, and shear strength and correspondinglyhigh values for porosity and water content. The high porosities andwater contents characteristic of the diatom oozes show little reductionwith increasing sub-bottom depth. Similar observations have beenreported for the diatom oozes of the V0ring Plateau (Pittenger et al.,1989; Pittenger, 1992) and the Weddell Sea (Bryant and Rack, 1990).
The nature of the inflections present in the index property profilesprovides insight into the nature (sharp or gradational) of the corre-sponding lithologic contacts. An example of this may be seen in the
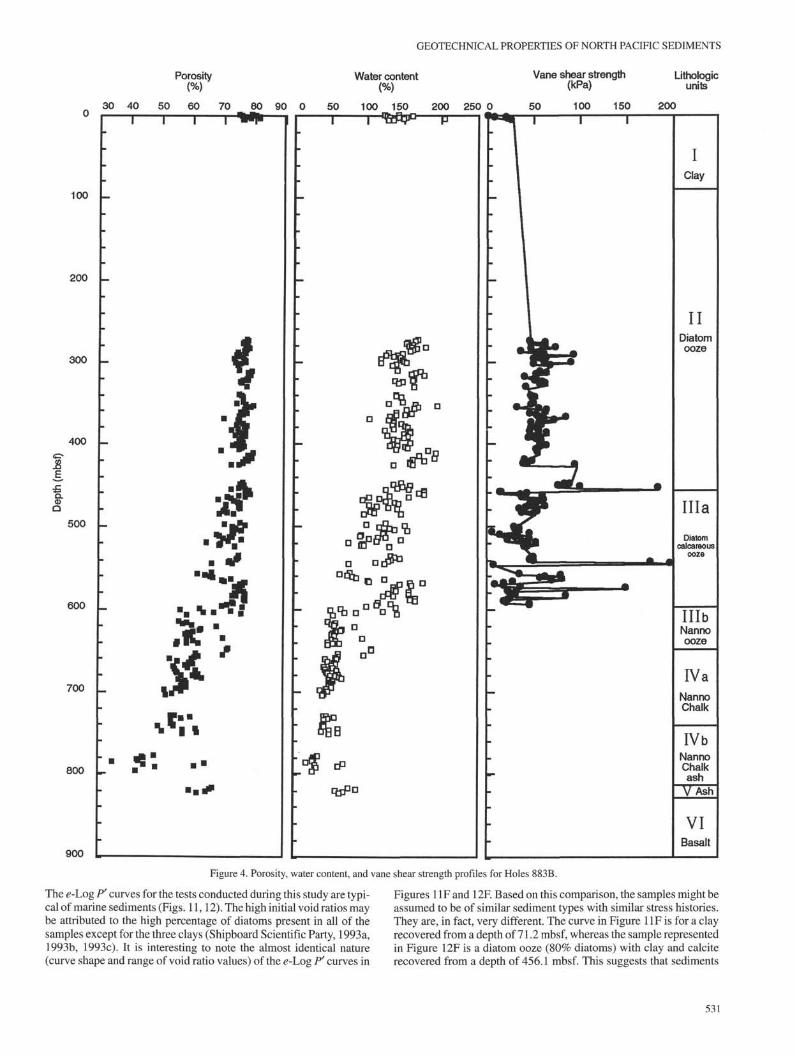
sharp inflection at the contact between Subunit IIIA, a calcareous dia-tom ooze, and Subunit IIIB, a nannofossil chalk (Figs. 3,4). Similarlyin Figure 8, the porosity and water content values in Unit I remainfairly constant with values averaging 80% and 190%, respectively. Inlithologic Unit II porosity and water content increase slightly coinci-dent with a sharp decrease in dry-bulk density that is consistent witha lithology of >90% biogenic silica. The top of Unit III is marked bya sharp decrease in porosity and water content and a sharp increase inwet and dry bulk density and grain density. The trend reflected in theindex property profiles suggests a gradational contact between UnitsI and II and a sharp contact between Units II and III.
The profiles of the ratio of vane shear strength to the effectiveoverburden (Su/P0') vs. depth presented in Figure 9 may be usedto infer variations in the relative state-of-consolidation with depth(Skempton, 1970). Sediments with SJPJ values that fall within thecrosshatched region (SJPO' = 0.2 to 0.5) are normally consolidatedwhereas sediments with values less than 0.2 are underconsolidatedand greater than 0.5 are characteristic of overconsolidated sediments.The profiles for Holes 886B and 886C are typical of normally con-solidated marine sediments. The upper 10 mbsf of the section in allthree holes seems to be overconsolidated. However, this apparentoverconsolidation of the uppermost portion of the sediment columnis actually a reflection of the disparity between the magnitude of theintrinsic sediment shear strength, due to cohesion in the case of claysor to the interlocking of particles in the case of biogenic oozes, sands,or silts, and the low effective overburden stress (zero at the sediment/water interface) in this zone. As a result, inferences regarding state-of-consolidation in the upper several meters of the sediment columnbased on the SJP0' vs. depth profile must be made with caution. TheSJP0' profile for Hole 885A reveals two zones of overconsolidatedsediment, one from 13 to 17 mbsf and another from 20 to 51 mbsf.Figure 10 presents a correlation of the GRAPE records from Holes885A, 886B, and 886C and a composite section (see Dickens et al.,this volume). Lines on the figure show the correlation. A missing sec-tion occurs at approximately 19-20 mbsf in Hole 885A. A compari-son of the radiolarian biostratigraphy in Holes 885A and 886C sug-gests a missing section in Hole 885A at approximately 13 mbsf (J.J.Morley, pers. comm., 1994). The overconsolidated nature of the sedi-ment below 13 mbsf suggests that a hiatus at this depth is the result ofan erosional episode. Unfortunately, the lack of consolidation test datafor Hole 885A precludes further substantiation of the proposed ero-sional event and assessment of the amount of overburden removed.
Consolidation Testing
Six samples from Hole 886C, three samples from Hole 88IC, andthree samples from Hole 883B were selected for consolidation test-ing. Each of these samples was selected to represent the suite of sedi-ments recovered during Leg 145. Sediment types include spicule clay,diatom ooze with clay, diatom ooze, clay, red clay, clayey diatomooze, and clay with diatoms. The results of the consolidation tests aresummarized in Table 2. Additional consolidation test results from theupper section of Hole 883B are presented in Roberts et al. (this vol-ume). OCR values for all of the tests fall within the range of normallyconsolidated to slightly overconsolidated. Values for cv, mv, and per-meability are reported for loads approximating the in situ effectiveoverburden. All of the consolidation samples had high to very highinitial void ratios (e0 = 1.8 to 4.1), which contribute to the medium-to high-volume compressibility values (mv = 0.13 to 2.22 m2/MN)observed. The cv values reported are typical of low plasticity clays orsilts except for the values for the Unit III clays from Hole 886C whichhad cv values characteristic of a medium plasticity clay. The perme-ability values calculated from the cv data range from a high of I0"8
m/s for diatom-rich sediment to a low of 10~10 m/s for the red claysample. The calculated values are significantly (two orders of magni-tude) lower than values obtained from the falling-head permeabilitytest. This result is contrary to expectations based on the high initial
527

A.K.RUTLEDGE ET AL.
Wet-bulk density (Mg/m3) andGRAPE density (Mg/m3)
Dry-bulk density(Mg/m3)
Grain density Lithologic(Mg/m3) units
1.1 1.2 1.3 1,4 1.5 1.6 1.7 1.8 0.3 0.4 0.5 0.6 0.7 0.8 0.9 1.0 1.8 2.0 2.2 2.4 2.6 2.8 3.0
100 L_
150 L_
JS
£
8-
400
O Wet-bulk density— Gamma density
200 L
250 L.
300 L
350 L
A * AA A A
J 4
AΔ
la
Clayeydiatomooze
Ib
Diatomooze
Figure 1. Wet bulk density, GRAPE density, dry bulk density, and grain density profiles for Hole 88 IC.

GEOTECHNICAL PROPERTIES OF NORTH PACIFIC SEDIMENTS
65 70
Porosity
75 80
Water content Vane shear strength(kPa)
Lithologicunits
85 50 100 150 200 250 0 20 40 60 80 100 120 140
:
50
•
•
100
150
200
250
300
350
400
I
la
Clayeydiatomooze
Ib
Diatomooze
Figure 2. Porosity, water content, and vane shear strength profiles for Hole 881C.
compaction seen in the time-compression curves. Time-compressioncurves of this nature are characteristic of partly saturated sedimentsthat would be expected to exhibit low measured permeability as aresult of air impeding flow through the pores. Taylor (1984) sug-gested that high falling-head permeability values might be an artifactof an increased drainage rate due to seepage-induced consolidation.
Pittenger et al. (1989) reported permeability results with a singleorder of magnitude difference between calculated and measured val-ues for diatom oozes of the V0ring Plateau. Pittenger's findings sug-gest that permeability results of this nature are characteristic of sedi-ments with a biogenic silica component. We think that a leak in theoedometer is the most likely explanation for our anomalous values.

A.K. RUTLEDGE ET AL.
Wet-bulk density (Mg/m3) andGRAPE density (Mg/πv*)
Dry-bulk density(Mg/m3)
1 1.2 1.4 1.6 1.8 2 2.2 0.0 0.5 1.0 1.5
a i ; ^
Grain density Lithologic(Mg/m3) units
2.0 1.0 1.5 2.0 2.5 3.0 3.5
100
200
300
400
•B
Q.
500
600
700
800
O Wet-bulk densityGamma density
900
I I
IClay
IIDiatom
ooze
Ilia
Diatomcalcareous
ooze
IllbNannoooze
IVaNannoChalk
IVbNannoChalkash
VAsh
VIBasalt
Figure 3. Wet bulk density, GRAPE density, dry bulk density, and grain density profiles for Holes 883B.
530
GEOTECHNICAL PROPERTIES OF NORTH PACIFIC SEDIMENTS
Porosity Water content
30 40 50 60 70 80 90 0 50 100 150 200 250 0 50
Vane shear strength Lithologic(kPa) units
100 _
200 -
300 _
400 -
|
500 -
600 _
700 _
800 _
900
Figure 4. Porosity, water content, and vane shear strength profiles for Holes 883B.
The e-Log P' curves for the tests conducted during this study are typi-cal of marine sediments (Figs. 11,12). The high initial void ratios maybe attributed to the high percentage of diatoms present in all of thesamples except for the three clays (Shipboard Scientific Party, 1993a,1993b, 1993c). It is interesting to note the almost identical nature(curve shape and range of void ratio values) of the e-Log P' curves in
Figures 1 IF and 12F. Based on this comparison, the samples might beassumed to be of similar sediment types with similar stress histories.They are, in fact, very different. The curve in Figure 1 IF is for a clayrecovered from a depth of 71.2 mbsf, whereas the sample representedin Figure 12F is a diatom ooze (80% diatoms) with clay and calciterecovered from a depth of 456.1 mbsf. This suggests that sediments
531

A.K. RUTLEDGE ET AL.
Wet-bulk density (Mg/m3) andGRAPE density (Mg/m3)
1.0
100
200
300
400
IQ
500
600
700
800
900
Dry-bulk density(Mg/m3)
Grain density(Mg/m3)
Lithologicunits
1.2 1.4 1.6 0.0 0.2 0.4 0.6 0.8 1.0 1.8 2.0 2.2 2.4 2.6 2.8 3.0
O Wet-bulk densityGamma density
IIDiatomooze
IliaDiatom
calcareousooze
IllbNannoooze
IVaNannoChalk
IVbNannoChalkash
VAsh
VIBasalt
Figure 5. Wet bulk density, GRAPE density, dry bulk density, and grain density profiles for Hole 883C.
532
GEOTECHNICAL PROPERTIES OF NORTH PACIFIC SEDIMENTS
Water content
100 200 300 400 0
Vane shear strength(kPa)
100 -
200 -
300 -
400 -
Q.ΦQ
500 -
600 _
700 _
800 -
900
Lithologicunits
100 150
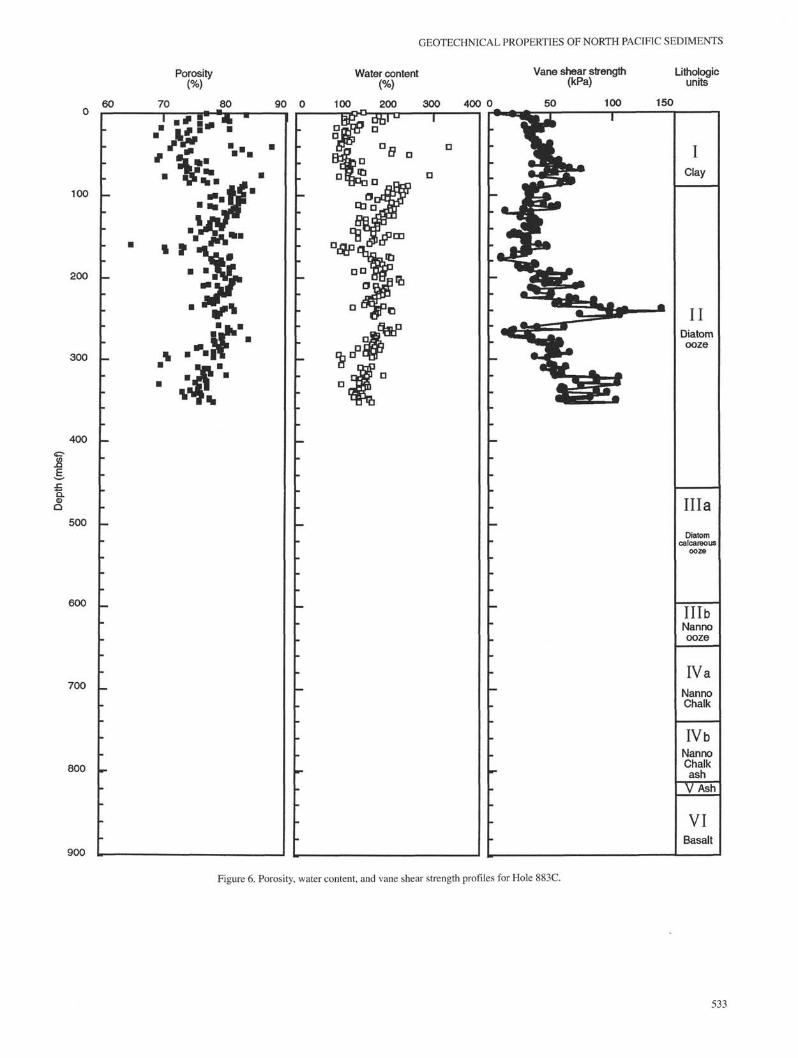
Figure 6. Porosity, water content, and vane shear strength profiles for Hole 883C.
\

A.K. RUTLEDGE ET AL.
Wet-bulk density (Mg/m3) andGRAPE density (Mg/m3)
Dry-bulk density(Mg/m3)
Grain density(Mg/m3)
Lithologicunits
1 1.2 1.4 1.6 0.2 0.3 0.4 0.5 0.6 0.7 2.0 2.2 2.4 2.6 2.8 3.0 3.2 3.4
10 _
20 _
30 _
IQ.α>Q
40 -
50 _
60 _
70 _
80
I ö I L
o ^o -po JS
CPSO ^
o ^T*
o °jç- o "V
o <jf- 8° %
o r^O f
o f
$ XO "5^
o J
O Λ <f•L
o l»i-^1^
_ ° *?*o to fo IS"
o ^
o ^ ^ •
o •C^
°o CO ji
O 5"*^
o 2.o *^^
o Z^**"- ° tO T - ^
1
-
-
•
A
A
A
A
1 A 1A
A
A
A
A
AA
A
AA
A
A
AA
A
A
AA
AA
A
A
A
A
A
A
A
AA
AA
A
A
A
A
AA
1
A
A
A
i
I I•
•
•
•
Δ
Δ
Δ
Δ
. Δ
Δ
: Δ *
ΔΔ
- Δ Δ
ΔΔ
ΔΔ
_
a
t
•
A
A
_
—
m
-
1 Δ 1Δ
Δ
ΔΔ
ΔΔ
Δ
Δ Δ Δ
A£Λ
A
A
AA
AA
Δ Δ
ΔΔ
Δ
1 1
Δ
Δ
Δ
Δ
I
Brownclay
IIDiatomooze
III
Darkbrownclay
IVBasalt
Figure 7. Wet bulk density, GRAPE density, dry bulk density, and grain density profiles for Hole 886C.
534

* 70 75
Porosity(%)
80 85
GEOTECHNICAL PROPERTIES OF NORTH PACIFIC SEDIMENTS
Water content
90100 150 200 250 300 3500 10 20 30 40 50 60 70 80
Vane shear strength(kPa)
Lithoiogicunits
10 _
20 -
30 -
IQ
40 _
50 _
60 _
70 _
80
I 1 • I•
••
••
•~ •
•••
•
•••
•
••
••
•
•"••
••
••
_ •••
••
••
••
••
••
••
- ••
1 G | | |
αα
αaa
π~ σ
• D D
α
πLJ
α_ α
π
-
D
α
α
G
Da
1 G °
D
αG
- αG
QG
GDa
aD aa
D
α
α
αα
— D
-
-
4I 1 1 1 1 I I
- Y|
• λ
i
: >4
(
^ >
J
; V--
I
Brownclay
II
Diatomooze
III
Darkbrownclay
IVBasalt
Figure 8. Porosity, water content, and vane shear strength profiles for Hole 886C.
with a significant diatom component do not experience the magnitudevolume change in situ that laboratory consolidation tests predict.Comparison of the field consolidation curves in Figure 13 with thee-Log P' curves provides further confirmation of this observation.The bold vertical lines on the field curves mark the top of a diatom-rich interval. In every case the void ratio increases sharply at the
contact between the diatom-rich interval and the overlying clay-richinterval. In Figures 13B and 13D, the vertical dashed lines mark thebottom of the diatom-rich interval. A rapid reduction of void ratiooccurs below this point similar to that seen in laboratory consolida-tion tests. The porosity profiles (Figs. 2, 4, 6, 8) also support thepremise that little in situ consolidation occurs in diatomaceous sedi-
535

A.K.RUTLEDGE ET AL.
Table 2. Consolidation results for samples from Sites 881, 883, and 885/886.
Core, section,interval (cm)
Depth(mbsf) Sediment type
CT P;scanned? (kPa)
p;(kPa) OCR
C,.(m2/yr) (mVMN)
Calculatedpermeability
(m/s)
145-886C-2H-4, 140-1503H-5, 140-1504H-4, 138-1506H-1, 140-1507H-5, 138-1508H-5, 138-150
145-881C-3H-4, 138-15012H-3, 138-15021H-5, 138-150
145-883B-6H-5, 138-15010H-2, 138-150 cm48X-5, 138-150 cm
12.723.731.746.261.771.2
19.2103.2189.1
53.386.8
456.1
Spicule clayDiatom ooze with clayDiatom oozeDiatom ooze with clayClayRed clay
Clayey diatom oozeClayey diatom oozeDiatom ooze
Clay with diatomsClayey diatom oozeDiatom ooze with clay and calcite
YesYesYesNoNoYes
NoNoNo
NoNoNo
36.662.077.3
100.0143.0174.0
68.4411.4696.8
180.4268.3
1238.3
42140ISO205225230
69660620
310290
1000
122i
21
121
211
30.78105.53100.48102.41
1.195.85
10.9748.1183.75
78.6857.8885.82
2.220.590.460.440.670.35
1.000.140.13
0.400.210.10
1.19E-O81.40E-081.50E-081.47E-082.78E-103.76E-10
1.79E-091.05E-093.40E-09
9.77E-093.82E-092.65E-09
60
Figure 9. SJP0' with depth for Holes 885 A, 886B, and 886C. Values lying within
the cross-hatched interval (SJPo
r = 0.2 to 0.5) are normally consolidated.
ments. For example, the porosity profile for Hole 883B (Fig. 4) re-
veals porosity values of 60% to 80% persisting to 600 mbsf. Pittenger
(1992) attributed his similar findings to the structural strength of the
diatom frustules.
CT Scan Examination
The four consolidation samples from Hole 886C that were CT-scanned prior to consolidation testing are Samples 145-886C-2H-4,140-150 cm; -3H-5, 140-150 cm; -4H-4, 138-150 cm; and -8H-5,138-150 cm. Plates 2 through 5 show representative CT images fromnear the center of each sample. Overall, these images demonstrate thatthe samples were essentially homogeneous (PI. 3, Fig. 2; PI. 4, Fig. 1;PI. 5, Fig. 2) because discernible structures were generally limitedto indistinct horizontal to subhorizontal trace fossils. These burrowtraces, ichnogenus Planolites (Chamberlain, 1975; Eckdale et al.,1984), were commonly characterized by low-density interiors in con-trast with the surrounding matrix (PL 2, Fig. 1); in other images,burrow infill appears to be of higher density material (PL 3, Fig. 1; PL5, Fig. 1). The average cross-sectional diameter of both burrow typesis approximately 5 mm. The only other types of structures imaged areshown in Plate 2, Figure 2. Two faint halo burrows with diameters of~4 mm were observed to extend vertically over several centimeterswith little apparent horizontal migration. The last structure was a large
low-density feature (2-cm diameter) that migrates with depth in thesample (i.e., its orientation is oblique to the scan plane and hencemoves from right to left in sequential CT images). This feature isapparently some sort of feeding structure created by an animal largerthan those producing the other burrows.
Although CT image sequences of samples of uniform compositionwithout distinct sedimentary structures are somewhat monotonous,they provide verification of Terzaghi's (1943) assumption of sedi-ment homogeneity. Although it might be tempting to ascribe theapparent lack of significant structure in these samples as a failing (orat least a weakness) of CT, previous calibration experiments con-ducted on the Technicare Δ-100 CT scanner found the density resolu-tion (precision) of the machine to be -0.005 Mg/m3 (Orsi, 1994; Orsiet al., 1994). This precision is identical to that achieved by Been(1981) for an X-ray apparatus developed to measure vertical bulkdensity distributions within laboratory sedimentation columns. Asstated by Been (1981), "...greater precision is not warranted [in his orin the present investigation] as densities measured to the fourth sig-nificant figure fluctuate with temperature variations."
CONCLUSIONS
The extensive set of physical property measurements made duringLeg 145 provides further geotechnical characterization of the sedi-ments of the North Pacific. This is particularly important in the caseof the diatomaceous sediments recovered. Accurate interpretation ofgeotechnical test results depends upon the existence of a databasecomprising the accumulated results of previous tests for each type ofsediment. The development of such a database for siliceous oozes haslagged behind that of other sediment types (i.e., terrigenous clays andcalcareous oozes), but is progressing steadily. The results of this studyshould further serve to emphasize the need for continued study of theunique nature of diatomaceous sediments. The lack of in situ consoli-dation and the preservation of porosity of diatomaceous sedimentshas been demonstrated, although some question remains regardingthe mechanism responsible for maintaining the downcore porosity.The SJP0' profiles for Holes 885A, 886B, and 886C, in conjunctionwith correlations of the index properties and radiolarian biostra-tigraphy, indicate the presence of a hiatus in the upper section of Hole885A. The overconsolidated nature of the sediment points to an ero-sional nature for the hiatus. This technique is a quick and easy way toassess the state of consolidation of a sediment column, and is a valu-able supplement to consolidation test data.
Wet bulk density is a fundamental property of marine sedimentsrelated directly to the sedimentation history of the deposit. Consider-ing its sensitivity to this property, CT has a number of other potentialuses besides that shown here. For example, it would be very useful tomake strategic CT images indexed to other ODP measurements, suchas GRAPE, magnetic susceptibility, velocity, etc., to achieve a better

I
0
10
20
30
40
50
60
70
flO
885A
5
J/y• i
1 •
••
i i
i i
-
• i
ll
!
p••i••i
• " •
•• i»
— —
886A
- — •
- ' " — — — .
-
-
i i
••v•α•
M O T
—" »
"―->.
—«aa
— .
886B
r—^?—r \
• i
..
1 1
•Mk•••
•••••l
886C
>
: i ___
i i
MM
IM*
Composite
4r
i |
ii i i
i
- 3
Win!
1 1
1.0 1.2 1.4 1.6 1.0 1.2 1.4 1.6 1.0 1.2 1.4 1.6 1.0 1.2 1.4 1.6 1.0 1.2 1.4
GRAPE density(Mg/m3)
GRAPE density(Mg/m3)
GRAPE density(Mg/m3)
GRAPE density(Mg/m3)
GRAPE density(Mg/m3)
Figure 10. Correlation of GRAPE density profiles at Site 885/886. The arrow on the profile from Hole 885A marks the missing section.
1.6

A.K. RUTLEDGE ET AL.
4.0
3.5
3.0
ratio en
•§2.0
1.5
1.0
0.5
0.01
..I.,
-
r
10
ClayS- 12.7 mbsf
\
\
— - * — « >l
100 1000 100
= B Diatom oozewith ciay23.7 mbsf
10Log P (kPa)
• in••l i i100
Log P" (kPa)
1000 10000
= D Diatom oozewith clay
46.2 mbsf
10000 1 100 1000Log P' (kPa)
10000
mi i i i mill i i i nim i i nim10 100 1000 10000 1
Log P' (kPa)
EF Red clay71.2 mbsf
nil i i 1111 HI I i 11 ii HI I i 11 mi10 100 1000 10000
Log P1 (kPa)
Figure 11. Consolidation test results: e-LogP' plots for consolidation samples. A. Sample 145-886C-2H-4, 140-150 cm. B. Sample 145-886C-3H-5, 140-150 cm.C. Sample 145-886C-4H-4, 138-150 cm. D. 145-886C-6H-1, 140-150 cm. E. 145-886C-7H-5, 138-150 cm. F. Sample 145-886C-8H-5, 138-150 cm.
understanding of physical property characteristics and sediment vari-ability. In addition, sediment depth profiles of CT density can begenerated by averaging values over a fixed region-of-interest withineach CT image. These profiles are similar to those produced by theGRAPE system, although the "slab" of material integrated in CTdiffers from the cylindrical volume used for the GRAPE measure-ments. Importantly, the determination of the standard deviation of theCT image is crucial in studies of sediment heterogeneity.
ACKNOWLEDGMENTS
Our participation on Leg 145 was made possible by funding fromUSSAC (Rutledge, Orsi, and Bryant), ONR-NDSEG (Rutledge andOrsi), NERC and SERC (Roberts), and ESF (Kotilainen). We thankDr. Wayne Dunlap for the use of the TAMU Department of Civil En-gineering Consolidation Labs. Finally, we thank Dr. CM. Edwards,Director of the Engineering Imaging Center of the Texas Engineering
538

GEOTECHNICAL PROPERTIES OF NORTH PACIFIC SEDIMENTS
Experiment Station, for his helpful suggestions during the CT portionof this study.
REFERENCES*
Anderson, S.H., Gantzer, C.J., Boone, J.M., and Tully, R.J., 1988. Rapidnondestructive bulk density and soil-water content determination by com-puted tomography. Soil Sci. Soc. Am. J., 52:35-40.
Been, K., 1981. Nondestructive soil bulk density measurements by x-rayattenuation. Geotech. Test. J., 4:169-176.
Bennett, R.H., and Nelsen, T.A., 1983. Seafloor characteristics and dynamicsaffecting geotechnical properties at shelfbreaks. In Stanley, D.J., andMoore, G.T. (Eds.), The Shelf Break: Critical Interface on ContinentalMargins. Spec. Publ.—Soc. Econ. Paleontol. Mineral., 33:333-355.
Boyce, R.E., 1976. Definitions and laboratory techniques of compressionalsound velocity parameters and wet-water content, wet-bulk density, andporosity parameters by gravimetric and gamma ray attenuation techniques.In Schlanger, S.O., Jackson, E.D., et al., Init. Repts. DSDP, 33: Washington(U.S. Govt. Printing Office), 931-958.
Brooks, R.A., and Di Chiro, G., 1975. Theory of image reconstruction incomputed tomography. Radiology, 117:561-572.
Bryant, W.R., Bennett, R.H., and Katherman, C.E., 1981. Shear strength,consolidation, porosity, and permeability of oceanic sediments. InEmiliani, C. (Ed.), The Sea (Vol. 7): The Oceanic Lithosphere: New York(Wiley), 1555-1616.
Bryant, W.R., Deflache, A.P., and Trabant, P.K., 1974. Consolidation of marineclays and carbonates. In Inderbitzen, A.L. (Ed.), Deep-Sea Sediments:Physical and Mechanical Properties (1st ed.): New York (Plenum), 209-244.
Bryant, W.R., and Rack, ER., 1990. Consolidation characteristics of WeddellSea sediments: results of ODP Leg 113. In Barker, RF., Kennett, J.P., etal., Proc. ODP, Sci. Results, 113: College Station, TX (Ocean DrillingProgram), 211-223.
Casagrande, A., 1936. The determination of preconsolidation load and itspractical significance. Proc. 1st Int. Conf. Soil Mech. and FoundationEng., Am. Soc. Civ. Eng., 3:60-64.
Chamberlain, C.K., 1975. Trace fossils in DSDP cores of the Pacific. /.Paleontol., 49:1074-1096.
Eckdale, A.A., Muller, L.N., and Novak, M.T., 1984. Quantitative ichnologyof modern pelagic deposits in the abyssal Atlantic. Palaeogeogr., Palaeo-climatol, PalaeoecoL, 45:189-223.
Evans, H.B., 1965. GRAPE—a device for continuous determination of mate-rial density and porosity. Trans. SPWLA 6th Annu. Logging Symp., Dallas,2:B1-B25.
Folk, R.L., 1974. Petrology of Sedimentary Rocks: Austin, TX (HemphillPubl.).
Head, K.H., 1988. Manual of Soil Laboratory Testing (Vol. 2) (2nd ed.):London (Pentech Press).
Hounsfield, G.N., 1973. Computerized transverse axial scanning (tomogra-phy): Part I. Description of system. Br. J. Radiol, 46:1016-1022.
Keller, G.H., 1974. Marine geotechnical properties: interrelationships andrelationships to depth of burial. In Inderbitzen, A.L. (Ed.), Deep-SeaSediments: Physical and Mechanical Properties (1st ed.): New York(Plenum Press), 77-100.
McCullough, E.C., 1975. Photon attenuation in computed tomography. Med.Phys., 2:307-320.
Moran, K., 1993. Notice to users of GRAPE data. JOIDES J., 19:6.Orsi, T.H., 1994. Computed tomography and physical property variability of
seafloor sediments [Ph.D. thesis]. Texas A&M Univ., College Station.Orsi, T.H., Anderson, A.L., Leonard, J.N., Bryant, W.R., and Edwards, CM.,
1992. Use of X-ray computed tomography in the study of marine sedi-ments. Proc. Int. Conf. Civ. Eng. Oceans, 968-981.
Orsi, T.H., Edwards, CM., and Anderson, A.L., 1994. X-ray computed to-mography: a nondestructive method for quantitative analysis of sedimentcores. J. Sediment. Res., A64:690-693.
Petrovic, A.M., Siebert, J.E., and Rieke, PE., 1982. Soil bulk density analysisin three dimensions by computed tomographic scanning. Soil Sci. Soc. Am./., 46:445^*50.
Pittenger, A., 1992. Geotechnical properties of siliceous sediments from theV0ring Plateau, Southern Ocean [Ph.D. thesis]. Texas A&M Univ., CollegeStation.
Pittenger, A., Taylor, E., and Bryant, W.R., 1989. The influence of biogenicsilica on the geotechnical stratigraphy of the V0ring Plateau, NorwegianSea. In Eldholm, O., Thiede, J., Taylor, E., et al., Proc. ODP, Sci. Results,104: College Station, TX (Ocean Drilling Program), 923-940.
Rea, D.K., Basov, LA., Janecek, T.R., Palmer-Julson, A., et al., 1993. Proc.ODP, Init. Repts., 145: College Station, TX (Ocean Drilling Program).
Shipboard Scientific Party, 1993a. Site 881. In Rea, D.K., Basov, I.A., Janecek,T.R., Palmer-Julson, A., et al, Proc. ODP, Init. Repts., 145: CollegeStation, TX (Ocean Drilling Program), 37-83.
, 1993b. Site 883. In Rea, D.K., Basov, LA., Janecek, T.R., Palmer-Julson, A., et al., Proc. ODP, Init. Repts., 145: College Station, TX (OceanDrilling Program), 121-208.
-, 1993c. Sites 885/886. In Rea, D.K., Basov, LA., Janecek, T.R.,Palmer-Julson, A., et al., Proc. ODP, Init. Repts., 145: College Station, TX(Ocean Drilling Program), 303-334.
Skempton, A.W., 1970. The consolidation of clays by gravitational compac-tion. Q. J. Geol. Soc. London, 125:373—411.
Taylor, E., 1984. Oceanic sedimentation and geotechnical stratigraphy: hemi-pelagic carbonates and red clays [Ph.D. dissert.]. Texas A&M Univ.,College Station.
Terzaghi, K., 1943. Theoretical Soil Mechanics: New York (Wiley).Vinegar, H.J., and Wellington, S.L., 1987. Tomographic imaging of three-
phase flow experiments. Rev. Sci. Instrum., 58:96-107.Warner, G.S., Neiber, J.L., Moore, I.D., and Geise, R.A., 1989. Characterizing
macropores in soil by computed tomography. Soil Sci. Soc. Am. J., 53:653-660.
* Abbreviations for names of organizations and publications in ODP reference lists followthe style given in Chemical Abstracts Service Source Index (published by AmericanChemical Society).
Date of initial receipt: 30 March 1994Date of acceptance: 12 September 1994Ms 145SR-141
539

A.K. RUTLEDGE ET AL.
4.5
4.0
3.5
3.0
•B 2.5CO
|
1.5
1.0
0.5
0.0
4.5
4.0
3.5
3.0
•2 2.5jjö
| 2.0
1.5
1.0
0.5
0.0
4.5
4.0
3.5
3.0
I"| 2.0
1.5
1.0
0.5
0.0
= A Clayeydiatom ooze
19.2 mbsf
1
110
|100
Log P (kPa)
""I1000
= BClayey
diatom ooze103.2 mbsf
10000 1 10 100 1000Log P1 (kPa)
= C Diatom ooze189.1 mbsf
10i
100Log P1 (kPa)
i i i i if|
1000I Mill
10000
= D Clay withdiatoms
53.3 mbsf
i i i i • i |
10i i i i • • |
1001 1 1 •i i • |
1000Log P1 (kPa)
Clayey diatom
ooze
86.8 mbsf
: FDiatom oozewith clay and
calcite456.1 mbsf
10000
10000
in i i i IIIIII I I i mm i i i inn i i i Mini
10 100 1000 10000 1 10Log P1 (kPa)
I I l l l l l I I I I II III I I I I I III
100 1000 10000Log P• (kPa)
Figure 12. Consolidation test results: e-Log P' plots for consolidation samples. A. Sample 145-881C-3H-4, 138-150 cm. B. Sample 145-881C-12H-3, 138-150cm. C. Sample 145-881C-21H-5, 138-150 cm. D. Sample 145-883B-6H-5, 138-150 cm. E. Sample 145-883B-10H-2, 138-150 cm. F. Sample 145-883B-48X-5,138-150 cm.

GEOTECHNICAL PROPERTIES OF NORTH PACIFIC SEDIMENTS
1000 10000 11111 ii| i i 1111 ii|
10 100 1000 10000Log F (kPa)
Figure
i mil i i i mm rπiiTiη i i imu i i IIIII• i 111IIIII π iimi i immi i i IIIIII
10 100 1000 10000 01 1 10 100 1000 10000Log P1 (kPa) Log P (kPa)
13. Field consolidation curves for (A) Hole 88IC, (B) Hole 883B, (C) Hole 883C, and (D) Hole 886C.
541

A.K. RUTLEDGE ET AL.
Plate 1. Side view (along scan plane) of the Technicare Δ-100 CT scanner. The basic components ofa CT scanner are the X-ray source, detector array, automatic micropositioning table, and central controlcomputer (not shown).

GEOTECHNICAL PROPERTIES OF NORTH PACIFIC SEDIMENTS
Plate 2. Selected CT images from Sample 145-886C-2H-4, 138-150 cm. 1. Low-density burrow(Planolites) and beginning of the large feeding structure imaged in (2). 2. Large low-density structureand two high-density halo burrows. Scale bar = 1 cm.

A.K. RUTLEDGE ET AL.
Plate 3. Selected CT images from Sample 145-886C-3H-5, 140-150 cm. 1. High-density burrow. 2.Homogeneous fabric. Scale bar = 1 cm.
5 44

GEOTECHNICAL PROPERTIES OF NORTH PACIFIC SEDIMENTS
Plate 4. Selected CT images from Sample 145-886C-4H-4, 138-150 cm.Remnant of high-density burrow (?). Scale bar = 1 cm.
1. Homogeneous fabric. 2.
545

A.K.RUTLEDGE ET AL.
Plate 5. Selected CT images from Sample 145-886C-8H-5, 138-150 cm. 1,2. Traces of high-densityburrows (?). Scale bar = 1 cm.
546