347-361 347 Baseline MRI Predictors of Conversion from MCI ... · Baseline MRI Predictors of...
15
Current Alzheimer Research, 2009, 6, 347-361 347 1567-2050/09 $55.00+.00 ©2009 Bentham Science Publishers Ltd. Baseline MRI Predictors of Conversion from MCI to Probable AD in the ADNI Cohort Shannon L. Risacher 1,2 , Andrew J. Saykin 1,3,* , John D. West 1 , Li Shen 1,4 , Hiram A. Firpi 1 , Brenna C. McDonald 1 and the Alzheimer’s Disease Neuroimaging Initiative (ADNI) † 1 IU Center for Neuroimaging, Division of Imaging Sciences, Department of Radiology, Indiana University School of Medicine, 950 W Walnut St, R2 E124, Indianapolis, IN 46202, USA; 2 Medical Neuroscience Program, Stark Neuros- ciences Research Institute, Indiana University School of Medicine, 950 W Walnut St, R2 Building, Room 402, Indiana- polis, IN 46202, USA; 3 Indiana Alzheimer Disease Center, Indiana University School of Medicine, Indianapolis, IN 46202, USA; 4 Center for Computational Biology and Bioinformatics, Indiana University School of Medicine, 410 West 10th Street, Suite 5000, Indianapolis, IN 46202, USA; Abstract: The Alzheimer’s Disease Neuroimaging Initiative (ADNI) is a multi-center study assessing neuroimaging in diagnosis and longitudinal monitoring. Amnestic Mild Cognitive Impairment (MCI) often represents a prodromal form of dementia, conferring a 10-15% annual risk of converting to probable AD. We analyzed baseline 1.5T MRI scans in 693 participants from the ADNI cohort divided into four groups by baseline diagnosis and one year MCI to probable AD conversion status to identify neuroimaging phenotypes associated with MCI and AD and potential predictive markers of imminent conversion. MP-RAGE scans were analyzed using publicly available voxel-based morphometry (VBM) and automated parcellation methods. Measures included global and hippocampal grey matter (GM) density, hippocampal and amygdalar volumes, and cortical thickness values from entorhinal cortex and other temporal and parietal lobe regions. The overall pattern of structural MRI changes in MCI (n=339) and AD (n=148) compared to healthy controls (HC, n=206) was similar to prior findings in smaller samples. MCI-Converters (n=62) demonstrated a very similar pattern of atrophic changes to the AD group up to a year before meeting clinical criteria for AD. Finally, a comparison of effect sizes for contrasts between the MCI-Converters and MCI-Stable (n=277) groups on MRI metrics indicated that degree of neurode- generation of medial temporal structures was the best antecedent MRI marker of imminent conversion, with decreased hippocampal volume (left > right) being the most robust. Validation of imaging biomarkers is important as they can help enrich clinical trials of disease modifying agents by identifying individuals at highest risk for progression to AD. Keywords: Alzheimer’s disease neuroimaging initiative (ADNI), magnetic resonance imaging (MRI), mild cognitive impairment (MCI), hippocampus, cognition. INTRODUCTION Alzheimer’s disease (AD) is the most common neurode- generative illness associated with aging, accounting for 60- 70% of age-related dementia cases. In 2000, approximately 25 million people over the age of 60 were diagnosed with dementia worldwide, and the number afflicted is expected to reach over 80 million by 2040 [1, 2]. Earlier diagnosis of AD is widely considered to be an important goal for researchers. Characterization of the earliest known clinical signs has led to the development of the classification of Mild Cognitive Impairment (MCI), which is thought to be a transitional stage between normal aging and the development of AD *Address correspondence to this author at the IU Center for Neuroimaging, Department of Radiology, Indiana University School of Medicine, 950 W Walnut St, R2 E124, Indianapolis, Indiana 46202, USA; Tel: 317-278-6947; Fax: 317-274-1067; Email: [email protected] † Data used in the preparation of this article were obtained from the Alzhei- mer’s Disease Neuroimaging Initiative (ADNI) database (www.loni.ucla.edu/ADNI). As such, the investigators within the ADNI contributed to the design and implementation of ADNI and/or provided data but did not participate in analysis or writing of this report. For a complete list of investigators involved in ADNI see: http://www.loni.ucla.edu/ ADNI/About/About_InvestigatorsTable.shtml [3]. Patients with MCI, specifically those with primary memory deficits or “amnestic MCI”, have a significantly higher likelihood to progress to probable AD, with a conver- sion rate of 10-15% per year [4]. Therefore, MCI represents an important clinical group in which to study longitudinal changes associated with the development of AD. The detec- tion of subtle changes in brain structure associated with di- sease progression and the development of tools to detect those who are most likely to convert from MCI to probable AD is an important goal. The Alzheimer's Disease Neuroimaging Initiative (ADNI) is a five-year public-private partnership to test whether serial magnetic resonance imaging (MRI), positron emission tomography (PET), other biological markers, and clinical and neuropsychological assessment can be combined to measure the progression of amnestic MCI and early proba- ble AD [5-7]. One of the major goals of ADNI is to assess selected neuroimaging and analysis techniques for sensitivity and specificity for both cross-sectional diagnostic group classification and longitudinal progression of MCI and AD. A powerful technique for analyzing high resolution struc- tural MRI data is voxel-based morphometry (VBM), which
Transcript of 347-361 347 Baseline MRI Predictors of Conversion from MCI ... · Baseline MRI Predictors of...

Current Alzheimer Research, 2009, 6, 347-361 347
1567-2050/09 $55.00+.00 ©2009 Bentham Science Publishers Ltd.
Baseline MRI Predictors of Conversion from MCI to Probable AD in the ADNI Cohort
Shannon L. Risacher1,2
, Andrew J. Saykin1,3,*
, John D. West1, Li Shen
1,4, Hiram A. Firpi
1,
Brenna C. McDonald1 and the Alzheimer’s Disease Neuroimaging Initiative (ADNI)
†
1IU Center for Neuroimaging, Division of Imaging Sciences, Department of Radiology, Indiana University School of
Medicine, 950 W Walnut St, R2 E124, Indianapolis, IN 46202, USA; 2Medical Neuroscience Program, Stark Neuros-
ciences Research Institute, Indiana University School of Medicine, 950 W Walnut St, R2 Building, Room 402, Indiana-
polis, IN 46202, USA; 3Indiana Alzheimer Disease Center, Indiana University School of Medicine, Indianapolis, IN
46202, USA; 4Center for Computational Biology and Bioinformatics, Indiana University School of Medicine, 410 West
10th Street, Suite 5000, Indianapolis, IN 46202, USA;
Abstract: The Alzheimer’s Disease Neuroimaging Initiative (ADNI) is a multi-center study assessing neuroimaging in
diagnosis and longitudinal monitoring. Amnestic Mild Cognitive Impairment (MCI) often represents a prodromal form of
dementia, conferring a 10-15% annual risk of converting to probable AD. We analyzed baseline 1.5T MRI scans in 693
participants from the ADNI cohort divided into four groups by baseline diagnosis and one year MCI to probable AD
conversion status to identify neuroimaging phenotypes associated with MCI and AD and potential predictive markers of
imminent conversion. MP-RAGE scans were analyzed using publicly available voxel-based morphometry (VBM) and
automated parcellation methods. Measures included global and hippocampal grey matter (GM) density, hippocampal and
amygdalar volumes, and cortical thickness values from entorhinal cortex and other temporal and parietal lobe regions. The
overall pattern of structural MRI changes in MCI (n=339) and AD (n=148) compared to healthy controls (HC, n=206)
was similar to prior findings in smaller samples. MCI-Converters (n=62) demonstrated a very similar pattern of atrophic
changes to the AD group up to a year before meeting clinical criteria for AD. Finally, a comparison of effect sizes for
contrasts between the MCI-Converters and MCI-Stable (n=277) groups on MRI metrics indicated that degree of neurode-
generation of medial temporal structures was the best antecedent MRI marker of imminent conversion, with decreased
hippocampal volume (left > right) being the most robust. Validation of imaging biomarkers is important as they can help
enrich clinical trials of disease modifying agents by identifying individuals at highest risk for progression to AD.
Keywords: Alzheimer’s disease neuroimaging initiative (ADNI), magnetic resonance imaging (MRI), mild cognitive impairment (MCI), hippocampus, cognition.
INTRODUCTION
Alzheimer’s disease (AD) is the most common neurode-generative illness associated with aging, accounting for 60-70% of age-related dementia cases. In 2000, approximately 25 million people over the age of 60 were diagnosed with dementia worldwide, and the number afflicted is expected to reach over 80 million by 2040 [1, 2]. Earlier diagnosis of AD is widely considered to be an important goal for researchers. Characterization of the earliest known clinical signs has led to the development of the classification of Mild Cognitive Impairment (MCI), which is thought to be a transitional stage between normal aging and the development of AD
*Address correspondence to this author at the IU Center for Neuroimaging,
Department of Radiology, Indiana University School of Medicine, 950 W
Walnut St, R2 E124, Indianapolis, Indiana 46202, USA; Tel: 317-278-6947; Fax: 317-274-1067; Email: [email protected] †Data used in the preparation of this article were obtained from the Alzhei-mer’s Disease Neuroimaging Initiative (ADNI) database
(www.loni.ucla.edu/ADNI). As such, the investigators within the ADNI contributed to the design and implementation of ADNI and/or provided data
but did not participate in analysis or writing of this report. For a complete list of investigators involved in ADNI see: http://www.loni.ucla.edu/
ADNI/About/About_InvestigatorsTable.shtml
[3]. Patients with MCI, specifically those with primary memory deficits or “amnestic MCI”, have a significantly higher likelihood to progress to probable AD, with a conver-sion rate of 10-15% per year [4]. Therefore, MCI represents an important clinical group in which to study longitudinal changes associated with the development of AD. The detec-tion of subtle changes in brain structure associated with di-sease progression and the development of tools to detect those who are most likely to convert from MCI to probable AD is an important goal.
The Alzheimer's Disease Neuroimaging Initiative (ADNI) is a five-year public-private partnership to test whether serial magnetic resonance imaging (MRI), positron emission tomography (PET), other biological markers, and clinical and neuropsychological assessment can be combined to measure the progression of amnestic MCI and early proba-ble AD [5-7]. One of the major goals of ADNI is to assess selected neuroimaging and analysis techniques for sensitivity and specificity for both cross-sectional diagnostic group classification and longitudinal progression of MCI and AD.
A powerful technique for analyzing high resolution struc-tural MRI data is voxel-based morphometry (VBM), which
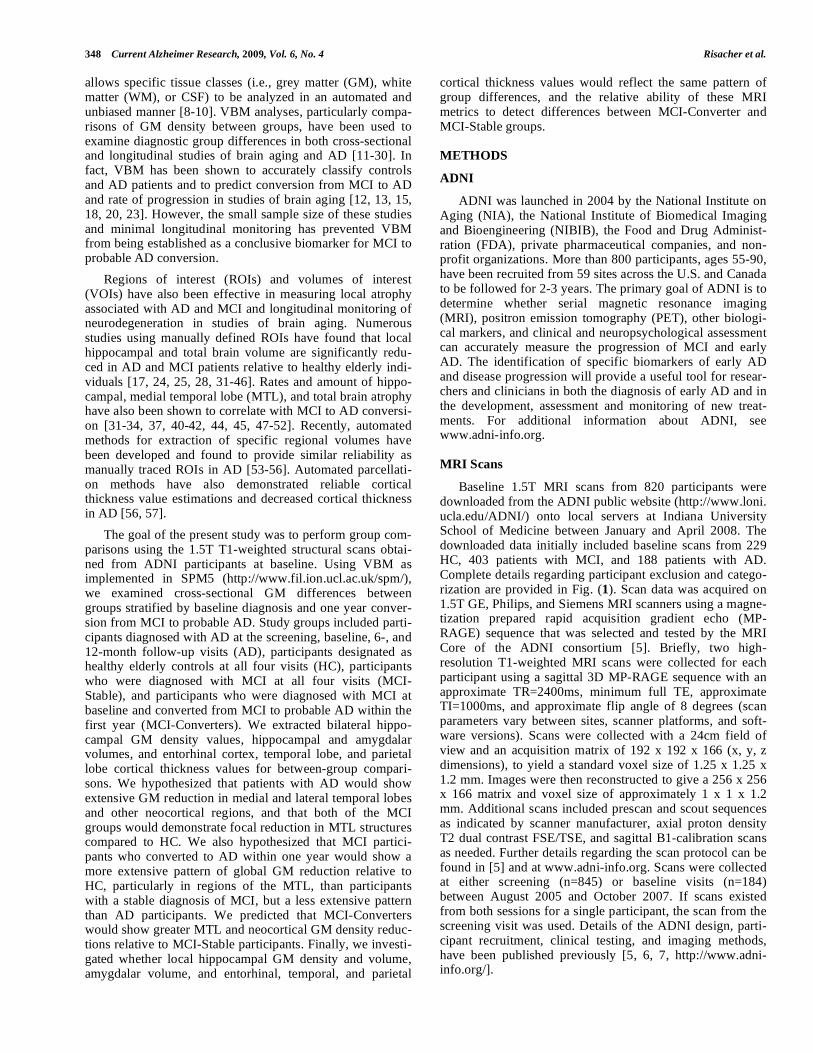
348 Current Alzheimer Research, 2009, Vol. 6, No. 4 Risacher et al.
allows specific tissue classes (i.e., grey matter (GM), white matter (WM), or CSF) to be analyzed in an automated and unbiased manner [8-10]. VBM analyses, particularly compa-risons of GM density between groups, have been used to examine diagnostic group differences in both cross-sectional and longitudinal studies of brain aging and AD [11-30]. In fact, VBM has been shown to accurately classify controls and AD patients and to predict conversion from MCI to AD and rate of progression in studies of brain aging [12, 13, 15, 18, 20, 23]. However, the small sample size of these studies and minimal longitudinal monitoring has prevented VBM from being established as a conclusive biomarker for MCI to probable AD conversion.
Regions of interest (ROIs) and volumes of interest (VOIs) have also been effective in measuring local atrophy associated with AD and MCI and longitudinal monitoring of neurodegeneration in studies of brain aging. Numerous studies using manually defined ROIs have found that local hippocampal and total brain volume are significantly redu-ced in AD and MCI patients relative to healthy elderly indi-viduals [17, 24, 25, 28, 31-46]. Rates and amount of hippo-campal, medial temporal lobe (MTL), and total brain atrophy have also been shown to correlate with MCI to AD conversi-on [31-34, 37, 40-42, 44, 45, 47-52]. Recently, automated methods for extraction of specific regional volumes have been developed and found to provide similar reliability as manually traced ROIs in AD [53-56]. Automated parcellati-on methods have also demonstrated reliable cortical thickness value estimations and decreased cortical thickness in AD [56, 57].
The goal of the present study was to perform group com-parisons using the 1.5T T1-weighted structural scans obtai-ned from ADNI participants at baseline. Using VBM as implemented in SPM5 (http://www.fil.ion.ucl.ac.uk/spm/), we examined cross-sectional GM differences between groups stratified by baseline diagnosis and one year conver-sion from MCI to probable AD. Study groups included parti-cipants diagnosed with AD at the screening, baseline, 6-, and 12-month follow-up visits (AD), participants designated as healthy elderly controls at all four visits (HC), participants who were diagnosed with MCI at all four visits (MCI-Stable), and participants who were diagnosed with MCI at baseline and converted from MCI to probable AD within the first year (MCI-Converters). We extracted bilateral hippo-campal GM density values, hippocampal and amygdalar volumes, and entorhinal cortex, temporal lobe, and parietal lobe cortical thickness values for between-group compari-sons. We hypothesized that patients with AD would show extensive GM reduction in medial and lateral temporal lobes and other neocortical regions, and that both of the MCI groups would demonstrate focal reduction in MTL structures compared to HC. We also hypothesized that MCI partici-pants who converted to AD within one year would show a more extensive pattern of global GM reduction relative to HC, particularly in regions of the MTL, than participants with a stable diagnosis of MCI, but a less extensive pattern than AD participants. We predicted that MCI-Converters would show greater MTL and neocortical GM density reduc-tions relative to MCI-Stable participants. Finally, we investi-gated whether local hippocampal GM density and volume, amygdalar volume, and entorhinal, temporal, and parietal
cortical thickness values would reflect the same pattern of group differences, and the relative ability of these MRI metrics to detect differences between MCI-Converter and MCI-Stable groups.
METHODS
ADNI
ADNI was launched in 2004 by the National Institute on Aging (NIA), the National Institute of Biomedical Imaging and Bioengineering (NIBIB), the Food and Drug Administ-ration (FDA), private pharmaceutical companies, and non-profit organizations. More than 800 participants, ages 55-90, have been recruited from 59 sites across the U.S. and Canada to be followed for 2-3 years. The primary goal of ADNI is to determine whether serial magnetic resonance imaging (MRI), positron emission tomography (PET), other biologi-cal markers, and clinical and neuropsychological assessment can accurately measure the progression of MCI and early AD. The identification of specific biomarkers of early AD and disease progression will provide a useful tool for resear-chers and clinicians in both the diagnosis of early AD and in the development, assessment and monitoring of new treat-ments. For additional information about ADNI, see www.adni-info.org.
MRI Scans
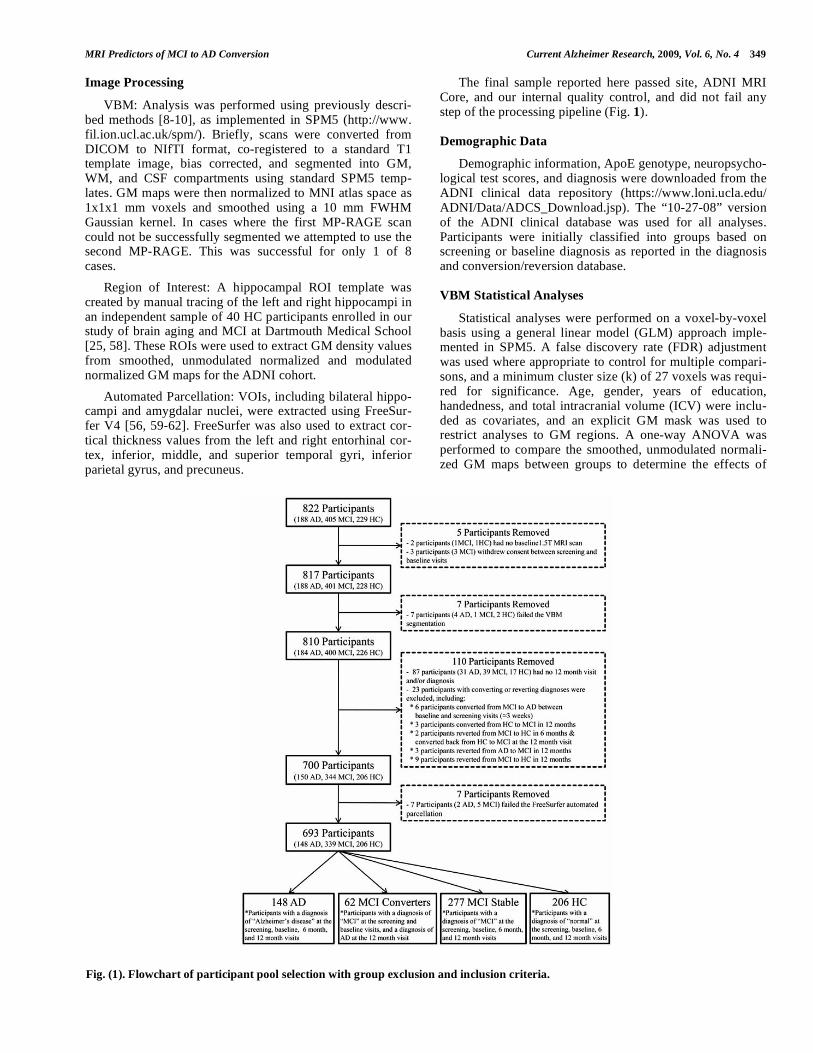
Baseline 1.5T MRI scans from 820 participants were downloaded from the ADNI public website (http://www.loni. ucla.edu/ADNI/) onto local servers at Indiana University School of Medicine between January and April 2008. The downloaded data initially included baseline scans from 229 HC, 403 patients with MCI, and 188 patients with AD. Complete details regarding participant exclusion and catego-rization are provided in Fig. (1). Scan data was acquired on 1.5T GE, Philips, and Siemens MRI scanners using a magne-tization prepared rapid acquisition gradient echo (MP-RAGE) sequence that was selected and tested by the MRI Core of the ADNI consortium [5]. Briefly, two high-resolution T1-weighted MRI scans were collected for each participant using a sagittal 3D MP-RAGE sequence with an approximate TR=2400ms, minimum full TE, approximate TI=1000ms, and approximate flip angle of 8 degrees (scan parameters vary between sites, scanner platforms, and soft-ware versions). Scans were collected with a 24cm field of view and an acquisition matrix of 192 x 192 x 166 (x, y, z dimensions), to yield a standard voxel size of 1.25 x 1.25 x 1.2 mm. Images were then reconstructed to give a 256 x 256 x 166 matrix and voxel size of approximately 1 x 1 x 1.2 mm. Additional scans included prescan and scout sequences as indicated by scanner manufacturer, axial proton density T2 dual contrast FSE/TSE, and sagittal B1-calibration scans as needed. Further details regarding the scan protocol can be found in [5] and at www.adni-info.org. Scans were collected at either screening (n=845) or baseline visits (n=184) between August 2005 and October 2007. If scans existed from both sessions for a single participant, the scan from the screening visit was used. Details of the ADNI design, parti-cipant recruitment, clinical testing, and imaging methods, have been published previously [5, 6, 7, http://www.adni-info.org/].
MRI Predictors of MCI to AD Conversion Current Alzheimer Research, 2009, Vol. 6, No. 4 349
Image Processing
VBM: Analysis was performed using previously descri-bed methods [8-10], as implemented in SPM5 (http://www. fil.ion.ucl.ac.uk/spm/). Briefly, scans were converted from DICOM to NIfTI format, co-registered to a standard T1 template image, bias corrected, and segmented into GM, WM, and CSF compartments using standard SPM5 temp-lates. GM maps were then normalized to MNI atlas space as 1x1x1 mm voxels and smoothed using a 10 mm FWHM Gaussian kernel. In cases where the first MP-RAGE scan could not be successfully segmented we attempted to use the second MP-RAGE. This was successful for only 1 of 8 cases.
Region of Interest: A hippocampal ROI template was created by manual tracing of the left and right hippocampi in an independent sample of 40 HC participants enrolled in our study of brain aging and MCI at Dartmouth Medical School [25, 58]. These ROIs were used to extract GM density values from smoothed, unmodulated normalized and modulated normalized GM maps for the ADNI cohort.
Automated Parcellation: VOIs, including bilateral hippo-campi and amygdalar nuclei, were extracted using FreeSur-fer V4 [56, 59-62]. FreeSurfer was also used to extract cor-tical thickness values from the left and right entorhinal cor-tex, inferior, middle, and superior temporal gyri, inferior parietal gyrus, and precuneus.
The final sample reported here passed site, ADNI MRI Core, and our internal quality control, and did not fail any step of the processing pipeline (Fig. 1).
Demographic Data
Demographic information, ApoE genotype, neuropsycho-logical test scores, and diagnosis were downloaded from the ADNI clinical data repository (https://www.loni.ucla.edu/ ADNI/Data/ADCS_Download.jsp). The “10-27-08” version of the ADNI clinical database was used for all analyses. Participants were initially classified into groups based on screening or baseline diagnosis as reported in the diagnosis and conversion/reversion database.
VBM Statistical Analyses
Statistical analyses were performed on a voxel-by-voxel basis using a general linear model (GLM) approach imple-mented in SPM5. A false discovery rate (FDR) adjustment was used where appropriate to control for multiple compari-sons, and a minimum cluster size (k) of 27 voxels was requi-red for significance. Age, gender, years of education, handedness, and total intracranial volume (ICV) were inclu-ded as covariates, and an explicit GM mask was used to restrict analyses to GM regions. A one-way ANOVA was performed to compare the smoothed, unmodulated normali-zed GM maps between groups to determine the effects of
Fig. (1). Flowchart of participant pool selection with group exclusion and inclusion criteria.

350 Current Alzheimer Research, 2009, Vol. 6, No. 4 Risacher et al.
diagnosis and one year conversion from MCI to AD on GM density. The initial comparison was done using the entire available sample of 693 participants. A second comparison was completed using the same methods but with subgroups of matched participants to correct for unequal group sizes (n=248; 62 in each group). Matching was done on a case by case basis using the best available match on age, gender, education, and handedness, while preserving the relative proportion of ApoE4+ participants within each subgroup. After matching there were no significant group differences in age, gender, education, or handedness.
Finally, a third set of analyses were performed with the full available sample of 693 participants, adding a volume preserving modulation step to the VBM method, yielding an assessment of local GM volume differences instead of GM density.
Other Statistical Analyses
Mean left and right hippocampal GM density, hippocam-pal and amygdalar volumes, and cortical thickness values for all 693 participants were compared between groups using a one-way multivariate ANOVA in SPSS (version 16.0.1). Age, gender, education, handedness, and ICV were included as covariates in all ROI, VOI, and cortical thickness compa-risons. One-way ANOVA and chi-square tests were used to determine between-group differences in age, gender distribu-tion, ApoE genotype, education, handedness distribution, primary language distribution, and baseline global, functio-nal, behavioral, neurological, neuropsychiatric, and neuro-psychological test scores. All graphs were created using SigmaPlot (version 10.0).
Effect sizes for the comparison between MCI-Converters and MCI-Stable participants were also calculated for selected imaging biomarkers, including bilateral hippocampal GM density and volume from the VBM images, bilateral hippo-campal, amygdalar, accumbens, ventral dorsal column, infe-rior lateral ventricle, lateral ventricle, cerebral cortex, and cerebral white matter volumes extracted using automated parcellation, and cortical thickness values from bilateral entorhinal cortex, inferior, middle, and superior temporal gyri, inferior parietal gyrus, and precuneus, which were also extracted using automated parcellation. These values were assessed due to significant differences between MCI-Converter and MCI-Stable groups on pairwise comparisons (p<0.05). Left and right adjusted means for each imaging measure, covaried for age, gender, education, handedness, and ICV, were averaged to give a bilateral estimate, and used to calculate effect sizes (Cohen’s d) in SPSS and Microsoft Excel (version 2007).
RESULTS
Sample Characteristics
Demographic information and mean baseline test scores for all groups are presented in Table 1. Mean participant age and handedness distribution did not differ across groups. Years of education and percent of participants with either one or two ApoE 4 alleles (ApoE4+) were significantly different between diagnosis groups (p<0.001). AD partici-pants showed significantly fewer years of education than
either HC (p<0.001) or MCI-Stable (p=0.003) participants. Years of education did not differ significantly between any other groups in pairwise comparisons. As expected, the HC group had a lower percentage of ApoE4+ participants than any of the clinical groups, while the AD group had the highest percentage of ApoE4+ participants. The MCI-Stable and MCI-Converter groups had different proportions of A-poE4+ participants, with the MCI-Converter group showing a higher percentage of ApoE4+ participants than the MCI-Stable group. Neuropsychiatric test results, including scores from the Geriatric Depression Scale (GDS) [63] and Neuro-psychiatric Inventory Questionnaire (NPI-Q) [64], were significantly different between groups (p<0.001). HC parti-cipants showed significantly fewer depressive symptoms than either AD or MCI-Stable participants (p<0.001), and had a lower mean score on the NPI-Q than the AD, MCI-Stable, and MCI-Converter groups (p<0.001). AD parti-cipants also had a significantly higher mean NPI-Q score than the MCI-Stable (p<0.001) and MCI-Converter (p=0.008) groups. No significant differences in mean GDS scores were found between the MCI-Stable, MCI-Converter, and AD groups. No group showed clinically meaningful le-vels of depressive symptoms. Ischemic events and/or risk were not significantly different between groups as assessed by the Modified Hachinski scale [65].
As expected, neuropsychological test scores (MMSE [66, 67], Clinical Dementia Rating (CDR) [68], and the Functio-nal Assessment Questionnaire (FAQ) [69]) varied signifi-cantly between groups (p<0.001). Pairwise comparisons showed a similar pattern for the MMSE, Global CDR, and CDR-Sum of Boxes. HC participants had significantly hig-her MMSE and lower CDR scores relative to all other groups (p<0.001). Additionally, MCI-Stable and MCI-Converter participants showed significantly higher MMSE and lower CDR scores compared to AD participants (p<0.001), but did not differ from one another on these assessments. Mean FAQ total scores were significantly different across groups and in all pairwise comparisons (p<0.001).
Neuropsychological scores from the Rey Auditory Verbal Learning Test (RAVLT) [70], Boston Naming Test (BNT) [71], and category verbal fluency tests (Fluency-Animals, Fluency-Vegetables) [72] also showed significant differences between groups (p<0.001). However, these assessments showed a different pattern in pairwise compari-sons than the MMSE, Global CDR, and FAQ. MCI-Converters and AD participants showed similar scores on the learning and verbal neuropsychological tests, with no signi-ficant differences on RAVLT measures, BNT, or verbal fluency tests. As expected, all of the clinical groups perfor-med below HC participants for RAVLT, BNT, and verbal fluency measures (p<0.001). MCI-Stable participants also had significantly higher scores on all RAVLT measures and Fluency-Vegetables than both the AD and MCI-Converter groups (p<0.001). Finally, MCI-Stable participants had significantly higher scores than AD participants but not MCI-Converters on Fluency-Animals and BNT (p<0.001).
VBM Group Comparisons by Baseline Diagnosis and
One Year Conversion Status
All 693 participants were included in the initial VBM analyses. A one-way ANOVA indicated striking between-
MRI Predictors of MCI to AD Conversion Current Alzheimer Research, 2009, Vol. 6, No. 4 351
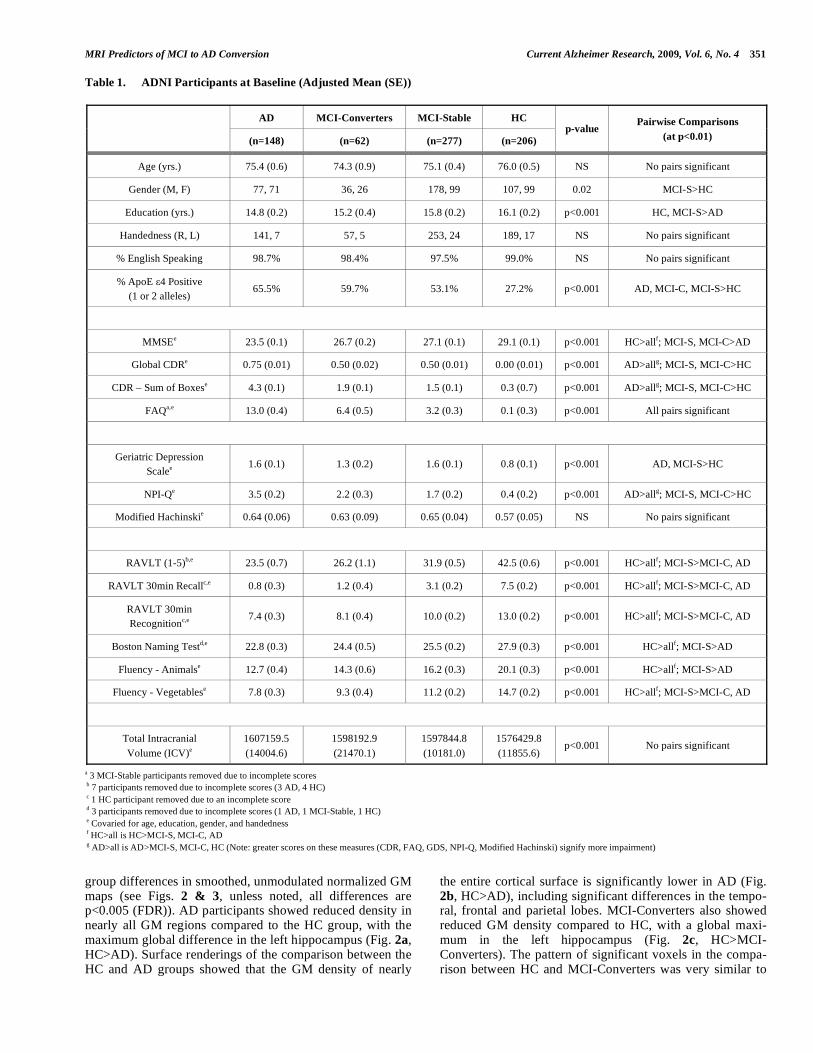
Table 1. ADNI Participants at Baseline (Adjusted Mean (SE))
AD MCI-Converters MCI-Stable HC
(n=148) (n=62) (n=277) (n=206)
p-value Pairwise Comparisons
(at p<0.01)
Age (yrs.) 75.4 (0.6) 74.3 (0.9) 75.1 (0.4) 76.0 (0.5) NS No pairs significant
Gender (M, F) 77, 71 36, 26 178, 99 107, 99 0.02 MCI-S>HC
Education (yrs.) 14.8 (0.2) 15.2 (0.4) 15.8 (0.2) 16.1 (0.2) p<0.001 HC, MCI-S>AD
Handedness (R, L) 141, 7 57, 5 253, 24 189, 17 NS No pairs significant
% English Speaking 98.7% 98.4% 97.5% 99.0% NS No pairs significant
% ApoE 4 Positive
(1 or 2 alleles) 65.5% 59.7% 53.1% 27.2% p<0.001 AD, MCI-C, MCI-S>HC
MMSEe 23.5 (0.1) 26.7 (0.2) 27.1 (0.1) 29.1 (0.1) p<0.001 HC>allf; MCI-S, MCI-C>AD
Global CDRe 0.75 (0.01) 0.50 (0.02) 0.50 (0.01) 0.00 (0.01) p<0.001 AD>allg; MCI-S, MCI-C>HC
CDR – Sum of Boxese 4.3 (0.1) 1.9 (0.1) 1.5 (0.1) 0.3 (0.7) p<0.001 AD>allg; MCI-S, MCI-C>HC
FAQa,e 13.0 (0.4) 6.4 (0.5) 3.2 (0.3) 0.1 (0.3) p<0.001 All pairs significant
Geriatric Depression
Scalee 1.6 (0.1) 1.3 (0.2) 1.6 (0.1) 0.8 (0.1) p<0.001 AD, MCI-S>HC
NPI-Qe 3.5 (0.2) 2.2 (0.3) 1.7 (0.2) 0.4 (0.2) p<0.001 AD>allg; MCI-S, MCI-C>HC
Modified Hachinskie 0.64 (0.06) 0.63 (0.09) 0.65 (0.04) 0.57 (0.05) NS No pairs significant
RAVLT (1-5)b,e 23.5 (0.7) 26.2 (1.1) 31.9 (0.5) 42.5 (0.6) p<0.001 HC>allf; MCI-S>MCI-C, AD
RAVLT 30min Recallc,e 0.8 (0.3) 1.2 (0.4) 3.1 (0.2) 7.5 (0.2) p<0.001 HC>allf; MCI-S>MCI-C, AD
RAVLT 30min
Recognitionc,e 7.4 (0.3) 8.1 (0.4) 10.0 (0.2) 13.0 (0.2) p<0.001 HC>allf; MCI-S>MCI-C, AD
Boston Naming Testd,e 22.8 (0.3) 24.4 (0.5) 25.5 (0.2) 27.9 (0.3) p<0.001 HC>allf; MCI-S>AD
Fluency - Animalse 12.7 (0.4) 14.3 (0.6) 16.2 (0.3) 20.1 (0.3) p<0.001 HC>allf; MCI-S>AD
Fluency - Vegetablese 7.8 (0.3) 9.3 (0.4) 11.2 (0.2) 14.7 (0.2) p<0.001 HC>allf; MCI-S>MCI-C, AD
Total Intracranial
Volume (ICV)e
1607159.5
(14004.6)
1598192.9
(21470.1)
1597844.8
(10181.0)
1576429.8
(11855.6) p<0.001 No pairs significant
a 3 MCI-Stable participants removed due to incomplete scores b 7 participants removed due to incomplete scores (3 AD, 4 HC) c 1 HC participant removed due to an incomplete score d 3 participants removed due to incomplete scores (1 AD, 1 MCI-Stable, 1 HC) e Covaried for age, education, gender, and handedness f HC>all is HC>MCI-S, MCI-C, AD
g AD>all is AD>MCI-S, MCI-C, HC (Note: greater scores on these measures (CDR, FAQ, GDS, NPI-Q, Modified Hachinski) signify more impairment)
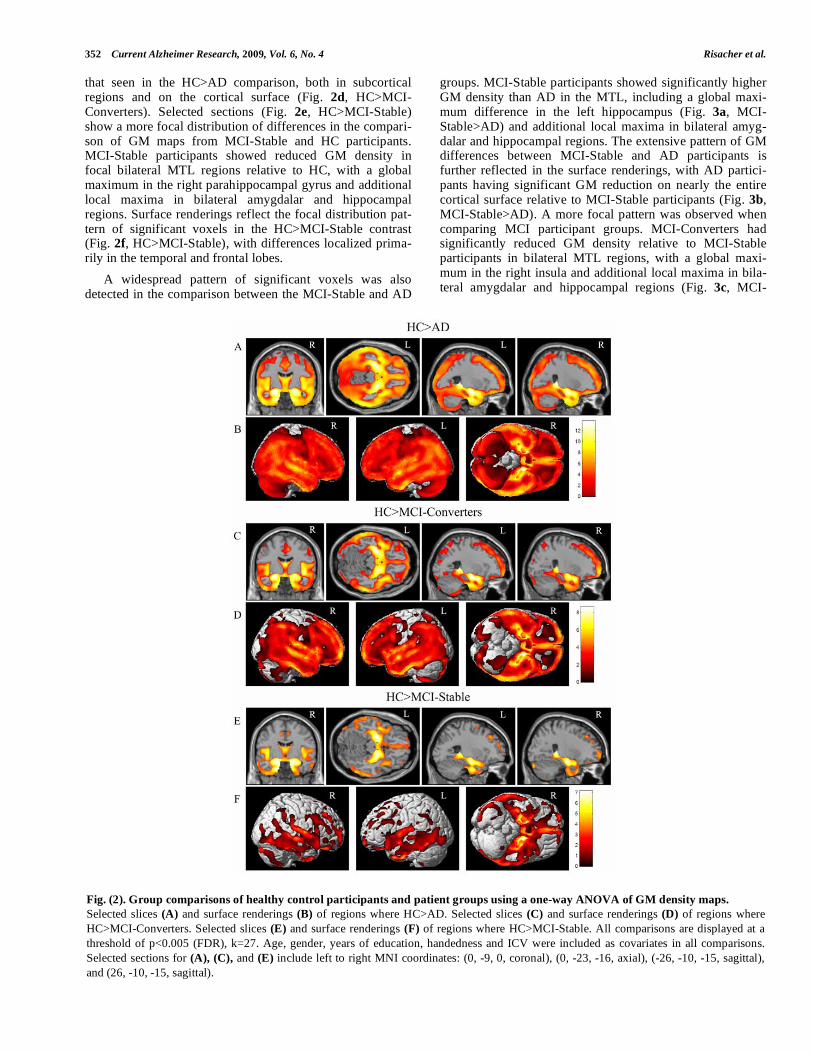
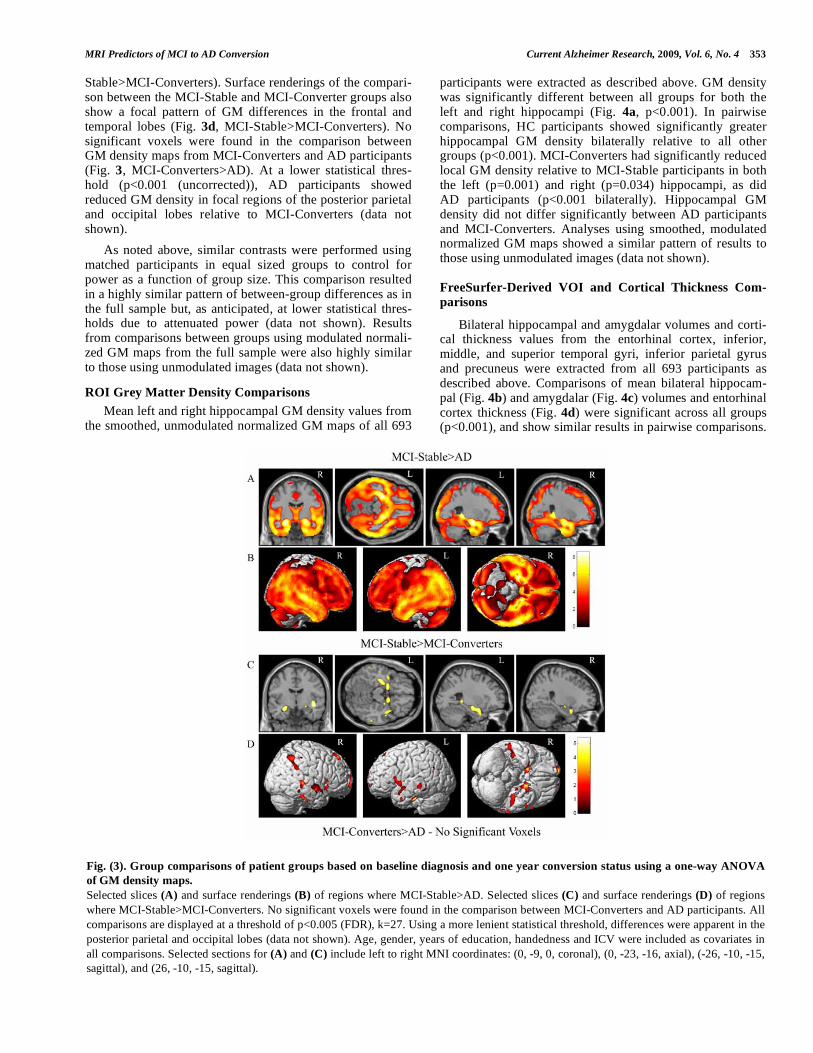
group differences in smoothed, unmodulated normalized GM maps (see Figs. 2 & 3, unless noted, all differences are p<0.005 (FDR)). AD participants showed reduced density in nearly all GM regions compared to the HC group, with the maximum global difference in the left hippocampus (Fig. 2a, HC>AD). Surface renderings of the comparison between the HC and AD groups showed that the GM density of nearly
the entire cortical surface is significantly lower in AD (Fig. 2b, HC>AD), including significant differences in the tempo-ral, frontal and parietal lobes. MCI-Converters also showed reduced GM density compared to HC, with a global maxi-mum in the left hippocampus (Fig. 2c, HC>MCI-Converters). The pattern of significant voxels in the compa-rison between HC and MCI-Converters was very similar to
352 Current Alzheimer Research, 2009, Vol. 6, No. 4 Risacher et al.
that seen in the HC>AD comparison, both in subcortical regions and on the cortical surface (Fig. 2d, HC>MCI-Converters). Selected sections (Fig. 2e, HC>MCI-Stable) show a more focal distribution of differences in the compari-son of GM maps from MCI-Stable and HC participants. MCI-Stable participants showed reduced GM density in focal bilateral MTL regions relative to HC, with a global maximum in the right parahippocampal gyrus and additional local maxima in bilateral amygdalar and hippocampal regions. Surface renderings reflect the focal distribution pat-tern of significant voxels in the HC>MCI-Stable contrast (Fig. 2f, HC>MCI-Stable), with differences localized prima-rily in the temporal and frontal lobes.
A widespread pattern of significant voxels was also detected in the comparison between the MCI-Stable and AD
groups. MCI-Stable participants showed significantly higher GM density than AD in the MTL, including a global maxi-mum difference in the left hippocampus (Fig. 3a, MCI-Stable>AD) and additional local maxima in bilateral amyg-dalar and hippocampal regions. The extensive pattern of GM differences between MCI-Stable and AD participants is further reflected in the surface renderings, with AD partici-pants having significant GM reduction on nearly the entire cortical surface relative to MCI-Stable participants (Fig. 3b, MCI-Stable>AD). A more focal pattern was observed when comparing MCI participant groups. MCI-Converters had significantly reduced GM density relative to MCI-Stable participants in bilateral MTL regions, with a global maxi-mum in the right insula and additional local maxima in bila-teral amygdalar and hippocampal regions (Fig. 3c, MCI-
Fig. (2). Group comparisons of healthy control participants and patient groups using a one-way ANOVA of GM density maps.
Selected slices (A) and surface renderings (B) of regions where HC>AD. Selected slices (C) and surface renderings (D) of regions where
HC>MCI-Converters. Selected slices (E) and surface renderings (F) of regions where HC>MCI-Stable. All comparisons are displayed at a
threshold of p<0.005 (FDR), k=27. Age, gender, years of education, handedness and ICV were included as covariates in all comparisons.
Selected sections for (A), (C), and (E) include left to right MNI coordinates: (0, -9, 0, coronal), (0, -23, -16, axial), (-26, -10, -15, sagittal),
and (26, -10, -15, sagittal).
MRI Predictors of MCI to AD Conversion Current Alzheimer Research, 2009, Vol. 6, No. 4 353
Stable>MCI-Converters). Surface renderings of the compari-son between the MCI-Stable and MCI-Converter groups also show a focal pattern of GM differences in the frontal and temporal lobes (Fig. 3d, MCI-Stable>MCI-Converters). No significant voxels were found in the comparison between GM density maps from MCI-Converters and AD participants (Fig. 3, MCI-Converters>AD). At a lower statistical thres-hold (p<0.001 (uncorrected)), AD participants showed reduced GM density in focal regions of the posterior parietal and occipital lobes relative to MCI-Converters (data not shown).
As noted above, similar contrasts were performed using matched participants in equal sized groups to control for power as a function of group size. This comparison resulted in a highly similar pattern of between-group differences as in the full sample but, as anticipated, at lower statistical thres-holds due to attenuated power (data not shown). Results from comparisons between groups using modulated normali-zed GM maps from the full sample were also highly similar to those using unmodulated images (data not shown).
ROI Grey Matter Density Comparisons
Mean left and right hippocampal GM density values from the smoothed, unmodulated normalized GM maps of all 693
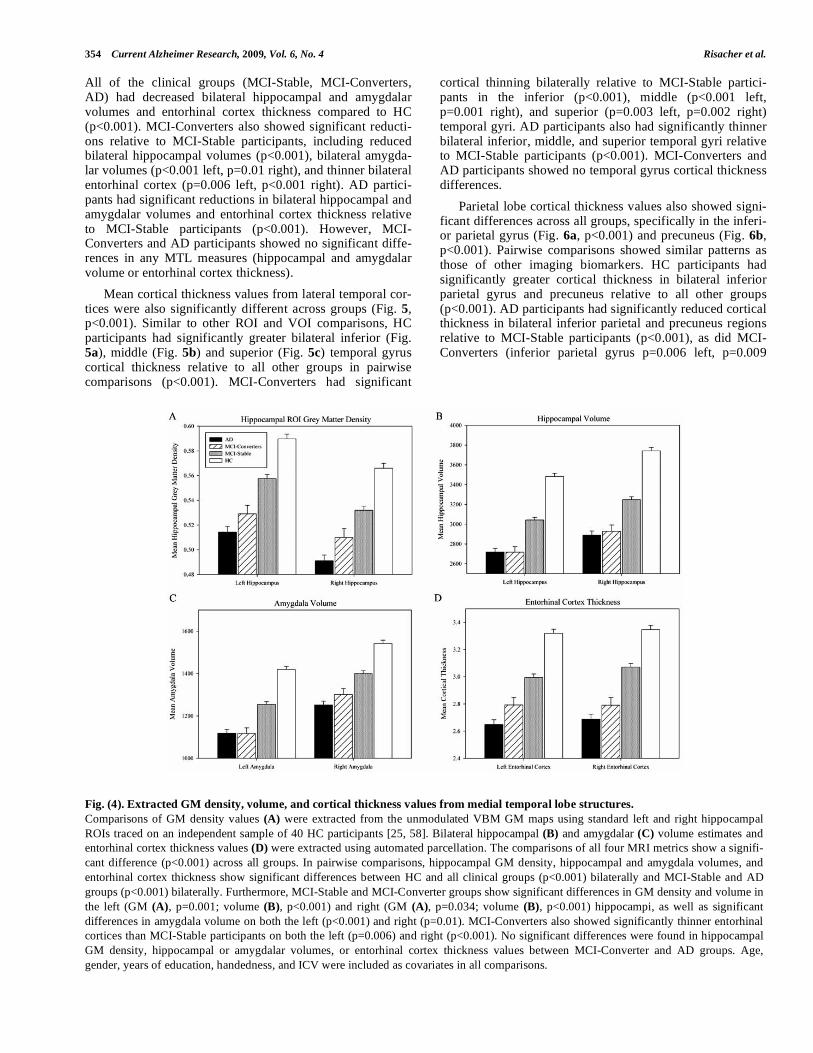
participants were extracted as described above. GM density was significantly different between all groups for both the left and right hippocampi (Fig. 4a, p<0.001). In pairwise comparisons, HC participants showed significantly greater hippocampal GM density bilaterally relative to all other groups (p<0.001). MCI-Converters had significantly reduced local GM density relative to MCI-Stable participants in both the left (p=0.001) and right (p=0.034) hippocampi, as did AD participants (p<0.001 bilaterally). Hippocampal GM density did not differ significantly between AD participants and MCI-Converters. Analyses using smoothed, modulated normalized GM maps showed a similar pattern of results to those using unmodulated images (data not shown).
FreeSurfer-Derived VOI and Cortical Thickness Com-
parisons
Bilateral hippocampal and amygdalar volumes and corti-cal thickness values from the entorhinal cortex, inferior, middle, and superior temporal gyri, inferior parietal gyrus and precuneus were extracted from all 693 participants as described above. Comparisons of mean bilateral hippocam-pal (Fig. 4b) and amygdalar (Fig. 4c) volumes and entorhinal cortex thickness (Fig. 4d) were significant across all groups (p<0.001), and show similar results in pairwise comparisons.
Fig. (3). Group comparisons of patient groups based on baseline diagnosis and one year conversion status using a one-way ANOVA
of GM density maps.
Selected slices (A) and surface renderings (B) of regions where MCI-Stable>AD. Selected slices (C) and surface renderings (D) of regions
where MCI-Stable>MCI-Converters. No significant voxels were found in the comparison between MCI-Converters and AD participants. All
comparisons are displayed at a threshold of p<0.005 (FDR), k=27. Using a more lenient statistical threshold, differences were apparent in the
posterior parietal and occipital lobes (data not shown). Age, gender, years of education, handedness and ICV were included as covariates in
all comparisons. Selected sections for (A) and (C) include left to right MNI coordinates: (0, -9, 0, coronal), (0, -23, -16, axial), (-26, -10, -15,
sagittal), and (26, -10, -15, sagittal).
354 Current Alzheimer Research, 2009, Vol. 6, No. 4 Risacher et al.
All of the clinical groups (MCI-Stable, MCI-Converters, AD) had decreased bilateral hippocampal and amygdalar volumes and entorhinal cortex thickness compared to HC (p<0.001). MCI-Converters also showed significant reducti-ons relative to MCI-Stable participants, including reduced bilateral hippocampal volumes (p<0.001), bilateral amygda-lar volumes (p<0.001 left, p=0.01 right), and thinner bilateral entorhinal cortex (p=0.006 left, p<0.001 right). AD partici-pants had significant reductions in bilateral hippocampal and amygdalar volumes and entorhinal cortex thickness relative to MCI-Stable participants (p<0.001). However, MCI-Converters and AD participants showed no significant diffe-rences in any MTL measures (hippocampal and amygdalar volume or entorhinal cortex thickness).
Mean cortical thickness values from lateral temporal cor-tices were also significantly different across groups (Fig. 5, p<0.001). Similar to other ROI and VOI comparisons, HC participants had significantly greater bilateral inferior (Fig. 5a), middle (Fig. 5b) and superior (Fig. 5c) temporal gyrus cortical thickness relative to all other groups in pairwise comparisons (p<0.001). MCI-Converters had significant
cortical thinning bilaterally relative to MCI-Stable partici-pants in the inferior (p<0.001), middle (p<0.001 left, p=0.001 right), and superior (p=0.003 left, p=0.002 right) temporal gyri. AD participants also had significantly thinner bilateral inferior, middle, and superior temporal gyri relative to MCI-Stable participants (p<0.001). MCI-Converters and AD participants showed no temporal gyrus cortical thickness differences.
Parietal lobe cortical thickness values also showed signi-ficant differences across all groups, specifically in the inferi-or parietal gyrus (Fig. 6a, p<0.001) and precuneus (Fig. 6b, p<0.001). Pairwise comparisons showed similar patterns as those of other imaging biomarkers. HC participants had significantly greater cortical thickness in bilateral inferior parietal gyrus and precuneus relative to all other groups (p<0.001). AD participants had significantly reduced cortical thickness in bilateral inferior parietal and precuneus regions relative to MCI-Stable participants (p<0.001), as did MCI-Converters (inferior parietal gyrus p=0.006 left, p=0.009
Fig. (4). Extracted GM density, volume, and cortical thickness values from medial temporal lobe structures.
Comparisons of GM density values (A) were extracted from the unmodulated VBM GM maps using standard left and right hippocampal
ROIs traced on an independent sample of 40 HC participants [25, 58]. Bilateral hippocampal (B) and amygdalar (C) volume estimates and
entorhinal cortex thickness values (D) were extracted using automated parcellation. The comparisons of all four MRI metrics show a signifi-
cant difference (p<0.001) across all groups. In pairwise comparisons, hippocampal GM density, hippocampal and amygdala volumes, and
entorhinal cortex thickness show significant differences between HC and all clinical groups (p<0.001) bilaterally and MCI-Stable and AD
groups (p<0.001) bilaterally. Furthermore, MCI-Stable and MCI-Converter groups show significant differences in GM density and volume in
the left (GM (A), p=0.001; volume (B), p<0.001) and right (GM (A), p=0.034; volume (B), p<0.001) hippocampi, as well as significant
differences in amygdala volume on both the left (p<0.001) and right (p=0.01). MCI-Converters also showed significantly thinner entorhinal
cortices than MCI-Stable participants on both the left (p=0.006) and right (p<0.001). No significant differences were found in hippocampal
GM density, hippocampal or amygdalar volumes, or entorhinal cortex thickness values between MCI-Converter and AD groups. Age,
gender, years of education, handedness, and ICV were included as covariates in all comparisons.

MRI Predictors of MCI to AD Conversion Current Alzheimer Research, 2009, Vol. 6, No. 4 355
Fig. (5). Cortical thickness values from the temporal lobe extracted using automated parcellation.
Comparisons between cortical thickness values from three regions of the temporal lobe, including inferior (A), middle (B), and superior (C)
temporal gyri, demonstrated significant differences (p<0.001) across all groups. Pairwise comparisons demonstrated significant differences in
cortical thickness values for all temporal gyri bilaterally between HC and all other groups (p<0.001), as well as between the MCI-Stable and
AD groups (p<0.001). The MCI-Converter and MCI-Stable groups also showed significant differences in cortical thickness in bilateral inferi-
or temporal gyri (p<0.001), left (p<0.001) and right (p=0.001) middle temporal gyri, and left (p=0.003) and right (p=0.002) superior temporal
gyri. Cortical thickness values from bilateral inferior, middle, and superior temporal gyri were not significantly different between the MCI-
Converter and AD groups. Age, gender, years of education, handedness, and ICV were included as covariates in all comparisons.
Fig. (6). Parietal cortical thickness values extracted using automated parcellation.
Cortical thickness values from the inferior parietal gyrus (A) and precuneus (B) showed significant differences between groups (p<0.001).
Pairwise comparisons showed significant differences in bilateral inferior parietal gyrus and precuneus between HC and all clinical groups
(p<0.001), as well as between the MCI-Stable and AD groups (p<0.001). The MCI-Stable and MCI-Converter groups were significantly
different in the left (p=0.006) and right (p=0.009) inferior parietal gyri and left (p=0.012) and right (p=0.013) precuneus. No significant
difference was found between MCI-Converter and AD groups in either region. Age, gender, years of education, handedness and ICV were
included as covariates in all comparisons.
right; precuneus p=0.012 left, p=0.013 right). MCI-Converters and AD participants showed no significant differences in either inferior parietal gyrus or precuneus cortical thickness values.
Effect Sizes of Imaging Biomarkers
Imaging biomarkers extracted from both VBM GM maps and automated parcellation compared between MCI-

356 Current Alzheimer Research, 2009, Vol. 6, No. 4 Risacher et al.
Converters and MCI-Stable participants demonstrated large effect sizes in MTL structures, as well as in temporal and parietal lobar regions (Fig. 7). Bilateral mean hippocampal volume was found to have the highest effect size, with a Cohen’s d of 0.603. Cortical thickness values from the inferior and middle temporal gyri, as well as the entorhinal cortex, also showed strong effect sizes, with Cohen’s d values of 0.535, 0.529, and 0.493, respectively. Amygdalar volume (Cohen’s d=0.478), superior temporal cortical thickness (Cohen’s d=0.448), inferior parietal cortical thickness (Cohen’s d=0.417), precuneus cortical thickness (Cohen’s d=0.408), and hippocampal GM density (Cohen’s d=0.408) also showed high effect sizes. For illustrative purposes, imaging metrics with the 20 largest effect sizes are shown in Fig. (7).
DISCUSSION
We examined baseline 1.5T T1-weighted MRI scans from 693 participants in the ADNI cohort to (1) characterize initial differences between the AD, MCI, and HC groups and (2) detect anatomic features associated with imminent con-version from MCI to probable AD within one year (MCI-Converters). We hypothesized that cross-sectional baseline differences would be consistent with the well-established progression from MTL structures to neocortical involve-ment, and that those individuals with MCI who are about to convert to AD will appear more similar to AD prior to conversion than those MCI patients who remain stable for at
least one additional year. Publically available and widely used semi-automated image analysis methodologies (VBM in SPM5, automated parcellation in FreeSurfer) were employed to assess these hypotheses.
Several key conclusions can be drawn from the obtained results. First, the overall pattern of structural MRI changes in MCI and AD patients observed at baseline in the ADNI co-hort is similar to prior findings in other, typically smaller and less intensively characterized samples [11-17, 19, 21, 25-36, 38-40, 43-46, 52, 53, 57, 73]. Second, MCI-Converters are distinguishable from individuals with MCI who will not show significant clinical progression over the next year (MCI-Stable). Third, MCI-Converters show significantly greater global and MTL-specific atrophy than MCI-Stable participants, a pattern previously reported in earlier studies with smaller samples [12, 13, 15, 18, 20, 22, 23, 31-36, 40-45, 74, 75]. Fourth, MCI-Converters show a neuroimaging profile more similar to that seen in the AD group than that of the MCI-Stable group. The MCI-Converter group demonstrated a pattern of atrophic changes nearly equivalent to those of the AD group up to a year before meeting clinical criteria for probable AD. Finally, a comparison of effect sizes for contrasts between the MCI-Converter and MCI-Stable groups on MRI metrics indicated that degree of neu-rodegeneration of MTL structures is the best antecedent MRI marker of imminent conversion, with decreased hippocampal volume (left more than right) being the most robust struc-tural MRI feature.
Fig. (7). Effect sizes of the comparison between MCI-Stable and MCI-Converter groups evaluated for selected imaging biomarkers.
GM density, volume, and cortical thickness were extracted using VBM and automated parcellation and compared between sub-groups based
on MCI to AD conversion status after one year. Effect sizes (Cohen’s d) of comparisons between MCI-Stable and MCI-Converter groups
showed that imaging biomarkers from the temporal lobe, including hippocampal and amygdalar volume and cortical thickness values from
the entorhinal cortex and inferior, middle, and superior temporal gyri, provided the greatest statistical difference. Age, gender, handedness,
education, and ICV were included as covariates and adjusted bilateral means were used to calculate effect size.

MRI Predictors of MCI to AD Conversion Current Alzheimer Research, 2009, Vol. 6, No. 4 357
There are several aspects to these results and analyses that warrant comment. This report is among the first, in the fully enrolled ADNI cohort, to assess group differences between AD, MCI, and controls at baseline, as well as to examine antecedent imaging predictors of future change in clinical status (i.e., conversion to probable AD, in patients with amnestic MCI). Our comparisons of the three baseline diagnostic groups using VBM are similar to previous reports using alternative methods to compare global atrophy between AD, MCI, and HC participants in the ADNI cohort [76-78]. One recent study from Hua et al. [77] found signi-ficant MTL atrophy in both AD and MCI subjects in the ADNI cohort using tensor-based morphometry (TBM), simi-lar to our results using VBM. Furthermore, our results using the one year MCI to AD converter population from the ADNI cohort provided congruent results with those of Hua et al., in which temporal lobe atrophy as assessed using TBM correlated with MCI to AD conversion in a subset of the ADNI MCI-Converters (n=40) [77]. A recent study using another imaging analysis technique (RAVENS) also found a similar pattern of distinctive atrophy in MCI-Converters re-lative to MCI-Stable participants in a sub-sample (27 MCI-Converter, 76 MCI-Stable) of the ADNI cohort, which could be used to predict MCI to AD conversion using a pattern classification technique [78]. In the present study, we were able to substantially extend the results of earlier partial cohort analyses by including the largest possible set of ADNI participants with usable data, since one year outcomes were only recently completed. Further, our multi-method approach included VBM-based analyses of GM density and volume and FreeSurfer-derived ROI analyses of volume and cortical thickness, which together provide a more detailed picture of anatomical differences between groups.
Studies employing VBM methods differ with regard to including a volume conserving step referred to as “modulati-on” [8-10]. Briefly, unmodulated GM maps are typically interpreted as indicating differences in GM density or concentration. By contrast, VBM performed on modulated GM maps are interpreted as local GM volume estimates. At present there is no strong consensus in the literature regar-ding which approach is more appropriate for a given applica-tion. Furthermore, the pathophysiological significance of differences detected by one method versus the other has not been conclusively determined. Our primary VBM analyses were performed without modulation. We then repeated the analyses with the modulation step for comparison, and found highly similar patterns of GM differences between groups (Figs. 2 & 3, modulated data not shown). Specifically, the overall pattern of GM reduction for all patient groups (AD, MCI-Converters, MCI-Stable) compared to HC participants remained significant using both VBM methods, with the greatest differences remaining in bilateral MTL. Similarly, the pattern for MCI-Converters relative to the MCI-Stable participants was largely unaffected by analytic methodology. Analysis of GM values extracted from left, right and combi-ned hippocampal ROIs defined in an independent cohort of healthy older adult controls [25, 58] showed similar group differences, and the effect size for MCI-Converters versus MCI-Stable participants was nearly identical (Figs. 4 & 7, modulated data not shown). Overall, inclusion of a volume conserving modulation step in the VBM analyses had little
influence on the pattern or magnitude of group differences. This may in part be related to our inclusion of intracranial volume as a covariate in all analyses. To eliminate the possi-bility of bias due to markedly unequal group sizes when comparing MCI-Converters and MCI-Stable participants, we repeated the main VBM analyses on four matched groups of equal size. Despite slightly attenuated power to detect group differences, the additional matched group analyses did not alter the overall pattern of results (data not shown).
The second major approach to assessing morphological changes in AD, MCI and controls entailed examining Free-Surfer parcellation derived ROIs, selected on the basis of their status as important regions for AD pathology. Group differences were evaluated for left, right and combined hippocampal volume and GM density, additional MTL ROIs, and regional cortical thickness estimates. Significant differences between groups were found in hippocampal, a-mygdalar, and other MTL regions, as well as widespread neocortical regions. These results are consistent with prior ROI and VOI studies in AD and MCI, in which hippocampal volumes [17, 25, 31-36, 38-40, 44, 48, 52, 53, 79], hippo-campal GM density [19, 24, 25], and other regions [19, 31-35, 38, 39, 43-47, 50, 51, 74, 75], were found to be signifi-cantly decreased relative to HC. As in our VBM results, ROI measures indicated that participants who convert from MCI to AD within one year show significant atrophy relative to MCI participants who remain clinically stable, and also have a generally equivalent degree of atrophy to AD participants. Decreased hippocampal GM density and volume, amygdalar volume, and cortical thickness in entorhinal cortex, inferior, middle, and superior temporal gyri, inferior parietal gyrus, and precuneus reflect the antecedent structural characteristics of MCI-Converters compared to individuals with MCI who remained clinically stable for at least a year. Similar to the global atrophy detected using VBM, local measures of volume and cortical thickness detected significant degenera-tion in MCI-Converters up to one year prior to the point at which they meet clinical criteria for an AD diagnosis, suggesting an accelerated rate of neuropathological changes in these individuals which is not well captured by the MCI diagnosis alone. Furthermore, these results, obtained from the largest group assessment of one year conversion from MCI to AD to date, extend the findings of previous smaller studies which have reported local atrophy in MCI to AD converters using measures of hippocampal, amygdalar, entorhinal cortex, and other MTL volume estimates [12, 13, 15, 18, 20, 23, 31-34, 36, 37, 40, 42-45, 50, 74, 75, 80].
Taken together, the present findings support the use of structural MRI as a biomarker for assessing prodromal and early AD related changes. An important implication of the analyses performed in this report is that although many regions and measurements are sensitive to early AD patholo-gy, MRI markers have differential sensitivities for detection of those individuals who are at greatest risk of short-term progression to probable AD. The MRI measures with the largest effect sizes (far left, Fig. 7) for MCI-Converters ver-sus MCI-Stable contrasts appear to be important biomarker candidates for prediction of MCI to AD conversion. Previous studies have investigated the use of MTL density and volu-me in the prediction of MCI to AD conversion, with some reports finding significantly greater sensitivity and speci-

358 Current Alzheimer Research, 2009, Vol. 6, No. 4 Risacher et al.
ficity achieved by adding imaging biomarkers to clinical test prediction algorithms, while others suggested minimal utility of including additional imaging variables [31-34, 37, 42-45, 47, 48, 51, 74, 75, 79, 81]. However, the majority of these studies included modest participant pools and manually drawn ROIs. The time-consuming nature of manual ROI tracing limits the utility of these endpoints as biomarkers in studies with large numbers of participants, as well as in rou-tine clinical settings. Automated or semi-automated extracti-on of volume and cortical thickness values from ROIs in the MTL requires minimal manual intervention. The largely au-tomated nature and wide availability and use of this and other methods (e.g., [53, 82]) in assessing local and global atrophy will facilitate incorporation of these measures as key variables in pharmacological efficacy and neuroprotection trials.
A limitation of the present report is the inclusion of only baseline scans in characterizing anatomic changes. Additio-nal information, including changes in imaging measures over time and rate of atrophy, has been shown to be useful in assessing and accurately predicting rapid conversion [41, 42]. As a cross-sectional assessment of structural neuroima-ging measures, the present study does not capture the dyna-mic processes associated with MCI to AD conversion. Futu-re studies assessing multiple timepoints, including two and three year MCI to AD conversion patterns, will be needed to determine the diagnostic and predictive value of dynamic measures of global and local atrophy. Furthermore, the cur-rent participant pool includes 182 participants diagnosed with MCI at baseline who were on AD-indicated medicati-ons during the first year of the study. Pharmacological treat-ments, such as AChE inhibitors and memantine, have been shown to reduce or delay MCI to AD conversion [83-87]. The impact of medications was not assessed in the current study. Future studies should focus on including this variable in predicting and assessing conversion from MCI to AD. Another limitation of this report is the inclusion of only structural imaging. It is possible that FDG PET, obtained on approximately half of the ADNI cohort, could enhance the detection and characterization of antecedent changes alone or in combination with MRI and other measures. Targeted mo-lecular PET imaging for amyloid deposition with [11C]PiB is also being investigated in a smaller add-on study in the ADNI cohort [88]. Future studies will undoubtedly clarify the contribution of FDG and PiB PET to understanding early changes and predicting clinical trajectory. Finally, the role of genetic factors was only considered to a limited degree in the present study by controlling for APOE genotype where appropriate. A genome wide association study employing a high density microarray with over 620,000 single nucleotide polymorphisms is underway by the ADNI Genetics Working Group and these forthcoming results will permit inclusion of data on individual differences in important biological pathways in predictive models.
In summary, a major goal of ADNI is to identify imaging biomarkers that could be used for early detection and predic-tion of longitudinal changes in MCI and AD. Two semi-automated, widely used and publically available image ana-lysis methods (VBM, automated parcellation) revealed signi-ficant global and local atrophy in AD and MCI patients in a large cohort from the ADNI sample at baseline relative to
HC. These techniques were also successful at detecting dif-ferences at baseline between participants who would convert from MCI to AD within one year and those who would remain stable with an MCI diagnosis for at least one year. The results of these analyses suggest that VBM and automa-ted parcellation are useful tools for characterization of atrophy in MCI and AD and prediction of disease course. Employed with repeated scans for longitudinal monitoring of brain degeneration, these methods will be useful for clinical trials in MCI and AD. With further refinement, MRI coupled with advanced image analysis approaches appears to have potential for individualized prediction of risk of progression and enhancement of clinical trials by including those at grea-test risk of conversion.
FUNDING
Data collection and sharing was funded by the Alzhei-mer’s Disease Neuroimaging Initiative (ADNI; Principal Investigator: Michael Weiner; NIH grant U01 AG024904). ADNI is funded by the National Institute on Aging (NIA), the National Institute of Biomedical Imaging and Bio-engineering (NIBIB), and through generous contribution from the following: Pfizer Inc., Wyeth Research, Bristol-Myers Squibb, Eli Lilly and Company, GlaxoSmithKline, Merck & Co. Inc., AstraZeneca AB, Novartis Pharma-ceuticals Corporation, the Alzheimer’s Association, Eisai Global Clinical Development, Elan Corporation plc, Forest Laboratories, and the Institute for the Study of Aging, with parti-cipation by the U.S. Food and Drug Administration. Industry partnerships are coordinated through the Foundation for the National Institutes of Health. The grantee organizati-on is the Northern California Institute for Research and Edu-cation, and the study is coordinated by the Alzheimer’s Disease Cooperative Study at the University of California, San Diego. ADNI data are disseminated by the Laboratory of Neuro Imaging at the University of California, Los Angeles.
Data analysis was supported in part by the following grants from the National Institutes of Health: NIA R01 AG19771 to AJS and P30 AG10133 to Bernardino Ghetti, MD and NIBIB R03 EB008674 to LS, and by the Indiana Economic Development Corporation (IEDC #87884 to AJS).
ACKNOWLEDGEMENTS
The authors thank Aaron Cannon of Brigham Young University, Sungeun Kim, PhD of Indiana University School of Medicine, Nick Schmansky, MA, MSc and Bruce Fischl, PhD of Harvard Medical School, and Randy Heiland, MA, MS of Indiana University for their help. We also thank Ber-nardino Ghetti, MD, Guest Editor and organizer of the Indiana ADC MCI Symposium in which initial results were presented.
ABBREVIATIONS
MRI = Magnetic resonance imaging
ADNI = Alzheimer’s Disease Neuroimaging Initia-tive
AD = Alzheimer’s Disease
MCI = Mild Cognitive Impairment
MRI Predictors of MCI to AD Conversion Current Alzheimer Research, 2009, Vol. 6, No. 4 359
HC = Healthy elderly controls
MTL = medial temporal lobe
GM = Grey matter
MP-RAGE = Magnetization prepared rapid acquisition gradient echo
SPM = Statistical parametric mapping
VBM = Voxel-based morphometry
ROI = Region of interest
VOI = Volume of interest
FDR = False discovery rate
ApoE = Apolipoprotein E
REFERENCES
[1] Ferri CP, Prince M, Brayne C, Brodaty H, Fratiglioni L, Ganguli M, et al. Global prevalence of dementia: a delphi consensus study.
Lancet 366: 2112-2117 (2005). [2] Wimo A, Winblad B, Aguero-Torres H and von Strauss E. The
magnitude of dementia occurrence in the world. Alzheimer Dis Assoc Disord 17: 63-67 (2003).
[3] Petersen RC. Mild cognitive impairment as a diagnostic entity. J Intern Med 256: 183-194 (2004).
[4] Petersen RC, Smith GE, Waring SC, Ivnik RJ, Tangalos EG and Kokmen E. Mild cognitive impairment: clinical characterization
and outcome. Arch Neurol 56: 303-308 (1999). [5] Jack CR, Jr., Bernstein MA, Fox NC, Thompson P, Alexander G,
Harvey D, et al. The Alzheimer's disease neuroimaging initiative (ADNI): MRI methods. J Magn Reson Imaging 27: 685-691
(2008). [6] Mueller SG, Weiner MW, Thal LJ, Petersen RC, Jack C, Jagust W,
et al. The Alzheimer's disease neuroimaging initiative. Neuroima-ging Clin N Am 15: 869-877, xi-xii (2005).
[7] Mueller SG, Weiner MW, Thal LJ, Petersen RC, Jack CR, Jagust W, et al. Ways toward an early diagnosis in Alzheimer's disease:
The Alzheimer's disease neuroimaging initiative (ADNI). Alzhei-mers Dement 1: 55-66 (2005).
[8] Ashburner J and Friston KJ. Voxel-based morphometry--the methods. Neuroimage 11: 805-821 (2000).
[9] Good CD, Johnsrude IS, Ashburner J, Henson RN, Friston KJ and Frackowiak RS. A voxel-based morphometric study of ageing in
465 normal adult human brains. Neuroimage 14: 21-36 (2001). [10] Mechelli A, Price CJ, Friston KJ and Ashburner J. Voxel-based
morphometry of the human brain: methods and applications. Curr Med Imaging Rev I: 1-9 (2005).
[11] Baron JC, Chetelat G, Desgranges B, Perchey G, Landeau B, de la Sayette V, et al. In vivo mapping of gray matter loss with voxel-
based morphometry in mild Alzheimer's disease. Neuroimage 14: 298-309 (2001).
[12] Bozzali M, Filippi M, Magnani G, Cercignani M, Franceschi M, Schiatti E, et al. The contribution of voxel-based morphometry in
staging patients with mild cognitive impairment. Neurology 67: 453-460 (2006).
[13] Chetelat G, Landeau B, Eustache F, Mezenge F, Viader F, de la Sayette V, et al. Using voxel-based morphometry to map the struc-
tural changes associated with rapid conversion in MCI: a longitudi-nal MRI study. Neuroimage 27: 934-946 (2005).
[14] Hamalainen A, Grau-Olivares M, Tervo S, Niskanen E, Pennanen C, Huuskonen J, et al. Apolipoprotein E epsilon4 allele is associa-
ted with increased atrophy in progressive mild cognitive impair-ment: a voxel-based morphometric study. Neurodegener Dis 5:
186-189 (2008). [15] Hamalainen A, Tervo S, Grau-Olivares M, Niskanen E, Pennanen
C, Huuskonen J, et al. Voxel-based morphometry to detect brain atrophy in progressive mild cognitive impairment. Neuroimage 37:
1122-1131 (2007). [16] Hirata Y, Matsuda H, Nemoto K, Ohnishi T, Hirao K, Yamashita
F, et al. Voxel-based morphometry to discriminate early Alzhei-mer's disease from controls. Neurosci Lett 382: 269-274 (2005).
[17] Jack CR, Jr., Lowe VJ, Senjem ML, Weigand SD, Kemp BJ,
Shiung MM, et al. 11C PiB and structural MRI provide comple-mentary information in imaging of Alzheimer's disease and am-
nestic mild cognitive impairment. Brain 131: 665-680 (2008). [18] Karas G, Sluimer J, Goekoop R, van der Flier W, Rombouts
SARB, Vrenken H, et al. Amnestic mild cognitive impairment: structural MR imaging findings predictive of conversion to Alz-
heimer disease. Ajnr: Am J Neuroradiol 29: 944-949 (2008). [19] Karas GB, Scheltens P, Rombouts SA, Visser PJ, van Schijndel
RA, Fox NC, et al. Global and local gray matter loss in mild cogni-tive impairment and Alzheimer's disease. Neuroimage 23: 708-716
(2004). [20] Kinkingnehun S, Sarazin M, Lehericy S, Guichart-Gomez E,
Hergueta T and Dubois B. VBM anticipates the rate of progression of Alzheimer disease: a 3-year longitudinal study. Neurology 70:
2201-2211 (2008). [21] Pennanen C, Testa C, Laakso MP, Hallikainen M, Helkala EL,
Hanninen T, et al. A voxel based morphometry study on mild cognitive impairment. J Neurol, Neurosurg Psychiatry 76: 11-14
(2005). [22] Whitwell JL, Przybelski SA, Weigand SD, Knopman DS, Boeve
BF, Petersen RC, et al. 3D maps from multiple MRI illustrate changing atrophy patterns as subjects progress from mild cognitive
impairment to Alzheimer's disease. Brain 130: 1777-1786 (2007). [23] Whitwell JL, Shiung MM, Przybelski SA, Weigand SD, Knopman
DS, Boeve BF, et al. MRI patterns of atrophy associated with pro-gression to AD in amnestic mild cognitive impairment. Neurology
70: 512-520 (2008). [24] Trivedi MA, Wichmann AK, Torgerson BM, Ward MA, Schmitz
TW, Ries ML, et al. Structural MRI discriminates individuals with mild cognitive impairment from age-matched controls: a combined
neuropsychological and voxel based morphometry study. Alzheimers Dement 2: 296-302 (2006).
[25] Saykin AJ, Wishart HA, Rabin LA, Santulli RB, Flashman LA, West JD, et al. Older adults with cognitive complaints show brain
atrophy similar to that of amnestic MCI. Neurology 67: 834-842 (2006).
[26] Frisoni GB, Testa C, Zorzan A, Sabattoli F, Beltramello A, Soininen H, et al. Detection of grey matter loss in mild Alzheimer's
disease with voxel based morphometry. J Neurol Neurosurg Psychiatry 73: 657-664 (2002).
[27] Busatto GF, Garrido GE, Almeida OP, Castro CC, Camargo CH, Cid CG, et al. A voxel-based morphometry study of temporal lobe
gray matter reductions in Alzheimer's disease. Neurobiol Aging 24: 221-231 (2003).
[28] Good CD, Scahill RI, Fox NC, Ashburner J, Friston KJ, Chan D, et al. Automatic differentiation of anatomical patterns in the human
brain: validation with studies of degenerative dementias. Neuro-image 17: 29-46 (2002).
[29] Grossman M, McMillan C, Moore P, Ding L, Glosser G, Work M, et al. What's in a name: voxel-based morphometric analyses of
MRI and naming difficulty in Alzheimer's disease, frontotemporal dementia and corticobasal degeneration. Brain 127: 628-649
(2004). [30] Karas GB, Burton EJ, Rombouts SA, van Schijndel RA, O'Brien
JT, Scheltens P, et al. A comprehensive study of gray matter loss in patients with Alzheimer's disease using optimized voxel-based
morphometry. Neuroimage 18: 895-907 (2003). [31] de Leon MJ, DeSanti S, Zinkowski R, Mehta PD, Pratico D, Segal
S, et al. MRI and CSF studies in the early diagnosis of Alzheimer's disease. J Intern Med 256: 205-223 (2004).
[32] de Leon MJ, Mosconi L, Blennow K, DeSanti S, Zinkowski R, Mehta PD, et al. Imaging and CSF studies in the preclinical dia-
gnosis of Alzheimer's disease. Anne NY Acad Sci 1097: 114-145 (2007).
[33] Devanand DP, Pradhaban G, Liu X, Khandji A, De Santi S, Segal S, et al. Hippocampal and entorhinal atrophy in mild cognitive im-
pairment: prediction of Alzheimer disease. Neurology 68: 828-836 (2007).
[34] Devanand DP, Liu X, Tabert MH, Pradhaban G, Cuasay K, Bell K, et al. Combining early markers strongly predicts conversion from
mild cognitive impairment to Alzheimer's disease. Biol Psychiatry 64: 871-9 (2008).
[35] Dickerson BC, Goncharova I, Sullivan MP, Forchetti C, Wilson RS, Bennett DA, et al. MRI-derived entorhinal and hippocampal

360 Current Alzheimer Research, 2009, Vol. 6, No. 4 Risacher et al.
atrophy in incipient and very mild Alzheimer's disease. Neurobiol
Aging 22: 747-754 (2001). [36] Eckerstrom C, Olsson E, Borga M, Ekholm S, Ribbelin S, Rolstad
S, et al. Small baseline volume of left hippocampus is associated with subsequent conversion of MCI into dementia: the Goteborg
MCI study. J Neurol Sci 272: 48-59 (2008). [37] Fleisher AS, Sun S, Taylor C, Ward CP, Gamst AC, Petersen RC,
et al. Volumetric MRI vs clinical predictors of Alzheimer disease in mild cognitive impairment. Neurology 70: 191-199 (2008).
[38] Jack CR, Jr., Petersen RC, Xu YC, Waring SC, O'Brien PC, Tanga-los EG, et al. Medial temporal atrophy on MRI in normal aging and
very mild Alzheimer's disease. Neurology 49: 786-794 (1997). [39] Jack CR, Jr., Petersen RC, Xu Y, O'Brien PC, Smith GE, Ivnik RJ,
et al. Rate of medial temporal lobe atrophy in typical aging and Alzheimer's disease. Neurology 51: 993-999 (1998).
[40] Jack CR, Jr., Petersen RC, Xu Y, O'Brien PC, Smith GE, Ivnik RJ, et al. Rates of hippocampal atrophy correlate with change in clini-
cal status in aging and AD. Neurology 55: 484-489 (2000). [41] Jack CR, Jr., Shiung MM, Gunter JL, O'Brien PC, Weigand SD,
Knopman DS, et al. Comparison of different MRI brain atrophy ra-te measures with clinical disease progression in AD. Neurology 62:
591-600 (2004). [42] Jack CR, Jr., Shiung MM, Weigand SD, O'Brien PC, Gunter JL,
Boeve BF, et al. Brain atrophy rates predict subsequent clinical conversion in normal elderly and amnestic MCI. Neurology 65:
1227-1231 (2005). [43] Killiany RJ, Gomez-Isla T, Moss M, Kikinis R, Sandor T, Jolesz F,
et al. Use of structural magnetic resonance imaging to predict who will get Alzheimer's disease. Ann Neurol 47: 430-439 (2000).
[44] Modrego PJ. Predictors of conversion to dementia of probable Alzheimer type in patients with mild cognitive impairment. Current
Alzheimer Res 3: 161-170 (2006). [45] Stoub TR, Bulgakova M, Leurgans S, Bennett DA, Fleischman D,
Turner DA, et al. MRI predictors of risk of incident Alzheimer di-sease: a longitudinal study. Neurology 64: 1520-1524 (2005).
[46] Tanna NK, Kohn MI, Horwich DN, Jolles PR, Zimmerman RA, Alves WM, et al. Analysis of brain and cerebrospinal fluid volumes
with MR imaging: impact on PET data correction for atrophy. Part II. Aging and Alzheimer dementia. Radiology 178: 123-130
(1991). [47] Bouwman FH, Schoonenboom SNM, van der Flier WM, van Elk
EJ, Kok A, Barkhof F, et al. CSF biomarkers and medial temporal lobe atrophy predict dementia in mild cognitive impairment. Neu-
robiol Aging 28: 1070-1074 (2007). [48] Jack CR, Jr., Petersen RC, Xu YC, O'Brien PC, Smith GE, Ivnik
RJ, et al. Prediction of AD with MRI-based hippocampal volume in mild cognitive impairment. Neurology 52: 1397-1403 (1999).
[49] Jack CR, Jr., Slomkowski M, Gracon S, Hoover TM, Felmlee JP, Stewart K, et al. MRI as a biomarker of disease progression in a
therapeutic trial of milameline for AD. Neurology 60: 253-260 (2003).
[50] Korf ESC, Wahlund L-O, Visser PJ and Scheltens P. Medial tem-poral lobe atrophy on MRI predicts dementia in patients with mild
cognitive impairment. Neurology 63: 94-100 (2004). [51] Visser PJ, Verhey FR, Hofman PA, Scheltens P and Jolles J. Medi-
al temporal lobe atrophy predicts Alzheimer's disease in patients with minor cognitive impairment. J Neurol Neurosurg Psychiatry
72: 491-497 (2002). [52] Wang PN, Lirng JF, Lin KN, Chang FC and Liu HC. Prediction of
Alzheimer's disease in mild cognitive impairment: a prospective study in Taiwan. Neurobiol Aging 27: 1797-1806 (2006).
[53] Colliot O, Chetelat G, Chupin M, Desgranges B, Magnin B, Benali H, et al. Discrimination between Alzheimer disease, mild cognitive
impairment, and normal aging by using automated segmentation of the hippocampus. Radiology 248: 194-201 (2008).
[54] Khan AR, Wang L and Beg MF. FreeSurfer-initiated fully-automated subcortical brain segmentation in MRI using Large
deformation diffeomorphic metric mapping. Neuroimage 41: 735-746 (2008).
[55] Klauschen F, Angermann BR and Meier-Schellersheim M. Understanding diseases by mouse click: the promise and potential
of computational approaches in Systems Biology. Clin Exp Immu-nol 149: 424-429 (2007).
[56] Fischl B and Dale AM. Measuring the thickness of the human cerebral cortex from magnetic resonance images. Proc Natl Acad
Sci USA 97: 11050-11055 (2000).
[57] Du AT, Schuff N, Kramer JH, Rosen HJ, Gorno-Tempini ML,
Rankin K, et al. Different regional patterns of cortical thinning in Alzheimer's disease and frontotemporal dementia. Brain 130: 1159-
1166 (2007). [58] McHugh TL, Saykin AJ, Wishart HA, Flashman LA, Cleavinger
HB, Rabin LA, et al. Hippocampal volume and shape analysis in an older adult population. Clin Neuropsychol 21: 130-145 (2007).
[59] Dale A, Fischl B and Sereno M. Cortical surface-based analysis. I. Segmentation and surface reconstruction. Neuroimage 9: 179-194
(1999). [60] Fischl B, Sereno M and Dale A. Cortical surface-based analysis. II:
Inflation, flattening, and a surface-based coordinate system. Neuro-image 9: 195-207 (1999).
[61] Fischl B, Salat DH, Busa E, Albert M, Dieterich M, Haselgrove C, et al. Whole brain segmentation: automated labeling of neuroana-
tomical structures in the human brain. Neuron 33: 341-355 (2002). [62] Shen L, Saykin AJ, Firpi HA, West JD, McHugh TL, Wishart HA,
et al. Comparison of manual and automated determination of hip-pocampal volumes in MCI and older adults with cognitive
complaints. Alzheimer's Dement 4: T29-30 (2008). [63] Sheikh JI and Yesavage JA. Geriatric depression Scale (GDS):
Recent evidence and development of a shorter version. In: Clinical Gerontology: A Guide to Assessment and Intervention. The
Haworth Press, New York, p. 165-173 (1986). [64] Kaufer DI, Cummings JL, Ketchel P, Smith V, MacMillan A,
Shelley T, et al. Validation of the NPI-Q, a brief clinical form of the Neuropsychiatric Inventory. J Neuropsychiatry Clin Neurosci
12: 233-239 (2000). [65] Rosen WG, Terry RD, Fuld PA, Katzman R and Peck A. Patholo-
gical verification of ischemic score in differentiation of dementias. Ann Neurol 7: 486-488 (1980).
[66] Cockrell JR and Folstein MF. Mini-mental state examination (MMSE). Psychopharmacol Bull 24: 689-692 (1988).
[67] Folstein MF, Folstein SE and McHugh PR. "Mini-mental state". A practical method for grading the cognitive state of patients for the
clinician. J Psychiatr Res 12: 189-198 (1975). [68] Morris JC. The clinical dementia rating (CDR): current version and
scoring rules. Neurology 43: 2412-2414 (1993). [69] Pfeffer RI, Kurosaki TT, Harrah CH, Jr., Chance JM and Filos S.
Measurement of functional activities in older adults in the commu-nity. J Gerontol 37: 323-329 (1982).
[70] Rey A. 'L'examen clinique en psychologie'. Presses Universitaires de France, Paris, (1964).
[71] Kaplan E, Goodglass H and Weintraub S. 'The Boston Naming Test'. Lea and Febiger, Philadelphia, (1983).
[72] Morris JC, Heyman A, Mohs RC, Hughes JP, van Belle G, Fillen-baum G, et al. The consortium to establish a registry for Alzhei-
mer's disease (CERAD). Part I. clinical and neuropsychological assessment of Alzheimer's disease. Neurology 39: 1159-1165
(1989). [73] Apostolova LG, Dinov ID, Dutton RA, Hayashi KM, Toga AW,
Cummings JL, et al. 3D comparison of hippocampal atrophy in amnestic mild cognitive impairment and Alzheimer's disease. Brain
129: 2867-2873 (2006). [74] deToledo-Morrell L, Stoub TR, Bulgakova M, Wilson RS, Bennett
DA, Leurgans S, et al. MRI-derived entorhinal volume is a good predictor of conversion from MCI to AD. Neurobiol Aging 25:
1197-1203 (2004). [75] Tapiola T, Pennanen C, Tapiola M, Tervo S, Kivipelto M, Hanni-
nen T, et al. MRI of hippocampus and entorhinal cortex in mild cognitive impairment: a follow-up study. Neurobiol Aging 29: 31-
38 (2008). [76] Fan Y, Batmanghelich N, Clark CM and Davatzikos C. Spatial
patterns of brain atrophy in MCI patients, identified via high-dimensional pattern classification, predict subsequent cognitive
decline. Neuroimage 39: 1731-1743 (2008). [77] Hua X, Leow AD, Parikshak N, Lee S, Chiang M-C, Toga AW,
et al. Tensor-based morphometry as a neuroimaging biomarker for Alzheimer's disease: an MRI study of 676 AD, MCI, and normal
subjects. Neuroimage 43: 458-469 (2008). [78] Misra C, Fan Y and Davatzikos C. Baseline and longitudinal pat-
terns of brain atrophy in MCI patients, and their use in prediction of short-term conversion to AD: Results from ADNI. Neuroimage
44: 1415-22 (2008). [79] Ridha BH, Anderson VM, Barnes J, Boyes RG, Price SL, Rossor
MN, et al. Volumetric MRI and cognitive measures in Alzheimer
MRI Predictors of MCI to AD Conversion Current Alzheimer Research, 2009, Vol. 6, No. 4 361
disease : comparison of markers of progression. J Neurol 255: 567-
574 (2008). [80] Apostolova LG, Dutton RA, Dinov ID, Hayashi KM, Toga AW,
Cummings JL, et al. Conversion of mild cognitive impairment to Alzheimer disease predicted by hippocampal atrophy maps. Arch
Neurol 63: 693-699 (2006). [81] Teipel SJ, Born C, Ewers M, Bokde ALW, Reiser MF, Moller H-J,
et al. Multivariate deformation-based analysis of brain atrophy to predict Alzheimer's disease in mild cognitive impairment. Neuro-
image 38: 13-24 (2007). [82] Morra JH, Tu Z, Apostolova LG, Green AE, Avedissian C, Madsen
SK, et al. Validation of a fully automated 3D hippocampal segmen-tation method using subjects with Alzheimer's disease mild cogni-
tive impairment, and elderly controls. Neuroimage 43: 59-68 (2008).
[83] Hansen RA, Gartlehner G, Webb AP, Morgan LC, Moore CG and Jonas DE. Efficacy and safety of donepezil, galantamine, and
rivastigmine for the treatment of Alzheimer's disease: a systematic review and meta-analysis. Clin Interv Aging 3: 211-225 (2008).
[84] Petersen RC, Thomas RG, Grundman M, Bennett D, Doody R,
Ferris S, et al. Vitamin E and donepezil for the treatment of mild cognitive impairment. N Engl J Med 352: 2379-2388 (2005).
[85] Sabbagh MN, Richardson S and Relkin N. Disease-modifying approaches to Alzheimer's disease: challenges and opportunities-
lessons from donepezil therapy. Alzheimers Dement 4: S109-118 (2008).
[86] Salloway S, Ferris S, Kluger A, Goldman R, Griesing T, Kumar D, et al. Efficacy of donepezil in mild cognitive impairment: a rando-
mized placebo-controlled trial. Neurology 63: 651-657 (2004). [87] Thal LJ, Ferris SH, Kirby L, Block GA, Lines CR, Yuen E, et al. A
randomized, double-blind, study of rofecoxib in patients with mild cognitive impairment. Neuropsychopharmacology 30: 1204-1215
(2005). [88] Mormino EC, Kluth JT, Madison CM, Rabinovici GD, Baker SL,
Miller BL, et al. Episodic memory loss is related to hippocampal-mediated -amyloid deposition in elderly subjects. Brain: (epub
November 28, 2008).
Received: December 22, 2008 Revised: December 22, 2008 Accepted: December 23, 2008