3.4 Noise and Vibration - State of California high-speed train project final eir/eis fresno to...
80
CALIFORNIA HIGH-SPEED TRAIN PROJECT FINAL EIR/EIS FRESNO TO BAKERSFIELD SECTION 3.4 NOISE AND VIBRATION Page 3.4-1 3.4 Noise and Vibration 3.4.1 Introduction This section describes the regulatory setting, affected environment, impacts, and mitigation measures for noise and vibration resulting from the project. Noise and vibration are key elements of the environmental impact analysis because their increases over existing levels near the California High-Speed Train (HST) project are a significant impact. The HST Program EIR/EIS documents identified project engineering and design elements to reduce or avoid potential noise and vibration impacts. During the period between the scoping meetings and preparation of this project EIR/EIS, the alternative analysis process identified those alignments and design options that would avoid or minimize potential impacts to noise- and vibration-sensitive receivers. One important noise and vibration design choice was for the HST System to use distributed power electric motor unit (EMU) train sets that will have lower noise emissions than locomotive-hauled electric train sets according to the Federal Railroad Administration (FRA) noise and vibration guidance manual (FRA 2005, 2012). The noise and vibration limits chosen for construction and operation of the HST System satisfy the federal guidelines of the FRA and Federal Transit Administration (FTA) for train and HST facility operations and Federal Highway Administration (FHWA) as defined for California application by the California Department of Transportation (Caltrans) for traffic noise. As discussed in Section 3.1.5 and the Executive Summary, the analysis in this chapter includes revisions based on design refinements and analytical refinements. Gray shading is used as a guide to help the reader navigate the revisions. 3.4.2 Laws, Regulations, and Orders Noise and vibration impacts from major transportation projects are important federal and state environmental concerns and review requirements. In order to aid in compliance with environmental regulations and guidelines related to noise and vibration, FRA and FTA have developed guidance for assessing noise and vibration impacts from major rail projects like HST. FRA and FTA guidance is intended to satisfy environmental review requirements and assist project sponsors in addressing predicted construction and operation noise and vibration during the design process. 3.4.2.1 Federal Federal Noise Emission Compliance Regulation FRA has a regulation governing compliance of noise emissions from interstate railroads. The FRA’s Railroad Noise Emission Compliance Regulation (49 CFR Part 210) prescribes compliance requirements for enforcing railroad noise emission standards adopted by EPA (40 CFR Part 201). FHWA Procedures for Abatement of Highway Traffic Noise and Construction Noise, as provided in 23 CFR Subchapter H, Section 772 The criteria for highway noise impacts (relevant to the extent HST causes changes in traffic patterns) are included in the FHWA Procedures for Abatement of Highway Traffic Noise and Construction Noise (23 CFR Part 772).
Transcript of 3.4 Noise and Vibration - State of California high-speed train project final eir/eis fresno to...
CALIFORNIA HIGH-SPEED TRAIN PROJECT FINAL EIR/EIS
FRESNO TO BAKERSFIELD SECTION 3.4 NOISE AND VIBRATION
Page 3.4-1
3.4 Noise and Vibration
3.4.1 Introduction
This section describes the regulatory setting, affected environment, impacts, and mitigation
measures for noise and vibration resulting from the project. Noise and vibration are key elements of the environmental impact analysis because their increases over existing levels near the
California High-Speed Train (HST) project are a significant impact.
The HST Program EIR/EIS documents identified project engineering and design elements to reduce or avoid potential noise and vibration impacts. During the period between the scoping
meetings and preparation of this project EIR/EIS, the alternative analysis process identified those
alignments and design options that would avoid or minimize potential impacts to noise- and vibration-sensitive receivers. One important noise and vibration design choice was for the HST
System to use distributed power electric motor unit (EMU) train sets that will have lower noise emissions than locomotive-hauled electric train sets according to the Federal Railroad
Administration (FRA) noise and vibration guidance manual (FRA 2005, 2012).
The noise and vibration limits chosen for construction and operation of the HST System satisfy the federal guidelines of the FRA and Federal Transit Administration (FTA) for train and HST
facility operations and Federal Highway Administration (FHWA) as defined for California
application by the California Department of Transportation (Caltrans) for traffic noise.
As discussed in Section 3.1.5 and the Executive Summary, the analysis in this chapter includes revisions based on design refinements and analytical refinements. Gray shading is used as a
guide to help the reader navigate the revisions.
3.4.2 Laws, Regulations, and Orders
Noise and vibration impacts from major transportation projects are important federal and state environmental concerns and review requirements. In order to aid in compliance with
environmental regulations and guidelines related to noise and vibration, FRA and FTA have developed guidance for assessing noise and vibration impacts from major rail projects like HST.
FRA and FTA guidance is intended to satisfy environmental review requirements and assist
project sponsors in addressing predicted construction and operation noise and vibration during the design process.
3.4.2.1 Federal
Federal Noise Emission Compliance Regulation
FRA has a regulation governing compliance of noise emissions from interstate railroads. The
FRA’s Railroad Noise Emission Compliance Regulation (49 CFR Part 210) prescribes compliance requirements for enforcing railroad noise emission standards adopted by EPA (40 CFR Part 201).
FHWA Procedures for Abatement of Highway Traffic Noise and Construction Noise, as
provided in 23 CFR Subchapter H, Section 772
The criteria for highway noise impacts (relevant to the extent HST causes changes in traffic patterns) are included in the FHWA Procedures for Abatement of Highway Traffic Noise and
Construction Noise (23 CFR Part 772).
CALIFORNIA HIGH-SPEED TRAIN PROJECT FINAL EIR/EIS
FRESNO TO BAKERSFIELD SECTION 3.4 NOISE AND VIBRATION
Page 3.4-2
3.4.2.2 State
California Noise Control Act
At the state level, the California Noise Control Act, enacted in 1973 (Health and Safety Code Section 46010 et seq.), requires the Office of Noise Control in the Department of Health Services
to provide assistance to local communities developing local noise control programs and works
with the Office of Planning and Research to provide guidance for preparing required noise elements in city and county general plans, pursuant to Government Code Section 65302(f). In
preparing the noise element, a city or county must identify local noise sources, and analyze and quantify, to the extent practicable, current and projected noise levels for various sources,
including highways and freeways, passenger and freight railroad operations, ground rapid transit
systems, commercial, general, and military aviation and airport operations, and other ground stationary noise sources. These would include HST alignments. The California Noise Control Act
stipulates the mapping of noise-level contours for these sources, using community noise metrics appropriate for environmental impact assessment as defined in Section 3.4.3. Cities and counties
use these as guides to making land use decisions to minimize the community residents’ exposure to excessive noise.
3.4.2.3 Regional and Local
Counties and cities in California prepare general plans with noise policies and ordinances
(outlined above in the discussion of state regulations). These noise elements often incorporate specific allowable noise levels to achieve a quality environment. Many noise elements reviewed
for cities and counties in the Fresno to Bakersfield Section include restrictions on construction
hours; none have noise level limits on construction. Where airports exist, the general plans include a section on airport land use compatibility plans with respect to noise so that new noise-
sensitive uses are not located near or do not encroach on the area. The general plans do not address ground-borne vibration. The Fresno to Bakersfield Section: Noise and Vibration Technical Report (Authority and FRA 2012) summarizes the noise-related information from the city and
county general plans for the Fresno to Bakersfield Section. These local plans and policies were identified and considered in the preparation of this analysis.
3.4.3 Methods for Evaluating Impacts
The analysis of noise and vibration impacts used design information for the proposed alignment
and field noise and vibration measurements. The FRA (2005) guidance manual, High-Speed Ground Transportation Noise and Vibration Impact Assessment, was the primary source of
guidance for analyzing HST noise and vibration impacts and mitigation, and was supplemented with FTA (2006) guidance, Transit Noise and Vibration Impact Assessment, for non-HST noise.
The FRA manual provides guidelines for establishing the extent of the study area to be used for
the noise and vibration impact analyses. It also provides guidance for identifying noise-sensitive locations where increased annoyance (the startle effect) can occur from HST pass-bys. The FRA
guidance manual was updated in 2012; however, the noise and vibration impact criteria and the analytical methodologies for noise and vibration impacts in the updated guidance are the same as
those provided in the 2005 version. Therefore, no change in the methodology followed for this
analysis was required. The methodology used to analyze project noise and vibration impacts is described below.
For HST noise and vibration sources, the analysis followed the FRA guidance manual (FRA
2005, 2012, Chapter 5 – Detailed Noise Analysis, Chapter 9 – Detailed Vibration Assessment).
Analysts also used the FTA guidance manual for the detailed vibration impact analysis (FTA 2006, Chapter 11 – Detailed Vibration Analysis).
CALIFORNIA HIGH-SPEED TRAIN PROJECT FINAL EIR/EIS
FRESNO TO BAKERSFIELD SECTION 3.4 NOISE AND VIBRATION
Page 3.4-3
For non-HST noise sources, such as stations, maintenance facilities and construction,
analysts followed the methodology described in the FTA guidance manual (FTA 2006). This
methodology also is used at locations where the existing BNSF Railway tracks would be relocated to conform to the curves of the adjacent HST alignment and where the ambient
noise due to existing BNSF operations is reassessed.
For traffic noise sources, analysts followed the methods
described in the FHWA Highway Traffic Noise: Analysis and Abatement Guidance (FHWA [2010] 2011) as interpreted by
Caltrans in the Noise Analysis Protocol (Caltrans 2011).
The following thresholds were used for the impact analyses:
FRA Severe Noise Impact Criteria for HST Operations.
FRA Moderate Noise Impact Criteria for HST Operations.
FRA Increased Annoyance from Rapid Onset Rates of HST Pass-
bys. FRA Interim Criteria for Noise Impacts on Animals.
FRA Vibration Impact Criteria for HST Operations
FTA Detailed Vibration Impact Criteria.
Caltrans Noise Abatement Criteria for Traffic.
FTA Noise Impact Criteria for Ancillary and Non-HST Noise
Sources, such as stations and maintenance facilities.
Additional details regarding evaluation methods are provided in the
following sections and in the Fresno to Bakersfield Section: Noise and Vibration Technical Report (Authority and FRA 2012).
3.4.3.1 What is Noise?
Noise from an HST system is expressed in terms of a “source-path-receiver” framework. The
“source” generates noise levels that depend on the type of source (e.g., a high-speed train) and its operating characteristics (e.g., speed). The “receiver” is the noise-sensitive land use (e.g.,
residence, hospital, or school) exposed to noise from the source. In between the source and the receiver is the “path” where the noise is reduced by distance, intervening buildings, and
topography. Environmental noise impacts are assessed at the receiver. Noise criteria are
established for the various types of receivers because not all receivers have the same noise-sensitivity.
Analysts use three primary noise measurement descriptors to assess noise impacts from traffic
and transit projects. They are the equivalent sound level (Leq), the day-night sound level (Ldn), and the sound exposure level (SEL):
Leq: The level of a constant sound for a specified period of time that has the same sound
energy as an actual fluctuating noise over the same period of time. The peak-hour Leq is used
for all traffic and rail noise analyses at locations with daytime use, such as schools and libraries.
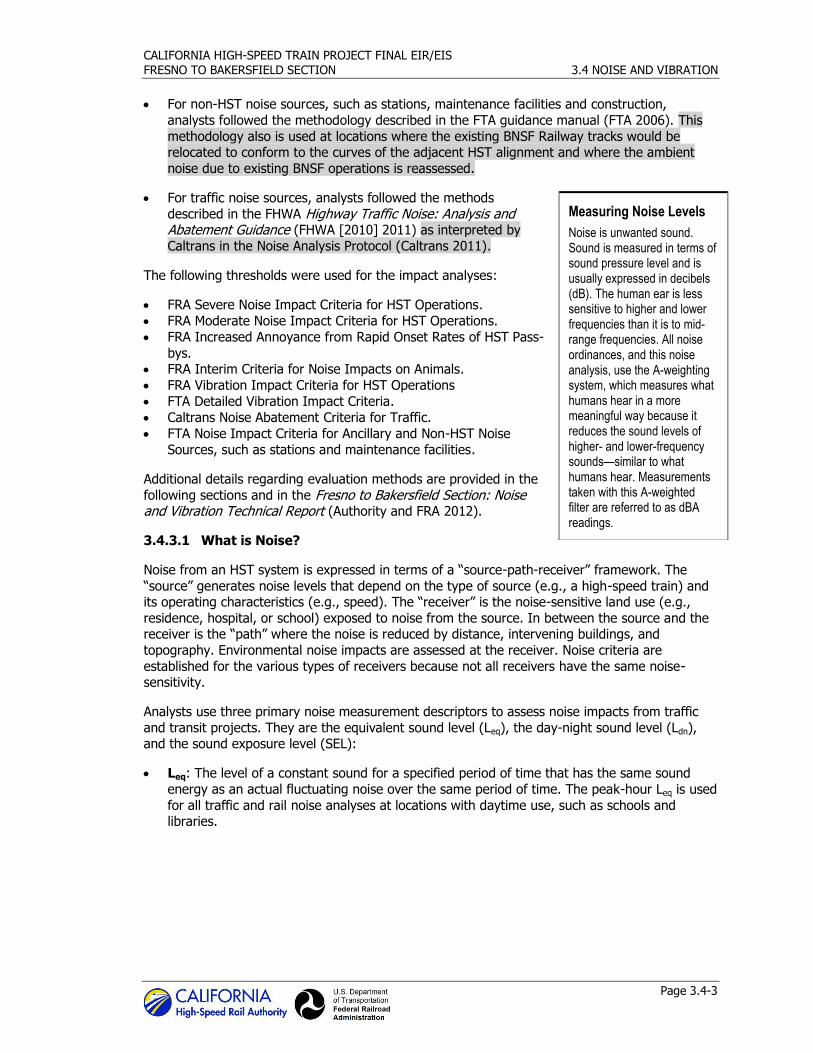
Measuring Noise Levels
Noise is unwanted sound. Sound is measured in terms of sound pressure level and is usually expressed in decibels (dB). The human ear is less sensitive to higher and lower frequencies than it is to mid-range frequencies. All noise ordinances, and this noise analysis, use the A-weighting system, which measures what humans hear in a more meaningful way because it reduces the sound levels of higher- and lower-frequency sounds—similar to what humans hear. Measurements taken with this A-weighted filter are referred to as dBA readings.
CALIFORNIA HIGH-SPEED TRAIN PROJECT FINAL EIR/EIS
FRESNO TO BAKERSFIELD SECTION 3.4 NOISE AND VIBRATION
Page 3.4-4
Figure 3.4-1 Typical Lmax noise levels
Ldn: The Leq over a 24-hour period, with
10 dB added to nighttime sound levels
(between 10 p.m. and 7 a.m.) as a penalty to account for the greater
sensitivity and lower background sound levels during this time. The Ldn is the
primary noise-level descriptor for rail
noise in residential land uses. Figure 3.4-1 shows typical Ldn noise
levels. The Fresno to Bakersfield Section: Noise and Vibration Technical Report provides details regarding noise and noise descriptors.
SEL: The sound exposure level (SEL)
during a single noise event is the
primary descriptor of a single noise
event, and is used to describe noise from a HST passing a location along the
track. SEL is an intermediate value in the calculation of both Leq and Ldn. It
represents a receiver's cumulative noise exposure from an event (train pass-by), and represents the total A-weighted sound during the event normalized to a 1-second interval.
In addition to the Leq, Ldn, and SEL, there is another descriptor used to describe noise. The
loudest 1 second of noise over a measurement period, or maximum A-weighted sound pressure
level (Lmax), is used in many local and state ordinances for noise coming from private land uses and for construction impact evaluations. Figure 3.4-1 shows typical maximum A-weighted sound
pressure levels for HSTs and other sources.
3.4.3.2 What Is Vibration?
Vibration from an HST system is also expressed in terms of a “source-path-receiver” framework. The “source” is the train rolling on the tracks, which generates vibration energy transmitted
through the supporting structure under the tracks and into the ground. Once the vibration gets into the ground, it propagates through the various soil and rock strata—the “path”—to the
foundations of nearby buildings, the “receivers.” Ground-borne vibrations generally reduce in
levels with distance depending on the local geological conditions. A “receiver” is a vibration-
sensitive building (e.g., residence, hospital, or school) where the vibrations may cause perceptible shaking of the floors, walls, and ceilings and a rumbling sound inside rooms. Not all
receivers have the same vibration-sensitivity. Consequently, criteria are established for the various types of receivers. Ground-borne vibration can be described in terms of displacement,
velocity, or acceleration for evaluating impacts from transit projects. Ground-borne noise occurs as a perceptible rumble and is caused by the noise radiated from the vibration of room surfaces.
Vibration above certain levels can damage buildings, disrupt sensitive operations, and cause
annoyance to humans within buildings.
CALIFORNIA HIGH-SPEED TRAIN PROJECT FINAL EIR/EIS
FRESNO TO BAKERSFIELD SECTION 3.4 NOISE AND VIBRATION
Page 3.4-5
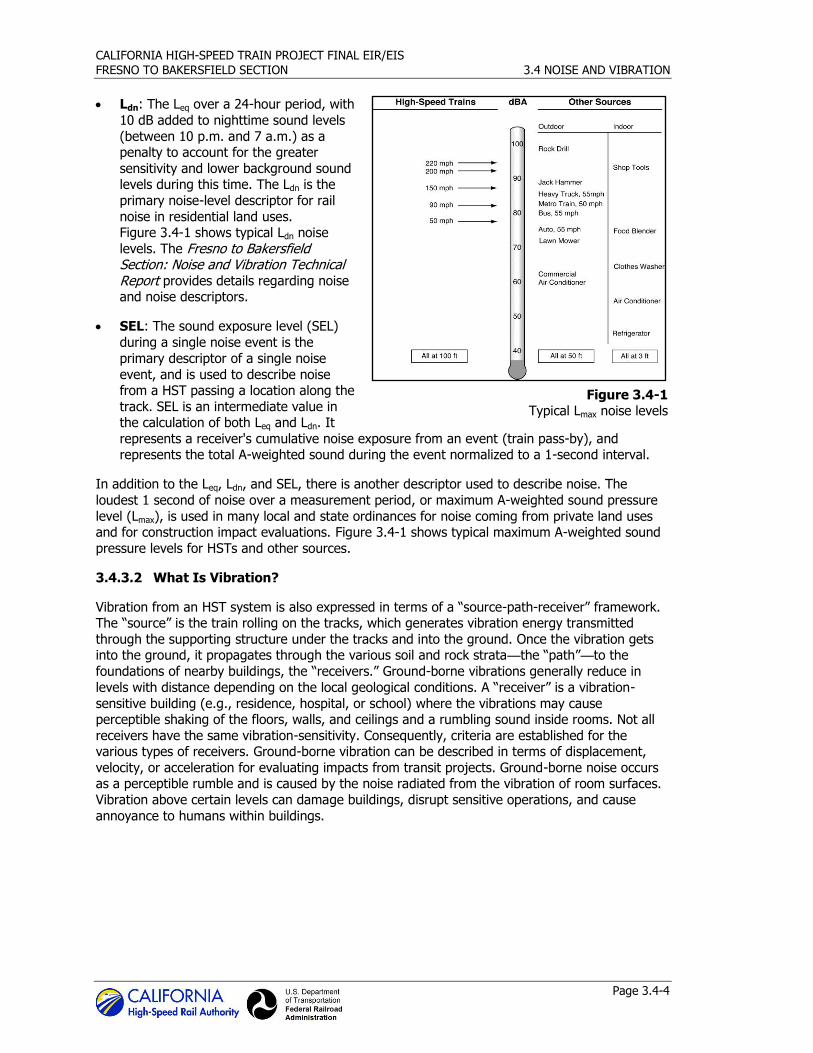
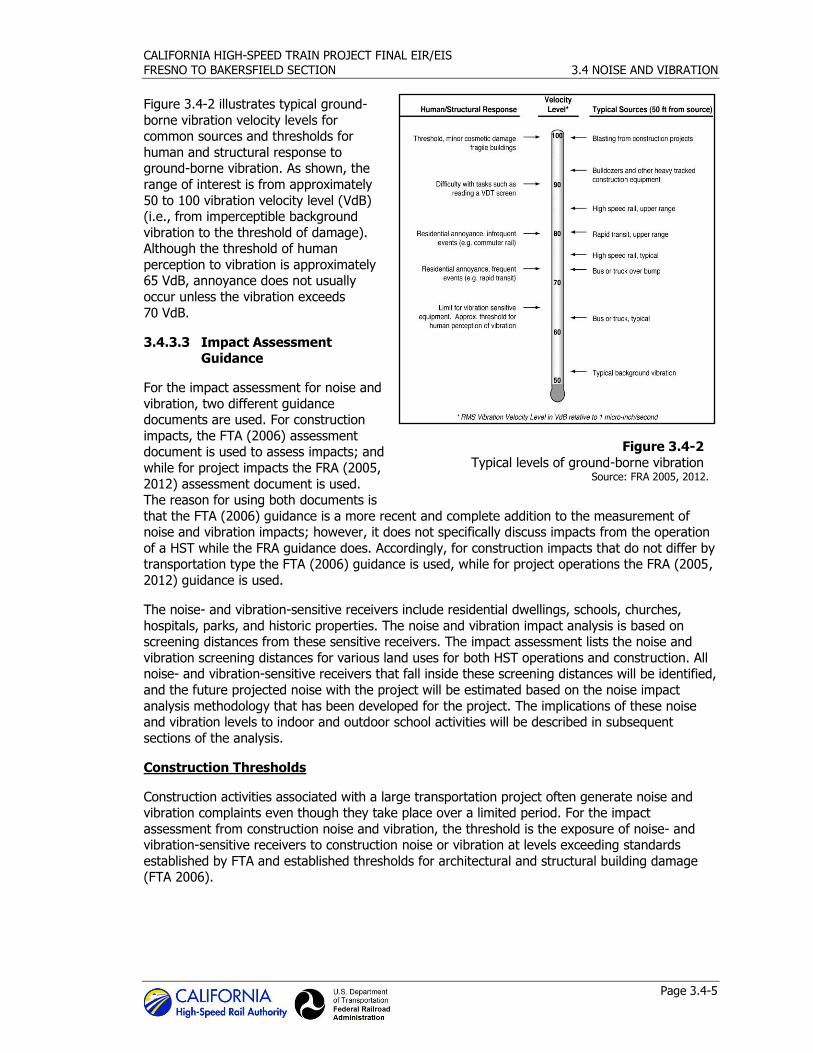
Figure 3.4-2
Typical levels of ground-borne vibration Source: FRA 2005, 2012.
Figure 3.4-2 illustrates typical ground-
borne vibration velocity levels for common sources and thresholds for
human and structural response to ground-borne vibration. As shown, the
range of interest is from approximately
50 to 100 vibration velocity level (VdB) (i.e., from imperceptible background
vibration to the threshold of damage). Although the threshold of human
perception to vibration is approximately 65 VdB, annoyance does not usually
occur unless the vibration exceeds
70 VdB.
3.4.3.3 Impact Assessment Guidance
For the impact assessment for noise and
vibration, two different guidance documents are used. For construction
impacts, the FTA (2006) assessment document is used to assess impacts; and
while for project impacts the FRA (2005,
2012) assessment document is used. The reason for using both documents is
that the FTA (2006) guidance is a more recent and complete addition to the measurement of noise and vibration impacts; however, it does not specifically discuss impacts from the operation
of a HST while the FRA guidance does. Accordingly, for construction impacts that do not differ by transportation type the FTA (2006) guidance is used, while for project operations the FRA (2005,
2012) guidance is used.
The noise- and vibration-sensitive receivers include residential dwellings, schools, churches,
hospitals, parks, and historic properties. The noise and vibration impact analysis is based on screening distances from these sensitive receivers. The impact assessment lists the noise and
vibration screening distances for various land uses for both HST operations and construction. All noise- and vibration-sensitive receivers that fall inside these screening distances will be identified,
and the future projected noise with the project will be estimated based on the noise impact
analysis methodology that has been developed for the project. The implications of these noise and vibration levels to indoor and outdoor school activities will be described in subsequent
sections of the analysis.
Construction Thresholds
Construction activities associated with a large transportation project often generate noise and vibration complaints even though they take place over a limited period. For the impact
assessment from construction noise and vibration, the threshold is the exposure of noise- and vibration-sensitive receivers to construction noise or vibration at levels exceeding standards
established by FTA and established thresholds for architectural and structural building damage (FTA 2006).
CALIFORNIA HIGH-SPEED TRAIN PROJECT FINAL EIR/EIS
FRESNO TO BAKERSFIELD SECTION 3.4 NOISE AND VIBRATION
Page 3.4-6
Construction Noise
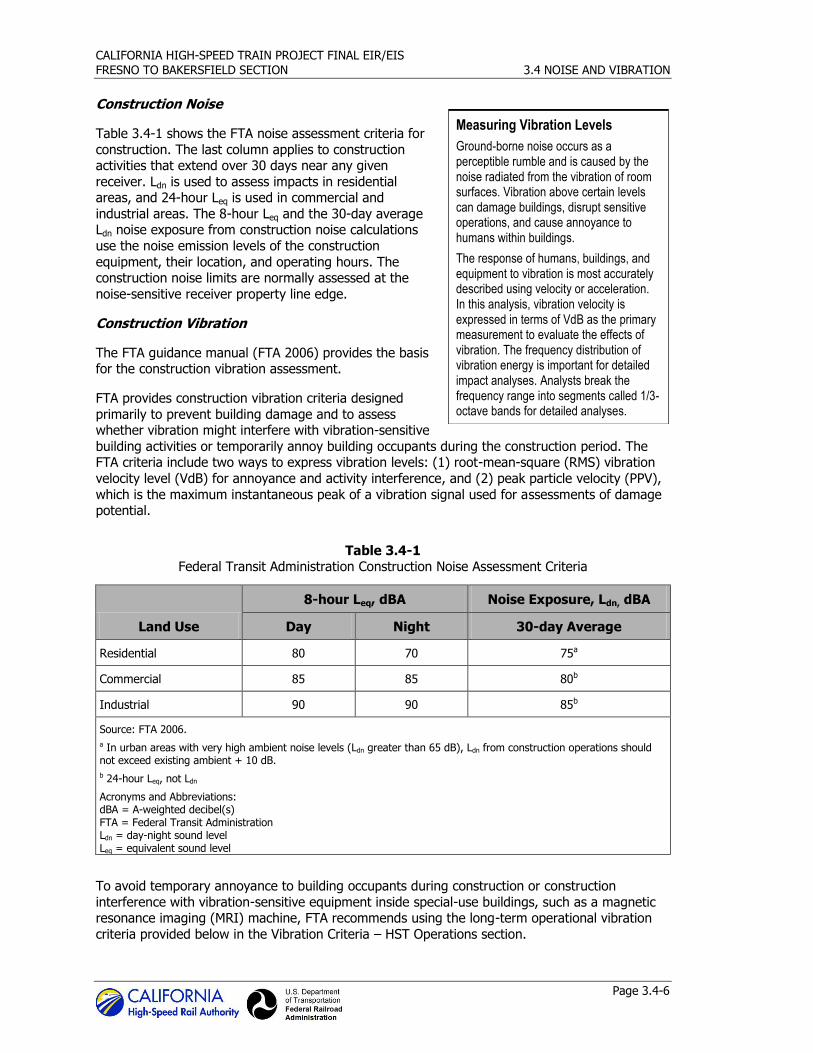
Table 3.4-1 shows the FTA noise assessment criteria for
construction. The last column applies to construction activities that extend over 30 days near any given
receiver. Ldn is used to assess impacts in residential areas, and 24-hour Leq is used in commercial and
industrial areas. The 8-hour Leq and the 30-day average Ldn noise exposure from construction noise calculations
use the noise emission levels of the construction
equipment, their location, and operating hours. The construction noise limits are normally assessed at the
noise-sensitive receiver property line edge.
Construction Vibration
The FTA guidance manual (FTA 2006) provides the basis for the construction vibration assessment.
FTA provides construction vibration criteria designed
primarily to prevent building damage and to assess whether vibration might interfere with vibration-sensitive
building activities or temporarily annoy building occupants during the construction period. The FTA criteria include two ways to express vibration levels: (1) root-mean-square (RMS) vibration
velocity level (VdB) for annoyance and activity interference, and (2) peak particle velocity (PPV),
which is the maximum instantaneous peak of a vibration signal used for assessments of damage potential.
Table 3.4-1 Federal Transit Administration Construction Noise Assessment Criteria
Land Use
8-hour Leq, dBA Noise Exposure, Ldn, dBA
Day Night 30-day Average
Residential 80 70 75a
Commercial 85 85 80b
Industrial 90 90 85b
Source: FTA 2006.
a In urban areas with very high ambient noise levels (Ldn greater than 65 dB), Ldn from construction operations should not exceed existing ambient + 10 dB.
b 24-hour Leq, not Ldn
Acronyms and Abbreviations: dBA = A-weighted decibel(s) FTA = Federal Transit Administration Ldn = day-night sound level Leq = equivalent sound level
To avoid temporary annoyance to building occupants during construction or construction
interference with vibration-sensitive equipment inside special-use buildings, such as a magnetic resonance imaging (MRI) machine, FTA recommends using the long-term operational vibration
criteria provided below in the Vibration Criteria – HST Operations section.
Measuring Vibration Levels
Ground-borne noise occurs as a perceptible rumble and is caused by the noise radiated from the vibration of room surfaces. Vibration above certain levels can damage buildings, disrupt sensitive operations, and cause annoyance to humans within buildings.
The response of humans, buildings, and equipment to vibration is most accurately described using velocity or acceleration. In this analysis, vibration velocity is expressed in terms of VdB as the primary measurement to evaluate the effects of vibration. The frequency distribution of vibration energy is important for detailed impact analyses. Analysts break the frequency range into segments called 1/3-octave bands for detailed analyses.
CALIFORNIA HIGH-SPEED TRAIN PROJECT FINAL EIR/EIS
FRESNO TO BAKERSFIELD SECTION 3.4 NOISE AND VIBRATION
Page 3.4-7
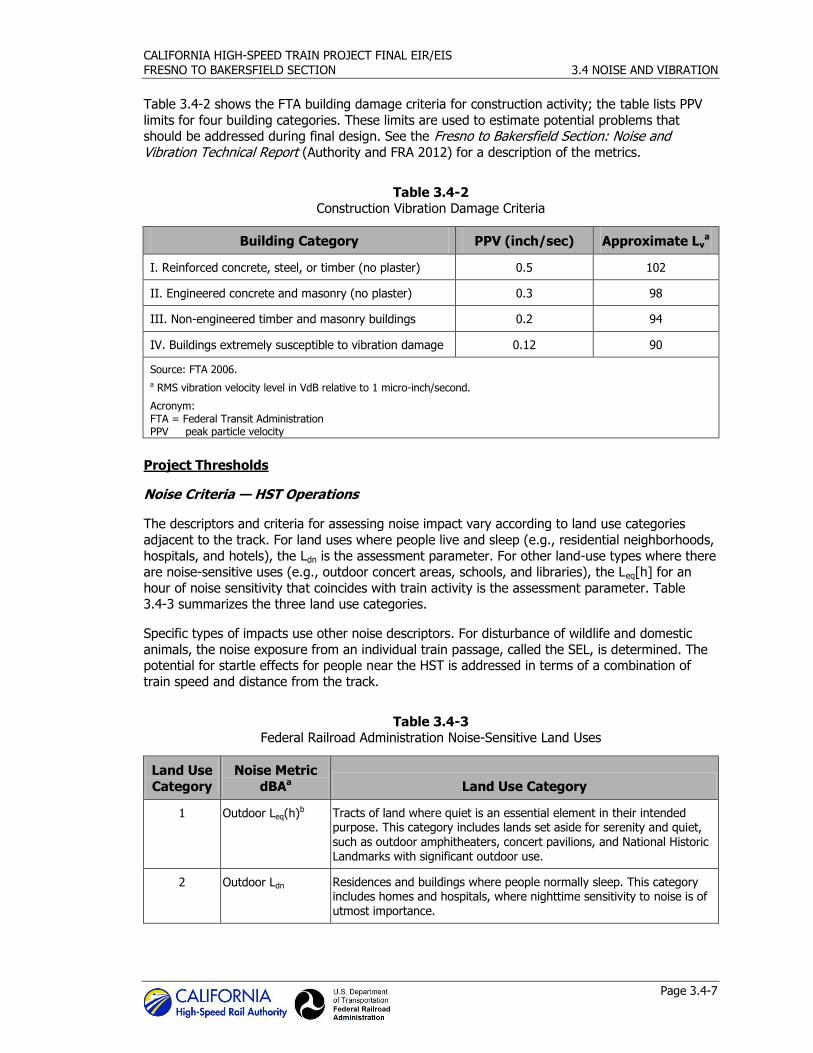
Table 3.4-2 shows the FTA building damage criteria for construction activity; the table lists PPV
limits for four building categories. These limits are used to estimate potential problems that should be addressed during final design. See the Fresno to Bakersfield Section: Noise and Vibration Technical Report (Authority and FRA 2012) for a description of the metrics.
Table 3.4-2 Construction Vibration Damage Criteria
Building Category PPV (inch/sec) Approximate Lva
I. Reinforced concrete, steel, or timber (no plaster) 0.5 102
II. Engineered concrete and masonry (no plaster) 0.3 98
III. Non-engineered timber and masonry buildings 0.2 94
IV. Buildings extremely susceptible to vibration damage 0.12 90
Source: FTA 2006.
a RMS vibration velocity level in VdB relative to 1 micro-inch/second.
Acronym: FTA = Federal Transit Administration PPV peak particle velocity
Project Thresholds
Noise Criteria — HST Operations
The descriptors and criteria for assessing noise impact vary according to land use categories
adjacent to the track. For land uses where people live and sleep (e.g., residential neighborhoods,
hospitals, and hotels), the Ldn is the assessment parameter. For other land-use types where there are noise-sensitive uses (e.g., outdoor concert areas, schools, and libraries), the Leq[h] for an
hour of noise sensitivity that coincides with train activity is the assessment parameter. Table 3.4-3 summarizes the three land use categories.
Specific types of impacts use other noise descriptors. For disturbance of wildlife and domestic
animals, the noise exposure from an individual train passage, called the SEL, is determined. The potential for startle effects for people near the HST is addressed in terms of a combination of
train speed and distance from the track.
Table 3.4-3 Federal Railroad Administration Noise-Sensitive Land Uses
Land Use
Category
Noise Metric
dBAa Land Use Category
1 Outdoor Leq(h)b Tracts of land where quiet is an essential element in their intended purpose. This category includes lands set aside for serenity and quiet, such as outdoor amphitheaters, concert pavilions, and National Historic Landmarks with significant outdoor use.
2 Outdoor Ldn Residences and buildings where people normally sleep. This category includes homes and hospitals, where nighttime sensitivity to noise is of utmost importance.
CALIFORNIA HIGH-SPEED TRAIN PROJECT FINAL EIR/EIS
FRESNO TO BAKERSFIELD SECTION 3.4 NOISE AND VIBRATION
Page 3.4-8
Table 3.4-3 Federal Railroad Administration Noise-Sensitive Land Uses
Land Use
Category
Noise Metric
dBAa Land Use Category
3 Outdoor Leq(h)b Institutional land uses with primarily daytime and evening use. This category includes schools, libraries, and churches, where it is important to avoid interference with such activities as speech, meditation, and concentration. Buildings with interior spaces where quiet is important, such as medical offices, conference rooms, recording studios, concert halls fall into this category, as well as places for meditation or study associated with cemeteries, monuments, and museums. Certain historical sites, parks, and recreational facilities are also included.
Source: FRA 2005, 2012.
Notes: a Onset-rate adjusted sound levels (Leq and Ldn) are to be used where applicable. b Leq for the noisiest hour of transit-related activity during hours of noise sensitivity.
Acronyms and Abbreviations: dBA = A-weighted decibel(s) FRA = Federal Railroad Administration Leq = equivalent sound level, dBA
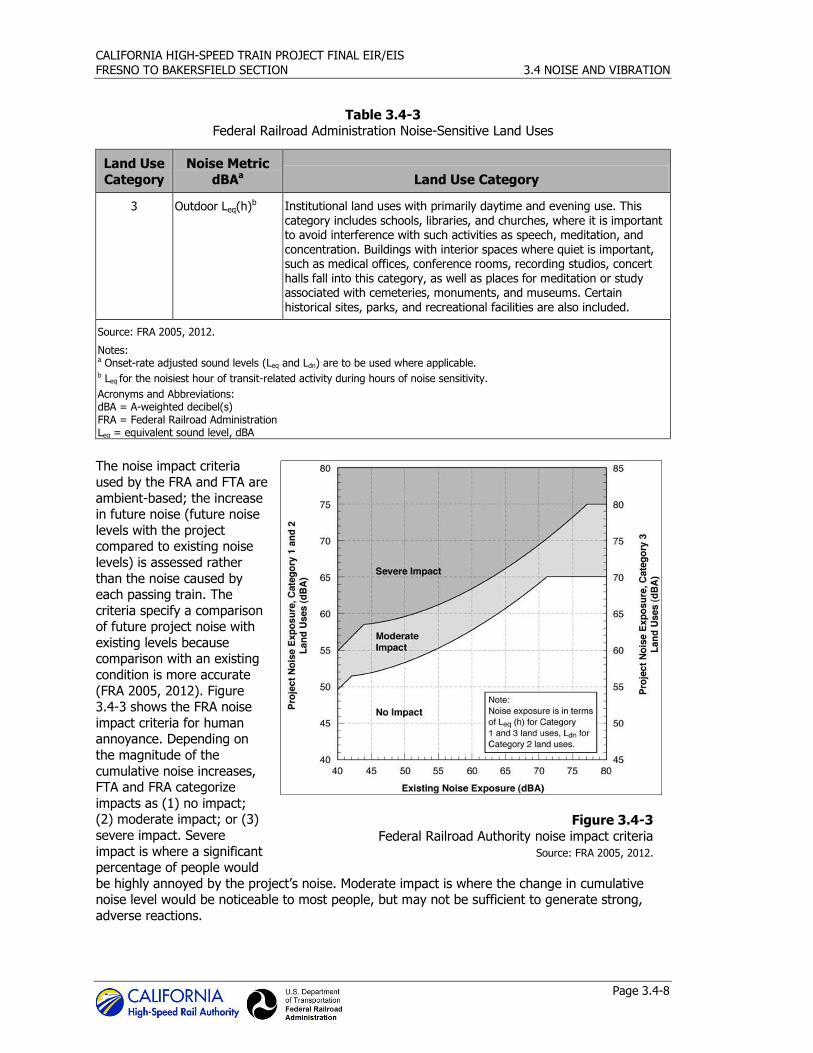
The noise impact criteria
used by the FRA and FTA are
ambient-based; the increase in future noise (future noise
levels with the project compared to existing noise
levels) is assessed rather
than the noise caused by each passing train. The
criteria specify a comparison of future project noise with
existing levels because comparison with an existing
condition is more accurate
(FRA 2005, 2012). Figure 3.4-3 shows the FRA noise
impact criteria for human annoyance. Depending on
the magnitude of the
cumulative noise increases, FTA and FRA categorize
impacts as (1) no impact; (2) moderate impact; or (3)
severe impact. Severe
impact is where a significant percentage of people would
be highly annoyed by the project’s noise. Moderate impact is where the change in cumulative noise level would be noticeable to most people, but may not be sufficient to generate strong,
adverse reactions.
Figure 3.4-3
Federal Railroad Authority noise impact criteria Source: FRA 2005, 2012.
CALIFORNIA HIGH-SPEED TRAIN PROJECT FINAL EIR/EIS
FRESNO TO BAKERSFIELD SECTION 3.4 NOISE AND VIBRATION
Page 3.4-9
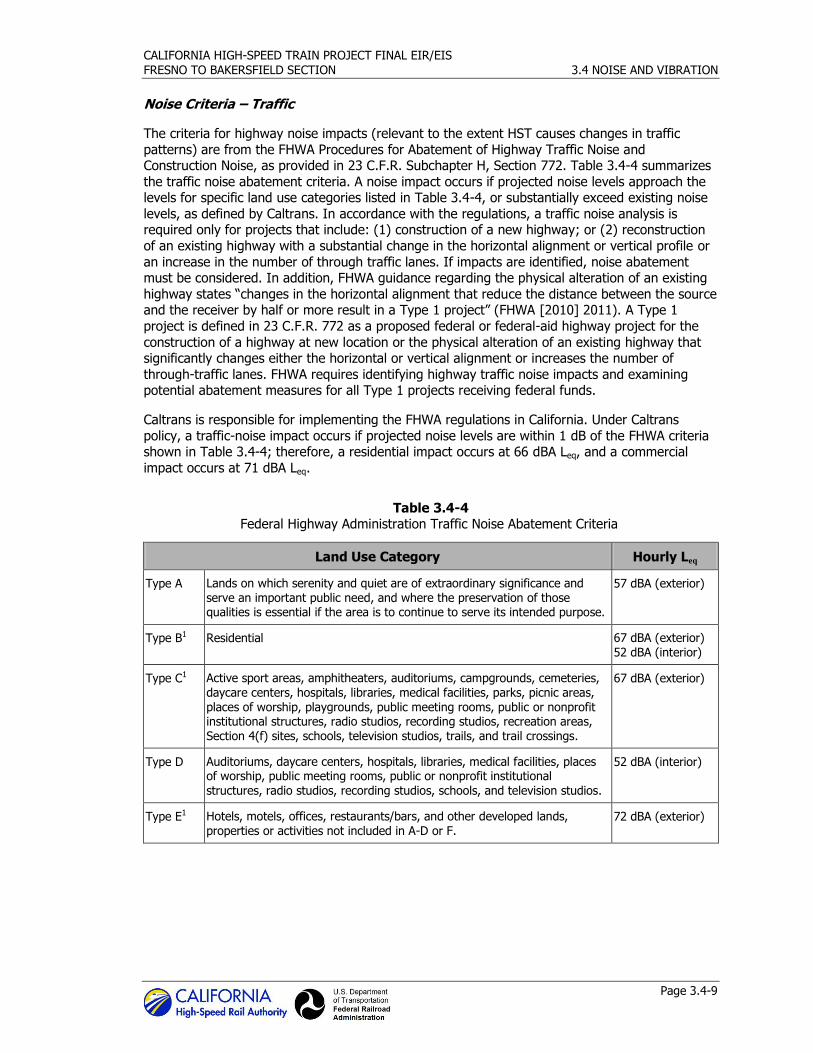
Noise Criteria – Traffic
The criteria for highway noise impacts (relevant to the extent HST causes changes in traffic
patterns) are from the FHWA Procedures for Abatement of Highway Traffic Noise and Construction Noise, as provided in 23 C.F.R. Subchapter H, Section 772. Table 3.4-4 summarizes
the traffic noise abatement criteria. A noise impact occurs if projected noise levels approach the levels for specific land use categories listed in Table 3.4-4, or substantially exceed existing noise
levels, as defined by Caltrans. In accordance with the regulations, a traffic noise analysis is required only for projects that include: (1) construction of a new highway; or (2) reconstruction
of an existing highway with a substantial change in the horizontal alignment or vertical profile or
an increase in the number of through traffic lanes. If impacts are identified, noise abatement must be considered. In addition, FHWA guidance regarding the physical alteration of an existing
highway states “changes in the horizontal alignment that reduce the distance between the source and the receiver by half or more result in a Type 1 project” (FHWA [2010] 2011). A Type 1
project is defined in 23 C.F.R. 772 as a proposed federal or federal-aid highway project for the
construction of a highway at new location or the physical alteration of an existing highway that significantly changes either the horizontal or vertical alignment or increases the number of
through-traffic lanes. FHWA requires identifying highway traffic noise impacts and examining potential abatement measures for all Type 1 projects receiving federal funds.
Caltrans is responsible for implementing the FHWA regulations in California. Under Caltrans
policy, a traffic-noise impact occurs if projected noise levels are within 1 dB of the FHWA criteria shown in Table 3.4-4; therefore, a residential impact occurs at 66 dBA Leq, and a commercial
impact occurs at 71 dBA Leq.
Table 3.4-4 Federal Highway Administration Traffic Noise Abatement Criteria
Land Use Category Hourly Leq
Type A Lands on which serenity and quiet are of extraordinary significance and serve an important public need, and where the preservation of those qualities is essential if the area is to continue to serve its intended purpose.
57 dBA (exterior)
Type B1 Residential 67 dBA (exterior) 52 dBA (interior)
Type C1 Active sport areas, amphitheaters, auditoriums, campgrounds, cemeteries, daycare centers, hospitals, libraries, medical facilities, parks, picnic areas, places of worship, playgrounds, public meeting rooms, public or nonprofit institutional structures, radio studios, recording studios, recreation areas, Section 4(f) sites, schools, television studios, trails, and trail crossings.
67 dBA (exterior)
Type D Auditoriums, daycare centers, hospitals, libraries, medical facilities, places of worship, public meeting rooms, public or nonprofit institutional structures, radio studios, recording studios, schools, and television studios.
52 dBA (interior)
Type E1 Hotels, motels, offices, restaurants/bars, and other developed lands, properties or activities not included in A-D or F.
72 dBA (exterior)
CALIFORNIA HIGH-SPEED TRAIN PROJECT FINAL EIR/EIS
FRESNO TO BAKERSFIELD SECTION 3.4 NOISE AND VIBRATION
Page 3.4-10
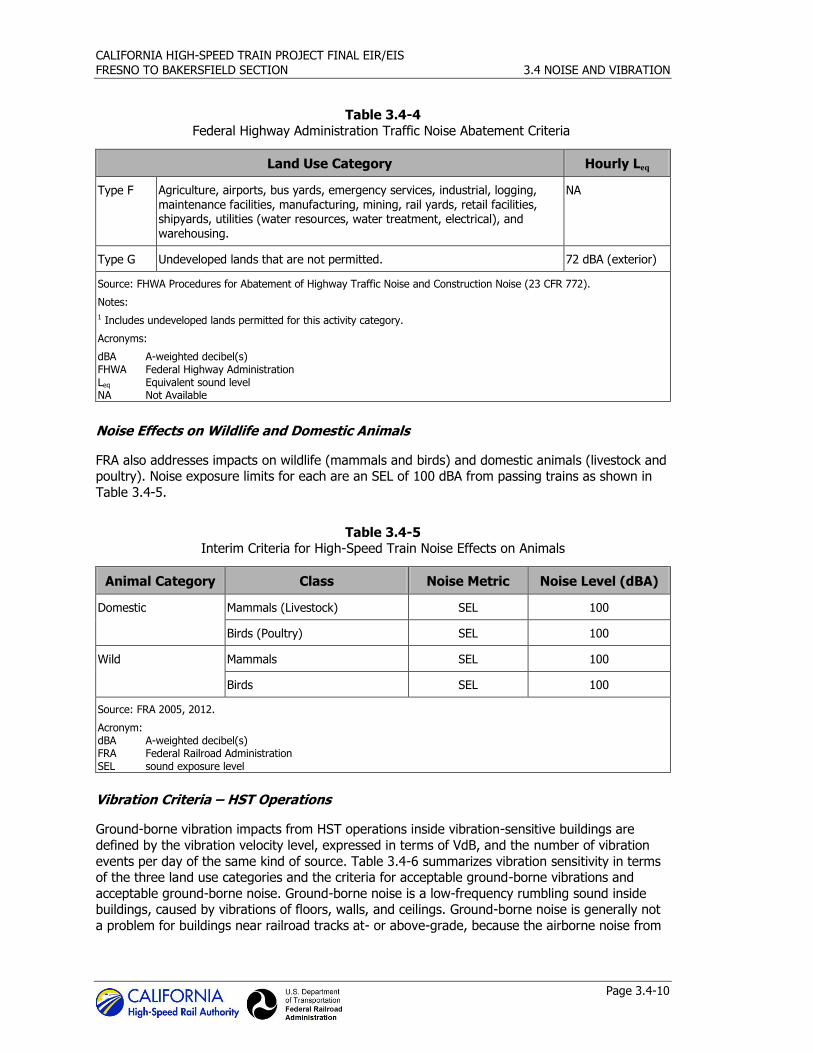
Table 3.4-4 Federal Highway Administration Traffic Noise Abatement Criteria
Land Use Category Hourly Leq
Type F Agriculture, airports, bus yards, emergency services, industrial, logging, maintenance facilities, manufacturing, mining, rail yards, retail facilities, shipyards, utilities (water resources, water treatment, electrical), and warehousing.
NA
Type G Undeveloped lands that are not permitted. 72 dBA (exterior)
Source: FHWA Procedures for Abatement of Highway Traffic Noise and Construction Noise (23 CFR 772).
Notes:
1 Includes undeveloped lands permitted for this activity category.
Acronyms:
dBA A-weighted decibel(s) FHWA Federal Highway Administration Leq Equivalent sound level NA Not Available
Noise Effects on Wildlife and Domestic Animals
FRA also addresses impacts on wildlife (mammals and birds) and domestic animals (livestock and poultry). Noise exposure limits for each are an SEL of 100 dBA from passing trains as shown in
Table 3.4-5.
Table 3.4-5 Interim Criteria for High-Speed Train Noise Effects on Animals
Animal Category Class Noise Metric Noise Level (dBA)
Domestic Mammals (Livestock) SEL 100
Birds (Poultry) SEL 100
Wild Mammals SEL 100
Birds SEL 100
Source: FRA 2005, 2012.
Acronym: dBA A-weighted decibel(s) FRA Federal Railroad Administration SEL sound exposure level
Vibration Criteria – HST Operations
Ground-borne vibration impacts from HST operations inside vibration-sensitive buildings are
defined by the vibration velocity level, expressed in terms of VdB, and the number of vibration
events per day of the same kind of source. Table 3.4-6 summarizes vibration sensitivity in terms of the three land use categories and the criteria for acceptable ground-borne vibrations and
acceptable ground-borne noise. Ground-borne noise is a low-frequency rumbling sound inside buildings, caused by vibrations of floors, walls, and ceilings. Ground-borne noise is generally not
a problem for buildings near railroad tracks at- or above-grade, because the airborne noise from
CALIFORNIA HIGH-SPEED TRAIN PROJECT FINAL EIR/EIS
FRESNO TO BAKERSFIELD SECTION 3.4 NOISE AND VIBRATION
Page 3.4-11
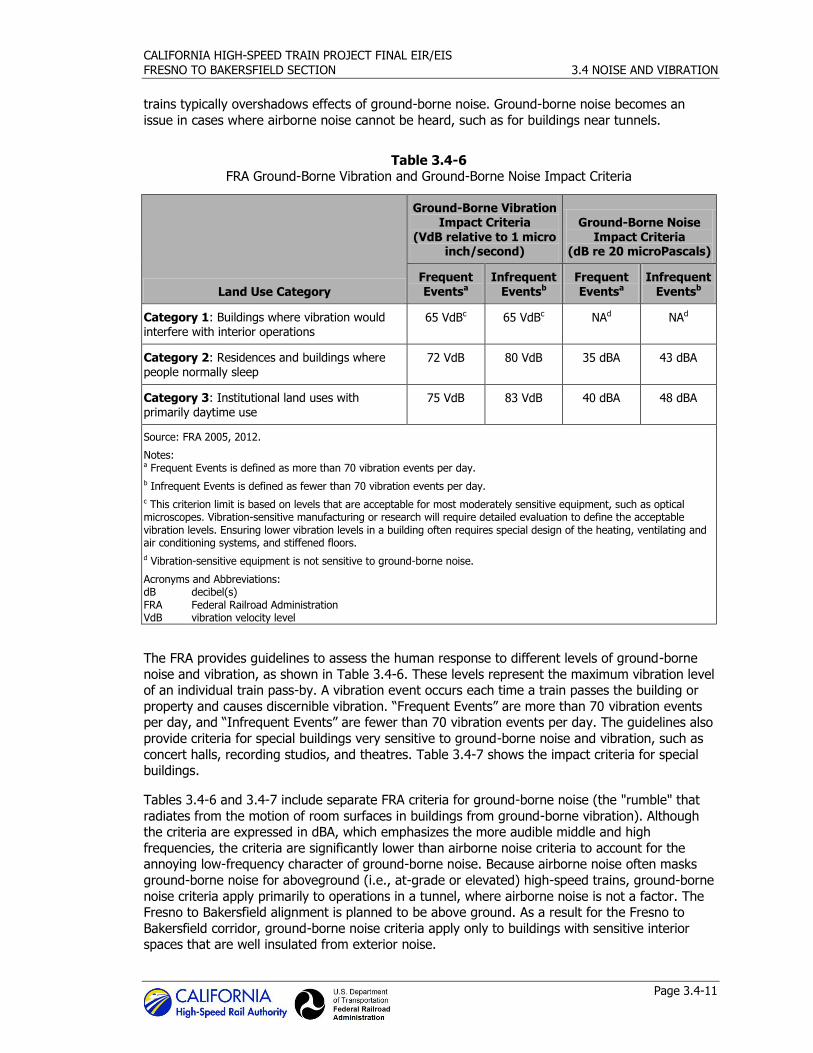
trains typically overshadows effects of ground-borne noise. Ground-borne noise becomes an
issue in cases where airborne noise cannot be heard, such as for buildings near tunnels.
Table 3.4-6 FRA Ground-Borne Vibration and Ground-Borne Noise Impact Criteria
Land Use Category
Ground-Borne Vibration Impact Criteria
(VdB relative to 1 micro inch/second)
Ground-Borne Noise Impact Criteria
(dB re 20 microPascals)
Frequent Eventsa
Infrequent Eventsb
Frequent Eventsa
Infrequent Eventsb
Category 1: Buildings where vibration would interfere with interior operations
65 VdBc 65 VdBc NAd NAd
Category 2: Residences and buildings where people normally sleep
72 VdB 80 VdB 35 dBA 43 dBA
Category 3: Institutional land uses with primarily daytime use
75 VdB 83 VdB 40 dBA 48 dBA
Source: FRA 2005, 2012.
Notes: a Frequent Events is defined as more than 70 vibration events per day.
b Infrequent Events is defined as fewer than 70 vibration events per day.
c This criterion limit is based on levels that are acceptable for most moderately sensitive equipment, such as optical microscopes. Vibration-sensitive manufacturing or research will require detailed evaluation to define the acceptable vibration levels. Ensuring lower vibration levels in a building often requires special design of the heating, ventilating and air conditioning systems, and stiffened floors.
d Vibration-sensitive equipment is not sensitive to ground-borne noise.
Acronyms and Abbreviations: dB decibel(s) FRA Federal Railroad Administration VdB vibration velocity level
The FRA provides guidelines to assess the human response to different levels of ground-borne
noise and vibration, as shown in Table 3.4-6. These levels represent the maximum vibration level of an individual train pass-by. A vibration event occurs each time a train passes the building or
property and causes discernible vibration. “Frequent Events” are more than 70 vibration events per day, and “Infrequent Events” are fewer than 70 vibration events per day. The guidelines also
provide criteria for special buildings very sensitive to ground-borne noise and vibration, such as
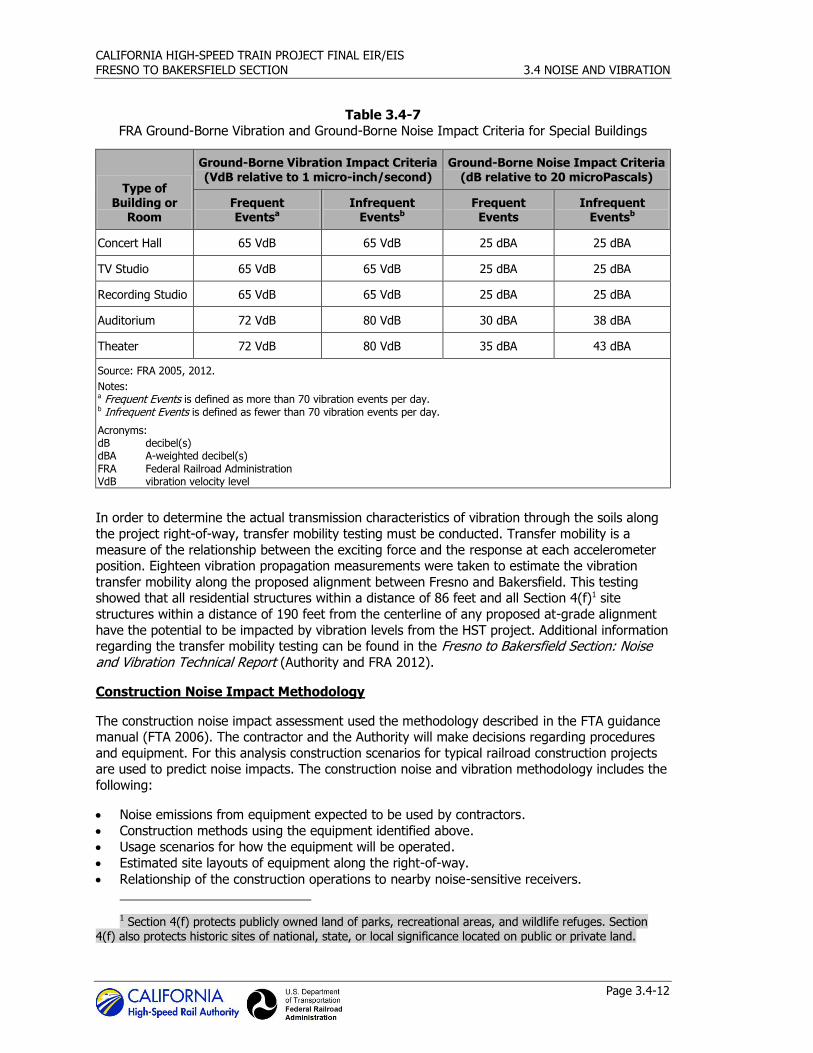
concert halls, recording studios, and theatres. Table 3.4-7 shows the impact criteria for special buildings.
Tables 3.4-6 and 3.4-7 include separate FRA criteria for ground-borne noise (the "rumble" that
radiates from the motion of room surfaces in buildings from ground-borne vibration). Although the criteria are expressed in dBA, which emphasizes the more audible middle and high
frequencies, the criteria are significantly lower than airborne noise criteria to account for the annoying low-frequency character of ground-borne noise. Because airborne noise often masks
ground-borne noise for aboveground (i.e., at-grade or elevated) high-speed trains, ground-borne
noise criteria apply primarily to operations in a tunnel, where airborne noise is not a factor. The Fresno to Bakersfield alignment is planned to be above ground. As a result for the Fresno to
Bakersfield corridor, ground-borne noise criteria apply only to buildings with sensitive interior spaces that are well insulated from exterior noise.
CALIFORNIA HIGH-SPEED TRAIN PROJECT FINAL EIR/EIS
FRESNO TO BAKERSFIELD SECTION 3.4 NOISE AND VIBRATION
Page 3.4-12
Table 3.4-7 FRA Ground-Borne Vibration and Ground-Borne Noise Impact Criteria for Special Buildings
Type of Building or
Room
Ground-Borne Vibration Impact Criteria (VdB relative to 1 micro-inch/second)
Ground-Borne Noise Impact Criteria (dB relative to 20 microPascals)
Frequent Eventsa
Infrequent Eventsb
Frequent Events
Infrequent Eventsb
Concert Hall 65 VdB 65 VdB 25 dBA 25 dBA
TV Studio 65 VdB 65 VdB 25 dBA 25 dBA
Recording Studio 65 VdB 65 VdB 25 dBA 25 dBA
Auditorium 72 VdB 80 VdB 30 dBA 38 dBA
Theater 72 VdB 80 VdB 35 dBA 43 dBA
Source: FRA 2005, 2012.
Notes: a Frequent Events is defined as more than 70 vibration events per day. b Infrequent Events is defined as fewer than 70 vibration events per day.
Acronyms: dB decibel(s) dBA A-weighted decibel(s) FRA Federal Railroad Administration VdB vibration velocity level
In order to determine the actual transmission characteristics of vibration through the soils along
the project right-of-way, transfer mobility testing must be conducted. Transfer mobility is a
measure of the relationship between the exciting force and the response at each accelerometer position. Eighteen vibration propagation measurements were taken to estimate the vibration
transfer mobility along the proposed alignment between Fresno and Bakersfield. This testing showed that all residential structures within a distance of 86 feet and all Section 4(f)1 site
structures within a distance of 190 feet from the centerline of any proposed at-grade alignment
have the potential to be impacted by vibration levels from the HST project. Additional information regarding the transfer mobility testing can be found in the Fresno to Bakersfield Section: Noise and Vibration Technical Report (Authority and FRA 2012).
Construction Noise Impact Methodology
The construction noise impact assessment used the methodology described in the FTA guidance manual (FTA 2006). The contractor and the Authority will make decisions regarding procedures
and equipment. For this analysis construction scenarios for typical railroad construction projects are used to predict noise impacts. The construction noise and vibration methodology includes the
following:
Noise emissions from equipment expected to be used by contractors.
Construction methods using the equipment identified above.
Usage scenarios for how the equipment will be operated.
Estimated site layouts of equipment along the right-of-way.
Relationship of the construction operations to nearby noise-sensitive receivers.
1 Section 4(f) protects publicly owned land of parks, recreational areas, and wildlife refuges. Section 4(f) also protects historic sites of national, state, or local significance located on public or private land.

CALIFORNIA HIGH-SPEED TRAIN PROJECT FINAL EIR/EIS
FRESNO TO BAKERSFIELD SECTION 3.4 NOISE AND VIBRATION
Page 3.4-13
Table 3.4-1 above lists FTA criteria for the maximum acceptable 8-hour noise levels (Leq) for
daytime and nighttime. It also shows the 30-day average Ldn values for long-term construction projects.
Criteria for Construction Noise Impact Assessment
The construction noise assessment is based on guidelines included in the FTA guidance manual
(FTA 2006), as well as consideration of local noise ordinances, which are presented in the Fresno to Bakersfield Section: Noise and Vibration Technical Report. The Authority applies uniform noise
and vibration criteria for construction based on FTA and FRA guidance.
Table 3.4-1 shows FTA assessment criteria for construction noise. An 8-hour Leq and a 30-day average noise exposure are used to assess impacts. A 30-day average Ldn is used to assess
impacts in residential areas, and a 30-day average 24-hour Leq is used to assess impacts in commercial and industrial areas. The noise emission levels of the construction equipment,
utilization factor, hours of operation, and location of equipment are used to calculate 8-hour and
30-day average noise exposures.
Construction Vibration Impact Methodology
The FTA guidance manual (FTA 2006) provides the methodology for the assessment of
construction vibration impact. Estimated construction scenarios have been developed for typical
railroad construction projects allowing a quantitative construction vibration assessment to be conducted. Construction vibration is assessed quantitatively where a potential for blasting, pile-
driving, vibratory compaction, demolition, or excavation close to vibration-sensitive structures exists. Criteria for annoyance (see Tables 3.4-6 and 3.4-7) and damage (see Table 3.4-2) were
applied to determine construction vibration impacts. The methodology included:
Vibration source levels from equipment expected to be used by contractors.
Estimated site layouts of equipment along the right-of-way.
Relationship of the construction operations to nearby vibration-sensitive receivers.
Train Operation Noise and Vibration Methodology
HST operation noise and vibration levels were projected using a conservative HST System
operation plan with a high frequency of train operations and the prediction models provided in the FRA guidance manual (FRA 2005, 2012). Potential noise and vibration impacts also were
evaluated in accordance with the FRA guidance manual. Section 3.4.3.3 describes the applicable criteria; this section, as well as the Noise and Vibration Technical Report, provide further detail
about the assessment methodology, including modeling assumptions. The assumptions for train
operation are listed below, followed by the methodologies:
Noise modeling projections assumed atmospheric absorption of sound based on the
International Standard ISO 9613-2.
The noise analysis used source reference levels for the VHS Electric vehicle type listed in
Table 5-2 of the FRA Guidance Manual (FRA 2005, 2012). These adjustments assumed that
train sets would be distributed-power EMU vehicles with 8 cars and a maximum speed of 220
mph.
The noise sources included the wheel/rail interface at one foot above top of rail, the
propulsion noise at 2 feet above top of rail, and the aerodynamic noises from the train nose
CALIFORNIA HIGH-SPEED TRAIN PROJECT FINAL EIR/EIS
FRESNO TO BAKERSFIELD SECTION 3.4 NOISE AND VIBRATION
Page 3.4-14
(at 10 feet above top-of-rail), the wheel region (at 5 feet above top-of-rail), and the
pantograph2 (at 15 feet above top-of-rail).
HST track was assumed to be a combination of ballast and slab track with continuous welded rail, consistent with the assumptions in the FRA guidance manual (FRA 2005, 2012). Slab
construction will be used for elevated structures exceeding 1,000 feet in length where
operating speeds are planned for 220 miles per hour (mph). Slab track would be 3 dB louder than ballast and tie track because of the decreased acoustic absorption compared to that of
the ballast and because of changes to the track stiffness.
Modeling used the full system schedule of train operations as outlined in Chapter 2 of this
document and detailed in the Fresno to Bakersfield Noise and Vibration Technical Report.
Maximum speed was assumed to be 220 mph along the corridor depending upon speed
profiles provided by project design files and interpreted by Parsons Brinckerhoff, Inc. in July 2010.
Top of rail elevations are based on 15% preliminary design as available March 2011.
The track was assumed to be on aerial structure wherever top-of-rail elevations are more
than 20 feet above the existing grade.
All aerial structure sections of the corridor were assumed to be as described in the Technical
Memorandum “TM 1.1.21 Typical Cross Section 15% R0 090404 TM Excerpt.pdf.”
Buildings within the property acquisition footprint were not to be included in the impact
assessment because they were assumed to be acquired as part of the HST footprint.
There would be several closures of existing roadway/freight train/Amtrak train at-grade
crossings along the corridor on the BNSF Alternative. A road overcrossing would separate
both the HST and the BNSF freight line. Trains passing through the existing at-grade crossings between roadways and freight/Amtrak railroad tracks currently are required to blow
their horns as a warning to oncoming traffic and pedestrians. Noise modeling projections
assumed no change to any of the existing at-grade crossings and, therefore, no change to locations where the freight and Amtrak trains will blow their horns. There would be no at-
grade crossings for HSTs.
No adjustments were made to projected noise levels to account for increases in localized
noise due to special trackwork, such as crossovers and turnouts, since the project will use special trackwork which will not have gaps associated with crossovers.
No noise exposure effects were assumed associated with changes in freight rail or Amtrak
operations due to the implementation of the HST project.
Projections accounted for reduced noise emissions from the acoustic shielding provided by
the trenches proposed through Fresno and along the Hanford West Bypass alternatives.
Project analysts tabulated projected noise and existing ambient noise exposures at the identified
receivers or clusters of receivers. The analysts found the levels of impact (no impact, moderate impact, or severe impact) by comparing the existing and project noise exposure based on the
impact criteria shown in Figure 3.4-3.
2 Pantographs are the vertical arms that extend from the train cars to the overhead contact system to provide power to the train.
CALIFORNIA HIGH-SPEED TRAIN PROJECT FINAL EIR/EIS
FRESNO TO BAKERSFIELD SECTION 3.4 NOISE AND VIBRATION
Page 3.4-15
Station Noise
Project analysts assessed the noise impacts associated with HST stations in the cities of Fresno
and Bakersfield and in Kings County at each noise-sensitive receiver by using the FTA methodology in the guidance manual (FTA 2006, Section 6.7). The detailed noise analysis
included a measurement program at representative clusters of receivers to determine existing ambient noise conditions and a noise prediction method to determine future noise conditions.
This methodology was also used at locations where the existing BNSF Railway tracks would be realigned to conform to the proposed HST alignment and where the ambient noise due to
existing BNSF Railway operations is reassessed. The noise predictions at these receivers were
based on the following information:
Type of train equipment to be used.
Train schedules (number of stopping trains and number of through trains during daytime and
nighttime hours). Train consists (number of cars).
Speed profiles of stopping trains and through trains.
Plans and profiles of elevated station structures.
Landform topography such as buildings in the immediate vicinity of the station.
Project analysts tabulated the projected noise and existing ambient noise exposures at the
identified receivers or clusters of receivers. The analysts then determined the levels of impact (no
impact, moderate impact, or severe impact) by comparing the existing and project noise exposure with the impact criteria shown in Figure 3.4-3.
Traffic Noise at Stations, Parking Facilities, and Grade-Separations
In addition to noise from HST operations, project analysts assessed changes in traffic volume,
primarily near the proposed HST station sites. Traffic on local roads provides only a minor contribution to overall noise levels. In addition, because the dominant noise source at stations
would be the HST through trains moving at 220 mph, any changes in traffic near the stations would provide only a minor contribution to the project noise at stations.
Stationary HST-Related Noise Sources
Noise from other railroad noise sources than HSTs includes noise from the three types of
maintenance facilities (heavy maintenance, maintenance-of-way, and overnight servicing) and electrical power substations.
The noise analysis used FTA (2006) methodology to analyze noise from the HST traction power
substations, maintenance facilities, and activities associated with maintenance, repair, and storage of HSTs. Source noise included wheel squeal as the trains pass through the curved
sections at the ends of the storage tracks, shop activities, railcar washes, and warning horns.
3.4.3.4 Methods for Evaluating Effects under NEPA
Pursuant to NEPA regulations (40 C.F.R. 1500-1508), project effects are evaluated based on the criteria of context and intensity. Context means the affected environment in which a proposed
project occurs. Intensity refers to the severity of the effect, which is examined in terms of the
type, quality, and sensitivity of the resource involved, location and extent of the effect, duration of the effect (short- or long-term), and other consideration of context. Beneficial effects are
identified and described. When there is no measurable effect, impact is found not to occur. The intensity of adverse effects is the degree or magnitude of a potential adverse effect, described as
negligible, moderate, or substantial. Context and intensity are considered together when
CALIFORNIA HIGH-SPEED TRAIN PROJECT FINAL EIR/EIS
FRESNO TO BAKERSFIELD SECTION 3.4 NOISE AND VIBRATION
Page 3.4-16
determining whether an impact is significant under NEPA. Thus, it is possible that a significant
adverse effect may still exist when on balance the impact is negligible or even beneficial.
For this assessment, to be consistent with FRA’s noise impact criteria, FRA terminology of “no impact” was used rather than the NEPA term “negligible.”
If the project results in a change in the cumulative noise level that would not be noticeable to a
significant number of people, there would be no impact (FRA’s “No Impact” category, as shown in Figure 3.4-3). If the project results in a change in the cumulative noise level that would be
noticeable to most people, but may not be sufficient to generate strong reactions, the impact is defined as having moderate intensity (FRA’s “Moderate Impact” category, as shown in Figure
3.4-3). If the project results in a change in the cumulative noise level that would cause a strong
reaction in a significant percentage of people, the impact is defined as having substantial intensity under NEPA (FRA’s “Severe Impact” category, as shown in Figure 3.4-3). The context
for noise effects is the background noise level and the sensitivity of receivers (with rural residential equaling less noise and fewer receivers versus urban residential near existing noise
emitters, such as railroads and freeways). Noise effects of substantial intensity would be considered significant under NEPA.
For vibration, all impacts, as defined by the FRA criteria in Section 3.4.3.3, would be considered
to have substantial intensity. Because there is only one level of impact in the FRA criteria, all
project vibration impacts over the impact criteria would be considered significant.
3.4.3.5 CEQA Significance Criteria
The FRA noise and vibration criteria for evaluating effects under NEPA may be used as the CEQA
significance criteria. In addition to these criteria, CEQA guidelines also define an impact
pertaining to noise and vibration as considered significant if it would result in any of the following environmental effects:
Exposure of persons to or generation of noise levels in excess of standards for a severe
impact established by the FRA for high-speed ground transportation and by the FTA for
transit projects and other changes to non-HST rail tracks. These standards cover both permanent and temporary/periodic increases in ambient noise levels in the project vicinity
above levels existing without the project.
Exposure of persons to or generation of excessive ground-borne vibration or ground-borne
noise levels.
3.4.3.6 Study Area for Analysis
Noise Study Area
The noise study area of the project includes sensitive receivers located up to approximately 2,500
feet from the proposed track centerline. This study area has been determined based on typical
screening distances (see Table 3.4-8) defined by FRA and project-specific conditions. Screening distances indicate whether any noise-sensitive receivers are near enough to the proposed
alignment for a noise impact to be possible under typical conditions. If receivers are located farther away than these screening distances, FRA guidance has determined that impacts would
be unlikely. Table 3.4-8, which groups screening distances by the type of corridor the project
would occupy, takes into account whether the HST alignment follows along an existing rail line or highway or along a new transportation corridor.

CALIFORNIA HIGH-SPEED TRAIN PROJECT FINAL EIR/EIS
FRESNO TO BAKERSFIELD SECTION 3.4 NOISE AND VIBRATION
Page 3.4-17
Table 3.4-8 Screening Distances for High-Speed Rail Speed Regime IIIa
Corridor
Type Existing Noise Environment
Screening Distance for
Train Type and Speed Regimeb
Railroad Urban/noisy suburban – unobstructed 700 feet
Urban/noisy suburban – intervening buildingsc 300 feet
Quiet suburban/rural 1,200 feet
Highway Urban/noisy suburban – unobstructed 600 feet
Urban/noisy suburban – intervening buildingsc 350 feet
Quiet suburban/rural 1,100 feet
New Urban/noisy suburban – unobstructed 700 feet
Urban/noisy suburban – intervening buildingsc 350 feet
Quiet suburban/rural 1,300 feet
Source: FRA 2005, 2012.
Notes:
a 170 mph or greater. b Measured from centerline of alignment. Minimum distance is assumed to be 50 feet. c Rows of buildings are assumed to be 200, 400, 600, 800, and 1,000 feet away, parallel to the alignment.
Acronym: mph = mile(s) per hour
The FRA has three speed ranges in its screening methodology. The highest speed range category (Regime III – 170 mph or greater) was used to define the Fresno to Bakersfield HST alignment
screening distance. These screening distances are based on general assumptions associated with typical projects, such as the number of train operations, train speeds, and existing noise
conditions. The specific factors of the HST project were considered when the potential impact
was assessed for all noise-sensitive receivers within approximately 2,000 feet. One of the primary reasons that the study area extends farther than the typical screening distances is that some
areas have relatively low existing noise conditions.
Vibration Study Area
For the proposed project, the study area for vibration is as follows:
HST station study area: 150 feet from the station boundary.
HST alignment study areas, including existing railroads: up to 275 feet from the edge of the
right-of-way.
Highway study areas: 50 feet from the roadway centerline.
The vibration impact assessment uses the FRA screening procedure. Screening distances indicate
the potential for vibration impact on vibration-sensitive receivers. FRA guidance has determined
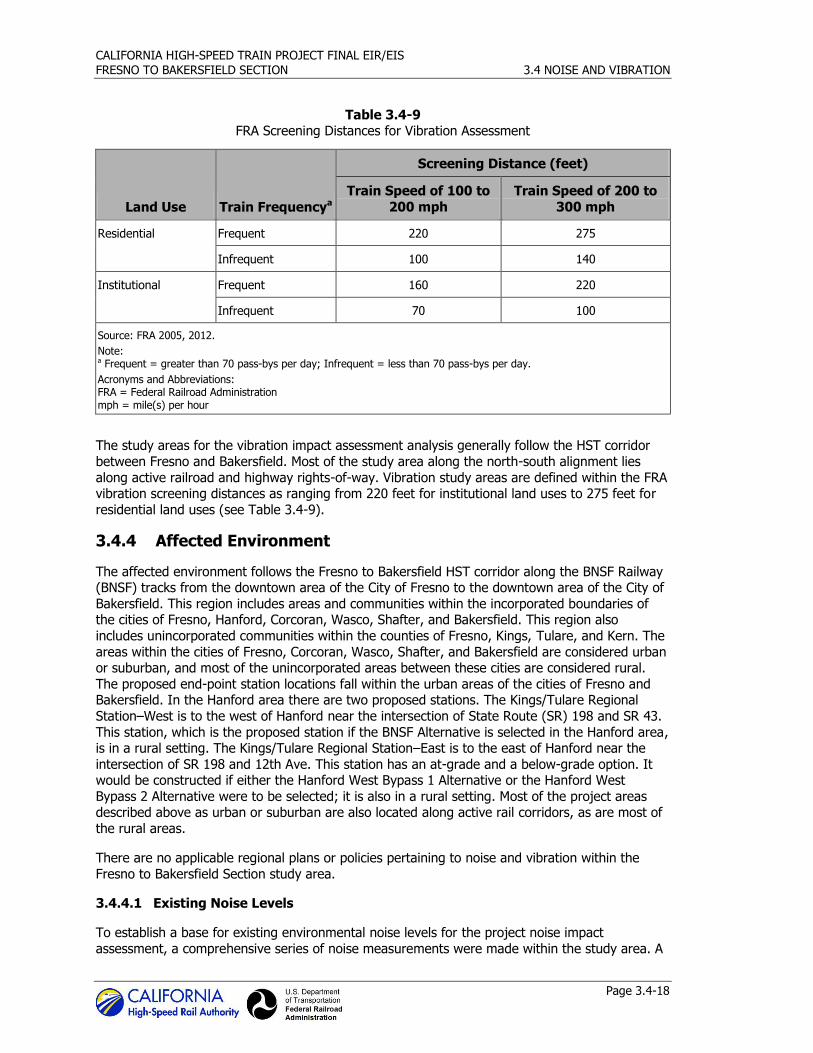
that receivers located beyond the screening distances are not likely to be affected by the HST. Table 3.4-9 presents the screening distances for vibration assessment.
CALIFORNIA HIGH-SPEED TRAIN PROJECT FINAL EIR/EIS
FRESNO TO BAKERSFIELD SECTION 3.4 NOISE AND VIBRATION
Page 3.4-18
Table 3.4-9 FRA Screening Distances for Vibration Assessment
Land Use Train Frequencya
Screening Distance (feet)
Train Speed of 100 to
200 mph
Train Speed of 200 to
300 mph
Residential Frequent 220 275
Infrequent 100 140
Institutional Frequent 160 220
Infrequent 70 100
Source: FRA 2005, 2012.
Note: a Frequent = greater than 70 pass-bys per day; Infrequent = less than 70 pass-bys per day.
Acronyms and Abbreviations: FRA = Federal Railroad Administration mph = mile(s) per hour
The study areas for the vibration impact assessment analysis generally follow the HST corridor
between Fresno and Bakersfield. Most of the study area along the north-south alignment lies
along active railroad and highway rights-of-way. Vibration study areas are defined within the FRA vibration screening distances as ranging from 220 feet for institutional land uses to 275 feet for
residential land uses (see Table 3.4-9).
3.4.4 Affected Environment
The affected environment follows the Fresno to Bakersfield HST corridor along the BNSF Railway (BNSF) tracks from the downtown area of the City of Fresno to the downtown area of the City of
Bakersfield. This region includes areas and communities within the incorporated boundaries of the cities of Fresno, Hanford, Corcoran, Wasco, Shafter, and Bakersfield. This region also
includes unincorporated communities within the counties of Fresno, Kings, Tulare, and Kern. The
areas within the cities of Fresno, Corcoran, Wasco, Shafter, and Bakersfield are considered urban or suburban, and most of the unincorporated areas between these cities are considered rural.
The proposed end-point station locations fall within the urban areas of the cities of Fresno and Bakersfield. In the Hanford area there are two proposed stations. The Kings/Tulare Regional
Station–West is to the west of Hanford near the intersection of State Route (SR) 198 and SR 43.
This station, which is the proposed station if the BNSF Alternative is selected in the Hanford area, is in a rural setting. The Kings/Tulare Regional Station–East is to the east of Hanford near the
intersection of SR 198 and 12th Ave. This station has an at-grade and a below-grade option. It would be constructed if either the Hanford West Bypass 1 Alternative or the Hanford West
Bypass 2 Alternative were to be selected; it is also in a rural setting. Most of the project areas described above as urban or suburban are also located along active rail corridors, as are most of
the rural areas.
There are no applicable regional plans or policies pertaining to noise and vibration within the
Fresno to Bakersfield Section study area.
3.4.4.1 Existing Noise Levels
To establish a base for existing environmental noise levels for the project noise impact
assessment, a comprehensive series of noise measurements were made within the study area. A
CALIFORNIA HIGH-SPEED TRAIN PROJECT FINAL EIR/EIS
FRESNO TO BAKERSFIELD SECTION 3.4 NOISE AND VIBRATION
Page 3.4-19
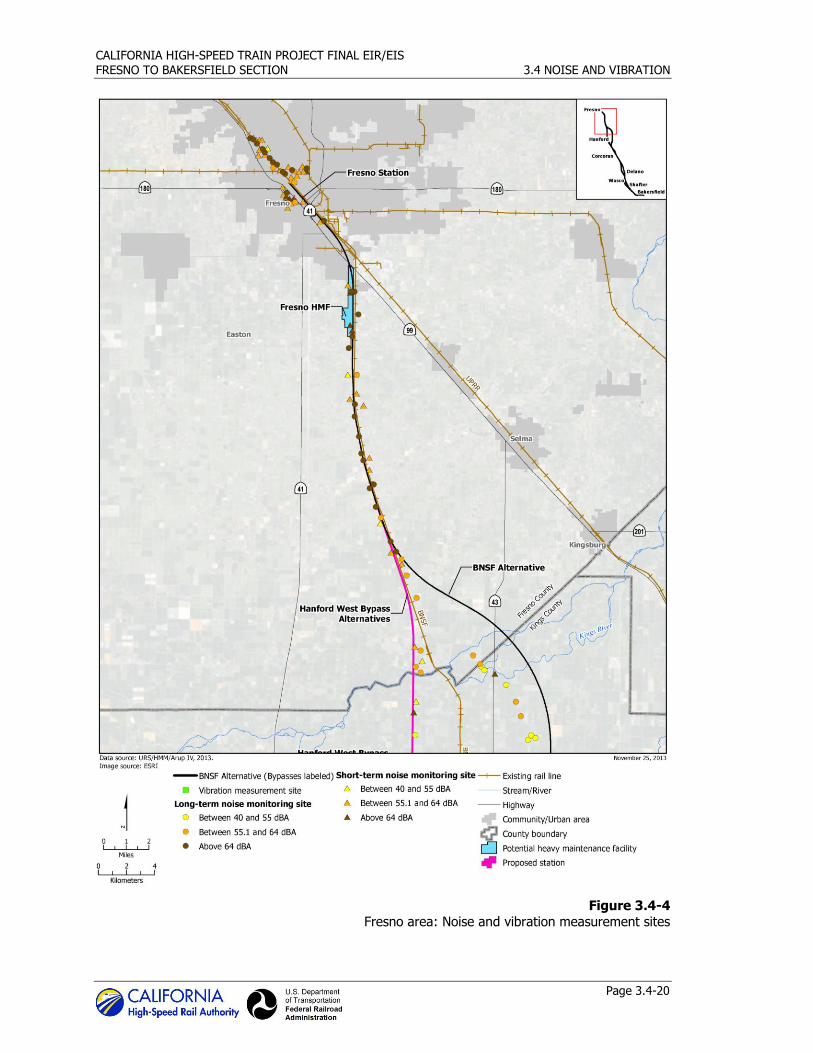
combination of 230 long-term (24 hours in duration) and 239 short-term (generally 60 minutes in
duration) noise measurements were taken at noise-sensitive receivers. Multiple measurements were made at some measurement sites. The ambient noise level measurement locations were
selected to be representative of the noise environment most likely to be impacted by train noise. Measurements were completed at single-family and multi-family residences for long-term
measurements. Short-term measurements were completed at residential and institutional sites
(e.g., hospitals, libraries, schools, and churches).
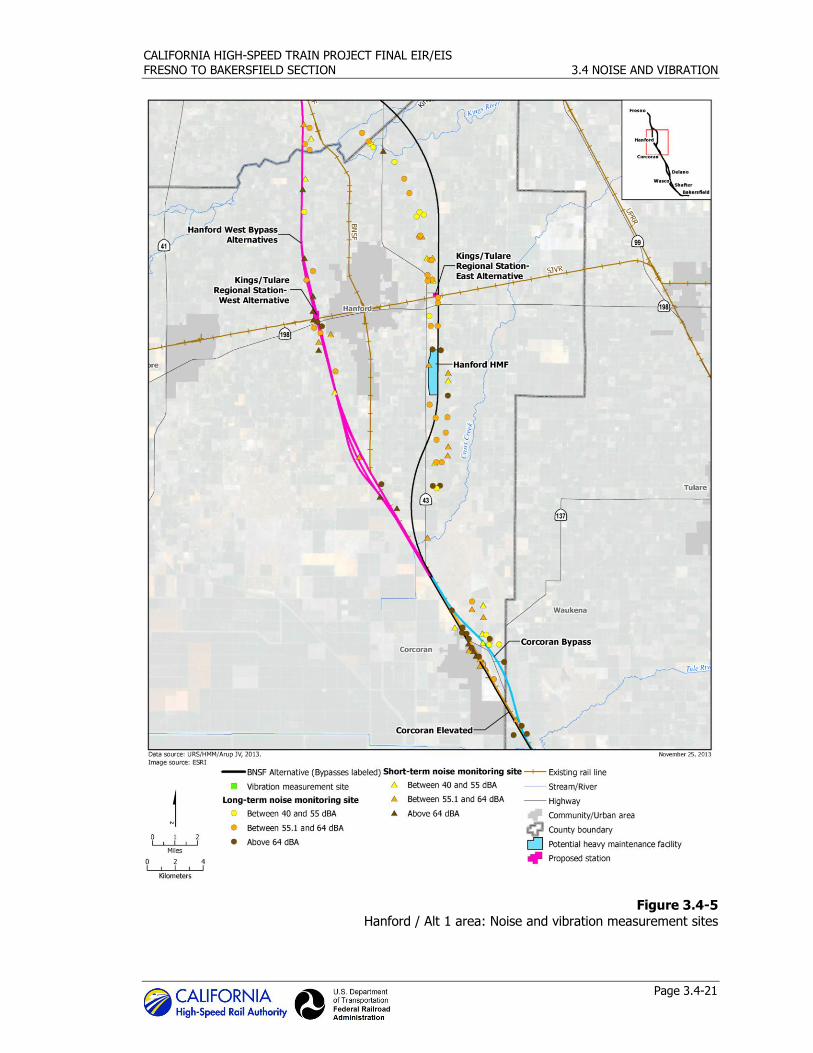
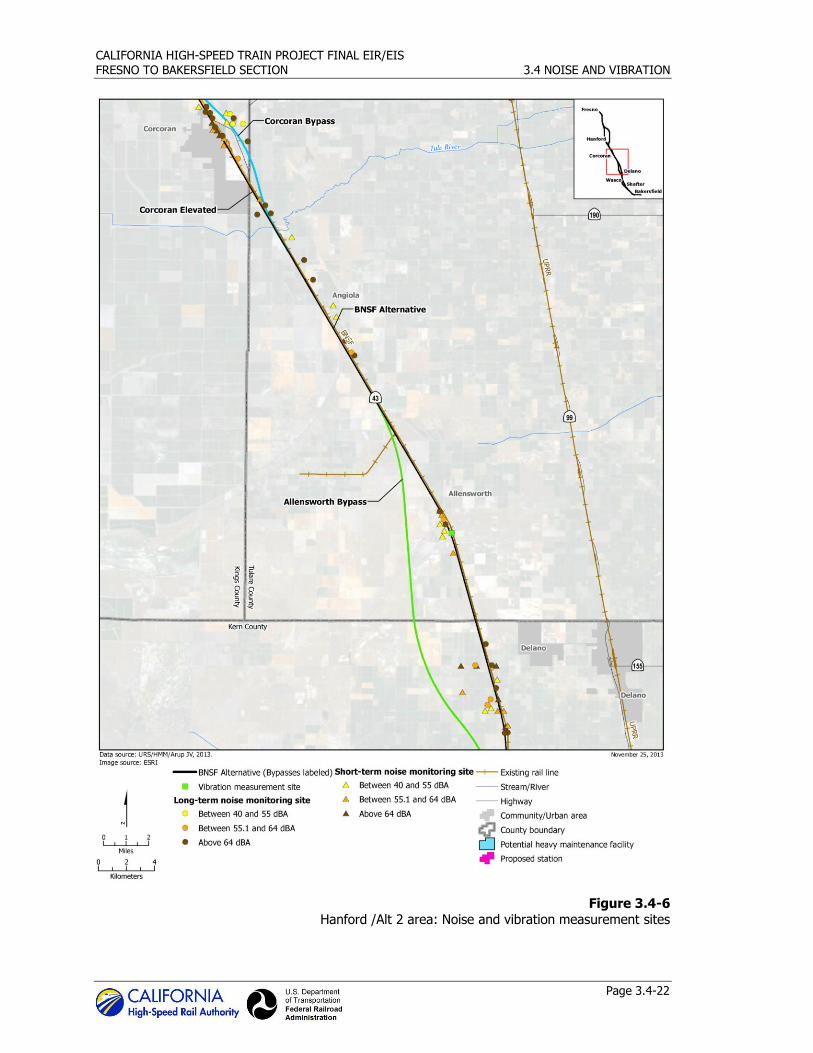
The noise measurement locations are shown graphically on Figures 3.4-4 through 3.4-8.
Summaries of the long- and short-term noise measurements are presented in Appendix 3.4-A NV
Table 1 (long–term measurements) and Appendix 3.4-A NV Table 2 (short-term measurements). Each measurement site listed in these tables consists of the measurement location identification
number, location address, a summary of noise sources, additional notes, and the resulting noise level.
The short-term noise measurements in Appendix 3.4-A NV Table 2 include the actual measured
short-term Leq values and the estimated Ldn values. These values were estimated by comparing the short-term measured values to the corresponding Leq values at a nearby long-term
measurement location that is subjected to a similar noise environment using the following
method:
A. Note the Leq value for the short-term measurement (60 minutes).
B. Compare the monitored short-term (ST) Leq value from step A to the monitored Leq value
for the nearby long-term (LT) measurement location for the same measurement period used for
the short-term (ST) Leq value.
Then
Leq (ST) – Leq(simultaneous) (LT) = delta
and
Ldn (ST) = Ldn (LT) + delta.
The area around the proposed station in Fresno is developed primarily with commercial and
industrial land uses, with some residential land uses mixed in. The noise environment in this area is dominated by traffic on the local streets, traffic on the freeways that surround the downtown
area, and noise from train operations along the Union Pacific Railroad mainline. Noise levels were
measured at the noise-sensitive land uses throughout the area, as indicated in Section 3.4.3, and the measured noise levels ranged from 61 dBA Ldn along one of the quieter streets to 72 dBA Ldn
near the railroad. These noise levels are typical for urban settings dominated by vehicular traffic and railroad operations. The alternative alignment would proceed southeast from the Fresno
station, pass SR 41 and approach the BNSF rail yard. The sensitive land uses in this area are
subject to more roadway and railroad noise; the noise levels measured here range from 68 to 75 dBA Ldn.
CALIFORNIA HIGH-SPEED TRAIN PROJECT FINAL EIR/EIS
FRESNO TO BAKERSFIELD SECTION 3.4 NOISE AND VIBRATION
Page 3.4-20
Figure 3.4-4
Fresno area: Noise and vibration measurement sites
CALIFORNIA HIGH-SPEED TRAIN PROJECT FINAL EIR/EIS
FRESNO TO BAKERSFIELD SECTION 3.4 NOISE AND VIBRATION
Page 3.4-21
Figure 3.4-5
Hanford / Alt 1 area: Noise and vibration measurement sites
CALIFORNIA HIGH-SPEED TRAIN PROJECT FINAL EIR/EIS
FRESNO TO BAKERSFIELD SECTION 3.4 NOISE AND VIBRATION
Page 3.4-22
Figure 3.4-6
Hanford /Alt 2 area: Noise and vibration measurement sites
CALIFORNIA HIGH-SPEED TRAIN PROJECT FINAL EIR/EIS
FRESNO TO BAKERSFIELD SECTION 3.4 NOISE AND VIBRATION
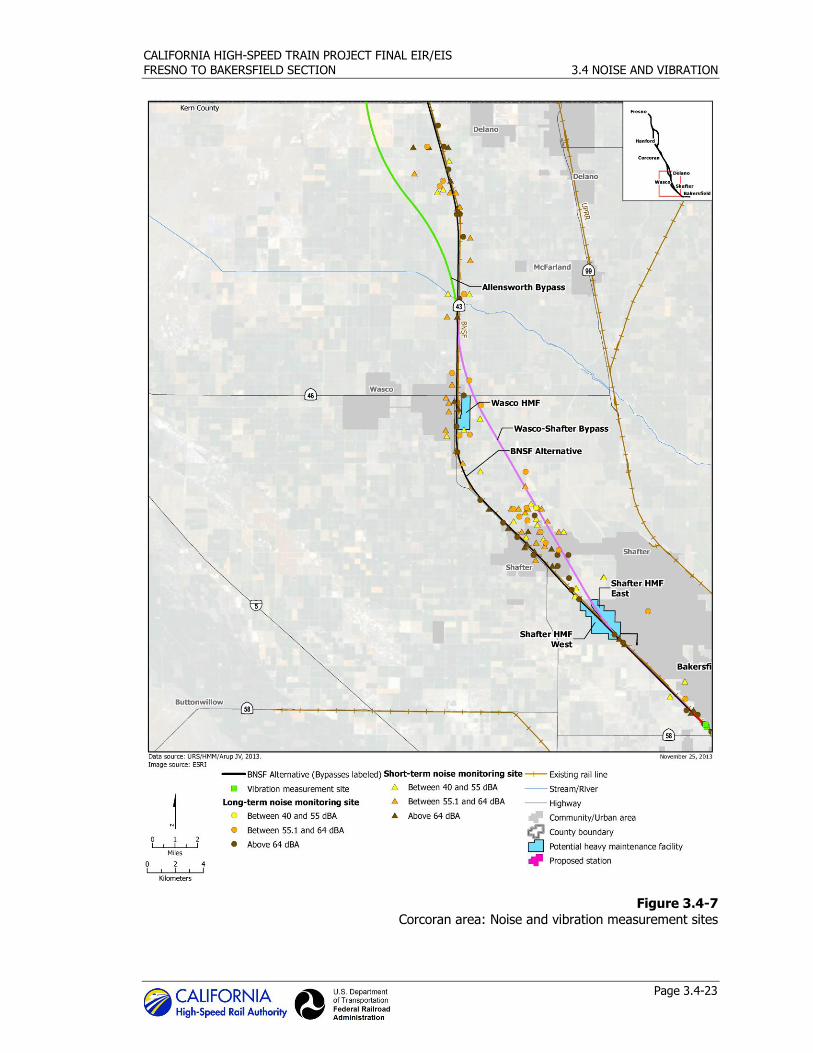
Page 3.4-23
Figure 3.4-7
Corcoran area: Noise and vibration measurement sites
CALIFORNIA HIGH-SPEED TRAIN PROJECT FINAL EIR/EIS
FRESNO TO BAKERSFIELD SECTION 3.4 NOISE AND VIBRATION
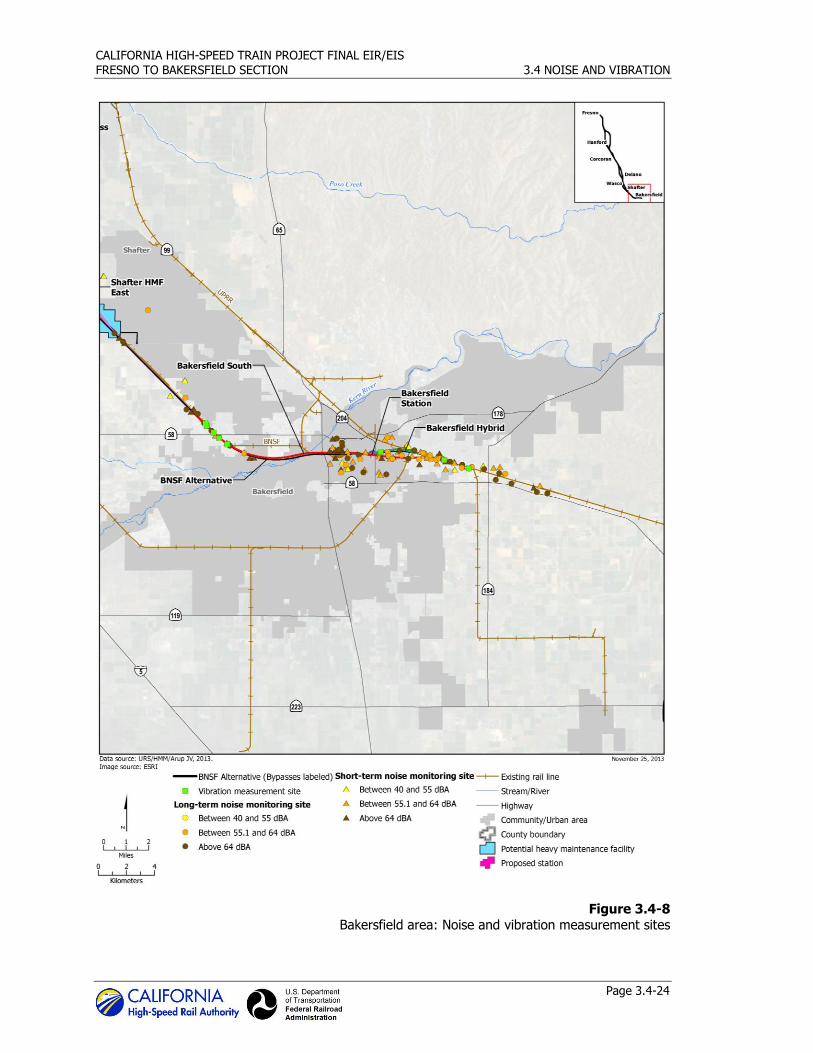
Page 3.4-24
Figure 3.4-8 Bakersfield area: Noise and vibration measurement sites
CALIFORNIA HIGH-SPEED TRAIN PROJECT FINAL EIR/EIS
FRESNO TO BAKERSFIELD SECTION 3.4 NOISE AND VIBRATION
Page 3.4-25
After the alignment passes Jensen Avenue, it turns to the south to follow the BNSF alignment,
passing over SR 99. South of East Malaga Avenue, the alignment runs along the western side of the BNSF right-of-way, between Cedar Avenue to the west and Maple Avenue to the east. The
land uses in this area are primarily agricultural, with homes mostly along Cedar Avenue and Maple Avenue. One of the homes adjacent to the existing railroad line experienced a noise level
of 79 dBA Ldn. This site was dominated by train noise, with a total of 44 trains passing this
location in a 24-hour period. Another home farther south that is approximately 900 feet from the existing railroad experienced a noise level of 58 dBA Ldn, which is significantly quieter.
From this point, the project alignment follows the BNSF for approximately 12 miles through
primarily agricultural lands in the community of Monmouth in the unincorporated area of Fresno County. Along this portion of the alternative alignments, the measured ambient noise levels near
train operations ranged from 64 to 77 dBA Ldn. These noise levels are to be expected in areas near freight and passenger train operations. The median measured noise level for these same
sites without train operations ranged from 36 to 44 dBA Ldn; these noise levels are comparable to
the inside of a house during a quiet evening.
After crossing Conejo Avenue, the project alignment turns to the southeast, away from the BNSF
right-of-way, to bypass the community of Laton and to run around the eastern side of Hanford
where the Kings/Tulare Regional Station is proposed. The land uses in the area continue to be primarily agricultural. The measured ambient noise levels between Laton and SR 198 ranged
from 47 to 63 dBA Ldn. These noise levels are consistent with a rural environment with some vehicular traffic. The project alignment runs on the eastern side of SR 43 as it turns south toward
Corcoran. It runs halfway between 7th Street and 8th Street. The land uses along the alignment
between SR 198 and Corcoran are primarily dairy farms and fields of alfalfa. The measured ambient noise levels in this area range from 52 dBA Ldn at the homes away from busy roadways
to 72 dBA Ldn for the homes adjacent to the main arterials.
Both the Hanford West Bypass 1 and Hanford West Bypass 2 alternatives deviate from the BNSF Alternative after crossing Elkhorn Avenue and heading south along the western side of Hanford.
The land use along these alternative alignments is primarily agricultural and residential. The measured ambient noise levels along the alternatives ranged from 48 dBA Ldn at the mid-end of
the alternative alignments to 77 dBA Ldn at the southern end of the alternative alignments. These
noise levels are to be expected for an agricultural environment where irregular farming activities take place.
Just south of Idaho Avenue, the project alignment curves to the southwest, crosses SR 43, then
curves to the left in order to meet up with the BNSF alignment on the northern side of Corcoran. South of Nevada Avenue, the Corcoran Bypass Alternative curves toward the east to bypass
Corcoran around the eastern side. Noise measurements made along the alignment through the City of Corcoran ranged from 64 to 81 dBA Ldn. These noise levels are consistent with homes
adjacent to commercial and industrial sites that are exposed to highway traffic and railroad
operations. Around the eastern side of Corcoran, noise levels measured at homes away from SR 43 and other major roads ranged from 48 to 61 dBA Ldn.
South of Corcoran, the BNSF Alternative and the Corcoran Bypass Alternative rejoin between
Avenue 144 and Avenue 136, and run along the western side of SR 43. The land use in the area is agricultural, with a mix of orchards, alfalfa, and dairy. The noise levels measured along the
Pixley Alignment ranged from 59 to 70 dBA Ldn. These noise levels are consistent with expectations for homes along a two-lane highway and an active rail line.
In the vicinity of Allensworth, the measured noise levels for the homes near the BNSF right-of-
way ranged from 62 to 76 dBA Ldn. For homes farther from the tracks, the measured noise levels
were from 47 to 63 dBA Ldn levels that would be expected for a reasonably quiet neighborhood.
CALIFORNIA HIGH-SPEED TRAIN PROJECT FINAL EIR/EIS
FRESNO TO BAKERSFIELD SECTION 3.4 NOISE AND VIBRATION
Page 3.4-26
For the homes near both SR 43 and the BNSF right-of-way, the measured noise levels ranged
from 71 to 74 dBA Ldn.
South of Avenue 84, the Allensworth Bypass Alignment curves to the south in order to go around the Allensworth Historic Park and the Pixley Wildlife Refuge to the west. The Allensworth Bypass
Alignment rejoins the BNSF Alternative at Whisler Road, just north of the City of Wasco. The Wasco-Shafter Bypass alignment curves to the southeast to avoid the cities of Wasco and
Shafter, while the BNSF Alternative goes through the downtown areas of the cities of Wasco and Shafter, following the BNSF right-of-way as much as is practicable. The noise levels measured
along the BNSF Alternative through these cities generally ranged from 70 to 79 dBA Ldn. These
levels reflect the proximity to an active freight rail line.
The Wasco-Shafter Bypass Alternative goes through agricultural land and through some of the least-populated areas along the alternative alignment. Noise levels measured along this
alternative ranged from 54 to 61 dBA Ldn, which are levels to be expected in a quiet, rural environment. For the homes next to the well-traveled roadways, the noise levels ranged from 67
to 71 dBA Ldn.
South of Reina Road, the land uses transition from agricultural to residential, with several neighborhoods of single-family dwellings. Along this portion of the alternative alignments, noise
measurements were conducted in the rear yards of homes that back up to the existing BNSF
right-of-way. The noise levels measured at these homes ranged from 65 to 77 dBA Ldn. These levels are reflective of homes directly adjacent to a busy railroad line. Beyond this point, the
BNSF line and the project alternatives turn east toward the freight yard and station at Bakersfield. The land uses here are urban: roadways, freeways, and rail lines dominate the noise
environment. The noise measurements conducted near the alternative alignments and the proposed downtown Bakersfield station alternatives in this area ranged from 59 to 70 dBA Ldn,
which are consistent with an urban environment.
Heavy Maintenance Facility Alternatives
Fresno Works – Fresno: The land uses in this area are primarily agricultural, with scattered
housing units in the area. One of the homes adjacent to the existing railroad line experienced a noise level of 79 dBA Ldn. This site was dominated by train noise, with a total of 44 trains
passing this location in a 24-hour period. Another home farther south that is approximately
900 feet from the existing railroad experienced a noise level of 58 dBA Ldn.
Kings County – Hanford: The land uses in the area continue to be primarily agricultural with
adjacent rural community. The measured ambient noise levels ranged from 47 to 63 dBA Ldn. These noise levels are consistent with a rural environment with some vehicular traffic.
Kern Council of Governments – Wasco: The noise levels measured were generally ranged
from 70 to 79 dBA Ldn. These levels reflect the urban environment and the proximity to an
active freight rail line.
Kern Council of Governments – Shafter East: Noise levels generally ranged from 54 to 61 dBA
Ldn, which are levels to be expected in a quiet, rural environment. For the homes next to the well-traveled roadways, the noise levels ranged from 67 to 71 dBA Ldn.
Kern Council of Governments – Shafter West: Noise levels generally ranged from 54 to 61
dBA Ldn, which are levels to be expected in a quiet, rural environment. For the homes next to
the well-traveled roadways, the noise levels ranged from 67 to 71 dBA Ldn.
CALIFORNIA HIGH-SPEED TRAIN PROJECT FINAL EIR/EIS
FRESNO TO BAKERSFIELD SECTION 3.4 NOISE AND VIBRATION
Page 3.4-27
3.4.4.2 Existing Vibration Levels
Project analysts identified vibration sensitive areas (VSAs) within the study area by locating the
vibration-sensitive land use categories listed in Table 3.4-6 (i.e., residential and institutional) within an appropriate screening distance from the proposed HST alternatives. The screening
distances used to identify VSAs are based on FRA guidance, as listed in Table 3.4-9. Some of these VSAs are exposed to existing sources of ground-borne vibration. The existing levels were
measured by placing vibration sensors at representative vibration-sensitive locations throughout the corridor along the UPRR and BNSF tracks.
Vibration measurements were conducted at 9 locations representative of actual potentially
impacted areas that were within 220 feet of a HST alternative alignment and within
approximately 250 feet of an existing active rail line. The field vibration data were processed in an appropriate fashion for comparison with established FTA/FRA impact criteria (i.e., maximum
event vibration level) and then compared with the value generated by the FTA general vibration assessment procedure (using the Generalized Ground Surface Vibration Curve for “locomotive
powered passenger or freight”). The values calculated using this FTA method are described as representing the “upper range of measurement data for a well-maintained system,” so it is
expected that the majority of the field measurements collected for this project would be at or
below the FTA-predicted value.
Appendix 3.4-A NV Table 3 presents a summary of the vibration measurements, including measured vibration levels for various train-related vibration events and a comparison with
predicted values using the FTA prediction method. Appendix D of the Fresno to Bakersfield Section: Noise and Vibration Technical Report (Authority and FRA 2012) provides additional detail
on the field vibration measurements, including a sample of the field documentation procedures.
Appendix 3.4-A NV Table 3 shows the measured vibration levels were generally equal to or less than the levels predicted by the (conservative) FTA method (generally within about 0 to -8 VdB).
Two of the 9 measured locations (Vib-02 and Vib-07) displayed some vibration levels higher than
those predicted by the FTA method. The apparently efficient vibration propagation characteristics at these two locations were taken into account during the impact assessment. Several events
were more than 10 VdB lower than the predicted values. These results may have been due to either less efficient soil propagation characterizations at these locations or simply lower-than-
predicted isolated events. The predicted levels included the expectation of flat spots on the wheels, which are common on mixed freight trains and much less so on Amtrak trains. The lower
levels may also be due to lower actual train speeds than those estimated in the field.
Overall, a majority of the measurements were between 70 and 80 VdB with the highest
measured vibration level being 92 VdB and the lowest measurement being 59 VdB. Specific vibration measurements were not taken at the proposed station locations as none of the stations
had vibration sensitive receivers within the FRA screening distances. It is estimated that none of the station alternatives are expected to have vibration levels above residential standards.
Heavy Maintenance Facility (HMF) Alternatives
Similar to the proposed station alternatives, none of the HMF alternative sites had vibration
sensitive receivers within the FRA screening distances. Therefore, it is estimated that none of the HMF alternatives are expected to have vibration levels be above residential standards.
CALIFORNIA HIGH-SPEED TRAIN PROJECT FINAL EIR/EIS
FRESNO TO BAKERSFIELD SECTION 3.4 NOISE AND VIBRATION
Page 3.4-28
3.4.5 Environmental Consequences
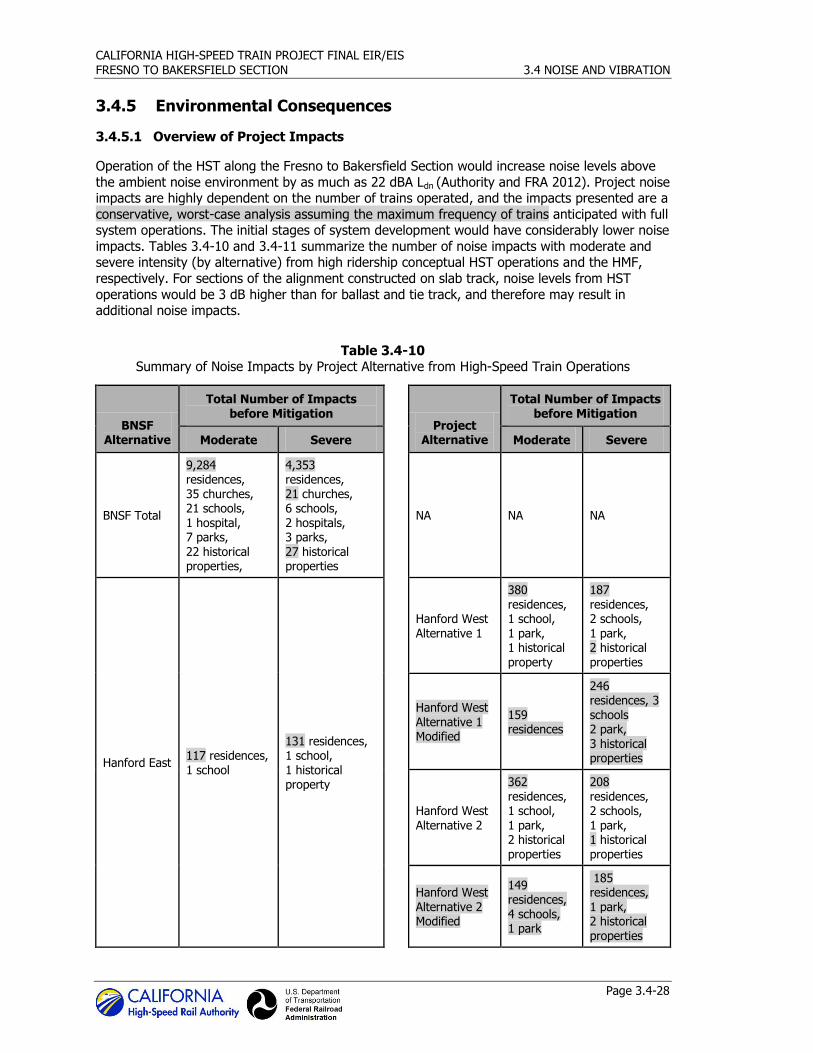
3.4.5.1 Overview of Project Impacts
Operation of the HST along the Fresno to Bakersfield Section would increase noise levels above
the ambient noise environment by as much as 22 dBA Ldn (Authority and FRA 2012). Project noise impacts are highly dependent on the number of trains operated, and the impacts presented are a
conservative, worst-case analysis assuming the maximum frequency of trains anticipated with full system operations. The initial stages of system development would have considerably lower noise
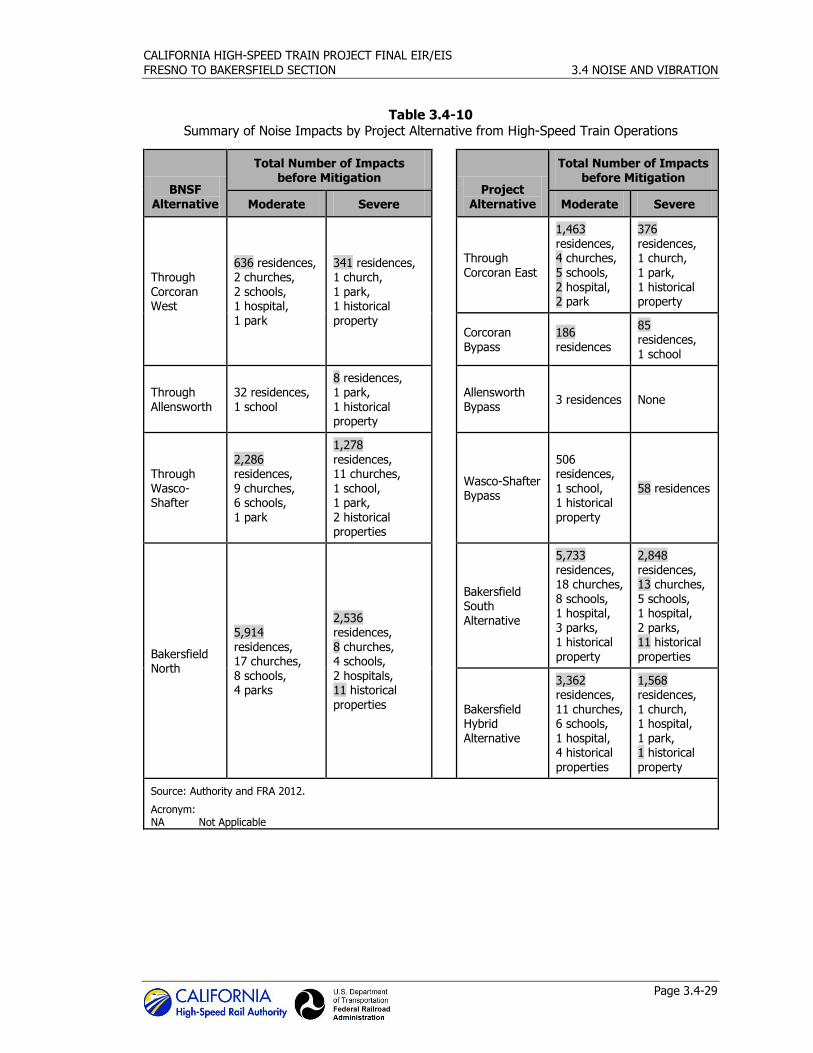
impacts. Tables 3.4-10 and 3.4-11 summarize the number of noise impacts with moderate and severe intensity (by alternative) from high ridership conceptual HST operations and the HMF,
respectively. For sections of the alignment constructed on slab track, noise levels from HST
operations would be 3 dB higher than for ballast and tie track, and therefore may result in additional noise impacts.
Table 3.4-10 Summary of Noise Impacts by Project Alternative from High-Speed Train Operations
BNSF Alternative
Total Number of Impacts before Mitigation
Project Alternative
Total Number of Impacts before Mitigation
Moderate Severe Moderate Severe
BNSF Total
9,284 residences, 35 churches, 21 schools, 1 hospital, 7 parks, 22 historical properties,
4,353 residences, 21 churches, 6 schools, 2 hospitals, 3 parks, 27 historical properties
NA NA NA
Hanford East 117 residences, 1 school
131 residences, 1 school, 1 historical property
Hanford West Alternative 1
380 residences, 1 school, 1 park, 1 historical property
187 residences, 2 schools, 1 park, 2 historical properties
Hanford West Alternative 1 Modified
159 residences
246 residences, 3 schools 2 park, 3 historical properties
Hanford West Alternative 2
362 residences, 1 school, 1 park, 2 historical properties
208 residences, 2 schools, 1 park, 1 historical properties
Hanford West Alternative 2 Modified
149 residences, 4 schools, 1 park
185 residences, 1 park, 2 historical properties
CALIFORNIA HIGH-SPEED TRAIN PROJECT FINAL EIR/EIS
FRESNO TO BAKERSFIELD SECTION 3.4 NOISE AND VIBRATION
Page 3.4-29
Table 3.4-10 Summary of Noise Impacts by Project Alternative from High-Speed Train Operations
BNSF Alternative
Total Number of Impacts before Mitigation
Project Alternative
Total Number of Impacts before Mitigation
Moderate Severe Moderate Severe
Through Corcoran West
636 residences, 2 churches, 2 schools, 1 hospital, 1 park
341 residences, 1 church, 1 park, 1 historical property
Through Corcoran East
1,463 residences, 4 churches, 5 schools, 2 hospital, 2 park
376 residences, 1 church, 1 park, 1 historical property
Corcoran
Bypass
186
residences
85 residences,
1 school
Through Allensworth
32 residences, 1 school
8 residences, 1 park, 1 historical property
Allensworth Bypass
3 residences None
Through Wasco-Shafter
2,286 residences, 9 churches, 6 schools, 1 park
1,278 residences, 11 churches, 1 school, 1 park, 2 historical properties
Wasco-Shafter Bypass
506 residences, 1 school, 1 historical property
58 residences
Bakersfield North
5,914 residences, 17 churches, 8 schools, 4 parks
2,536 residences, 8 churches, 4 schools, 2 hospitals, 11 historical properties
Bakersfield South Alternative
5,733 residences, 18 churches, 8 schools, 1 hospital, 3 parks, 1 historical property
2,848 residences, 13 churches, 5 schools, 1 hospital, 2 parks, 11 historical properties
Bakersfield Hybrid Alternative
3,362 residences, 11 churches, 6 schools, 1 hospital, 4 historical properties
1,568 residences, 1 church, 1 hospital, 1 park, 1 historical property
Source: Authority and FRA 2012.
Acronym: NA Not Applicable
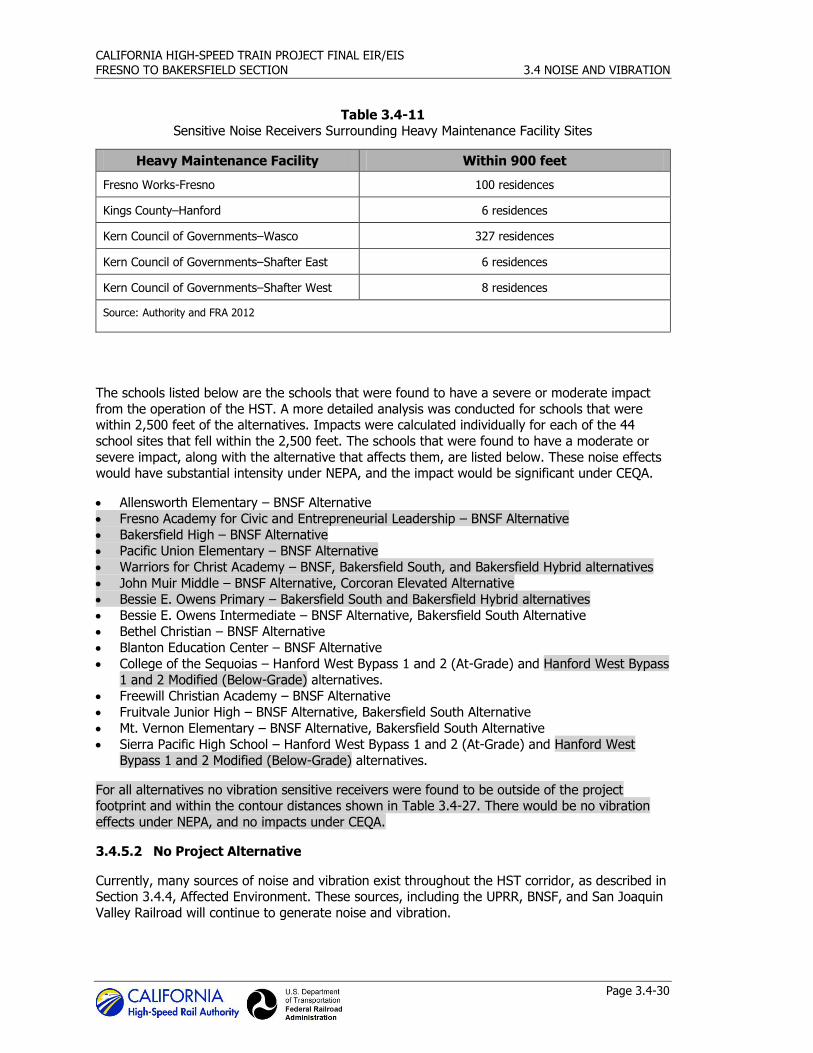
CALIFORNIA HIGH-SPEED TRAIN PROJECT FINAL EIR/EIS
FRESNO TO BAKERSFIELD SECTION 3.4 NOISE AND VIBRATION
Page 3.4-30
Table 3.4-11 Sensitive Noise Receivers Surrounding Heavy Maintenance Facility Sites
Heavy Maintenance Facility Within 900 feet
Fresno Works-Fresno 100 residences
Kings County–Hanford 6 residences
Kern Council of Governments–Wasco 327 residences
Kern Council of Governments–Shafter East 6 residences
Kern Council of Governments–Shafter West 8 residences
Source: Authority and FRA 2012
The schools listed below are the schools that were found to have a severe or moderate impact
from the operation of the HST. A more detailed analysis was conducted for schools that were within 2,500 feet of the alternatives. Impacts were calculated individually for each of the 44
school sites that fell within the 2,500 feet. The schools that were found to have a moderate or
severe impact, along with the alternative that affects them, are listed below. These noise effects would have substantial intensity under NEPA, and the impact would be significant under CEQA.
Allensworth Elementary – BNSF Alternative
Fresno Academy for Civic and Entrepreneurial Leadership – BNSF Alternative
Bakersfield High – BNSF Alternative
Pacific Union Elementary – BNSF Alternative
Warriors for Christ Academy – BNSF, Bakersfield South, and Bakersfield Hybrid alternatives
John Muir Middle – BNSF Alternative, Corcoran Elevated Alternative
Bessie E. Owens Primary – Bakersfield South and Bakersfield Hybrid alternatives
Bessie E. Owens Intermediate – BNSF Alternative, Bakersfield South Alternative
Bethel Christian – BNSF Alternative
Blanton Education Center – BNSF Alternative
College of the Sequoias – Hanford West Bypass 1 and 2 (At-Grade) and Hanford West Bypass
1 and 2 Modified (Below-Grade) alternatives.
Freewill Christian Academy – BNSF Alternative
Fruitvale Junior High – BNSF Alternative, Bakersfield South Alternative
Mt. Vernon Elementary – BNSF Alternative, Bakersfield South Alternative
Sierra Pacific High School – Hanford West Bypass 1 and 2 (At-Grade) and Hanford West
Bypass 1 and 2 Modified (Below-Grade) alternatives.
For all alternatives no vibration sensitive receivers were found to be outside of the project footprint and within the contour distances shown in Table 3.4-27. There would be no vibration
effects under NEPA, and no impacts under CEQA.
3.4.5.2 No Project Alternative
Currently, many sources of noise and vibration exist throughout the HST corridor, as described in Section 3.4.4, Affected Environment. These sources, including the UPRR, BNSF, and San Joaquin
Valley Railroad will continue to generate noise and vibration.
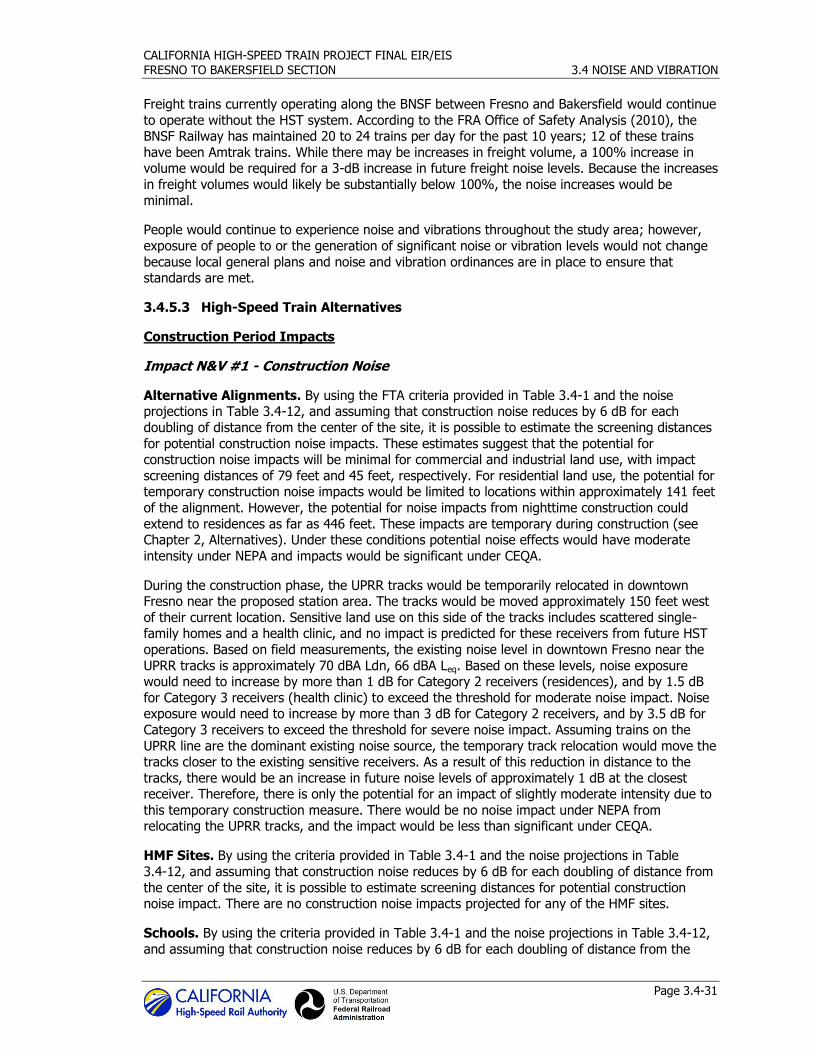
CALIFORNIA HIGH-SPEED TRAIN PROJECT FINAL EIR/EIS
FRESNO TO BAKERSFIELD SECTION 3.4 NOISE AND VIBRATION
Page 3.4-31
Freight trains currently operating along the BNSF between Fresno and Bakersfield would continue
to operate without the HST system. According to the FRA Office of Safety Analysis (2010), the BNSF Railway has maintained 20 to 24 trains per day for the past 10 years; 12 of these trains
have been Amtrak trains. While there may be increases in freight volume, a 100% increase in volume would be required for a 3-dB increase in future freight noise levels. Because the increases
in freight volumes would likely be substantially below 100%, the noise increases would be
minimal.
People would continue to experience noise and vibrations throughout the study area; however,
exposure of people to or the generation of significant noise or vibration levels would not change
because local general plans and noise and vibration ordinances are in place to ensure that standards are met.
3.4.5.3 High-Speed Train Alternatives
Construction Period Impacts
Impact N&V #1 - Construction Noise
Alternative Alignments. By using the FTA criteria provided in Table 3.4-1 and the noise projections in Table 3.4-12, and assuming that construction noise reduces by 6 dB for each
doubling of distance from the center of the site, it is possible to estimate the screening distances
for potential construction noise impacts. These estimates suggest that the potential for construction noise impacts will be minimal for commercial and industrial land use, with impact
screening distances of 79 feet and 45 feet, respectively. For residential land use, the potential for temporary construction noise impacts would be limited to locations within approximately 141 feet
of the alignment. However, the potential for noise impacts from nighttime construction could
extend to residences as far as 446 feet. These impacts are temporary during construction (see Chapter 2, Alternatives). Under these conditions potential noise effects would have moderate
intensity under NEPA and impacts would be significant under CEQA.
During the construction phase, the UPRR tracks would be temporarily relocated in downtown Fresno near the proposed station area. The tracks would be moved approximately 150 feet west
of their current location. Sensitive land use on this side of the tracks includes scattered single-family homes and a health clinic, and no impact is predicted for these receivers from future HST
operations. Based on field measurements, the existing noise level in downtown Fresno near the
UPRR tracks is approximately 70 dBA Ldn, 66 dBA Leq. Based on these levels, noise exposure would need to increase by more than 1 dB for Category 2 receivers (residences), and by 1.5 dB
for Category 3 receivers (health clinic) to exceed the threshold for moderate noise impact. Noise exposure would need to increase by more than 3 dB for Category 2 receivers, and by 3.5 dB for
Category 3 receivers to exceed the threshold for severe noise impact. Assuming trains on the
UPRR line are the dominant existing noise source, the temporary track relocation would move the tracks closer to the existing sensitive receivers. As a result of this reduction in distance to the
tracks, there would be an increase in future noise levels of approximately 1 dB at the closest receiver. Therefore, there is only the potential for an impact of slightly moderate intensity due to
this temporary construction measure. There would be no noise impact under NEPA from relocating the UPRR tracks, and the impact would be less than significant under CEQA.
HMF Sites. By using the criteria provided in Table 3.4-1 and the noise projections in Table
3.4-12, and assuming that construction noise reduces by 6 dB for each doubling of distance from
the center of the site, it is possible to estimate screening distances for potential construction noise impact. There are no construction noise impacts projected for any of the HMF sites.
Schools. By using the criteria provided in Table 3.4-1 and the noise projections in Table 3.4-12,
and assuming that construction noise reduces by 6 dB for each doubling of distance from the
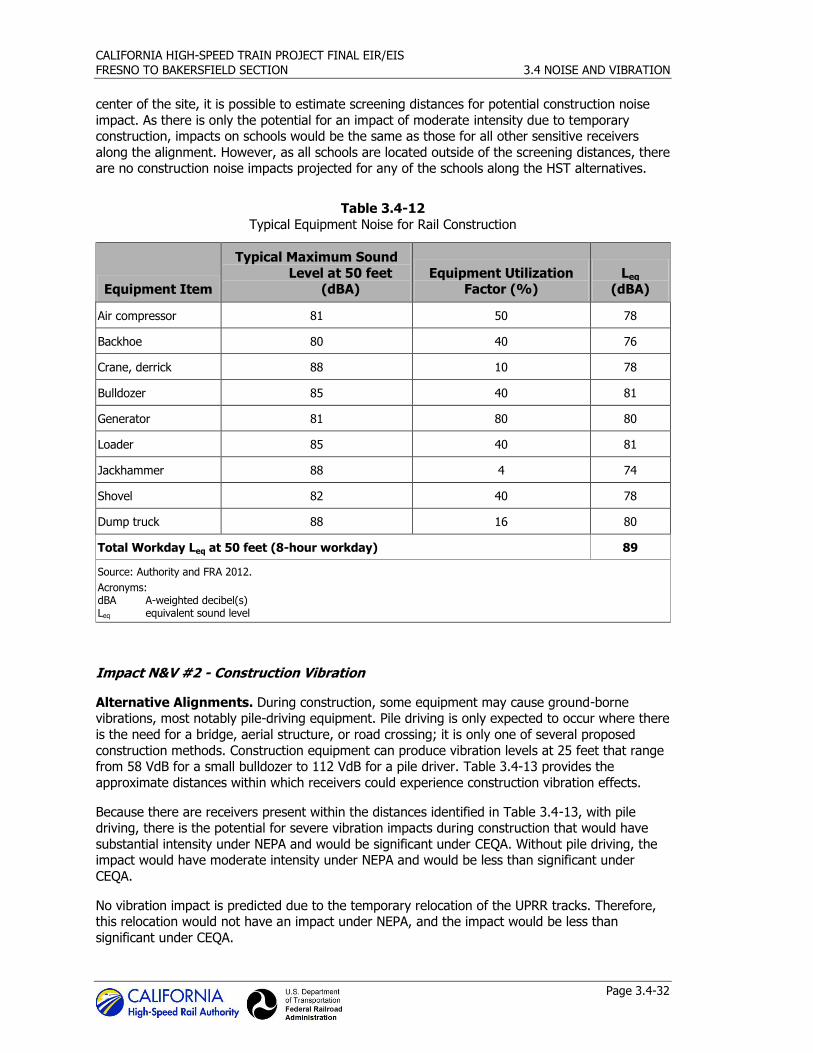
CALIFORNIA HIGH-SPEED TRAIN PROJECT FINAL EIR/EIS
FRESNO TO BAKERSFIELD SECTION 3.4 NOISE AND VIBRATION
Page 3.4-32
center of the site, it is possible to estimate screening distances for potential construction noise
impact. As there is only the potential for an impact of moderate intensity due to temporary construction, impacts on schools would be the same as those for all other sensitive receivers
along the alignment. However, as all schools are located outside of the screening distances, there are no construction noise impacts projected for any of the schools along the HST alternatives.
Table 3.4-12
Typical Equipment Noise for Rail Construction
Equipment Item
Typical Maximum Sound
Level at 50 feet (dBA)
Equipment Utilization Factor (%)
Leq (dBA)
Air compressor 81 50 78
Backhoe 80 40 76
Crane, derrick 88 10 78
Bulldozer 85 40 81
Generator 81 80 80
Loader 85 40 81
Jackhammer 88 4 74
Shovel 82 40 78
Dump truck 88 16 80
Total Workday Leq at 50 feet (8-hour workday) 89
Source: Authority and FRA 2012.
Acronyms: dBA A-weighted decibel(s) Leq equivalent sound level
Impact N&V #2 - Construction Vibration
Alternative Alignments. During construction, some equipment may cause ground-borne vibrations, most notably pile-driving equipment. Pile driving is only expected to occur where there
is the need for a bridge, aerial structure, or road crossing; it is only one of several proposed
construction methods. Construction equipment can produce vibration levels at 25 feet that range from 58 VdB for a small bulldozer to 112 VdB for a pile driver. Table 3.4-13 provides the
approximate distances within which receivers could experience construction vibration effects.
Because there are receivers present within the distances identified in Table 3.4-13, with pile driving, there is the potential for severe vibration impacts during construction that would have
substantial intensity under NEPA and would be significant under CEQA. Without pile driving, the impact would have moderate intensity under NEPA and would be less than significant under
CEQA.
No vibration impact is predicted due to the temporary relocation of the UPRR tracks. Therefore, this relocation would not have an impact under NEPA, and the impact would be less than
significant under CEQA.
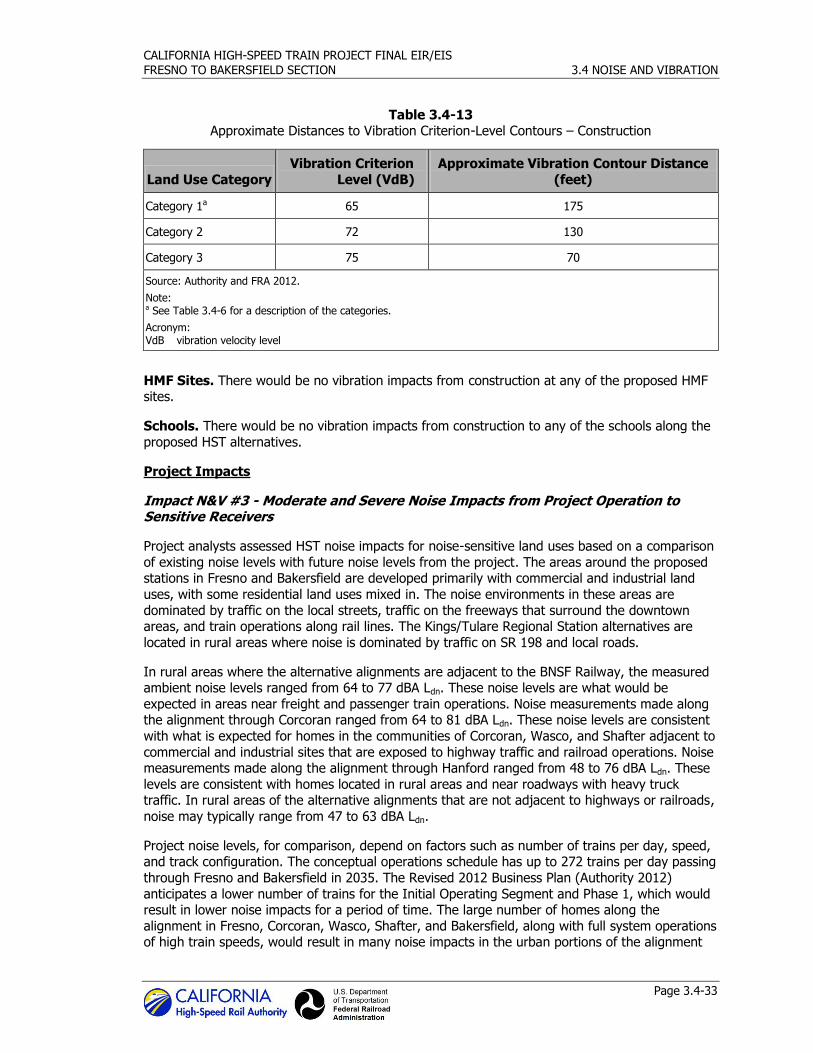
CALIFORNIA HIGH-SPEED TRAIN PROJECT FINAL EIR/EIS
FRESNO TO BAKERSFIELD SECTION 3.4 NOISE AND VIBRATION
Page 3.4-33
Table 3.4-13 Approximate Distances to Vibration Criterion-Level Contours – Construction
Land Use Category
Vibration Criterion
Level (VdB)
Approximate Vibration Contour Distance
(feet)
Category 1a 65 175
Category 2 72 130
Category 3 75 70
Source: Authority and FRA 2012.
Note: a See Table 3.4-6 for a description of the categories.
Acronym: VdB vibration velocity level
HMF Sites. There would be no vibration impacts from construction at any of the proposed HMF sites.
Schools. There would be no vibration impacts from construction to any of the schools along the
proposed HST alternatives.
Project Impacts
Impact N&V #3 - Moderate and Severe Noise Impacts from Project Operation to Sensitive Receivers
Project analysts assessed HST noise impacts for noise-sensitive land uses based on a comparison
of existing noise levels with future noise levels from the project. The areas around the proposed stations in Fresno and Bakersfield are developed primarily with commercial and industrial land
uses, with some residential land uses mixed in. The noise environments in these areas are
dominated by traffic on the local streets, traffic on the freeways that surround the downtown areas, and train operations along rail lines. The Kings/Tulare Regional Station alternatives are
located in rural areas where noise is dominated by traffic on SR 198 and local roads.
In rural areas where the alternative alignments are adjacent to the BNSF Railway, the measured ambient noise levels ranged from 64 to 77 dBA Ldn. These noise levels are what would be
expected in areas near freight and passenger train operations. Noise measurements made along the alignment through Corcoran ranged from 64 to 81 dBA Ldn. These noise levels are consistent
with what is expected for homes in the communities of Corcoran, Wasco, and Shafter adjacent to
commercial and industrial sites that are exposed to highway traffic and railroad operations. Noise measurements made along the alignment through Hanford ranged from 48 to 76 dBA Ldn. These
levels are consistent with homes located in rural areas and near roadways with heavy truck traffic. In rural areas of the alternative alignments that are not adjacent to highways or railroads,
noise may typically range from 47 to 63 dBA Ldn.
Project noise levels, for comparison, depend on factors such as number of trains per day, speed, and track configuration. The conceptual operations schedule has up to 272 trains per day passing
through Fresno and Bakersfield in 2035. The Revised 2012 Business Plan (Authority 2012)
anticipates a lower number of trains for the Initial Operating Segment and Phase 1, which would result in lower noise impacts for a period of time. The large number of homes along the
alignment in Fresno, Corcoran, Wasco, Shafter, and Bakersfield, along with full system operations of high train speeds, would result in many noise impacts in the urban portions of the alignment
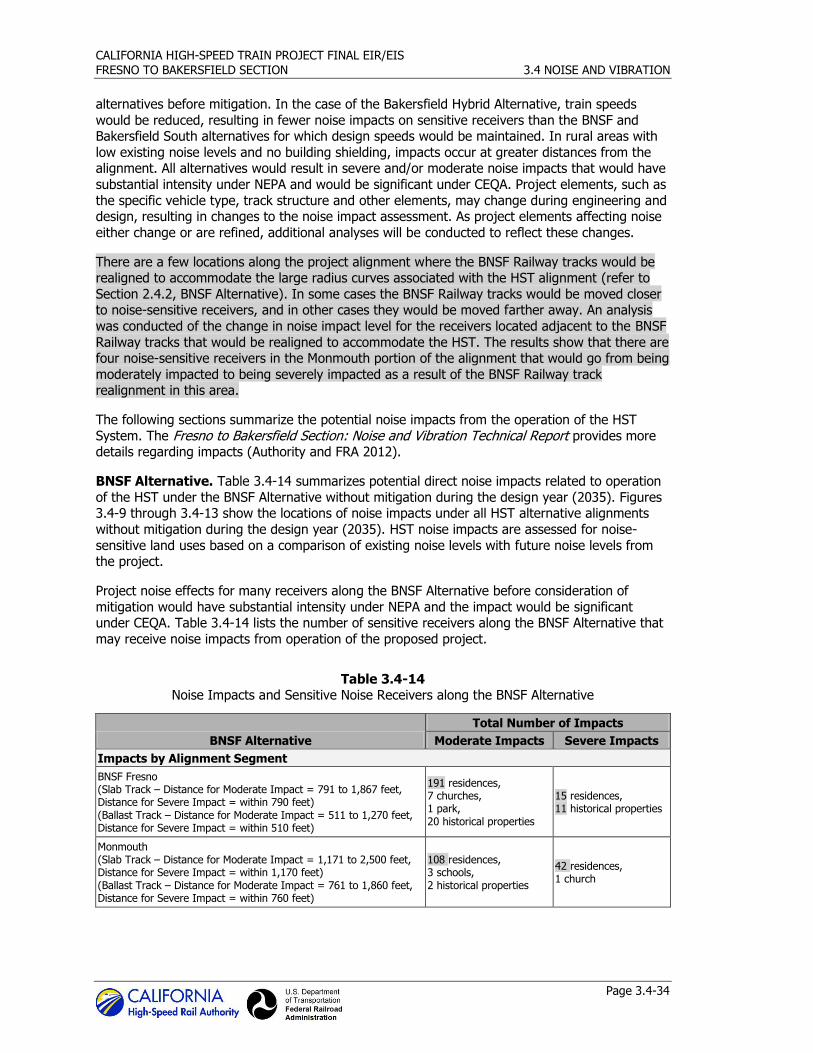
CALIFORNIA HIGH-SPEED TRAIN PROJECT FINAL EIR/EIS
FRESNO TO BAKERSFIELD SECTION 3.4 NOISE AND VIBRATION
Page 3.4-34
alternatives before mitigation. In the case of the Bakersfield Hybrid Alternative, train speeds
would be reduced, resulting in fewer noise impacts on sensitive receivers than the BNSF and Bakersfield South alternatives for which design speeds would be maintained. In rural areas with
low existing noise levels and no building shielding, impacts occur at greater distances from the alignment. All alternatives would result in severe and/or moderate noise impacts that would have
substantial intensity under NEPA and would be significant under CEQA. Project elements, such as
the specific vehicle type, track structure and other elements, may change during engineering and design, resulting in changes to the noise impact assessment. As project elements affecting noise
either change or are refined, additional analyses will be conducted to reflect these changes.
There are a few locations along the project alignment where the BNSF Railway tracks would be realigned to accommodate the large radius curves associated with the HST alignment (refer to
Section 2.4.2, BNSF Alternative). In some cases the BNSF Railway tracks would be moved closer to noise-sensitive receivers, and in other cases they would be moved farther away. An analysis
was conducted of the change in noise impact level for the receivers located adjacent to the BNSF
Railway tracks that would be realigned to accommodate the HST. The results show that there are four noise-sensitive receivers in the Monmouth portion of the alignment that would go from being
moderately impacted to being severely impacted as a result of the BNSF Railway track realignment in this area.
The following sections summarize the potential noise impacts from the operation of the HST
System. The Fresno to Bakersfield Section: Noise and Vibration Technical Report provides more details regarding impacts (Authority and FRA 2012).
BNSF Alternative. Table 3.4-14 summarizes potential direct noise impacts related to operation
of the HST under the BNSF Alternative without mitigation during the design year (2035). Figures 3.4-9 through 3.4-13 show the locations of noise impacts under all HST alternative alignments
without mitigation during the design year (2035). HST noise impacts are assessed for noise-
sensitive land uses based on a comparison of existing noise levels with future noise levels from the project.
Project noise effects for many receivers along the BNSF Alternative before consideration of
mitigation would have substantial intensity under NEPA and the impact would be significant under CEQA. Table 3.4-14 lists the number of sensitive receivers along the BNSF Alternative that
may receive noise impacts from operation of the proposed project.
Table 3.4-14 Noise Impacts and Sensitive Noise Receivers along the BNSF Alternative
BNSF Alternative
Total Number of Impacts
Moderate Impacts Severe Impacts
Impacts by Alignment Segment
BNSF Fresno (Slab Track – Distance for Moderate Impact = 791 to 1,867 feet, Distance for Severe Impact = within 790 feet) (Ballast Track – Distance for Moderate Impact = 511 to 1,270 feet, Distance for Severe Impact = within 510 feet)
191 residences, 7 churches, 1 park, 20 historical properties
15 residences, 11 historical properties
Monmouth (Slab Track – Distance for Moderate Impact = 1,171 to 2,500 feet, Distance for Severe Impact = within 1,170 feet) (Ballast Track – Distance for Moderate Impact = 761 to 1,860 feet, Distance for Severe Impact = within 760 feet)
108 residences, 3 schools, 2 historical properties
42 residences, 1 church
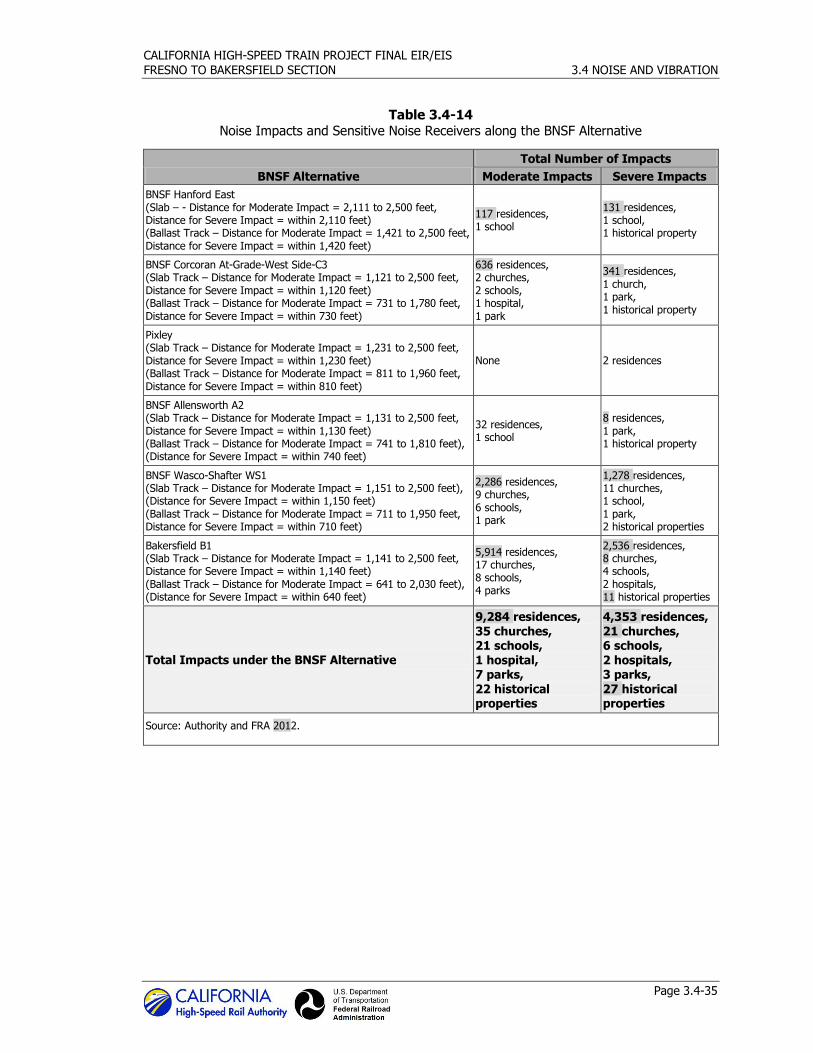
CALIFORNIA HIGH-SPEED TRAIN PROJECT FINAL EIR/EIS
FRESNO TO BAKERSFIELD SECTION 3.4 NOISE AND VIBRATION
Page 3.4-35
Table 3.4-14 Noise Impacts and Sensitive Noise Receivers along the BNSF Alternative
BNSF Alternative
Total Number of Impacts
Moderate Impacts Severe Impacts
BNSF Hanford East (Slab – - Distance for Moderate Impact = 2,111 to 2,500 feet, Distance for Severe Impact = within 2,110 feet) (Ballast Track – Distance for Moderate Impact = 1,421 to 2,500 feet, Distance for Severe Impact = within 1,420 feet)
117 residences, 1 school
131 residences, 1 school, 1 historical property
BNSF Corcoran At-Grade-West Side-C3 (Slab Track – Distance for Moderate Impact = 1,121 to 2,500 feet, Distance for Severe Impact = within 1,120 feet) (Ballast Track – Distance for Moderate Impact = 731 to 1,780 feet, Distance for Severe Impact = within 730 feet)
636 residences, 2 churches, 2 schools, 1 hospital, 1 park
341 residences, 1 church, 1 park, 1 historical property
Pixley (Slab Track – Distance for Moderate Impact = 1,231 to 2,500 feet, Distance for Severe Impact = within 1,230 feet) (Ballast Track – Distance for Moderate Impact = 811 to 1,960 feet, Distance for Severe Impact = within 810 feet)
None 2 residences
BNSF Allensworth A2 (Slab Track – Distance for Moderate Impact = 1,131 to 2,500 feet, Distance for Severe Impact = within 1,130 feet) (Ballast Track – Distance for Moderate Impact = 741 to 1,810 feet), (Distance for Severe Impact = within 740 feet)
32 residences, 1 school
8 residences, 1 park, 1 historical property
BNSF Wasco-Shafter WS1 (Slab Track – Distance for Moderate Impact = 1,151 to 2,500 feet), (Distance for Severe Impact = within 1,150 feet) (Ballast Track – Distance for Moderate Impact = 711 to 1,950 feet, Distance for Severe Impact = within 710 feet)
2,286 residences, 9 churches, 6 schools, 1 park
1,278 residences, 11 churches, 1 school, 1 park, 2 historical properties
Bakersfield B1 (Slab Track – Distance for Moderate Impact = 1,141 to 2,500 feet, Distance for Severe Impact = within 1,140 feet) (Ballast Track – Distance for Moderate Impact = 641 to 2,030 feet), (Distance for Severe Impact = within 640 feet)
5,914 residences, 17 churches, 8 schools, 4 parks
2,536 residences, 8 churches, 4 schools, 2 hospitals, 11 historical properties
Total Impacts under the BNSF Alternative
9,284 residences, 35 churches, 21 schools, 1 hospital, 7 parks, 22 historical properties
4,353 residences, 21 churches, 6 schools, 2 hospitals, 3 parks, 27 historical properties
Source: Authority and FRA 2012.
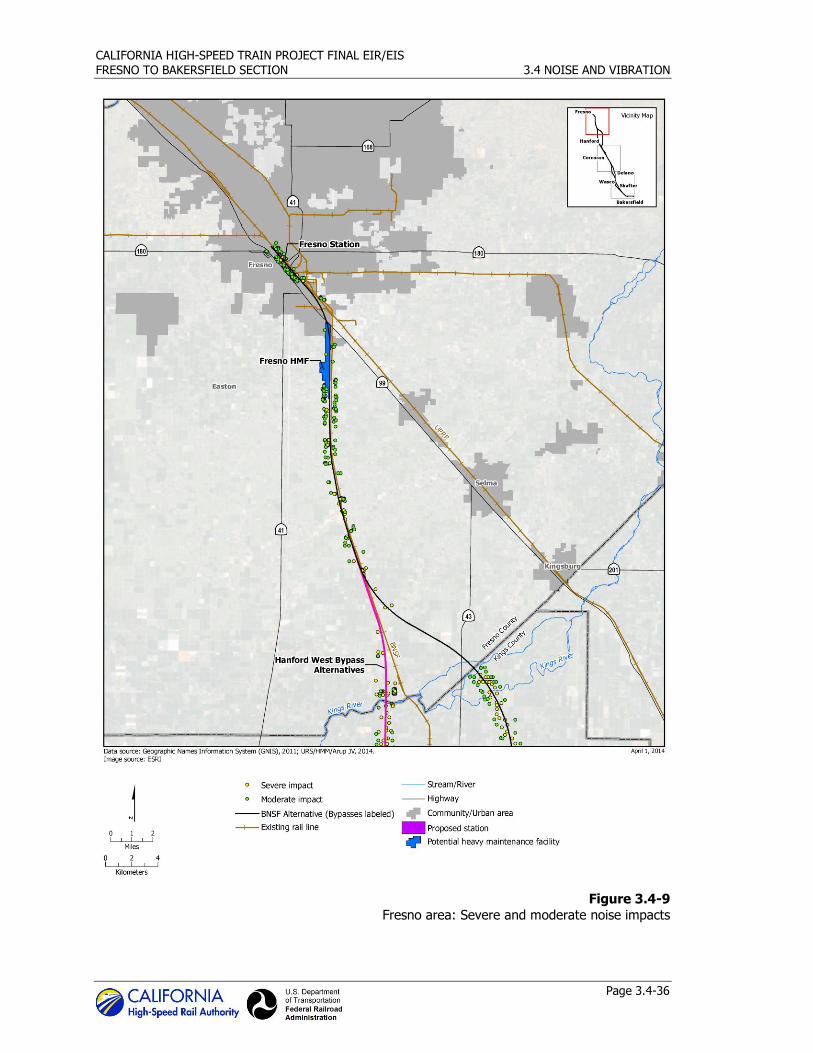
CALIFORNIA HIGH-SPEED TRAIN PROJECT FINAL EIR/EIS
FRESNO TO BAKERSFIELD SECTION 3.4 NOISE AND VIBRATION
Page 3.4-36
Figure 3.4-9
Fresno area: Severe and moderate noise impacts
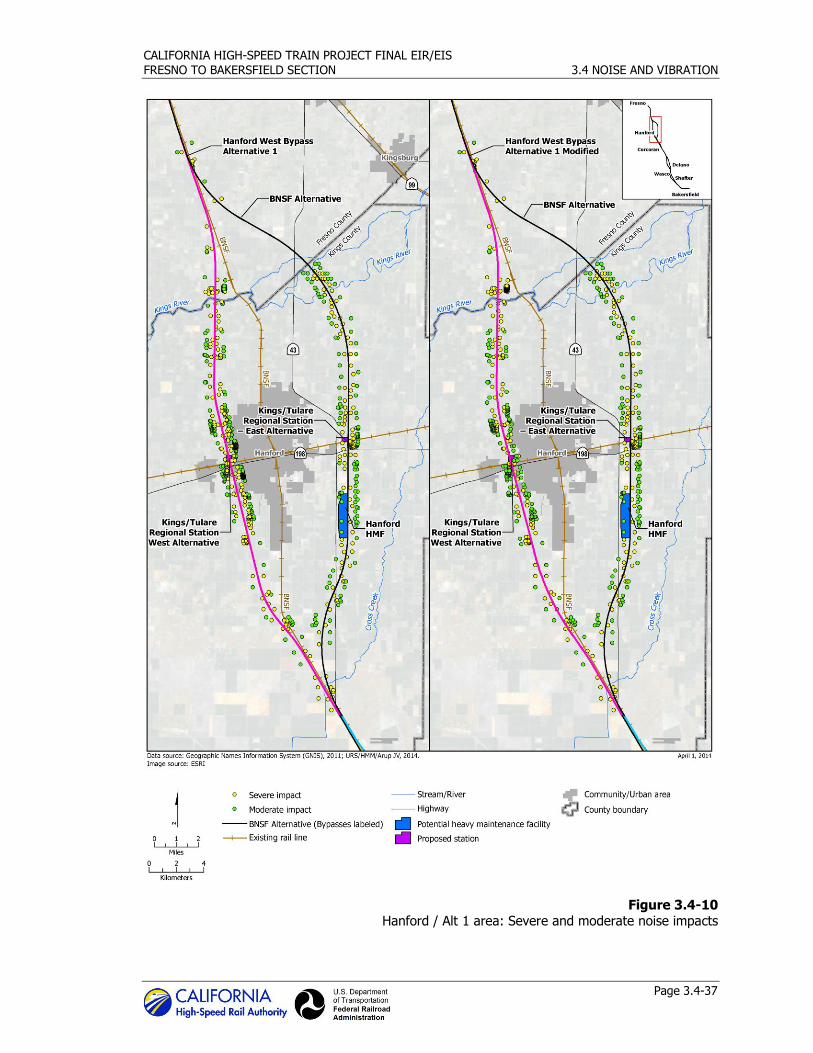
CALIFORNIA HIGH-SPEED TRAIN PROJECT FINAL EIR/EIS
FRESNO TO BAKERSFIELD SECTION 3.4 NOISE AND VIBRATION
Page 3.4-37
Figure 3.4-10 Hanford / Alt 1 area: Severe and moderate noise impacts
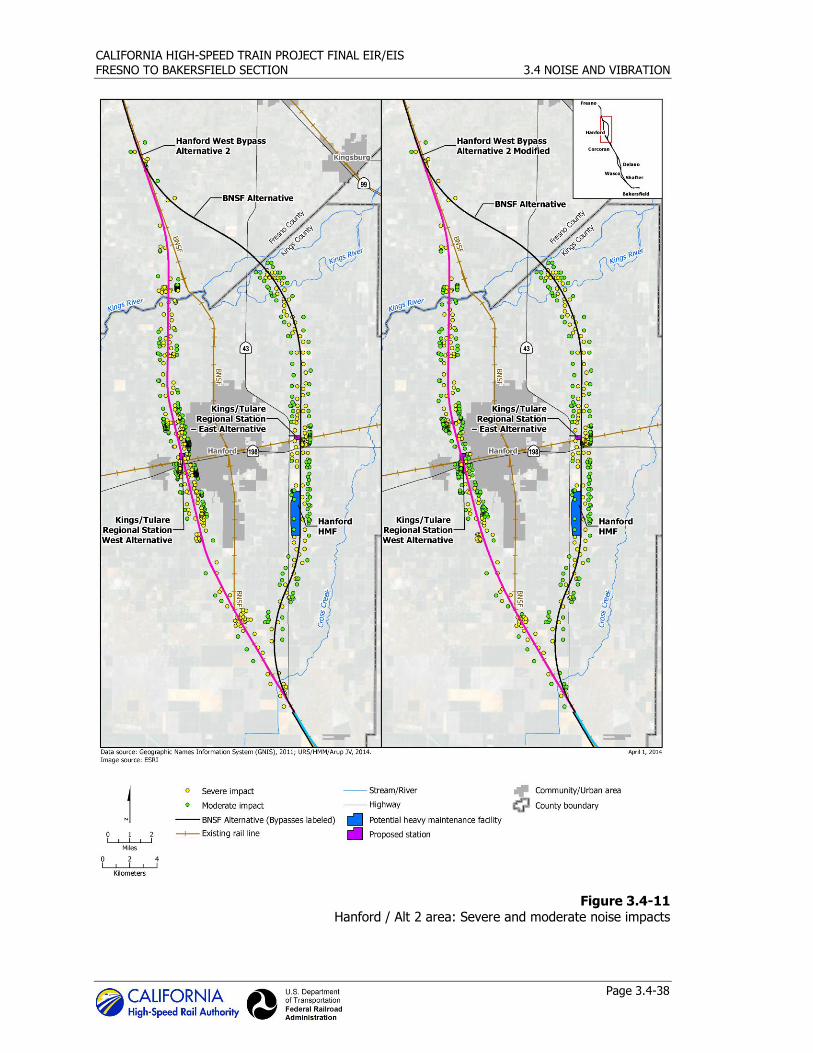
CALIFORNIA HIGH-SPEED TRAIN PROJECT FINAL EIR/EIS
FRESNO TO BAKERSFIELD SECTION 3.4 NOISE AND VIBRATION
Page 3.4-38
Figure 3.4-11 Hanford / Alt 2 area: Severe and moderate noise impacts
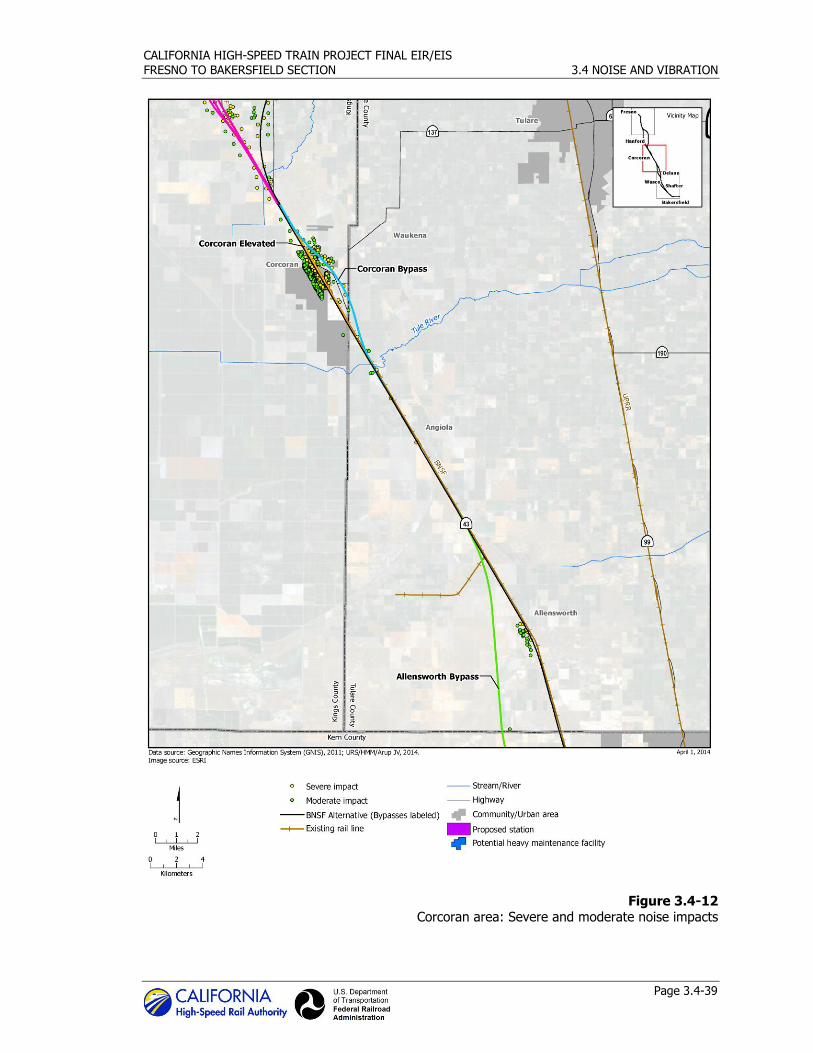
CALIFORNIA HIGH-SPEED TRAIN PROJECT FINAL EIR/EIS
FRESNO TO BAKERSFIELD SECTION 3.4 NOISE AND VIBRATION
Page 3.4-39
Figure 3.4-12 Corcoran area: Severe and moderate noise impacts
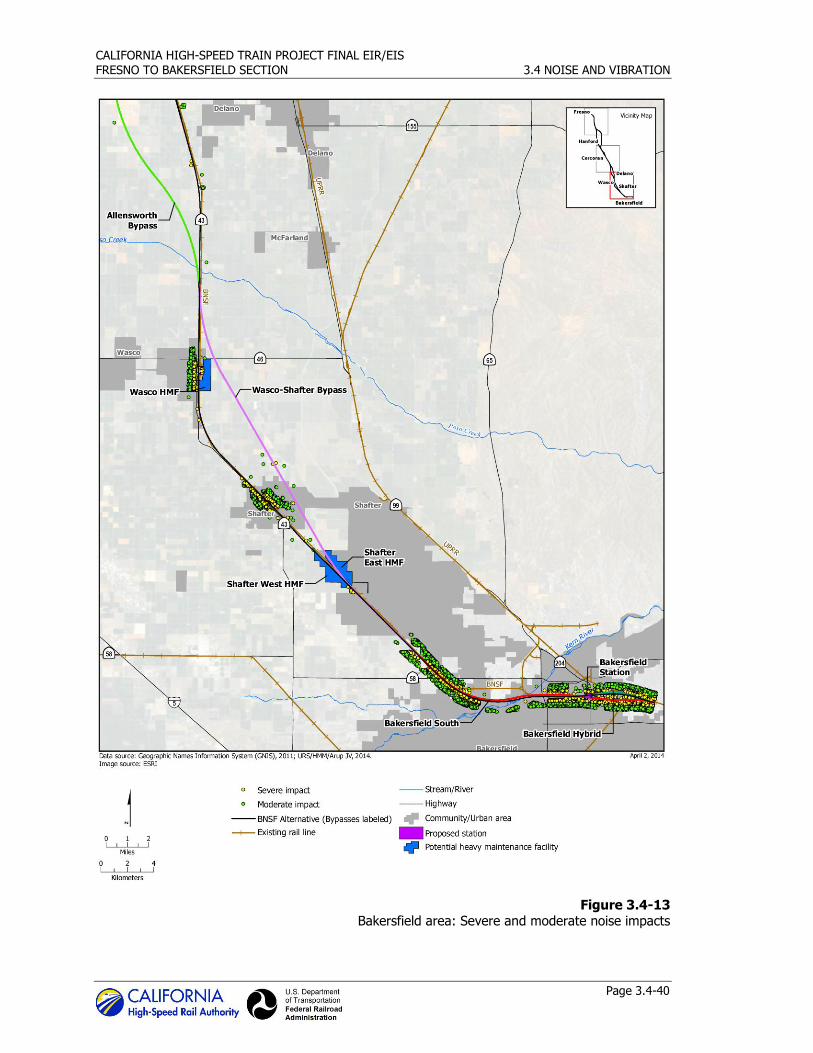
CALIFORNIA HIGH-SPEED TRAIN PROJECT FINAL EIR/EIS
FRESNO TO BAKERSFIELD SECTION 3.4 NOISE AND VIBRATION
Page 3.4-40
Figure 3.4-13 Bakersfield area: Severe and moderate noise impacts

CALIFORNIA HIGH-SPEED TRAIN PROJECT FINAL EIR/EIS
FRESNO TO BAKERSFIELD SECTION 3.4 NOISE AND VIBRATION
Page 3.4-41
Appendix 3.4-A NV Tables 4 and 5 show the potential noise impacts from the BNSF Alternative
without mitigation for the design year (2035) at each of the locations where existing noise measurements were conducted. These two tables show the measurement sites and the distance
from the receiver to the BNSF Alternative. These two tables also show the source height, land use type, measured existing noise level, projected HST noise level, and the moderate and severe
impact criteria. The projected HST noise level is compared with the impact criteria to determine
the locations with impacts. Finally, the two tables show the total noise level with the project, the projected noise level increase with the project, where there is no impact, and where noise would
have moderate or severe intensity due to the HST project.
Hanford West Bypass 1 Alternative. Noise effects before consideration of mitigation for many of the receivers along the Hanford West Bypass 1 Alternative would have substantial
intensity under NEPA, and the impact would be significant under CEQA. Tables 3.4-15 and 3.4-16 list the number of sensitive receivers along the Hanford West Bypass 1 Alternative, at-grade and
the Hanford West Bypass 1 Alternative Modified below-grade, respectively, that may receive
moderate or severe noise impacts from operation of the project. Appendix 3.4-A NV, Tables 6 through 11, list the potential noise impacts under these two options of the Hanford West Bypass
1 Alternative without mitigation for the design year (2035) at each of the locations where existing noise measurements were conducted.
Table 3.4-15 Noise Impacts for the Hanford West Bypass 1 Alternative – At-Grade
HST Alternative
Total Number of Impacts before
Mitigation
Moderate Severe
Hanford West Bypass 1 Alternative (At-Grade) 380 residences, 1 school, 1 park, 1 historical property
187 residences, 2 schools, 1 park, 2 historical properties
(Slab Track – Distance for Moderate Impact = 1,628 to 2,500 feet, Distance for Severe Impact = within 1,627 feet)
Source: Authority and FRA 2012.
Table 3.4-16 Noise Impacts for the Hanford West Bypass 1 Alternative Modified – Below-Grade
HST Alternative
Total Number of Impacts before Mitigation
Moderate Severe
Hanford West Bypass 1 Alternative Modified (Below-Grade)
159 residences,
246 residences,
3 schools 2 parks, 3 historical properties
(Slab Track Above-Grade - Distance to Moderate Impact = 2,500 feet, Distance to Severe Impact = 2,500 feet)
(Ballast Track At-Grade - Distance to Moderate Impact = 2,500 feet, Distance to Severe Impact = within 1,581 feet)
Slab Track Below-Grade - Distance to Moderate Impact = 854 to 2,058 feet, Distance to Severe Impact = within 853 feet)
Source: Authority and FRA 2012.

CALIFORNIA HIGH-SPEED TRAIN PROJECT FINAL EIR/EIS
FRESNO TO BAKERSFIELD SECTION 3.4 NOISE AND VIBRATION
Page 3.4-42
Hanford West Bypass 2 Alternative. Noise effects before consideration of mitigation for
many of the receivers along the Hanford West Bypass 2 Alternative would have substantial intensity under NEPA, and the impact would be significant under CEQA. Tables 3.4-17 and 3.4-18
list the number of sensitive receivers along the Hanford West Bypass 2 Alternative, at-grade, and the Hanford West Bypass 2 Alternative Modified, below-grade, respectively, that may receive
moderate or severe noise impacts from operation of the project. Appendix 3.4-A NV, Tables 12
through 17, list the potential noise impacts under these two options of the Hanford West Bypass 2 Alternative without mitigation for the design year (2035) at each of the locations where existing
noise measurements were conducted.
Table 3.4-17 Noise Impacts for Hanford West Bypass 2 Alternative – At-Grade
HST Alternative
Total Number of Impacts before
Mitigation
Moderate Severe
Hanford West Bypass 2 Alternative (At-Grade) 362 residences, 1 school, 1 park, 2 historical properties
208 residences, 2 schools, 1 park, 1 historical property
(Slab Track – Distance for Moderate Impact = 1,689 to 2,500 feet, Distance for Severe Impact = within 1,688 feet)
Source: Authority and FRA 2012.
Table 3.4-18 Noise Impacts for Hanford West Bypass 2 Alternative Modified – Below-Grade
HST Alternative
Total Number of Impacts before
Mitigation
Moderate Severe
Hanford West Bypass 2 Alternative Modified (Below-Grade)
149residences, 4 school, 1 park
185 residences, 1 park, 2 historical properties
(Slab Track Above-Grade - Distance to Moderate Impact = 2,500 feet, Distance to Severe Impact = 2,500 feet)
(Ballast Track At-Grade - Distance = 1,582 to 2,500 feet, Distance to Severe Impact = within 1,581 feet)
Slab Track Below-Grade - Distance to Moderate Impact = 854 to 2,058 feet, Distance to Severe Impact = within 853 feet)
Source: Authority and FRA 2012.
Corcoran Elevated. Noise effects before consideration of mitigation for many of the receivers along the Corcoran Elevated Alternative would have substantial intensity under NEPA and the
impact would be significant under CEQA. Table 3.4-19 lists the number of sensitive receivers
along this alternative that may have moderate or severe noise impacts from operation of the proposed project. There are 35 additional receivers that would be severely impacted by noise and
100 additional receivers that would be moderately impacted by noise with the Corcoran Elevated
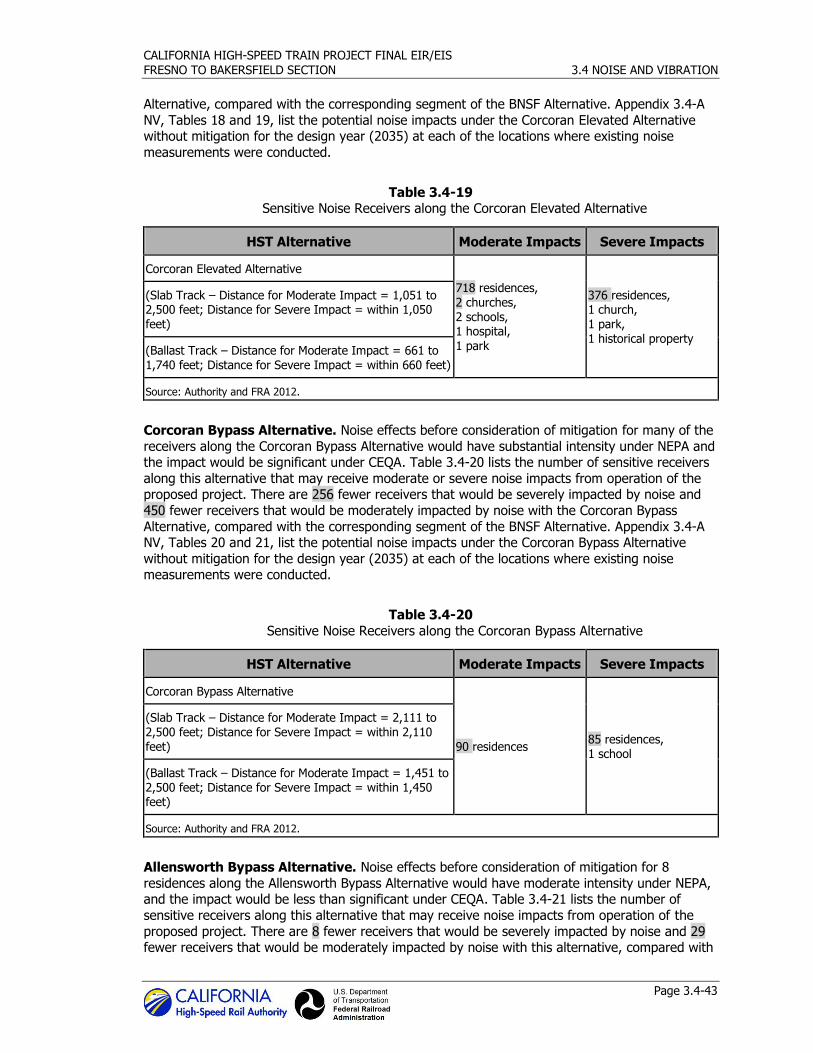
CALIFORNIA HIGH-SPEED TRAIN PROJECT FINAL EIR/EIS
FRESNO TO BAKERSFIELD SECTION 3.4 NOISE AND VIBRATION
Page 3.4-43
Alternative, compared with the corresponding segment of the BNSF Alternative. Appendix 3.4-A
NV, Tables 18 and 19, list the potential noise impacts under the Corcoran Elevated Alternative without mitigation for the design year (2035) at each of the locations where existing noise
measurements were conducted.
Table 3.4-19 Sensitive Noise Receivers along the Corcoran Elevated Alternative
HST Alternative Moderate Impacts Severe Impacts
Corcoran Elevated Alternative
718 residences, 2 churches, 2 schools, 1 hospital,
1 park
376 residences, 1 church, 1 park, 1 historical property
(Slab Track – Distance for Moderate Impact = 1,051 to 2,500 feet; Distance for Severe Impact = within 1,050 feet)
(Ballast Track – Distance for Moderate Impact = 661 to 1,740 feet; Distance for Severe Impact = within 660 feet)
Source: Authority and FRA 2012.
Corcoran Bypass Alternative. Noise effects before consideration of mitigation for many of the
receivers along the Corcoran Bypass Alternative would have substantial intensity under NEPA and the impact would be significant under CEQA. Table 3.4-20 lists the number of sensitive receivers
along this alternative that may receive moderate or severe noise impacts from operation of the proposed project. There are 256 fewer receivers that would be severely impacted by noise and
450 fewer receivers that would be moderately impacted by noise with the Corcoran Bypass
Alternative, compared with the corresponding segment of the BNSF Alternative. Appendix 3.4-A NV, Tables 20 and 21, list the potential noise impacts under the Corcoran Bypass Alternative
without mitigation for the design year (2035) at each of the locations where existing noise measurements were conducted.
Table 3.4-20
Sensitive Noise Receivers along the Corcoran Bypass Alternative
HST Alternative Moderate Impacts Severe Impacts
Corcoran Bypass Alternative
90 residences 85 residences, 1 school
(Slab Track – Distance for Moderate Impact = 2,111 to 2,500 feet; Distance for Severe Impact = within 2,110 feet)
(Ballast Track – Distance for Moderate Impact = 1,451 to 2,500 feet; Distance for Severe Impact = within 1,450 feet)
Source: Authority and FRA 2012.
Allensworth Bypass Alternative. Noise effects before consideration of mitigation for 8
residences along the Allensworth Bypass Alternative would have moderate intensity under NEPA, and the impact would be less than significant under CEQA. Table 3.4-21 lists the number of
sensitive receivers along this alternative that may receive noise impacts from operation of the
proposed project. There are 8 fewer receivers that would be severely impacted by noise and 29 fewer receivers that would be moderately impacted by noise with this alternative, compared with
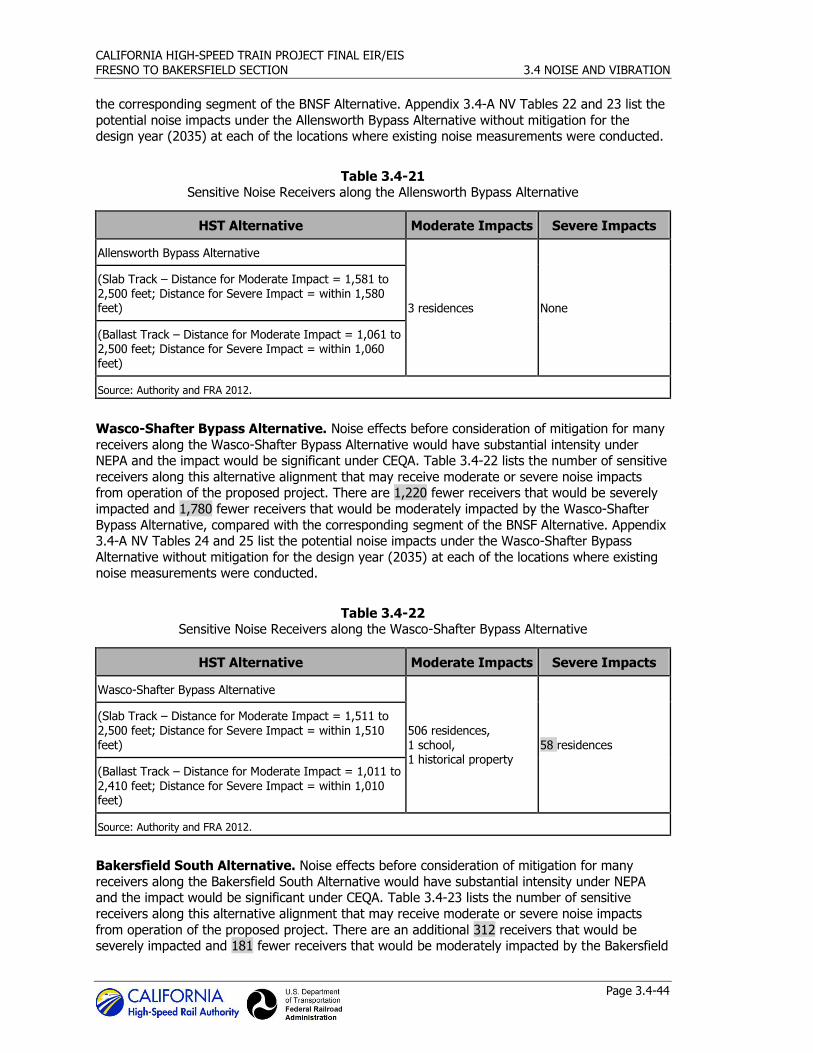
CALIFORNIA HIGH-SPEED TRAIN PROJECT FINAL EIR/EIS
FRESNO TO BAKERSFIELD SECTION 3.4 NOISE AND VIBRATION
Page 3.4-44
the corresponding segment of the BNSF Alternative. Appendix 3.4-A NV Tables 22 and 23 list the
potential noise impacts under the Allensworth Bypass Alternative without mitigation for the design year (2035) at each of the locations where existing noise measurements were conducted.
Table 3.4-21 Sensitive Noise Receivers along the Allensworth Bypass Alternative
HST Alternative Moderate Impacts Severe Impacts
Allensworth Bypass Alternative
3 residences None
(Slab Track – Distance for Moderate Impact = 1,581 to 2,500 feet; Distance for Severe Impact = within 1,580 feet)
(Ballast Track – Distance for Moderate Impact = 1,061 to 2,500 feet; Distance for Severe Impact = within 1,060 feet)
Source: Authority and FRA 2012.
Wasco-Shafter Bypass Alternative. Noise effects before consideration of mitigation for many
receivers along the Wasco-Shafter Bypass Alternative would have substantial intensity under NEPA and the impact would be significant under CEQA. Table 3.4-22 lists the number of sensitive
receivers along this alternative alignment that may receive moderate or severe noise impacts from operation of the proposed project. There are 1,220 fewer receivers that would be severely
impacted and 1,780 fewer receivers that would be moderately impacted by the Wasco-Shafter
Bypass Alternative, compared with the corresponding segment of the BNSF Alternative. Appendix 3.4-A NV Tables 24 and 25 list the potential noise impacts under the Wasco-Shafter Bypass
Alternative without mitigation for the design year (2035) at each of the locations where existing noise measurements were conducted.
Table 3.4-22 Sensitive Noise Receivers along the Wasco-Shafter Bypass Alternative
HST Alternative Moderate Impacts Severe Impacts
Wasco-Shafter Bypass Alternative
506 residences, 1 school, 1 historical property
58 residences
(Slab Track – Distance for Moderate Impact = 1,511 to 2,500 feet; Distance for Severe Impact = within 1,510 feet)
(Ballast Track – Distance for Moderate Impact = 1,011 to 2,410 feet; Distance for Severe Impact = within 1,010 feet)
Source: Authority and FRA 2012.
Bakersfield South Alternative. Noise effects before consideration of mitigation for many
receivers along the Bakersfield South Alternative would have substantial intensity under NEPA and the impact would be significant under CEQA. Table 3.4-23 lists the number of sensitive
receivers along this alternative alignment that may receive moderate or severe noise impacts
from operation of the proposed project. There are an additional 312 receivers that would be severely impacted and 181 fewer receivers that would be moderately impacted by the Bakersfield
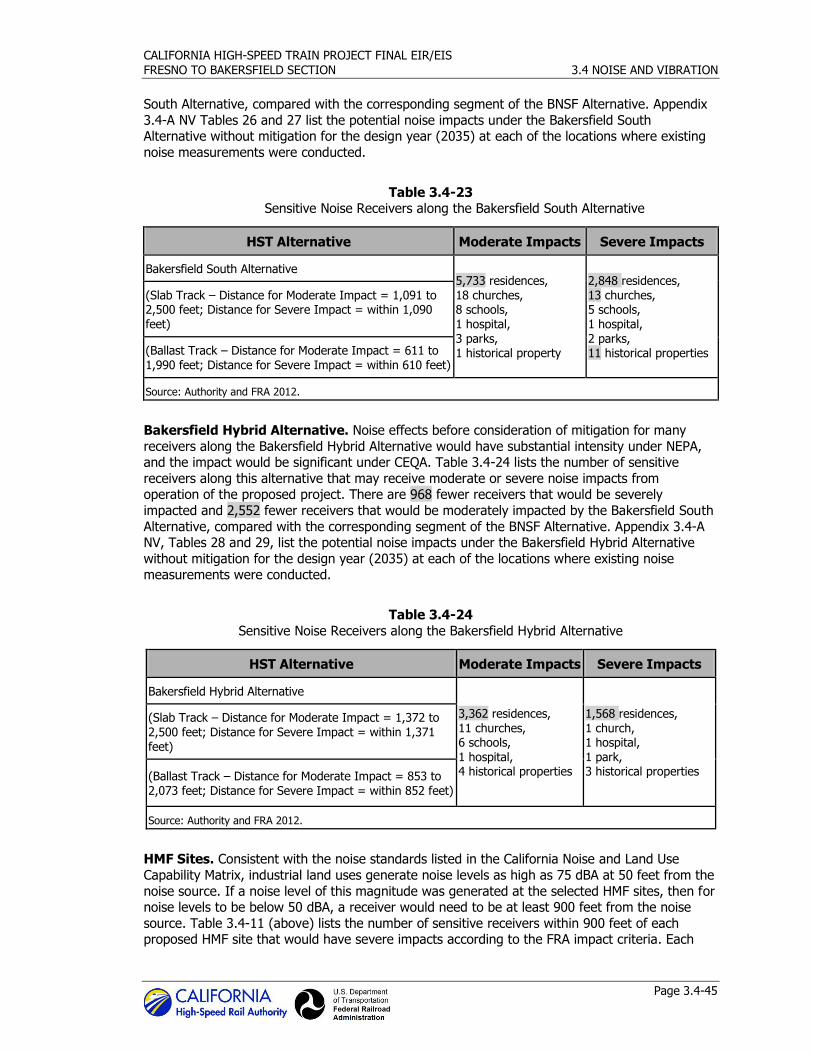
CALIFORNIA HIGH-SPEED TRAIN PROJECT FINAL EIR/EIS
FRESNO TO BAKERSFIELD SECTION 3.4 NOISE AND VIBRATION
Page 3.4-45
South Alternative, compared with the corresponding segment of the BNSF Alternative. Appendix
3.4-A NV Tables 26 and 27 list the potential noise impacts under the Bakersfield South Alternative without mitigation for the design year (2035) at each of the locations where existing
noise measurements were conducted.
Table 3.4-23 Sensitive Noise Receivers along the Bakersfield South Alternative
HST Alternative Moderate Impacts Severe Impacts
Bakersfield South Alternative 5,733 residences, 18 churches, 8 schools, 1 hospital, 3 parks, 1 historical property
2,848 residences, 13 churches, 5 schools, 1 hospital, 2 parks, 11 historical properties
(Slab Track – Distance for Moderate Impact = 1,091 to 2,500 feet; Distance for Severe Impact = within 1,090 feet)
(Ballast Track – Distance for Moderate Impact = 611 to 1,990 feet; Distance for Severe Impact = within 610 feet)
Source: Authority and FRA 2012.
Bakersfield Hybrid Alternative. Noise effects before consideration of mitigation for many
receivers along the Bakersfield Hybrid Alternative would have substantial intensity under NEPA, and the impact would be significant under CEQA. Table 3.4-24 lists the number of sensitive
receivers along this alternative that may receive moderate or severe noise impacts from operation of the proposed project. There are 968 fewer receivers that would be severely
impacted and 2,552 fewer receivers that would be moderately impacted by the Bakersfield South
Alternative, compared with the corresponding segment of the BNSF Alternative. Appendix 3.4-A NV, Tables 28 and 29, list the potential noise impacts under the Bakersfield Hybrid Alternative
without mitigation for the design year (2035) at each of the locations where existing noise measurements were conducted.
Table 3.4-24
Sensitive Noise Receivers along the Bakersfield Hybrid Alternative
HST Alternative Moderate Impacts Severe Impacts
Bakersfield Hybrid Alternative
3,362 residences, 11 churches, 6 schools, 1 hospital, 4 historical properties
1,568 residences, 1 church, 1 hospital, 1 park, 3 historical properties
(Slab Track – Distance for Moderate Impact = 1,372 to 2,500 feet; Distance for Severe Impact = within 1,371 feet)
(Ballast Track – Distance for Moderate Impact = 853 to 2,073 feet; Distance for Severe Impact = within 852 feet)
Source: Authority and FRA 2012.
HMF Sites. Consistent with the noise standards listed in the California Noise and Land Use
Capability Matrix, industrial land uses generate noise levels as high as 75 dBA at 50 feet from the
noise source. If a noise level of this magnitude was generated at the selected HMF sites, then for noise levels to be below 50 dBA, a receiver would need to be at least 900 feet from the noise
source. Table 3.4-11 (above) lists the number of sensitive receivers within 900 feet of each proposed HMF site that would have severe impacts according to the FRA impact criteria. Each
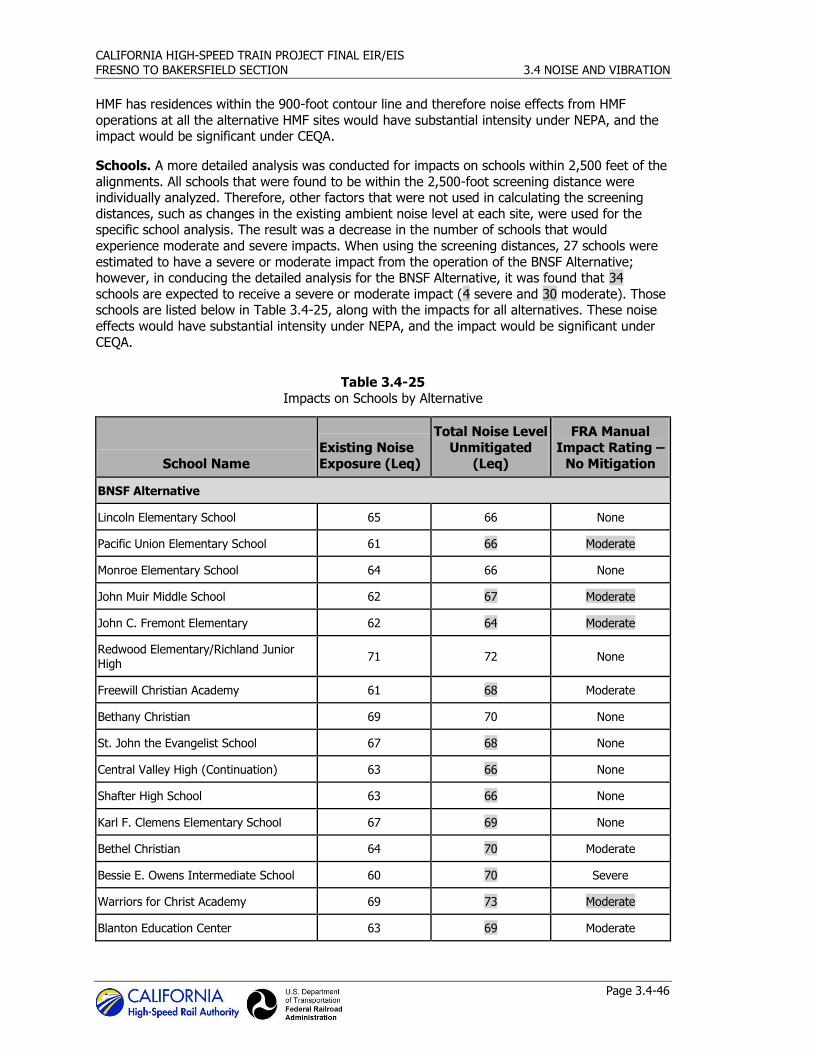
CALIFORNIA HIGH-SPEED TRAIN PROJECT FINAL EIR/EIS
FRESNO TO BAKERSFIELD SECTION 3.4 NOISE AND VIBRATION
Page 3.4-46
HMF has residences within the 900-foot contour line and therefore noise effects from HMF
operations at all the alternative HMF sites would have substantial intensity under NEPA, and the impact would be significant under CEQA.
Schools. A more detailed analysis was conducted for impacts on schools within 2,500 feet of the
alignments. All schools that were found to be within the 2,500-foot screening distance were individually analyzed. Therefore, other factors that were not used in calculating the screening
distances, such as changes in the existing ambient noise level at each site, were used for the specific school analysis. The result was a decrease in the number of schools that would
experience moderate and severe impacts. When using the screening distances, 27 schools were
estimated to have a severe or moderate impact from the operation of the BNSF Alternative; however, in conducing the detailed analysis for the BNSF Alternative, it was found that 34
schools are expected to receive a severe or moderate impact (4 severe and 30 moderate). Those schools are listed below in Table 3.4-25, along with the impacts for all alternatives. These noise
effects would have substantial intensity under NEPA, and the impact would be significant under
CEQA.
Table 3.4-25
Impacts on Schools by Alternative
School Name
Existing Noise
Exposure (Leq)
Total Noise Level
Unmitigated
(Leq)
FRA Manual
Impact Rating –
No Mitigation
BNSF Alternative
Lincoln Elementary School 65 66 None
Pacific Union Elementary School 61 66 Moderate
Monroe Elementary School 64 66 None
John Muir Middle School 62 67 Moderate
John C. Fremont Elementary 62 64 Moderate
Redwood Elementary/Richland Junior High
71 72 None
Freewill Christian Academy 61 68 Moderate
Bethany Christian 69 70 None
St. John the Evangelist School 67 68 None
Central Valley High (Continuation) 63 66 None
Shafter High School 63 66 None
Karl F. Clemens Elementary School 67 69 None
Bethel Christian 64 70 Moderate
Bessie E. Owens Intermediate School 60 70 Severe
Warriors for Christ Academy 69 73 Moderate
Blanton Education Center 63 69 Moderate
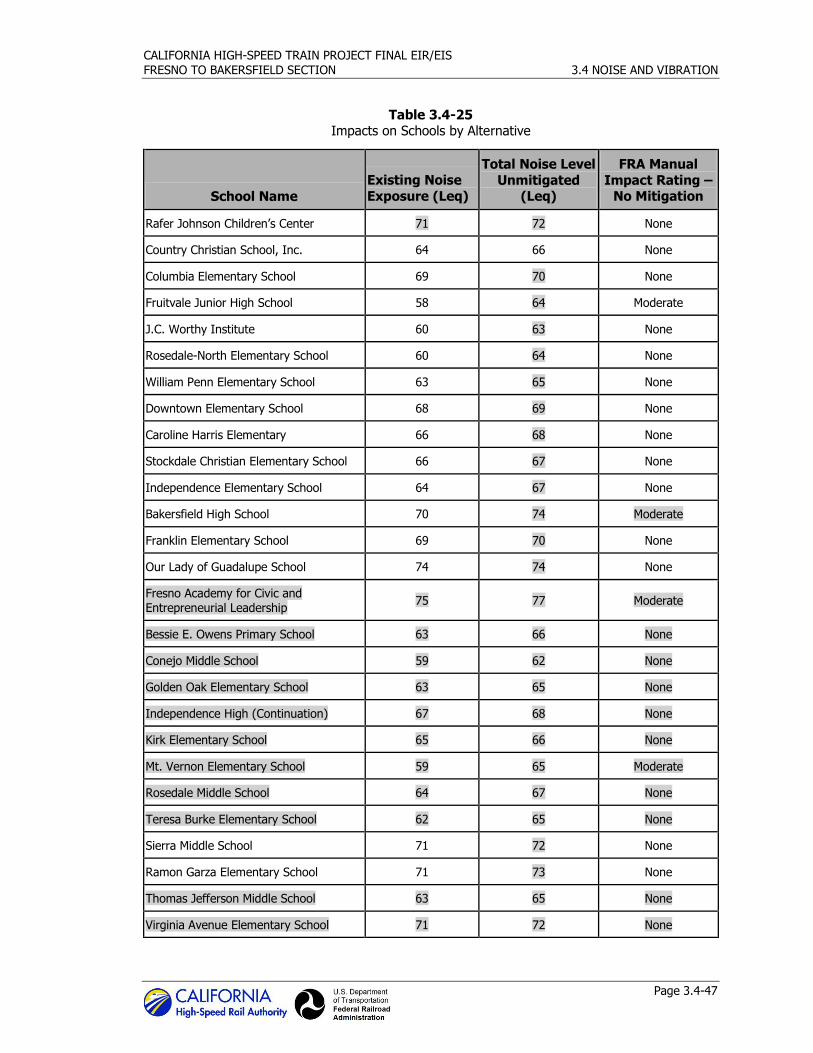
CALIFORNIA HIGH-SPEED TRAIN PROJECT FINAL EIR/EIS
FRESNO TO BAKERSFIELD SECTION 3.4 NOISE AND VIBRATION
Page 3.4-47
Table 3.4-25 Impacts on Schools by Alternative
School Name
Existing Noise
Exposure (Leq)
Total Noise Level
Unmitigated (Leq)
FRA Manual
Impact Rating – No Mitigation
Rafer Johnson Children’s Center 71 72 None
Country Christian School, Inc. 64 66 None
Columbia Elementary School 69 70 None
Fruitvale Junior High School 58 64 Moderate
J.C. Worthy Institute 60 63 None
Rosedale-North Elementary School 60 64 None
William Penn Elementary School 63 65 None
Downtown Elementary School 68 69 None
Caroline Harris Elementary 66 68 None
Stockdale Christian Elementary School 66 67 None
Independence Elementary School 64 67 None
Bakersfield High School 70 74 Moderate
Franklin Elementary School 69 70 None
Our Lady of Guadalupe School 74 74 None
Fresno Academy for Civic and Entrepreneurial Leadership
75 77 Moderate
Bessie E. Owens Primary School 63 66 None
Conejo Middle School 59 62 None
Golden Oak Elementary School 63 65 None
Independence High (Continuation) 67 68 None
Kirk Elementary School 65 66 None
Mt. Vernon Elementary School 59 65 Moderate
Rosedale Middle School 64 67 None
Teresa Burke Elementary School 62 65 None
Sierra Middle School 71 72 None
Ramon Garza Elementary School 71 73 None
Thomas Jefferson Middle School 63 65 None
Virginia Avenue Elementary School 71 72 None
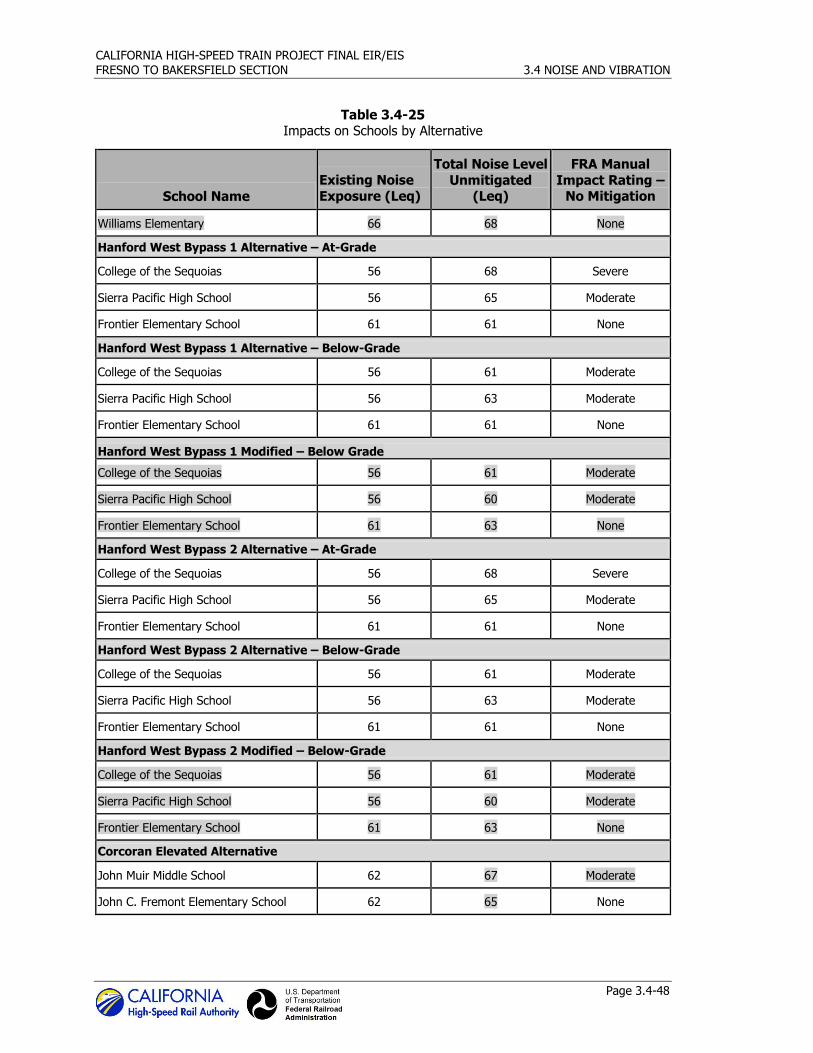
CALIFORNIA HIGH-SPEED TRAIN PROJECT FINAL EIR/EIS
FRESNO TO BAKERSFIELD SECTION 3.4 NOISE AND VIBRATION
Page 3.4-48
Table 3.4-25 Impacts on Schools by Alternative
School Name
Existing Noise
Exposure (Leq)
Total Noise Level
Unmitigated (Leq)
FRA Manual
Impact Rating – No Mitigation
Williams Elementary 66 68 None
Hanford West Bypass 1 Alternative – At-Grade
College of the Sequoias 56 68 Severe
Sierra Pacific High School 56 65 Moderate
Frontier Elementary School 61 61 None
Hanford West Bypass 1 Alternative – Below-Grade
College of the Sequoias 56 61 Moderate
Sierra Pacific High School 56 63 Moderate
Frontier Elementary School 61 61 None
Hanford West Bypass 1 Modified – Below Grade
College of the Sequoias 56 61 Moderate
Sierra Pacific High School 56 60 Moderate
Frontier Elementary School 61 63 None
Hanford West Bypass 2 Alternative – At-Grade
College of the Sequoias 56 68 Severe
Sierra Pacific High School 56 65 Moderate
Frontier Elementary School 61 61 None
Hanford West Bypass 2 Alternative – Below-Grade
College of the Sequoias 56 61 Moderate
Sierra Pacific High School 56 63 Moderate
Frontier Elementary School 61 61 None
Hanford West Bypass 2 Modified – Below-Grade
College of the Sequoias 56 61 Moderate
Sierra Pacific High School 56 60 Moderate
Frontier Elementary School 61 63 None
Corcoran Elevated Alternative
John Muir Middle School 62 67 Moderate
John C. Fremont Elementary School 62 65 None
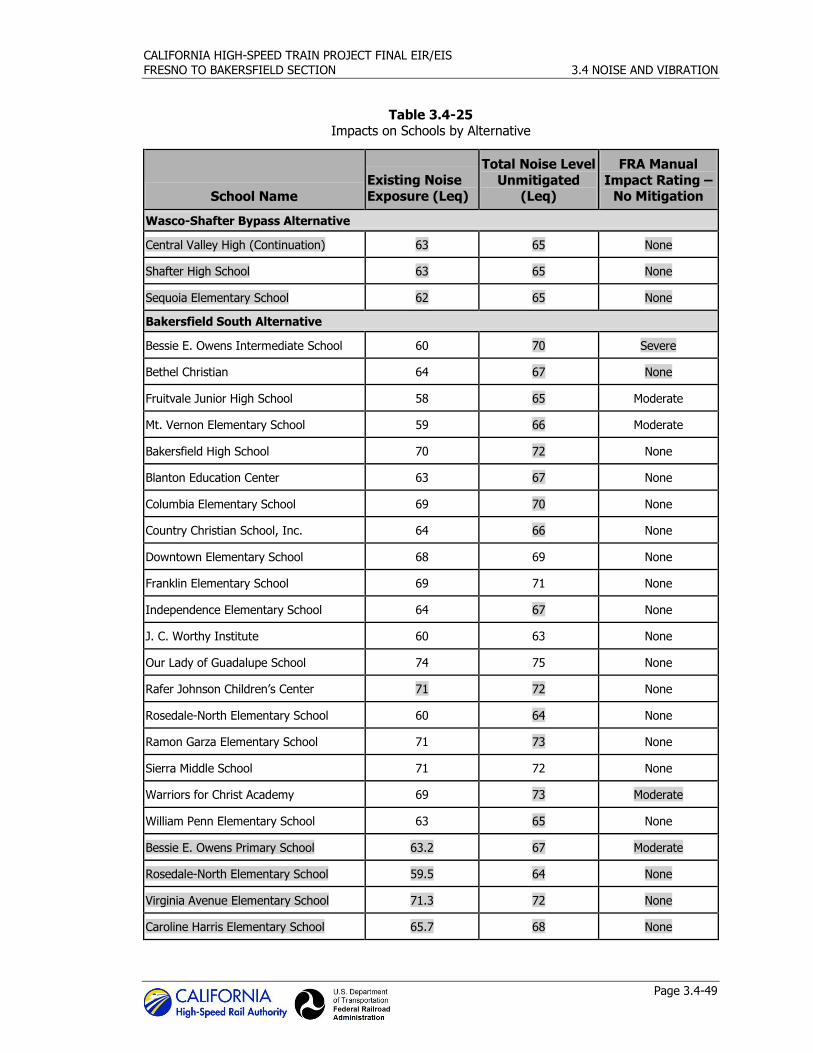
CALIFORNIA HIGH-SPEED TRAIN PROJECT FINAL EIR/EIS
FRESNO TO BAKERSFIELD SECTION 3.4 NOISE AND VIBRATION
Page 3.4-49
Table 3.4-25 Impacts on Schools by Alternative
School Name
Existing Noise
Exposure (Leq)
Total Noise Level
Unmitigated (Leq)
FRA Manual
Impact Rating – No Mitigation
Wasco-Shafter Bypass Alternative
Central Valley High (Continuation) 63 65 None
Shafter High School 63 65 None
Sequoia Elementary School 62 65 None
Bakersfield South Alternative
Bessie E. Owens Intermediate School 60 70 Severe
Bethel Christian 64 67 None
Fruitvale Junior High School 58 65 Moderate
Mt. Vernon Elementary School 59 66 Moderate
Bakersfield High School 70 72 None
Blanton Education Center 63 67 None
Columbia Elementary School 69 70 None
Country Christian School, Inc. 64 66 None
Downtown Elementary School 68 69 None
Franklin Elementary School 69 71 None
Independence Elementary School 64 67 None
J. C. Worthy Institute 60 63 None
Our Lady of Guadalupe School 74 75 None
Rafer Johnson Children’s Center 71 72 None
Rosedale-North Elementary School 60 64 None
Ramon Garza Elementary School 71 73 None
Sierra Middle School 71 72 None
Warriors for Christ Academy 69 73 Moderate
William Penn Elementary School 63 65 None
Bessie E. Owens Primary School 63.2 67 Moderate
Rosedale-North Elementary School 59.5 64 None
Virginia Avenue Elementary School 71.3 72 None
Caroline Harris Elementary School 65.7 68 None
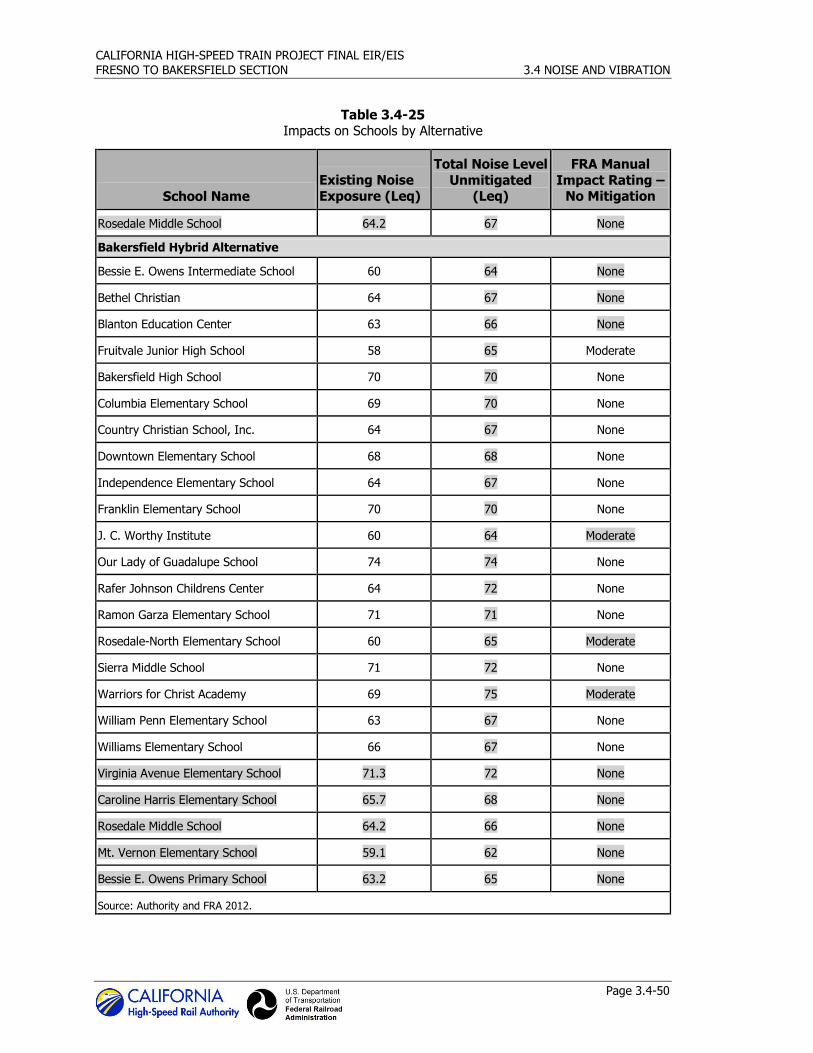
CALIFORNIA HIGH-SPEED TRAIN PROJECT FINAL EIR/EIS
FRESNO TO BAKERSFIELD SECTION 3.4 NOISE AND VIBRATION
Page 3.4-50
Table 3.4-25 Impacts on Schools by Alternative
School Name
Existing Noise
Exposure (Leq)
Total Noise Level
Unmitigated (Leq)
FRA Manual
Impact Rating – No Mitigation
Rosedale Middle School 64.2 67 None
Bakersfield Hybrid Alternative
Bessie E. Owens Intermediate School 60 64 None
Bethel Christian 64 67 None
Blanton Education Center 63 66 None
Fruitvale Junior High School 58 65 Moderate
Bakersfield High School 70 70 None
Columbia Elementary School 69 70 None
Country Christian School, Inc. 64 67 None
Downtown Elementary School 68 68 None
Independence Elementary School 64 67 None
Franklin Elementary School 70 70 None
J. C. Worthy Institute 60 64 Moderate
Our Lady of Guadalupe School 74 74 None
Rafer Johnson Childrens Center 64 72 None
Ramon Garza Elementary School 71 71 None
Rosedale-North Elementary School 60 65 Moderate
Sierra Middle School 71 72 None
Warriors for Christ Academy 69 75 Moderate
William Penn Elementary School 63 67 None
Williams Elementary School 66 67 None
Virginia Avenue Elementary School 71.3 72 None
Caroline Harris Elementary School 65.7 68 None
Rosedale Middle School 64.2 66 None
Mt. Vernon Elementary School 59.1 62 None
Bessie E. Owens Primary School 63.2 65 None
Source: Authority and FRA 2012.
CALIFORNIA HIGH-SPEED TRAIN PROJECT FINAL EIR/EIS
FRESNO TO BAKERSFIELD SECTION 3.4 NOISE AND VIBRATION
Page 3.4-51
Annoyance from Onset of HST Pass-bys
Onset rate is the average rate of change of increasing sound pressure level measured in decibels
per second (dB/sec) during a single noise event. The rapid approach of a HST is accompanied by a sudden increase in noise for a receiver near the tracks. Research shows that people are
increasingly annoyed by sudden sounds with onset rates greater than about 15 dB per second (dB/sec). There is considerable evidence that increased annoyance is likely to occur for train
noise events with rapid onset rates. The relationship between speed and distance defines the locations where the onset rate for HST operations can cause annoyance or surprise according to
the FRA guidance manual (FRA 2005, 2012). For the most part, the potential for increased
annoyance is confined to an area very close to the tracks. In the Fresno to Bakersfield Section, the maximum train speeds would be 220 mph. At this speed, the distance from the centerline of
the tracks within which annoyance or surprise can occur would be 45 feet (see Table 4-2 of the FRA Guidance Manual [FRA 2005, 2012]), which is within the project right-of-way where people
and animals will be excluded with fencing. For these reasons, rapid onset noise events are
considered to have an effect of negligible intensity under NEPA, and a less-than significant impact under CEQA.
Noise Impacts due to BNSF Railway Track Realignment
The realignment of the BNSF Railway tracks to accommodate the HST alignment is a contributing
factor to the above-identified noise impacts, which are already identified as having substantial intensity under NEPA and significant under CEQA.
Impact N&V #4 - Noise Effects on Wildlife and Domestic Animals
The FRA guidance manual (FRA 2005, 2012) also addresses the impacts of HSTs on wildlife
(mammals and birds) and domestic animals (livestock and poultry). The noise exposure limit for each type of animal is an SEL of 100 dBA from passing trains. The SEL represents a receiver’s
cumulative noise exposure from an event and represents the total A-weighted sound during the event normalized to a 1-second interval.
A screening assessment determined typical and maximum distances from the HST tracks at which
this limit may be exceeded. Project analysts computed train pass-by SELs for two conditions: at-grade and on a 60-foot-high elevated guideway. To provide a conservative estimate, in each case
the HST maximum operating speed of 220 mph was used, and no shielding from intervening
structures or terrain was assumed.
Table 3.4-26 indicates that along at-grade sections, the screening distance (i.e., distance from
the trackway centerline within which an impact could result) for a single-train pass-by SEL of 100
dBA would be approximately 100 feet from the track centerline. In elevated guideway locations, a single-train pass-by SEL of 100 dBA would not occur beyond the edge of the structure,
approximately 15 feet from the track centerline. This assumes the presence of a safety barrier on the edge of the guideways that is 3 feet above the top of the rail height, as detailed in typical
cross sections.
For reference, Table 3.4-26 also shows the screening distances for potential wildlife/domestic
animal impacts from freight trains that currently use the UPRR and BNSF tracks. The distance to an impact for a freight train is 75 feet when the warning horn is not sounded and 400 feet when
the crossing is at–grade and the horn is sounded. These screening distances assume a freight train consisting of two locomotives and 100 railcars traveling at 50 mph, which is typical for trains
on the UPRR and BNSF tracks.
According to the screening distance information provided in Table 3.4-26, wildlife and domestic animals might be within the screening distance for an at-grade HST (i.e., within 100 feet in both
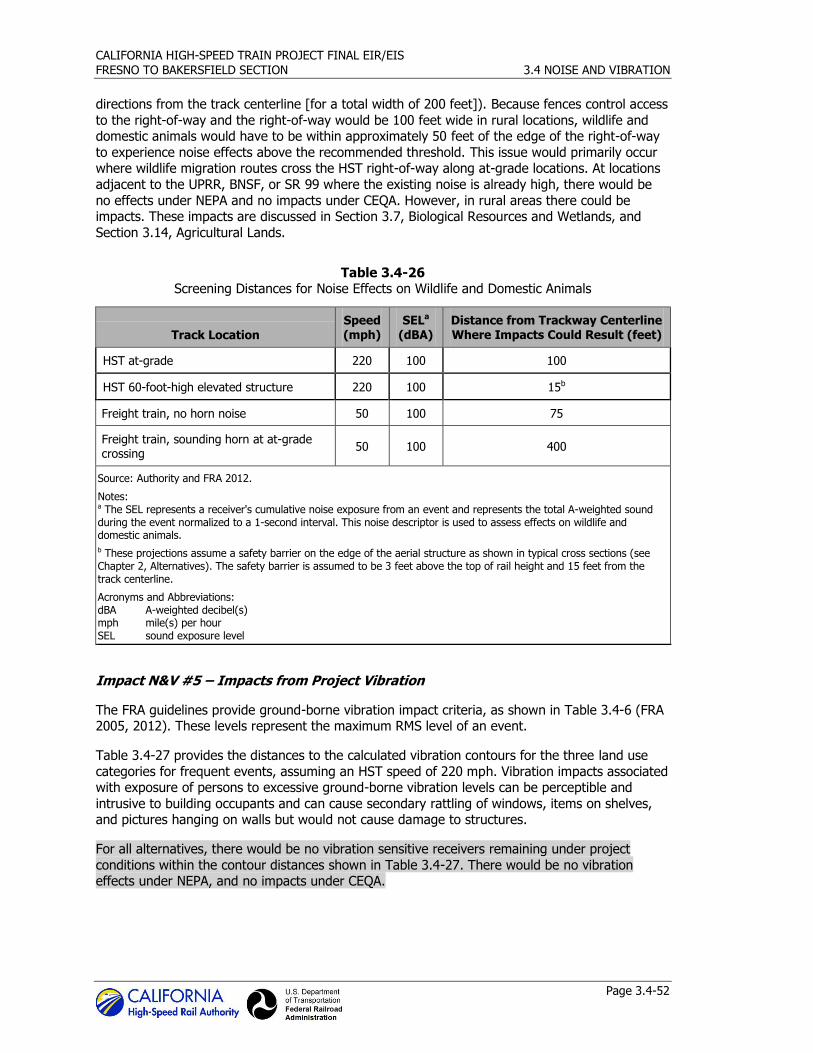
CALIFORNIA HIGH-SPEED TRAIN PROJECT FINAL EIR/EIS
FRESNO TO BAKERSFIELD SECTION 3.4 NOISE AND VIBRATION
Page 3.4-52
directions from the track centerline [for a total width of 200 feet]). Because fences control access
to the right-of-way and the right-of-way would be 100 feet wide in rural locations, wildlife and domestic animals would have to be within approximately 50 feet of the edge of the right-of-way
to experience noise effects above the recommended threshold. This issue would primarily occur where wildlife migration routes cross the HST right-of-way along at-grade locations. At locations
adjacent to the UPRR, BNSF, or SR 99 where the existing noise is already high, there would be
no effects under NEPA and no impacts under CEQA. However, in rural areas there could be impacts. These impacts are discussed in Section 3.7, Biological Resources and Wetlands, and
Section 3.14, Agricultural Lands.
Table 3.4-26 Screening Distances for Noise Effects on Wildlife and Domestic Animals
Track Location
Speed (mph)
SELa (dBA)
Distance from Trackway Centerline Where Impacts Could Result (feet)
HST at-grade 220 100 100
HST 60-foot-high elevated structure 220 100 15b
Freight train, no horn noise 50 100 75
Freight train, sounding horn at at-grade crossing
50 100 400
Source: Authority and FRA 2012.
Notes: a The SEL represents a receiver's cumulative noise exposure from an event and represents the total A-weighted sound during the event normalized to a 1-second interval. This noise descriptor is used to assess effects on wildlife and domestic animals.
b These projections assume a safety barrier on the edge of the aerial structure as shown in typical cross sections (see Chapter 2, Alternatives). The safety barrier is assumed to be 3 feet above the top of rail height and 15 feet from the track centerline.
Acronyms and Abbreviations: dBA A-weighted decibel(s) mph mile(s) per hour SEL sound exposure level
Impact N&V #5 – Impacts from Project Vibration
The FRA guidelines provide ground-borne vibration impact criteria, as shown in Table 3.4-6 (FRA 2005, 2012). These levels represent the maximum RMS level of an event.
Table 3.4-27 provides the distances to the calculated vibration contours for the three land use
categories for frequent events, assuming an HST speed of 220 mph. Vibration impacts associated with exposure of persons to excessive ground-borne vibration levels can be perceptible and
intrusive to building occupants and can cause secondary rattling of windows, items on shelves, and pictures hanging on walls but would not cause damage to structures.
For all alternatives, there would be no vibration sensitive receivers remaining under project
conditions within the contour distances shown in Table 3.4-27. There would be no vibration effects under NEPA, and no impacts under CEQA.
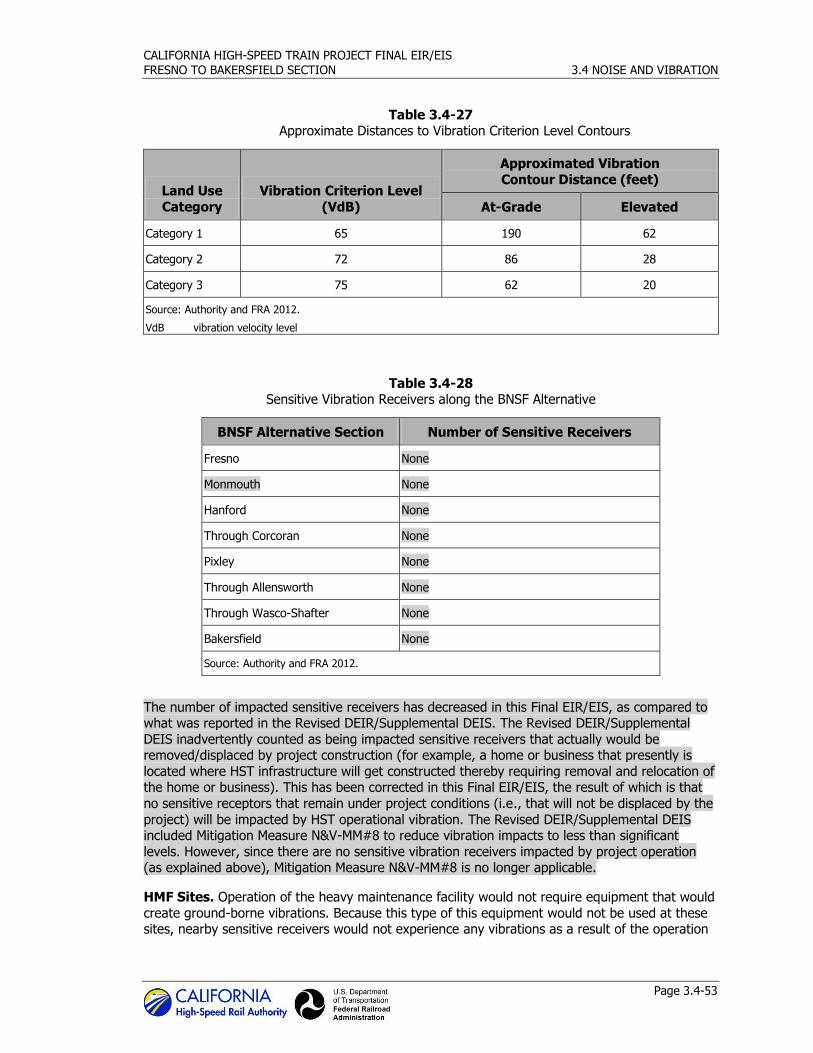
CALIFORNIA HIGH-SPEED TRAIN PROJECT FINAL EIR/EIS
FRESNO TO BAKERSFIELD SECTION 3.4 NOISE AND VIBRATION
Page 3.4-53
Table 3.4-27 Approximate Distances to Vibration Criterion Level Contours
Land Use
Category
Vibration Criterion Level
(VdB)
Approximated Vibration
Contour Distance (feet)
At-Grade Elevated
Category 1 65 190 62
Category 2 72 86 28
Category 3 75 62 20
Source: Authority and FRA 2012.
VdB vibration velocity level
Table 3.4-28
Sensitive Vibration Receivers along the BNSF Alternative
BNSF Alternative Section Number of Sensitive Receivers
Fresno None
Monmouth None
Hanford None
Through Corcoran None
Pixley None
Through Allensworth None
Through Wasco-Shafter None
Bakersfield None
Source: Authority and FRA 2012.
The number of impacted sensitive receivers has decreased in this Final EIR/EIS, as compared to what was reported in the Revised DEIR/Supplemental DEIS. The Revised DEIR/Supplemental
DEIS inadvertently counted as being impacted sensitive receivers that actually would be removed/displaced by project construction (for example, a home or business that presently is
located where HST infrastructure will get constructed thereby requiring removal and relocation of the home or business). This has been corrected in this Final EIR/EIS, the result of which is that
no sensitive receptors that remain under project conditions (i.e., that will not be displaced by the
project) will be impacted by HST operational vibration. The Revised DEIR/Supplemental DEIS included Mitigation Measure N&V-MM#8 to reduce vibration impacts to less than significant
levels. However, since there are no sensitive vibration receivers impacted by project operation (as explained above), Mitigation Measure N&V-MM#8 is no longer applicable.
HMF Sites. Operation of the heavy maintenance facility would not require equipment that would
create ground-borne vibrations. Because this type of this equipment would not be used at these sites, nearby sensitive receivers would not experience any vibrations as a result of the operation
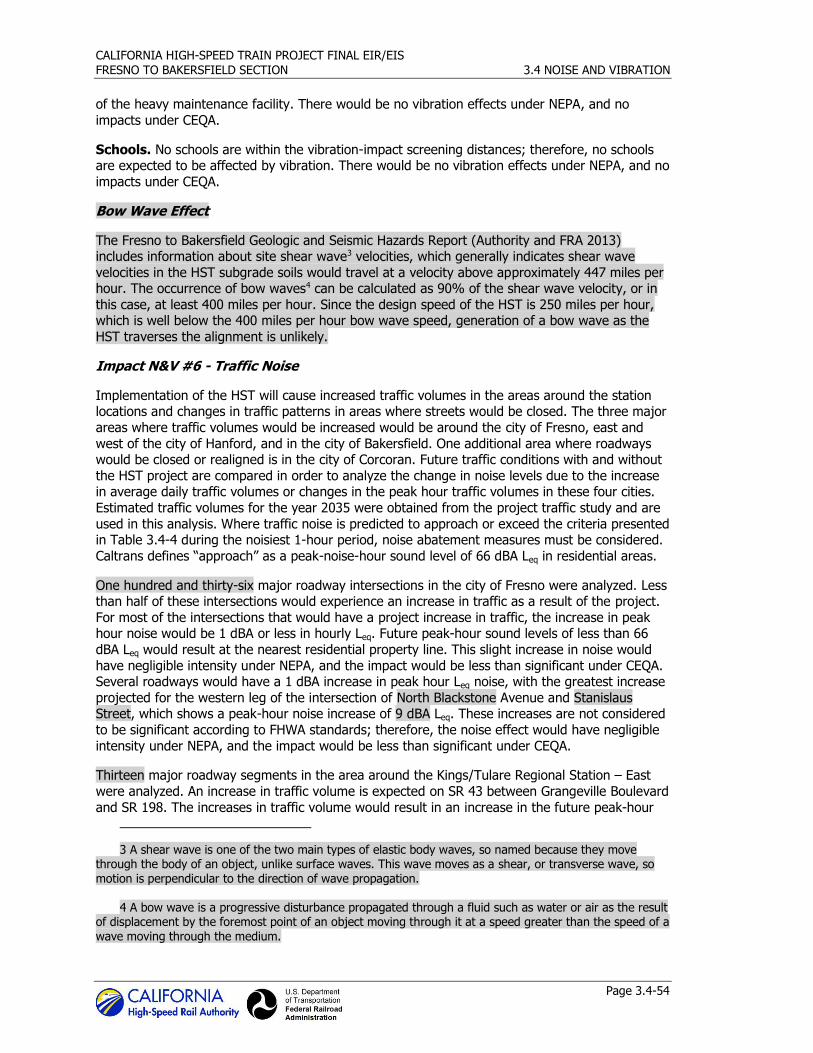
CALIFORNIA HIGH-SPEED TRAIN PROJECT FINAL EIR/EIS
FRESNO TO BAKERSFIELD SECTION 3.4 NOISE AND VIBRATION
Page 3.4-54
of the heavy maintenance facility. There would be no vibration effects under NEPA, and no
impacts under CEQA.
Schools. No schools are within the vibration-impact screening distances; therefore, no schools are expected to be affected by vibration. There would be no vibration effects under NEPA, and no
impacts under CEQA.
Bow Wave Effect
The Fresno to Bakersfield Geologic and Seismic Hazards Report (Authority and FRA 2013) includes information about site shear wave3 velocities, which generally indicates shear wave
velocities in the HST subgrade soils would travel at a velocity above approximately 447 miles per hour. The occurrence of bow waves4 can be calculated as 90% of the shear wave velocity, or in
this case, at least 400 miles per hour. Since the design speed of the HST is 250 miles per hour, which is well below the 400 miles per hour bow wave speed, generation of a bow wave as the
HST traverses the alignment is unlikely.
Impact N&V #6 - Traffic Noise
Implementation of the HST will cause increased traffic volumes in the areas around the station locations and changes in traffic patterns in areas where streets would be closed. The three major
areas where traffic volumes would be increased would be around the city of Fresno, east and
west of the city of Hanford, and in the city of Bakersfield. One additional area where roadways would be closed or realigned is in the city of Corcoran. Future traffic conditions with and without
the HST project are compared in order to analyze the change in noise levels due to the increase in average daily traffic volumes or changes in the peak hour traffic volumes in these four cities.
Estimated traffic volumes for the year 2035 were obtained from the project traffic study and are
used in this analysis. Where traffic noise is predicted to approach or exceed the criteria presented in Table 3.4-4 during the noisiest 1-hour period, noise abatement measures must be considered.
Caltrans defines “approach” as a peak-noise-hour sound level of 66 dBA Leq in residential areas.
One hundred and thirty-six major roadway intersections in the city of Fresno were analyzed. Less than half of these intersections would experience an increase in traffic as a result of the project.
For most of the intersections that would have a project increase in traffic, the increase in peak hour noise would be 1 dBA or less in hourly Leq. Future peak-hour sound levels of less than 66
dBA Leq would result at the nearest residential property line. This slight increase in noise would
have negligible intensity under NEPA, and the impact would be less than significant under CEQA. Several roadways would have a 1 dBA increase in peak hour Leq noise, with the greatest increase
projected for the western leg of the intersection of North Blackstone Avenue and Stanislaus Street, which shows a peak-hour noise increase of 9 dBA Leq. These increases are not considered
to be significant according to FHWA standards; therefore, the noise effect would have negligible
intensity under NEPA, and the impact would be less than significant under CEQA.
Thirteen major roadway segments in the area around the Kings/Tulare Regional Station – East
were analyzed. An increase in traffic volume is expected on SR 43 between Grangeville Boulevard
and SR 198. The increases in traffic volume would result in an increase in the future peak-hour
3 A shear wave is one of the two main types of elastic body waves, so named because they move through the body of an object, unlike surface waves. This wave moves as a shear, or transverse wave, so motion is perpendicular to the direction of wave propagation.
4 A bow wave is a progressive disturbance propagated through a fluid such as water or air as the result
of displacement by the foremost point of an object moving through it at a speed greater than the speed of a wave moving through the medium.
CALIFORNIA HIGH-SPEED TRAIN PROJECT FINAL EIR/EIS
FRESNO TO BAKERSFIELD SECTION 3.4 NOISE AND VIBRATION
Page 3.4-55
noise level of 1 dBA Leq. This would result in five homes that face SR 43 being exposed to a peak-
hour noise level in excess of 66 dBA Leq. This noise effect would have a moderate intensity under NEPA and it could be a significant impact under CEQA.
Thirteen major roadway segments in the area around the Kings/Tulare Regional Station – West
were analyzed. An increase in traffic volume is expected for one-third of the roadway segments. All of the increases in traffic volume would increase the future dBA Leq values by 4 dBA or less.
The resulting peak-hour volumes are so low they would not generate a sound level of 66 dBA Leq at a distance of 50 feet. This slight increase in noise would have negligible intensity under NEPA,
and be less than significant under CEQA. One of the intersection legs shows an increase in peak-
hour noise of greater than 2 dBA, and the greatest increase would be at the intersection of South Irwin Street and East 3rd Street, which shows a peak-hour increase of 4 dBA Leq. These increases
are not considered to be significant according to FHWA standards; therefore, the noise would have negligible intensity under NEPA, and the impact would be less-than-significant impact under
CEQA.
Four major roadway intersections in the City of Corcoran were analyzed. An increase in peak hour traffic is expected on most of these roadway segments. All of the increases in traffic volume
would result in increasing the peak-hour traffic noise level by 1 to 7 dBA Leq. These increases are
not considered to be significant according to FHWA standards. As a result of the traffic increase one home that faces Whitley Avenue would be exposed to a peak-hour noise level in excess of 66
dBA Leq. This noise effect would have moderate intensity under NEPA, and it could be a significant impact under CEQA.
Seventy-two major roadway intersections in the city of Bakersfield were analyzed for the
Bakersfield Station–North, Bakersfield Station–South, and Bakersfield Station–Hybrid alternatives. An increase in traffic volume is expected for most of the roadway intersections. Most of the
increases in traffic volume would increase the future peak-hour Leq by 1 dBA or less, and the
resulting peak-hour volumes are so low they would not generate a sound level of 66 dBA Leq at the nearest residential property line. This slight increase in noise would have negligible intensity
under NEPA, and the impact would be less than significant under CEQA. The majority of roadways analyzed for increases in peak-hour traffic show no increase in noise. A few of the
intersection legs show an increase of 1 dBA Leq or more in peak-hour traffic noise. The greatest
increase would be along the west leg of the intersection of Hayden Court and Union Avenue, which shows a peak-hour increase of 12 dBA Leq for the Bakersfield Station South alternative and
14 dBA Leq for the Bakersfield Station Hybrid alternative. The west leg of the intersection of Hayden Court and Union Avenue is located in a commercial and industrial area where there are
no nearby noise-sensitive receivers. These increases are not considered to be significant
according to FHWA standards; therefore, they would have negligible intensity under NEPA, and the impact would be less-than-significant impact CEQA.
3.4.6 Project Design Features
The Authority and the FRA have considered avoidance and minimization measures consistent
with the Statewide and Bay Area to Central Valley Program EIR/EIS commitments. For example, the use of continuous welded rail would reduce the impact sounds of the steel wheels on the rail
gaps, and the use of cowlings (streamlined coverings) on the pantographs would reduce the aerodynamic noise. FTA and FRA have guidelines for minimizing noise and vibration impacts at
sensitive receivers that will be followed during construction.
3.4.7 Mitigation Measures
In addition, the following mitigation measures are available to compensate for impacts that
cannot be minimized or avoided. The Authority has developed proposed Noise and Vibration
CALIFORNIA HIGH-SPEED TRAIN PROJECT FINAL EIR/EIS
FRESNO TO BAKERSFIELD SECTION 3.4 NOISE AND VIBRATION
Page 3.4-56
Mitigation Guidelines that identify criteria by which noise and vibration mitigation would be
deemed effective. The proposed Noise and Vibration Mitigation Guidelines are included as Appendix 3.4-A.
3.4.7.1 Construction Period
N&V-MM#1: Construction noise mitigation measures. During construction the contractor
will monitor construction noise to verify compliance with the noise limits shown in Table 3.4-1 of the Final EIR/EIS. The contractor would be given the flexibility to meet the FRA construction
noise limits in the most efficient and cost-effective manner. This can be done by either prohibiting certain noise-generating activities during nighttime hours or providing additional noise
control measures to meet the noise limits. A noise-monitoring program will be developed to meet
required noise limits, and the following noise control mitigation measures will be implemented as necessary, for nighttime and daytime:
Install a temporary construction site sound barrier near a noise source.
Avoid nighttime construction in residential neighborhoods.
Locate stationary construction equipment as far as possible from noise-sensitive sites.
Re-route construction truck traffic along roadways that will cause the least disturbance to
residents.
During nighttime work, use smart back-up alarms, which automatically adjust the alarm level
based on the background noise level, or switch off back-up alarms and replace with spotters. Use low-noise emission equipment.
Implement noise-deadening measures for truck loading and operations.
Monitor and maintain equipment to meet noise limits.
Line or cover storage bins, conveyors, and chutes with sound-deadening material.
Use acoustic enclosures, shields, or shrouds for equipment and facilities.
Use high-grade engine exhaust silencers and engine-casing sound insulation.
Prohibit aboveground jackhammering and impact pile driving during nighttime hours.
Minimize the use of generators to power equipment.
Limit use of public address systems.
Grade surface irregularities on construction sites.
Use moveable sound barriers at the source of the construction activity.
Limit or avoid certain noisy activities during nighttime hours.
To mitigate noise related to pile driving, the use of an auger to install the piles instead of a
pile driver would reduce noise levels substantially. If pile driving is necessary, limit the time
of day that the activity can occur.
Noise impacts would occur during construction activities and would cease after construction is complete. Mitigation Measure N&V-MM#1 would reduce construction noise below the FTA
construction noise limits, and this impact would be reduced to a less-than-significant impact under CEQA and a negligible intensity under NEPA.
N&V-MM#2: Construction vibration mitigation measures. Building damage from
construction vibration is only anticipated from impact pile driving at very close distances to buildings. If pile driving occurs more than 25 to 50 feet from buildings, or if alternative methods
such as push piling or auger piling can be used, damage from construction vibration is not
expected to occur. Other sources of construction vibration do not generate high enough vibration levels for damage to occur. When a construction scenario has been established, preconstruction
surveys are conducted at locations within 50 feet of pile driving to document the existing condition of buildings in case damage is reported during or after construction. The Authority will
arrange for the repair of damaged buildings or will pay compensation to the property owner.
CALIFORNIA HIGH-SPEED TRAIN PROJECT FINAL EIR/EIS
FRESNO TO BAKERSFIELD SECTION 3.4 NOISE AND VIBRATION
Page 3.4-57
Although vibration impacts would occur during construction activities, the construction activities
are considered temporary, as they would cease after completion. The construction vibration impacts would be substantially lessened or avoided, and reduced to a less-than-significant impact
under CEQA, with implementation of Mitigation Measure N&V-MM #2.
3.4.7.2 Project
Noise
N&V-MM#3: Implement Proposed California High-Speed Train Project Noise Mitigation Guidelines. To determine the appropriate mitigation measure for properties
experiencing severe noise impacts, noise mitigation guidelines would be applied as follows:
Prior to operation of the HST, the Authority will install sound barriers where they can achieve
between 5 and 15 dB of noise reduction, depending on their height and location relative to the tracks. The primary requirements for an effective sound barrier are that the barrier must
(1) be high enough and long enough to break the line-of-sight between the sound source and the receiver, (2) be of an impervious material with a minimum surface density of
4 pounds per square foot, and (3) not have any gaps or holes between the panels or at the
bottom. Because many materials meet these requirements, aesthetics, durability, cost, and maintenance considerations usually determine the selection of materials for sound barriers
(examples are shown in Figure 3.4-14). Depending on the situation, sound barriers can become visually intrusive. Typically, the sound barriers style is selected with input from the
local jurisdiction to reduce the visual effect of barriers on adjacent lands uses. For example, sound barriers could be solid or transparent, and made of various colors, materials, and
surface treatments.
The minimum number of affected sites should be at least 10, and the length of a sound
barrier should be at least 800 feet. The maximum sound barrier height would be 14 feet for
at-grade sections; however, all sound barriers would be designed to be as low as possible to achieve a substantial noise reduction. Berm and berm/wall combinations are the preferred
types of sound barriers where space and other environmental constraints permit. On aerial structures, the maximum sound barrier height would also be 14 feet, but barrier material
would be limited by engineering weight restrictions for barriers on the structure. Sound barriers on the aerial structure will still be designed to be as low as possible to achieve a
substantial noise reduction. Sound barriers on both aerial structures and at-grade structures
could consist of solid, semitransparent, or transparent materials.
The Authority will work with the communities to identify how the use and height of sound
barriers would be determined using jointly developed performance criteria. Other solutions may result in higher numbers of residual impacts than reported herein. Options may be to
reduce the height of sound barriers and combine barriers with sound insulation or to accept higher noise thresholds than the FRA’s current noise thresholds.
If sound walls are not proposed or do not reduce sound levels to below a severe impact
level, building sound insulation can be installed. Sound insulation of residences and
institutional buildings to improve the outdoor-to-indoor noise reduction is a mitigation measure that can be provided when the use of sound barriers is not feasible in providing a
reasonable level (5 to 7 dB) of noise reduction. Although this approach has no effect on noise
in exterior areas, it may be the best choice for sites where sound barriers are not feasible or desirable and for buildings where indoor sensitivity is of most concern. Substantial
improvements in building sound insulation (on the order of 5 to 10 dB) can often be achieved by adding an extra layer of glazing to windows, by sealing holes in exterior surfaces that act
as sound leaks, and by providing forced ventilation and air conditioning so that windows do
CALIFORNIA HIGH-SPEED TRAIN PROJECT FINAL EIR/EIS
FRESNO TO BAKERSFIELD SECTION 3.4 NOISE AND VIBRATION
Page 3.4-58
not need to be opened. Performance criteria would be established to balance existing noise
events and ambient roadway noise conditions as factors for determining mitigation measures.
If sound walls or sound installation is not effective, the Authority can acquire easements on
properties severely affected by noise. Another option for mitigating noise impacts is for the
authority to acquire easements on residences likely to be impacted by HST operations in which the homeowners would accept the future noise conditions. This approach is usually
taken only in isolated cases where other mitigation options are infeasible, impractical, or too
costly.
Tables 3.4-29 through 3.4-33 show the number and length of sound barriers that would be cost
effective for the Fresno to Bakersfield Section alternatives based on implementation of the noise mitigation guidelines. Figures 3.4-15 through 3.4-19 show the locations of potential sound
barriers along the project alternatives.
BNSF Alternative Potential Mitigation Locations
Figures 3.4-15 through 3.4.19 show the locations where the criteria were met for the construction of sound barriers for all HST alternatives in the Fresno to Bakersfield Section. Table
3.4-31 summarizes potential sound barrier mitigation for operational noise for the BNSF Alternative during the design year (2035). The location of sound barriers as mitigation is shown
on the table where a minimum of 5 dBA noise reduction at the impact receiver can be achieved.
The table also summarizes the total length, maximum barrier height, the number of benefited receivers, and the number of residual (post-mitigation) impacts within each portion of the
alignment. The table references barrier heights from the top-of-rail elevation. A total of 12 sound barriers would be installed, with a combined length of approximately 167,208 feet and maximum
height of 14 feet, for the BNSF Alternative. Only barrier mitigation measures providing 5 dBA, or
more, of noise reduction have been applied in the HST alternative tables 3.4-29 through 3.4-33.
These sound barriers would mitigate 76% of the severe noise impacts in the Corcoran area, 55%
of the severe noise impacts in the Wasco-Shafter area, and 99% of the severe noise impacts in
the Bakersfield area. Noise receivers severely impacted in the Fresno, East Hanford, Pixley, and Allensworth areas, as well as those residual severely impacted noise receivers in Corcoran,
Wasco, Shafter, and Bakersfield, would not be mitigated by a sound barrier. Because they are shown to be economically unfeasible, they would receive other forms of mitigation, such as
building insulation or payment of property noise easements.
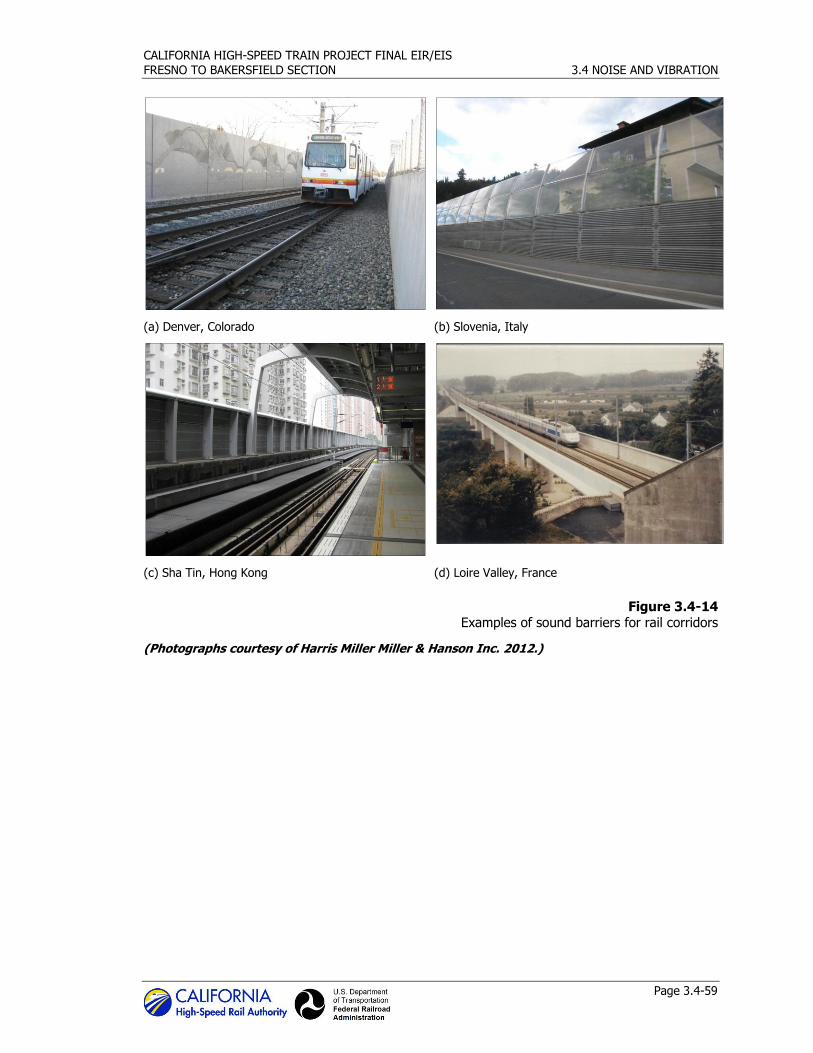
CALIFORNIA HIGH-SPEED TRAIN PROJECT FINAL EIR/EIS
FRESNO TO BAKERSFIELD SECTION 3.4 NOISE AND VIBRATION
Page 3.4-59
(a) Denver, Colorado (b) Slovenia, Italy
(c) Sha Tin, Hong Kong (d) Loire Valley, France
Figure 3.4-14 Examples of sound barriers for rail corridors
(Photographs courtesy of Harris Miller Miller & Hanson Inc. 2012.)
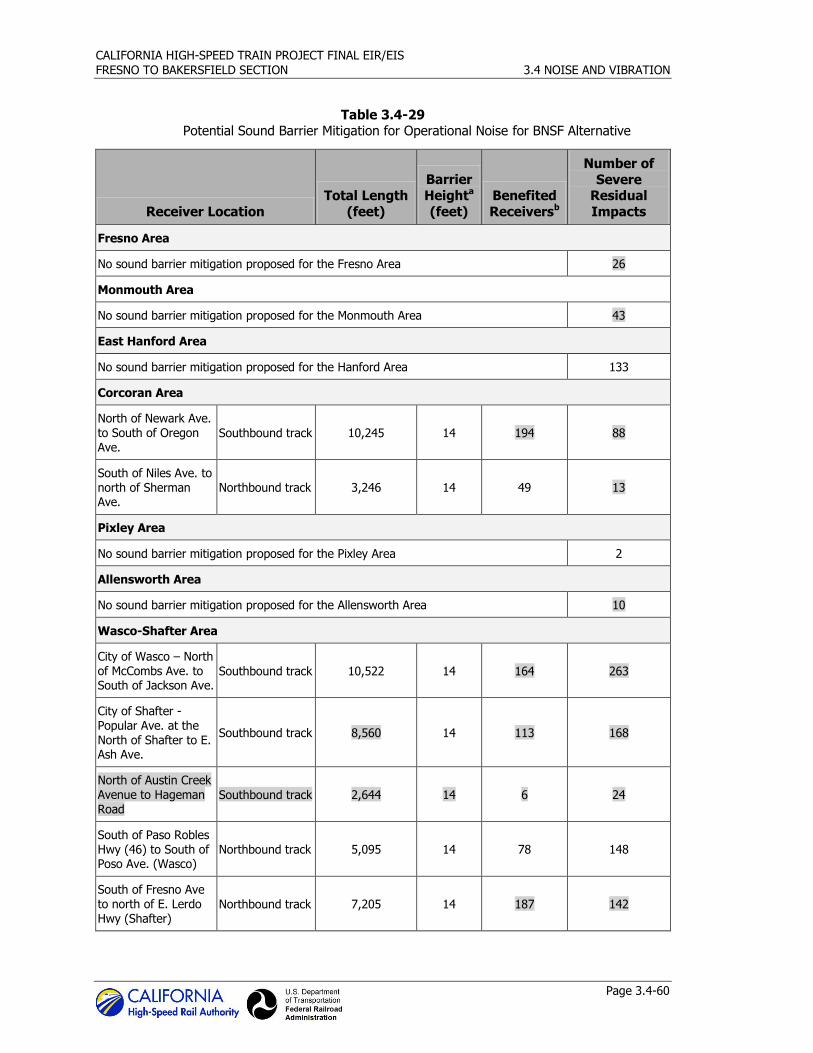
CALIFORNIA HIGH-SPEED TRAIN PROJECT FINAL EIR/EIS
FRESNO TO BAKERSFIELD SECTION 3.4 NOISE AND VIBRATION
Page 3.4-60
Table 3.4-29 Potential Sound Barrier Mitigation for Operational Noise for BNSF Alternative
Receiver Location
Total Length
(feet)
Barrier
Heighta
(feet)
Benefited
Receiversb
Number of
Severe Residual
Impacts
Fresno Area
No sound barrier mitigation proposed for the Fresno Area 26
Monmouth Area
No sound barrier mitigation proposed for the Monmouth Area 43
East Hanford Area
No sound barrier mitigation proposed for the Hanford Area 133
Corcoran Area
North of Newark Ave. to South of Oregon Ave.
Southbound track 10,245 14 194 88
South of Niles Ave. to north of Sherman Ave.
Northbound track 3,246 14 49 13
Pixley Area
No sound barrier mitigation proposed for the Pixley Area 2
Allensworth Area
No sound barrier mitigation proposed for the Allensworth Area 10
Wasco-Shafter Area
City of Wasco – North of McCombs Ave. to South of Jackson Ave.
Southbound track 10,522 14 164 263
City of Shafter - Popular Ave. at the North of Shafter to E. Ash Ave.
Southbound track 8,560 14 113 168
North of Austin Creek Avenue to Hageman
Road Southbound track 2,644 14 6 24
South of Paso Robles Hwy (46) to South of Poso Ave. (Wasco)
Northbound track 5,095 14 78 148
South of Fresno Ave to north of E. Lerdo Hwy (Shafter)
Northbound track 7,205 14 187 142
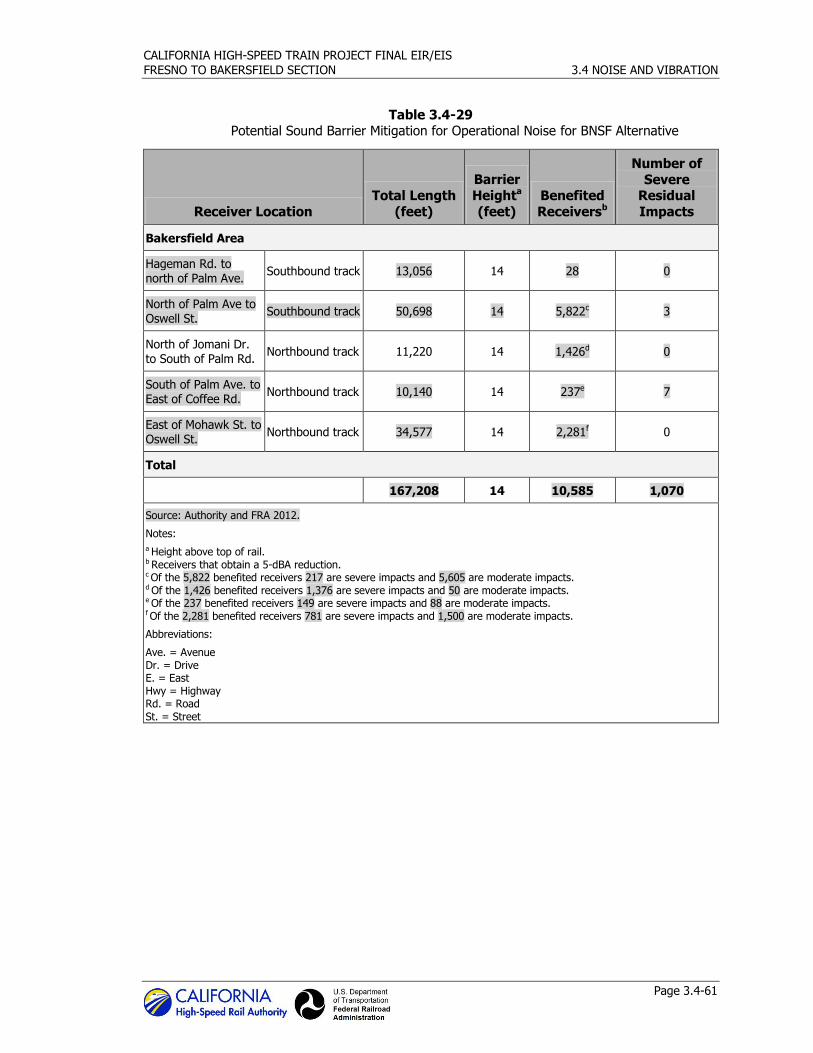
CALIFORNIA HIGH-SPEED TRAIN PROJECT FINAL EIR/EIS
FRESNO TO BAKERSFIELD SECTION 3.4 NOISE AND VIBRATION
Page 3.4-61
Table 3.4-29 Potential Sound Barrier Mitigation for Operational Noise for BNSF Alternative
Receiver Location
Total Length
(feet)
Barrier
Heighta
(feet)
Benefited
Receiversb
Number of
Severe Residual
Impacts
Bakersfield Area
Hageman Rd. to north of Palm Ave.
Southbound track 13,056 14 28 0
North of Palm Ave to Oswell St.
Southbound track 50,698 14 5,822c 3
North of Jomani Dr. to South of Palm Rd.
Northbound track 11,220 14 1,426d 0
South of Palm Ave. to East of Coffee Rd.
Northbound track 10,140 14 237e 7
East of Mohawk St. to Oswell St.
Northbound track 34,577 14 2,281f 0
Total
167,208 14 10,585 1,070
Source: Authority and FRA 2012.
Notes:
a Height above top of rail. b Receivers that obtain a 5-dBA reduction. c Of the 5,822 benefited receivers 217 are severe impacts and 5,605 are moderate impacts. d Of the 1,426 benefited receivers 1,376 are severe impacts and 50 are moderate impacts. e Of the 237 benefited receivers 149 are severe impacts and 88 are moderate impacts. f Of the 2,281 benefited receivers 781 are severe impacts and 1,500 are moderate impacts.
Abbreviations:
Ave. = Avenue Dr. = Drive E. = East Hwy = Highway Rd. = Road St. = Street
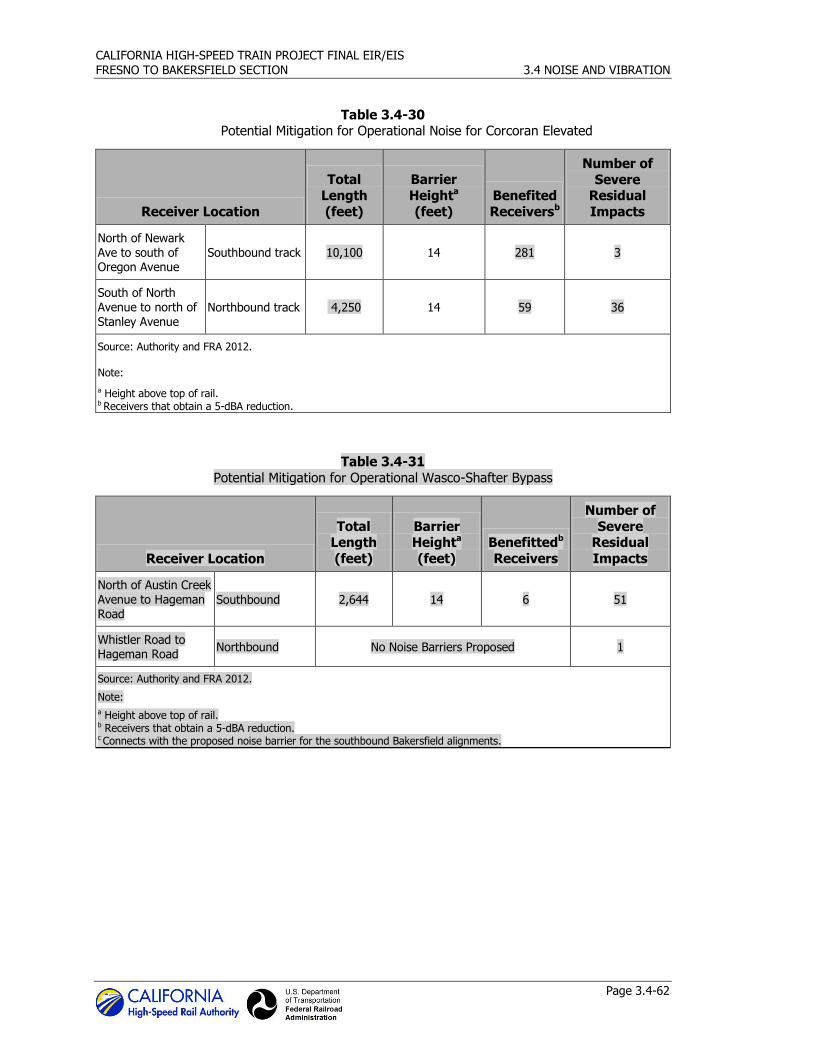
CALIFORNIA HIGH-SPEED TRAIN PROJECT FINAL EIR/EIS
FRESNO TO BAKERSFIELD SECTION 3.4 NOISE AND VIBRATION
Page 3.4-62
Table 3.4-30 Potential Mitigation for Operational Noise for Corcoran Elevated
Receiver Location
Total
Length
(feet)
Barrier
Heighta
(feet)
Benefited
Receiversb
Number of
Severe Residual
Impacts
North of Newark Ave to south of Oregon Avenue
Southbound track 10,100 14 281 3
South of North Avenue to north of Stanley Avenue
Northbound track 4,250 14 59 36
Source: Authority and FRA 2012.
Note:
a Height above top of rail. b Receivers that obtain a 5-dBA reduction.
Table 3.4-31
Potential Mitigation for Operational Wasco-Shafter Bypass
Receiver Location
Total Length
(feet)
Barrier Heighta
(feet)
Benefittedb
Receivers
Number of
Severe Residual
Impacts
North of Austin Creek Avenue to Hageman Road
Southbound 2,644 14 6 51
Whistler Road to Hageman Road
Northbound No Noise Barriers Proposed 1
Source: Authority and FRA 2012.
Note:
a Height above top of rail. b Receivers that obtain a 5-dBA reduction. c Connects with the proposed noise barrier for the southbound Bakersfield alignments.
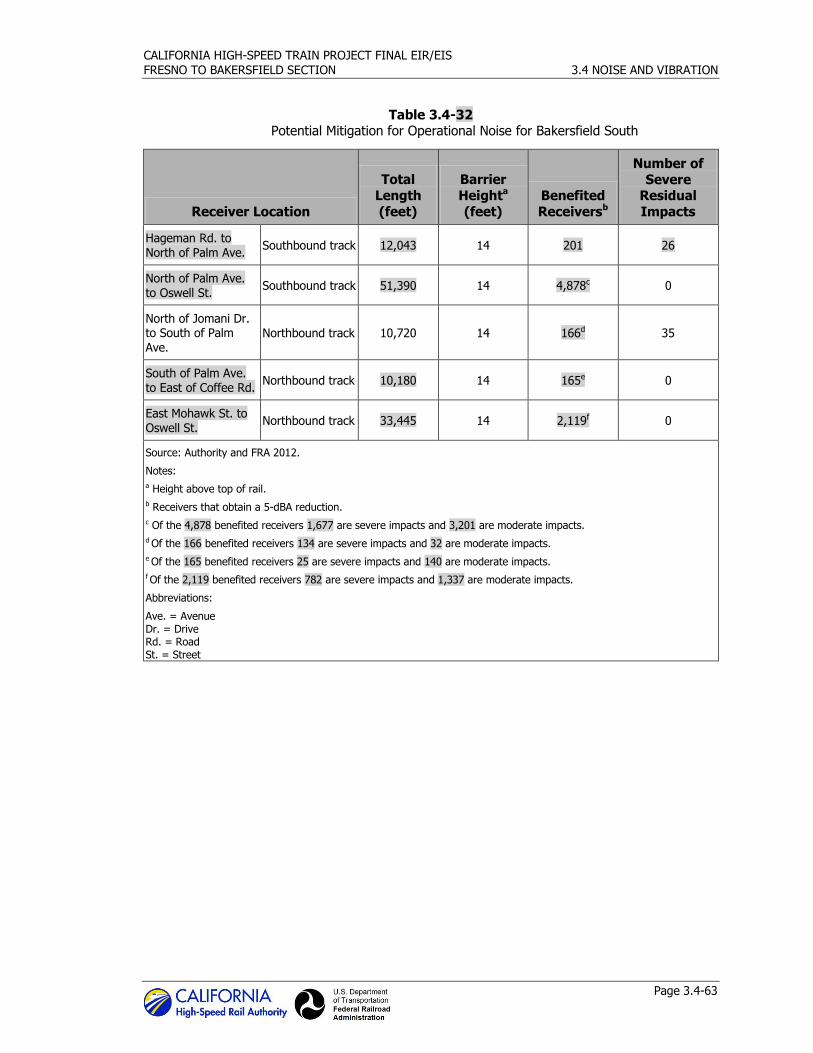
CALIFORNIA HIGH-SPEED TRAIN PROJECT FINAL EIR/EIS
FRESNO TO BAKERSFIELD SECTION 3.4 NOISE AND VIBRATION
Page 3.4-63
Table 3.4-32 Potential Mitigation for Operational Noise for Bakersfield South
Receiver Location
Total
Length
(feet)
Barrier
Heighta
(feet)
Benefited
Receiversb
Number of
Severe Residual
Impacts
Hageman Rd. to North of Palm Ave.
Southbound track 12,043 14 201 26
North of Palm Ave. to Oswell St.
Southbound track 51,390 14 4,878c 0
North of Jomani Dr. to South of Palm
Ave. Northbound track 10,720 14 166d 35
South of Palm Ave. to East of Coffee Rd.
Northbound track 10,180 14 165e 0
East Mohawk St. to Oswell St.
Northbound track 33,445 14 2,119f 0
Source: Authority and FRA 2012.
Notes:
a Height above top of rail.
b Receivers that obtain a 5-dBA reduction.
c Of the 4,878 benefited receivers 1,677 are severe impacts and 3,201 are moderate impacts.
d Of the 166 benefited receivers 134 are severe impacts and 32 are moderate impacts.
e Of the 165 benefited receivers 25 are severe impacts and 140 are moderate impacts.
f Of the 2,119 benefited receivers 782 are severe impacts and 1,337 are moderate impacts.
Abbreviations:
Ave. = Avenue Dr. = Drive Rd. = Road St. = Street
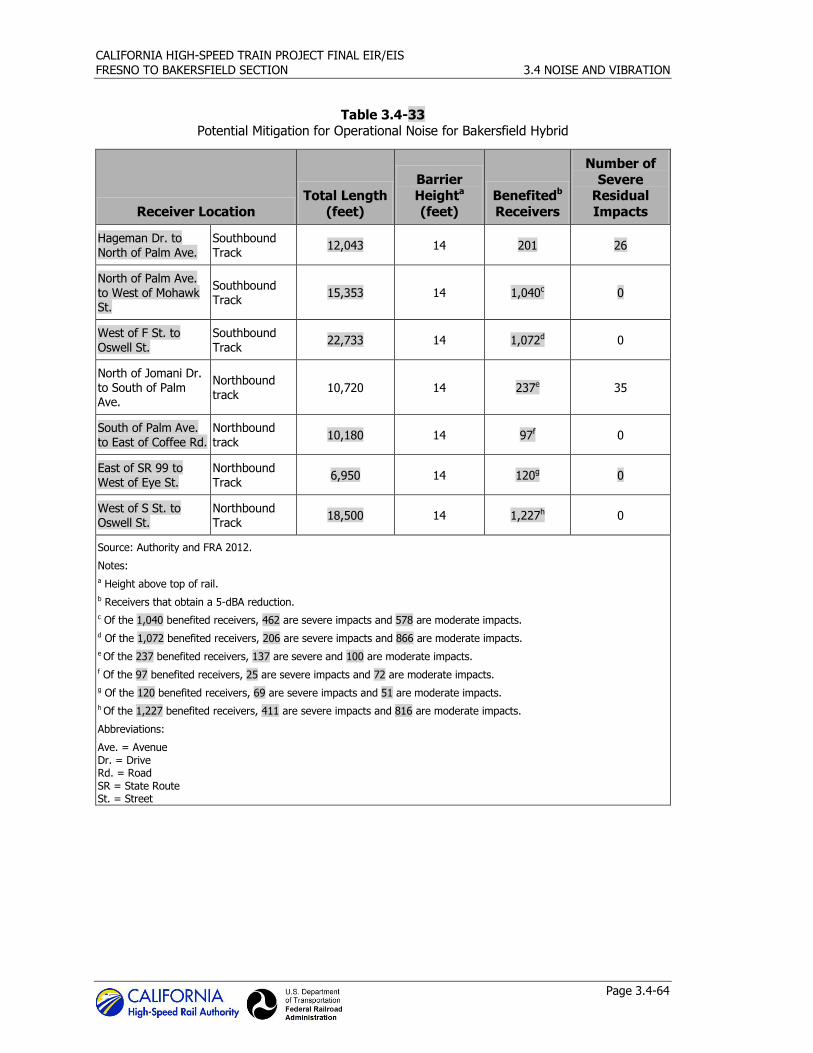
CALIFORNIA HIGH-SPEED TRAIN PROJECT FINAL EIR/EIS
FRESNO TO BAKERSFIELD SECTION 3.4 NOISE AND VIBRATION
Page 3.4-64
Table 3.4-33 Potential Mitigation for Operational Noise for Bakersfield Hybrid
Receiver Location
Total Length
(feet)
Barrier
Heighta
(feet)
Benefitedb
Receivers
Number of
Severe Residual
Impacts
Hageman Dr. to North of Palm Ave.
Southbound Track
12,043 14 201 26
North of Palm Ave. to West of Mohawk St.
Southbound Track
15,353 14 1,040c 0
West of F St. to
Oswell St.
Southbound
Track 22,733 14 1,072d 0
North of Jomani Dr. to South of Palm Ave.
Northbound track
10,720 14 237e 35
South of Palm Ave. to East of Coffee Rd.
Northbound track
10,180 14 97f 0
East of SR 99 to West of Eye St.
Northbound Track
6,950 14 120g 0
West of S St. to Oswell St.
Northbound Track
18,500 14 1,227h 0
Source: Authority and FRA 2012.
Notes:
a Height above top of rail.
b Receivers that obtain a 5-dBA reduction.
c Of the 1,040 benefited receivers, 462 are severe impacts and 578 are moderate impacts.
d Of the 1,072 benefited receivers, 206 are severe impacts and 866 are moderate impacts.
e Of the 237 benefited receivers, 137 are severe and 100 are moderate impacts.
f Of the 97 benefited receivers, 25 are severe impacts and 72 are moderate impacts.
g Of the 120 benefited receivers, 69 are severe impacts and 51 are moderate impacts.
h Of the 1,227 benefited receivers, 411 are severe impacts and 816 are moderate impacts.
Abbreviations:
Ave. = Avenue Dr. = Drive Rd. = Road SR = State Route St. = Street
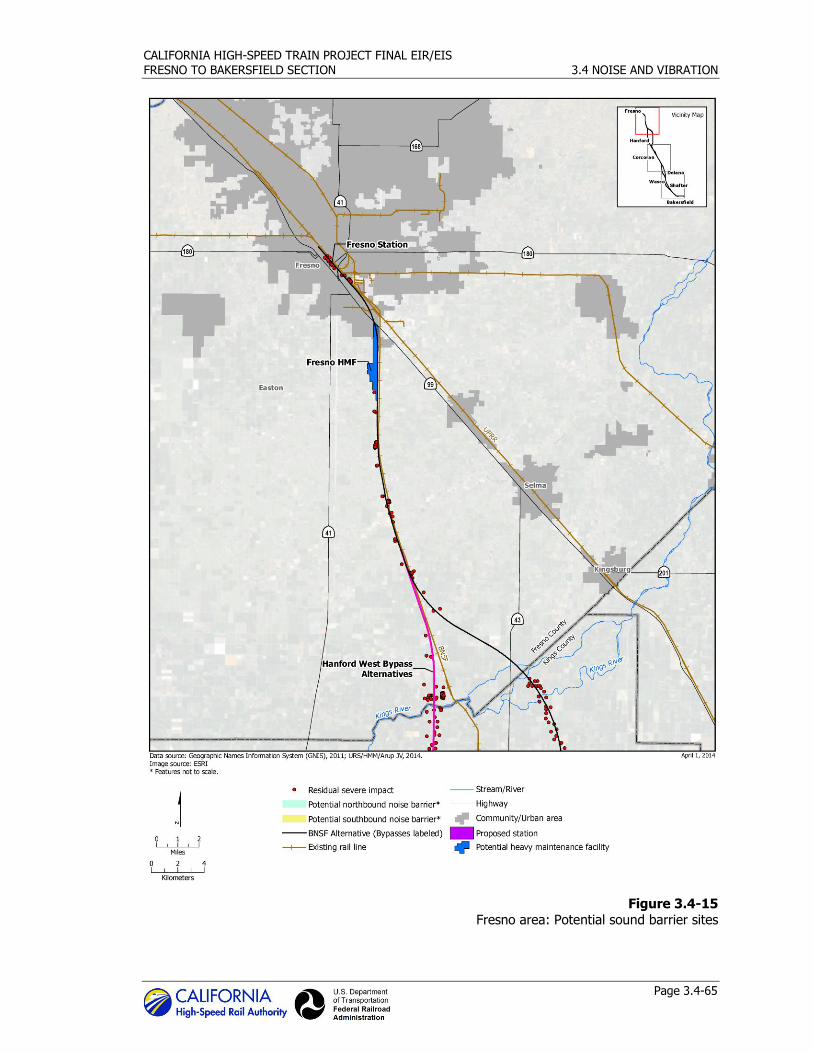
CALIFORNIA HIGH-SPEED TRAIN PROJECT FINAL EIR/EIS
FRESNO TO BAKERSFIELD SECTION 3.4 NOISE AND VIBRATION
Page 3.4-65
Figure 3.4-15
Fresno area: Potential sound barrier sites
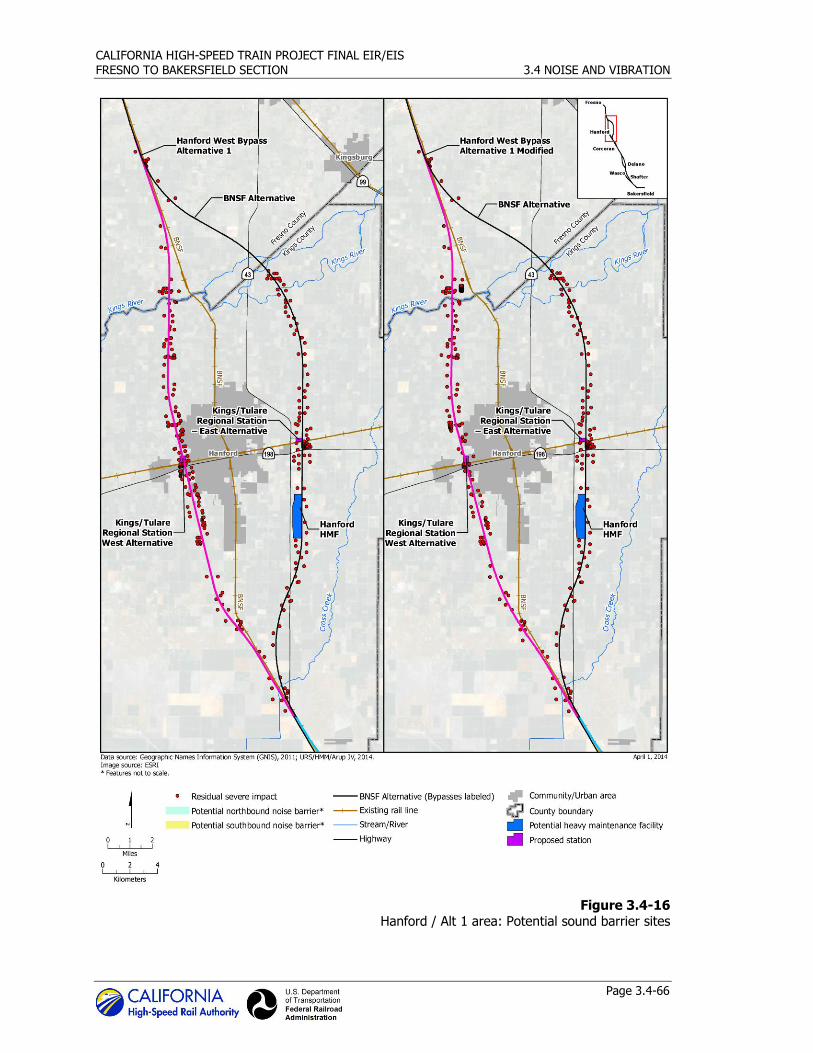
CALIFORNIA HIGH-SPEED TRAIN PROJECT FINAL EIR/EIS
FRESNO TO BAKERSFIELD SECTION 3.4 NOISE AND VIBRATION
Page 3.4-66
Figure 3.4-16 Hanford / Alt 1 area: Potential sound barrier sites
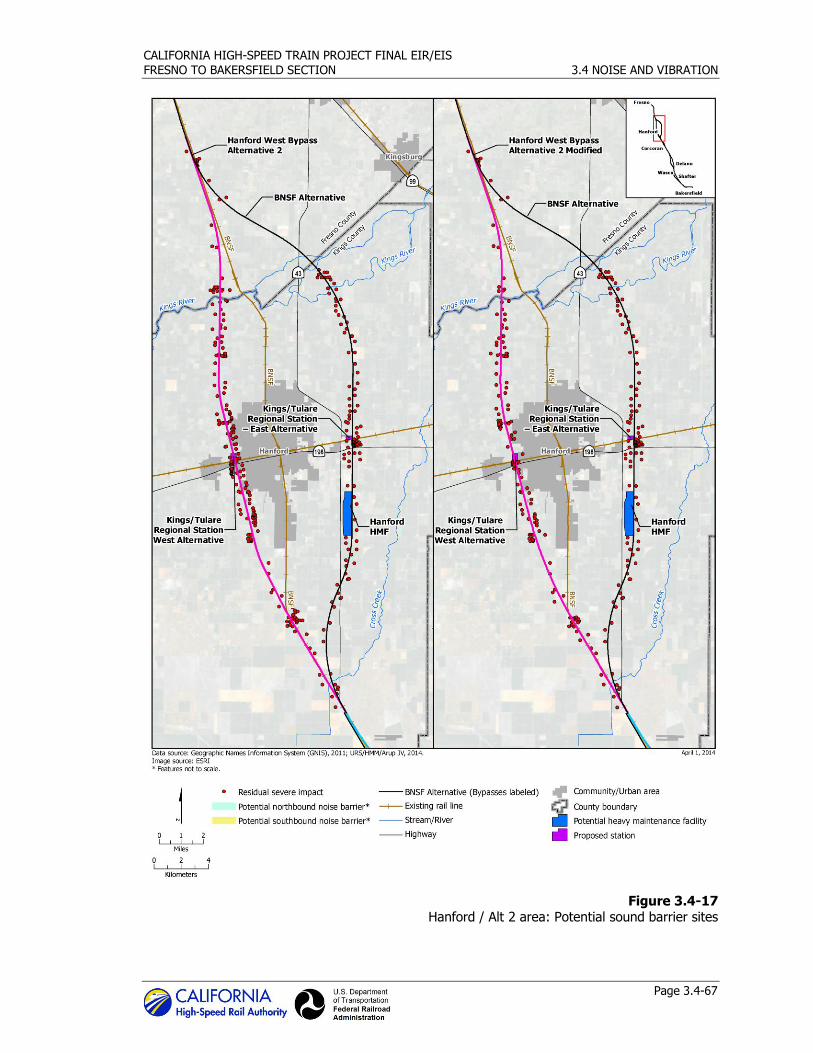
CALIFORNIA HIGH-SPEED TRAIN PROJECT FINAL EIR/EIS
FRESNO TO BAKERSFIELD SECTION 3.4 NOISE AND VIBRATION
Page 3.4-67
Figure 3.4-17 Hanford / Alt 2 area: Potential sound barrier sites
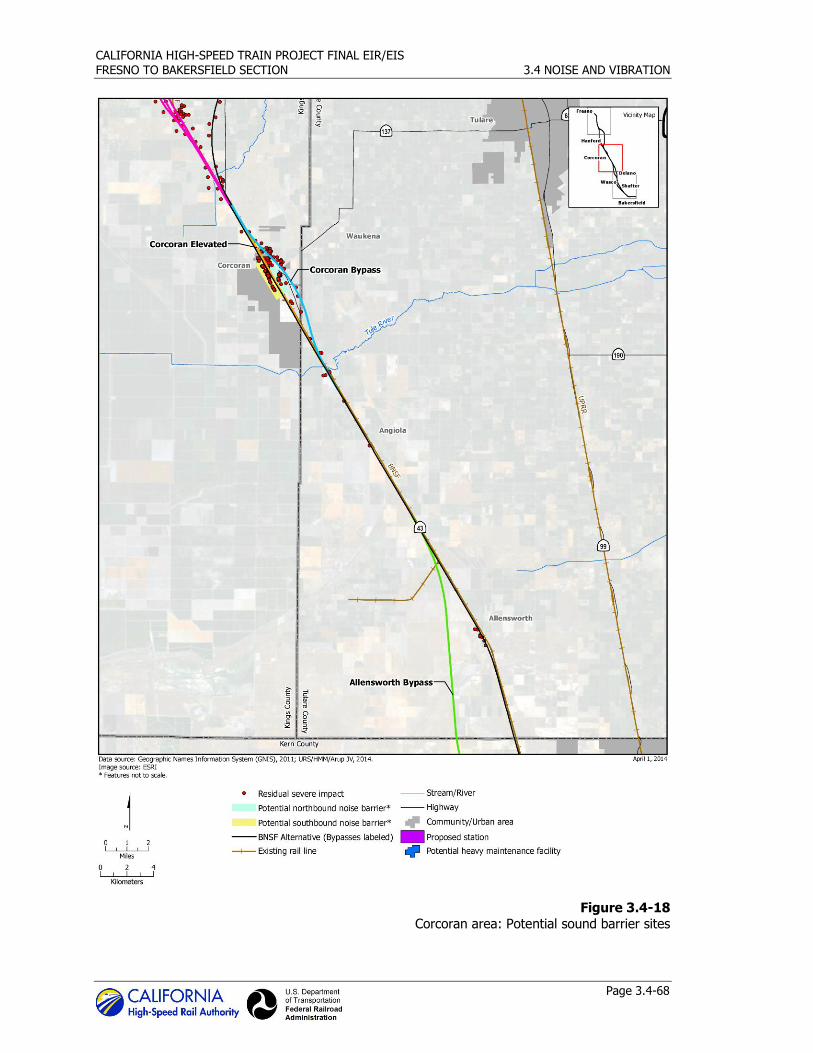
CALIFORNIA HIGH-SPEED TRAIN PROJECT FINAL EIR/EIS
FRESNO TO BAKERSFIELD SECTION 3.4 NOISE AND VIBRATION
Page 3.4-68
Figure 3.4-18
Corcoran area: Potential sound barrier sites
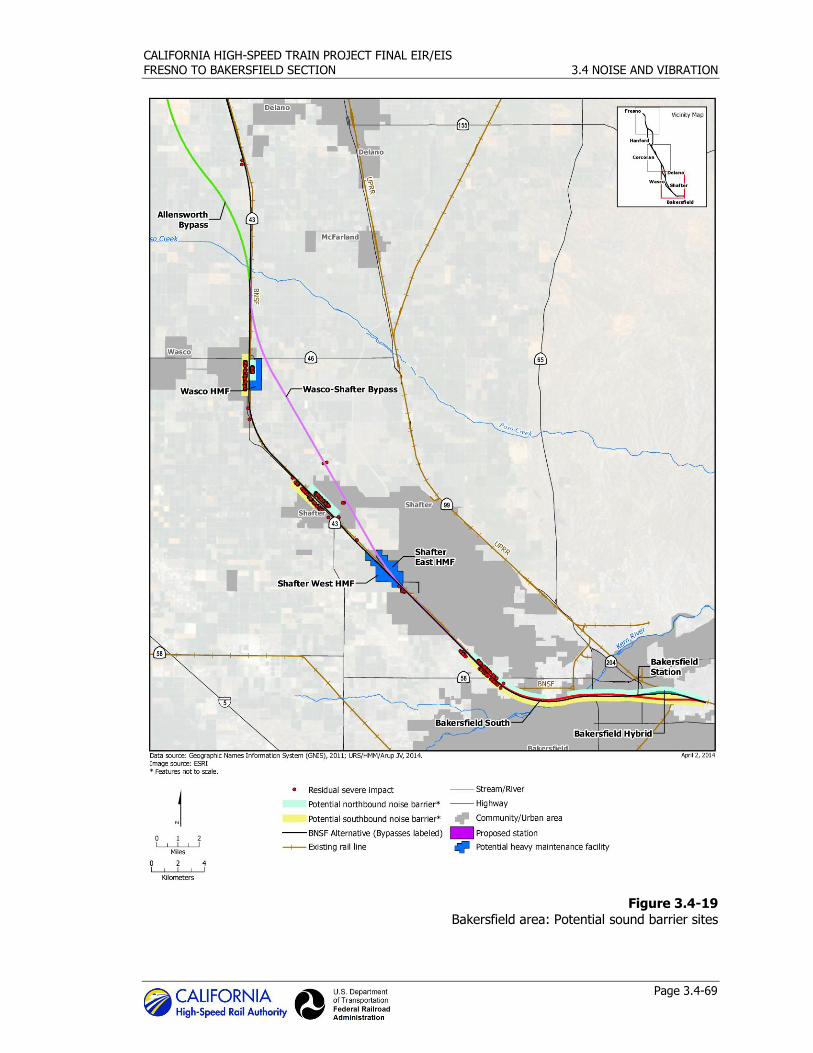
CALIFORNIA HIGH-SPEED TRAIN PROJECT FINAL EIR/EIS
FRESNO TO BAKERSFIELD SECTION 3.4 NOISE AND VIBRATION
Page 3.4-69
Figure 3.4-19
Bakersfield area: Potential sound barrier sites
CALIFORNIA HIGH-SPEED TRAIN PROJECT FINAL EIR/EIS
FRESNO TO BAKERSFIELD SECTION 3.4 NOISE AND VIBRATION
Page 3.4-70
Hanford West Bypass 1 Alternative (At-Grade) Potential Mitigation Locations
This portion of the project alignment travels around the western side of Hanford, extending from
just south of Kamm Avenue to south of SR 43. This alternative alignment will be at-grade from Kamm Avenue to just south of Barrett Avenue. After passing Barrett Avenue, the alternative
alignment will incline to 40 feet above ground level until passing Douglas Avenue. After passing Douglas Avenue, the alternative alignment will decline back to ground level and continue at
ground level until connecting with the Corcoran alignment. At the southern end of this alternative alignment, the rail line will bow out to the west from Jackson Avenue to Kansas Avenue before
connecting with the Corcoran alignment. A total of 192 severe noise impact sites along the
western and eastern sides of this alternative are not suitable for sound barriers because they are shown to be economically unfeasible. Other mitigation in the form of building insulation or
payment of property noise easements would be implemented to reduce impacts at these locations.
Hanford West Bypass 1 Alternative Modified (Below-Grade) Potential Mitigation Locations
This portion of the project alignment travels around the western side of Hanford, extending from just south of Kamm Avenue to south of SR 43. This alternative alignment will be at-grade from
just south of Kamm Avenue to north of Riverdale Avenue. Just before passing Riverdale Avenue,
the alternative alignment will incline to 40 feet above ground level until passing over Kings River. After passing Kings River, the alternative alignment will decline back to ground level and continue
at ground level until connecting with the Corcoran alignment. A total of 254 severe noise impact sites along the western and eastern sides of this alternative are not suitable for sound barriers
because they are shown to be economically unfeasible. Other mitigation in the form of building insulation or payment of property noise easements would be implemented to reduce impacts at
these locations.
Hanford West Bypass 2 Alternative (At-Grade) Potential Mitigation Locations
This portion of the project alignment travels around the western side of Hanford, extending from just south of Kamm Avenue to south of Highway 43. This alternative alignment will be at-grade
from Kamm Avenue to just south of Barrett Avenue. After passing Barrett Avenue, the alternative
alignment will incline to 40 feet above ground level until passing Douglas Avenue. After passing Douglas Avenue, the alternative alignment will decline back to ground level and continue at
ground level until connecting with the Corcoran alignment. A total of 212 severe noise impact sites along the western and eastern sides of this alternative are not suitable for sound barriers
because they are shown to be economically unfeasible. Other mitigation in the form of building
insulation or payment of property noise easements would be implemented to reduce impacts at these locations.
Hanford West Bypass 2 Alternative Modified (Below-Grade) Potential Mitigation Locations
This portion of the project alignment travels around the western side of Hanford, extending from just south of Kamm Avenue to south of SR 43. This alternative alignment will be at-grade from
just south of Kamm Avenue to north of Riverdale Avenue. Just before passing Riverdale Avenue, the alternative alignment will incline to 40 feet above ground level until passing over Kings River.
After passing Kings River, the alternative alignment will decline back to ground level and continue
at ground level until connecting with the Corcoran alignment. A total of 188 severe noise impact sites along the western and eastern sides of this alternative are not suitable for sound barriers
because they are shown to be economically unfeasible. Other mitigation in the form of building
CALIFORNIA HIGH-SPEED TRAIN PROJECT FINAL EIR/EIS
FRESNO TO BAKERSFIELD SECTION 3.4 NOISE AND VIBRATION
Page 3.4-71
insulation or payment of property noise easements would be implemented to reduce impacts at
these locations.
Corcoran Bypass Alternative Potential Mitigation Locations
This portion of the project alignment extends from just north of Idaho Avenue to just northwest
of the intersection of Avenue 128 and Road 32. Around the eastern side of the City of Corcoran,
this alignment would be at-grade at an elevation of about 10 feet above the existing grade. A total of 86 severe noise impact sites along the western and eastern sides of this alternative are
not suitable for sound barriers because they are shown to be economically unfeasible. Other mitigation in the form of building insulation or payment of property noise easements would be
implemented to reduce impacts at these locations.
Corcoran Elevated Alternative Potential Mitigation Locations
This portion of the project alignment extends from just north of Idaho Avenue to just northwest of the intersection of Avenue 128 and Road 32. This alignment goes through Corcoran as an
elevated alignment. This alternative will be elevated 33 feet above ground level from Niles
Avenue south to 4th Avenue. The elevated alternative would be constructed on the eastern side of the BNSF track. Barrier 1 of this alternative would be on the southbound side of the alignment
north of Newark Avenue to the south of Oregon Avenue. The total length of the barrier would be approximately 10,100 feet, and the height would be 14 feet. This barrier would benefit
approximately 281 residential receivers. Barrier 2 of this alternative would be on the northbound side of the alignment south of North Avenue to north of Stanley Avenue. The total length of the
barrier would be approximately 4,250 feet, and the height would be 14 feet. This barrier would
benefit approximately 59 residential receivers. A total of 39 severe noise impact sites along the western and eastern sides of this section would not benefit from this barrier because they are
shown to be economically unfeasible. The sound barrier results are presented in Table 3.4-32. Additional mitigation in the form of building insulation or payment of property noise easements
would be implemented to reduce impacts at sensitive receivers not protected by sound barriers.
Allensworth Bypass Alternative Potential Mitigation Locations
This portion of the project alignment extends from just south of Avenue 84 to just south of Elmo Highway. The Allensworth Bypass Alternative would be at-grade and elevated to a height of
approximately 8 feet above the existing grade. No noise receivers would be severely affected by
this alternative.
Wasco-Shafter Bypass Alternative Potential Mitigation Locations
This portion of the project alignment extends from just northwest of Whisler Road to the
intersection of Hageman Road and Rosedale Lane. This alignment is the only one under
consideration for this portion of the project. The Wasco-Shafter Bypass, which runs around the eastern side of the City of Wasco and the City of Shafter, would be at-grade at an elevation of
about 10 feet above the existing grade. The only exception would be the grade separation at 7th Standard Road. At this location, this alternative would be elevated to a height of 60 feet
above-grade. Barrier 1 of this alternative, which connects with the Bakersfield alternatives’ noise
barrier, would be on the southbound side of the alignment north of Austin Creek Avenue to Hageman Road. The total length of the barrier would be approximately 2,644 feet, and the
height would be 14 feet. This barrier would benefit approximately 6 residential receivers. The sound barrier results are presented in Table 3.4-33. A total of 58 severe noise impact sites along
this alternative are not suitable for sound barriers because they are shown to be economically unfeasible. Other mitigation in the form of building insulation or payment of property noise
easements would be implemented to reduce impacts at these locations.
CALIFORNIA HIGH-SPEED TRAIN PROJECT FINAL EIR/EIS
FRESNO TO BAKERSFIELD SECTION 3.4 NOISE AND VIBRATION
Page 3.4-72
Bakersfield South Alternative Potential Mitigation Locations
This portion of the project alignment extends from the intersection of Hageman Road and
Rosedale Lane past the east end of the proposed station in downtown Bakersfield to Oswell Street. The Bakersfield South Alternative would be at-grade for the western portion of the
alignment (for approximately 11,330 feet), and then would be elevated to a height ranging from 50 to 80 feet throughout the rest of this segment of the project alignment.
Refinements to the height of the Bakersfield South alignment and the addition of moderately
impacted receivers being counted as benefited receivers resulted in the refinements to the proposed noise barriers along the Bakersfield South Alternative. These refinements included
adjustments in barrier length and, in some cases, resulted in the merging of previously separated
noise barriers.
Barrier 1 for the Bakersfield South Alternative would be built on the southbound side of the
alignment from north of Hageman Road to north of Palm Avenue. The total length of the barrier
would be approximately 12,043 feet, and the height would be 14 feet. This barrier would benefit approximately 201 receivers, all of which are severe-impact receivers.
Barrier 2 of the Bakersfield South Alternative would be built on the southbound side of the
alignment from north of Palm Avenue to south of Oswell Street. The total length of the barrier would be approximately 51,390 feet, and the height would be 14 feet. This barrier would benefit
approximately 4,878 residential receivers, 1,677 of which are severe-impact receivers and 3,201 are moderate-impact receivers.
Barrier 3 of the Bakersfield South Alternative would be built on the northbound side of the
alignment from north of Jomani Drive to south of Palm Avenue. The total length of the barrier
would be approximately 10,720 feet, and the height would be 14 feet. This barrier would benefit approximately 166 receivers, of which 134 are severe-impact receivers, and 32 are moderate-
impact receivers.
Barrier 4 of the Bakersfield South Alternative would be built on the northbound side of the alignment from south of Palm Avenue to east of Coffee Road. The total length of the barrier
would be approximately 10,180 feet, and the height would be 14 feet. This barrier would benefit approximately 165 receivers, of which 25 are severe-impact receivers, and 140 are moderate-
impact receivers.
Barrier 5 of the Bakersfield South Alternative would be built on the northbound side of the alignment east of Mohawk Street to Oswell Street. The total length of the barrier would be
approximately 33,445 feet, and the height would be 14 feet. This barrier would benefit
approximately 2,119 residential receivers, of which 782 are severe-impact receivers and 1,337 are moderate-impact receivers.
A total of 61 severe noise impact sites along this section would not completely benefit from this
barrier due to the specific site geometry; these receivers would receive less than a 5 dB reduction from the recommended noise barriers. The sound barrier results are presented in Table 3.4-34
(below). Additional mitigation in the form of a taller barrier, building insulation or payment of
property noise easements would be implemented to reduce impacts at sensitive receivers not protected by sound barriers.
Bakersfield Hybrid Alternative Potential Mitigation Locations
This portion of the project alignment would be a hybrid of the Bakersfield South Alternative and
the BNSF Bakersfield Alternative. The Bakersfield Hybrid Alternative would have the same alignment as the Bakersfield South Alternative from Hageman Road to between SR 99 and the
CALIFORNIA HIGH-SPEED TRAIN PROJECT FINAL EIR/EIS
FRESNO TO BAKERSFIELD SECTION 3.4 NOISE AND VIBRATION
Page 3.4-73
Convention Center, and then follow the BNSF Bakersfield alignment east of the convention center
to Oswell Street. The Bakersfield Hybrid Alternative would curve further to the north than the BNSF Bakersfield alignment between Union Avenue and Mount Vernon Avenue, where the train’s
speed would decrease to between 125 and 150 mph.
Barrier 1 for the Bakersfield Hybrid Alternative would be built on the southbound side of the alignment from Hageman Road to north of Palm Avenue. The total length of the barrier would be
approximately 12,043 feet, and the height would be 14 feet. This barrier would benefit approximately 201 severe-impact receivers.
Barrier 2 of the Bakersfield Hybrid Alternative would be built on the southbound side of the
alignment from north of Palm Avenue to west of Mohawk Street. The total length of the barrier
would be approximately 15,353 feet, and the height would be 14 feet. This barrier would benefit approximately 1,040 residential receivers, of which 462 are severe-impact receivers and 578 are
moderate-impact receivers.
Barrier 3 of the Bakersfield Hybrid Alternative would be built on the southbound side of the alignment from west of F Street to Oswell Street. The total length of the barrier would be
approximately 22,733 feet, and the height would be 14 feet. This barrier would benefit approximately 1,072 residential receivers, of which 206 are severe-impact receivers and 866 are
moderate-impact receivers.
Barrier 4 of the Bakersfield Hybrid Alternative would be built on the northbound side of the alignment from north of Jomani Drive to south of Palm Avenue. The total length of the barrier
would be approximately 10,720 feet, and the height would be 14 feet. This barrier would benefit
approximately 237 residential receivers, of which 137 are severe-impact receivers and 100 are moderate-impact receivers.
Barrier 5 of the Bakersfield Hybrid Alternative would be built on the northbound side of the
alignment from south of Palm Avenue to east of Coffee Road. The total length of the barrier would be approximately 10,180 feet, and the height would be 14 feet. This barrier would benefit
approximately 97 receivers, of which 25 are severe-impact receivers and 72 are moderate-impact receivers.
Barrier 6 of the Bakersfield Hybrid Alternative would be built on the northbound side of the
alignment from east of SR 99 to west of Eye Street. The total length of the barrier would be
approximately 6,950 feet, and the height would be 14 feet. This barrier would benefit approximately 120 receivers, of which 69 are severe-impact receivers and 51 are moderate-
impact receivers.
Barrier 7 of the Bakersfield Hybrid Alternative would be built on the northbound side of the alignment from west of S Street to Oswell Street. The total length of the barrier would be
approximately 18,500 feet, and the height would be 14 feet. This barrier would benefit approximately 1,227 receivers, of which 411 are severe-impact receivers and 816 are moderate-
impact receivers.
A total of 61 severe noise impact sites along the western and eastern sides of this segment
would not benefit from these barriers; due to the specific site geometry, these receivers would receive less than a 5 dB reduction from the recommended noise barriers. The sound barrier
results are presented in Table 3.4-35 (below). Additional mitigation in the form of a taller barrier, building insulation or payment of property noise easements would be implemented to reduce
impacts at sensitive receivers not protected by sound barriers.
CALIFORNIA HIGH-SPEED TRAIN PROJECT FINAL EIR/EIS
FRESNO TO BAKERSFIELD SECTION 3.4 NOISE AND VIBRATION
Page 3.4-74
Heavy Maintenance Facility Alternatives
All the HMF site alternatives for the Fresno to Bakersfield Section are along the BNSF Alternative.
The proposed sound barriers for these locations are shown on Figures 3.4-14 through 3.4-19.
Schools
With implementation of the proposed sound barriers, only the College of the Sequoias along the
Hanford West Bypass 1 and Bypass 2 alternatives at-grade would experience severe noise
impacts because no sound wall is proposed along those alternatives. As discussed above, however, non-barrier mitigation in the form of building insulation is available to mitigate those
impacts.
N&V-MM#4: Vehicle noise specification. In the procurement of an HST vehicle technology, the Authority will require bidders to meet the federal regulations (40 CFR Part 201.12/13) at the
time of procurement for locomotives (currently a 90-dB-level standard), for cars operating at speeds of greater than 45 mph. Depending on the available technology, this could significantly
reduce the number of impacts throughout the corridor.
N&V-MM#5: Special trackwork at crossovers and turnouts. Because the impacts of HST wheels over rail gaps at turnouts increases HST noise by approximately 6 dB over typical
operations, turnouts can be a major source of noise impact. If the turnouts cannot be moved
from sensitive areas, the project can use special types of trackwork that eliminate the gap.
N&V-MM#6: Additional noise and vibration analysis following final design. If final design or final vehicle specifications result in changes to the assumptions underlying the noise
and vibration analysis (including analysis regarding resident and business displacements), reassess noise and vibration impacts and recommendations for mitigation and provide
supplemental environmental documentation, as required by law.
Traffic Noise Impacts
Several single-family homes will be subject to traffic peak-hour noise levels in excess of 66 dBA Leq. These noise levels would exceed the Caltrans Noise Abatement Approach Criteria and
potentially require the preparation of Noise Study Reports and noise mitigation measures. In determining the reasonableness of abatement, FHWA highway traffic noise regulation requires,
among other factors, the feasibility of the noise mitigation measure as well as the consideration
of the viewpoints of the affected residents and property owners. Feasibility generally deals with considering whether it is possible to build an abatement measure, given site constraints; and
whether the abatement measure provides a minimum reduction in noise levels. Feasibility also requires that all of the homes potentially affected face the roadway from which the noise
emanates. As a result, noise mitigation measures would be infeasible for any home with a
driveway for which access must be maintained. The noise barrier would not be continuous, and subsequently would not provide the minimum 5 dB of noise reduction. A noise abatement
measure is not feasible unless the measure achieves a noise reduction of at least 5 dBA for front-row receivers. Highway noise barriers are designed to protect areas of “frequent human use,”
which generally do not include the front yards of homes. Also, Caltrans does not generally put
noise barriers across the front yards of homes because they are acoustically infeasible and because most homeowners wish to maintain the views from the fronts of their homes.
N&V-MM#7: Heavy maintenance facilities. In order to reduce the noise from the heavy
maintenance facilities, the following noise mitigation measures are recommended:
Enclose as many of the maintenance activities within the facility as possible.
CALIFORNIA HIGH-SPEED TRAIN PROJECT FINAL EIR/EIS
FRESNO TO BAKERSFIELD SECTION 3.4 NOISE AND VIBRATION
Page 3.4-75
Eliminate windows in the maintenance building that would face toward noise sensitive land
uses adjacent to the facility. If windows are required to be located on the side of the facility
facing noise-sensitive land uses, they should be the fixed type of windows with a sound transmission class (STC) rating of at least 35. If the windows must be operable, they should
be closed during nighttime maintenance activities.
Close maintenance facility doors where the rails enter the facility during nighttime
maintenance activities.
Maintenance tracks that cannot be located within the maintenance facility should be located
on the far side of the facility from adjacent noise-sensitive receivers.
For maintenance tracks that cannot be installed away from noise-sensitive receivers, install
sound barrier along the maintenance tracks in order to protect the adjacent noise-sensitive
receivers.
All mechanical equipment (compressors, pumps, generators, etc.) should be located within
the maintenance facility structure.
Any mechanical equipment located exterior to the maintenance facility (compressors, pumps,
generators, etc.) should be located on the far side of the facility from adjacent noise-sensitive receivers. If this is not possible, this equipment should be located within noise
enclosures to mitigate the noise during operation.
All ventilation ducting for the maintenance facility should be pointed away from the adjacent
noise-sensitive receivers.
Vibration
N&V-MM#8: Implement Proposed California High-Speed Train Project Noise and Vibration Mitigation Guidelines. For existing rail, adequate wheel and rail maintenance are
very important in preventing vibration impacts. Rough wheels and rails can increase vibration
levels by as much as 20 VdB, which can negate any vibration control measures. It is rare when practical vibration control measures provide up to 15 to 20 VdB in attenuation. When possible, it
is best to grind rough or corrugated rail and implement wheel truing to restore the wheel surface and contour. This may reduce vibration more than completely replacing the existing track system
with floating slabs.
If the train, railway and railway structures are in good condition, then other mitigation methods must be examined. Mitigation will fit into one of the categories found in Table 3.4-34, which lists
where the mitigation procedure will take place. Mitigation can take place at the source, sensitive
receiver, or along the propagation path from the source to the sensitive receiver. Table 3.4-34 also provides a description of each type of mitigation procedure. As listed therein, for properties
that are impacted by vibration in areas where the other listed mitigation methods are not feasible, the Authority would attempt to negotiate a vibration easement with property owners, or
the Authority would negotiate to relocate the property owner outside of the area subject to
significant vibration impacts.
The mitigation measures for noise and vibration described above are commonly used approaches
on similar-scale transportation projects in the U.S. and internationally; they have proven to be
effective in minimizing potential impacts. Mitigation measures provided for construction noise and vibration are consistent with the mitigation measures given in the FRA guidance manual (FRA
2005, 2012) (Section 10.1.3, Mitigation of Construction Noise and Section 10.2.3, Construction Vibration Mitigation). Mitigation measures provided for operational noise and vibration impacts
are also consistent with the mitigation measures given in the FRA guidance manual (Section 5.4,
CALIFORNIA HIGH-SPEED TRAIN PROJECT FINAL EIR/EIS
FRESNO TO BAKERSFIELD SECTION 3.4 NOISE AND VIBRATION
Page 3.4-76
Mitigation of Noise Impact, and Section 9.4, Vibration Mitigation) and are commonly used to
mitigate potential impacts from HST systems in the U.S. and internationally (e.g., Japan, China, Europe).
Table 3.4-34 Potential Vibration Mitigation Procedures and Descriptions
Mitigation
Procedure
Location of
Mitigation Description
Maintenance Source Rail condition monitoring systems with rail grinding on a regular basis. Wheel-truing to re-contour the wheel, provide a smooth running surface and remove wheel flats. Reconditioning vehicles. Installing wheel-condition monitoring systems.
Location and
Design of Special Trackwork
Source Careful review of crossover and turnout locations during the
preliminary engineering stage. When feasible, relocate special trackwork to a less vibration-sensitive area. Installation of spring frogs eliminates gaps at crossovers and helps reduce vibration levels.
Vehicle Suspension Source Rail vehicle should have low unsprung weight, soft primary suspension, minimum metal-on-metal contact between moving parts of the truck, and smooth wheels that are perfectly round.
Special Track Support Systems
Source Floating slabs, resiliently supported ties, high resilience fasteners and ballast mats all help reduce vibration levels from track support system.
Building Modifications
Receiver For existing buildings, if vibration-sensitive equipment is affected by train vibration, the floor upon which the vibration-sensitive equipment is located could be stiffened and isolated from the remainder of the building. For new buildings, the building foundation should be supported by elastomer pads similar to bridge bearing pads.
Trenches Along Vibration Propagation Path
A trench can be an effective vibration barrier if it changes the propagation characteristics of the soil. It can be open or solid. Open trenches can be filled with styrofoam. Solid barriers can be constructed with sheet piling, rows of drilled shafts filled with either concrete or a mixture of soil and lime, or concrete poured into a trench.
Operational Changes
Source Reduce vehicle speed. Adjust nighttime schedules to minimize train movements during sensitive hours. Operating restrictions requires continuous monitoring and may not be practical.
Buffer Zones Receiver Negotiate a vibration easement from the affected property owners or expand rail right-of-way.
This mitigation is no longer necessary for the reasons explained at the end of the Impact N&V#5
analysis.
Secondary Impacts
Secondary impacts could potentially occur at the locations where the project would install sound barriers. The changes to visual and aesthetic qualities and the existing environment that might
occur because of the installation of these barriers are covered in Section 3.16.7, Aesthetics and Visual Resources, but these changes are not assessed in site-specific locations because of
uncertainty about the locations of these barriers, their heights, and their applications. The project
CALIFORNIA HIGH-SPEED TRAIN PROJECT FINAL EIR/EIS
FRESNO TO BAKERSFIELD SECTION 3.4 NOISE AND VIBRATION
Page 3.4-77
design will incorporate communities’ input on the appearance of the sound barriers to reduce
secondary impacts. Sound barriers would not be additional obstacles to wildlife movement because they would be installed inside the fenced HST right-of-way.
Localized effects could occur from digging a trench to protect residences that would be affected
by vibration.
3.4.8 NEPA Impacts Summary
This section summarizes impacts identified in Section 3.4.5, Environmental Consequences, and evaluates their significance according to NEPA. Under NEPA, project effects are evaluated based
on the criteria of context and intensity. The NEPA intensity definitions for noise and vibration are provided in Section 3.4.3. Context for both noise and vibration is local, and the settings range
from urban to rural. In urban settings, project impacts may be affected by intervening structures
that serve to baffle noise and vibration impacts from local receivers. The immediate context for defining the intensity of noise and vibration impacts under NEPA is identified in Tables 3.4-8 and
3.4-9, and is noted in the following summary based on the distance of the receiver from the noise/vibration source. The following impacts were identified under the No Project Alternative
and the HST project alternatives.
Under the No Project Alternative, economic growth is anticipated, which would result in growth in traffic and freight train movements. Although much of the project area currently experiences
noise due to highway and freight traffic, increases of 3 dBA, which would only occur with a
doubling of all current highway and freight traffic, are not likely to occur. Therefore, the increases in noise are likely to remain of negligible intensity and not significant under NEPA.
Construction of large transportation projects often generates noise and vibration complaints,
even though the noise and vibration impacts are of short-term duration. Vibration during construction of the HST project would occur within 175 feet or less, but alternative techniques
can substantially eliminate vibration impacts during construction. Construction vibration impacts would be temporary. For residences within 141 feet of the alignment, or within 446 feet during
nighttime, construction impacts would be of moderate intensity under NEPA; however, due to the
temporary nature of construction and with construction-period mitigation, construction noise and vibration impacts would not be significant under NEPA for all alternatives.
If an increase in noise level were considered highly annoying by the general population, it would
be considered a severe impact under FRA criteria, and of substantial intensity under NEPA. Based on FRA noise criteria, the magnitude of the noise increase from the HST project would result in
impacts with substantial intensity. The range of sensitive receivers severely impacted at full system operation is from 1,945 to 4,810, depending on the combination of alternative alignments
selected to provide a single alignment from Fresno to Bakersfield. Those alternatives that cross
predominantly rural agricultural lands, such as the Corcoran Bypass, Allensworth Bypass, and Wasco-Shafter Bypass, would have substantially fewer noise impacts of substantial intensity than
alternatives that traverse urban areas. The Bakersfield Hybrid Alternative, which is located in more commercial and industrial areas than the other two Bakersfield alternatives, would reduce
severely impacted sensitive receivers by 989 relative to the BNSF Alternative, and by 1,308
relative to the Bakersfield South Alternative. With full implementation of the California HST Project Noise and Vibration Mitigation Guidelines (see Appendix 3.4-A), most noise impacts of
substantial intensity would be eliminated. Severe noise effects would remain for some receivers because they are located outside of the area where a sound barrier would be fully effective, or
the sound barrier does not fully mitigate the effect (i.e., noise is reduced by 4 dB, but not below the severe threshold). Furthermore, severe noise effects would remain for receivers mitigated
only with indoor sound insulation, or when covered by noise easements. Due to the degree of

CALIFORNIA HIGH-SPEED TRAIN PROJECT FINAL EIR/EIS
FRESNO TO BAKERSFIELD SECTION 3.4 NOISE AND VIBRATION
Page 3.4-78
change in the residential areas (many in rural areas where quiet is expected) by such high
numbers of receivers, these impacts would be significant under NEPA.
No vibration impacts are projected for all project alternatives for the specified study areas (Table 3.4-9).
The noise associated with increased traffic at the Kings/Tulare Regional Station – East Alternative
and the BNSF Alternative through Corcoran would be considered to have moderate intensity at a few residences fronting major roads. These effects can be mitigated with building insulation.
These residences already experience noise effects from adjacent highways, roadways and, in some cases, freight trains along the BNSF Railway. With mitigation, these impacts are not
significant under NEPA.
3.4.9 CEQA Significance Conclusions
Table 3.4-35 summarizes noise related impacts, their associated mitigation measures, and the level of significance after mitigation. Under CEQA, significant impacts remain after mitigation
because some noise-sensitive receivers might still experience operational noise levels that are
considered severe even after installation of sound barriers. Also, in collaboration with the communities, some severe noise effects may not be mitigated if barriers are found to be
unwanted. Additional mitigation may be necessary, including Mitigation Measure N&V-MM#4, to further reduce impacts. The number of impacts for the alternatives under Impact N&V#3 is the
difference (plus or minus) between that alternative (e.g., the Bakersfield South Alternative)
compared with the corresponding segment of the BNSF Alternative.
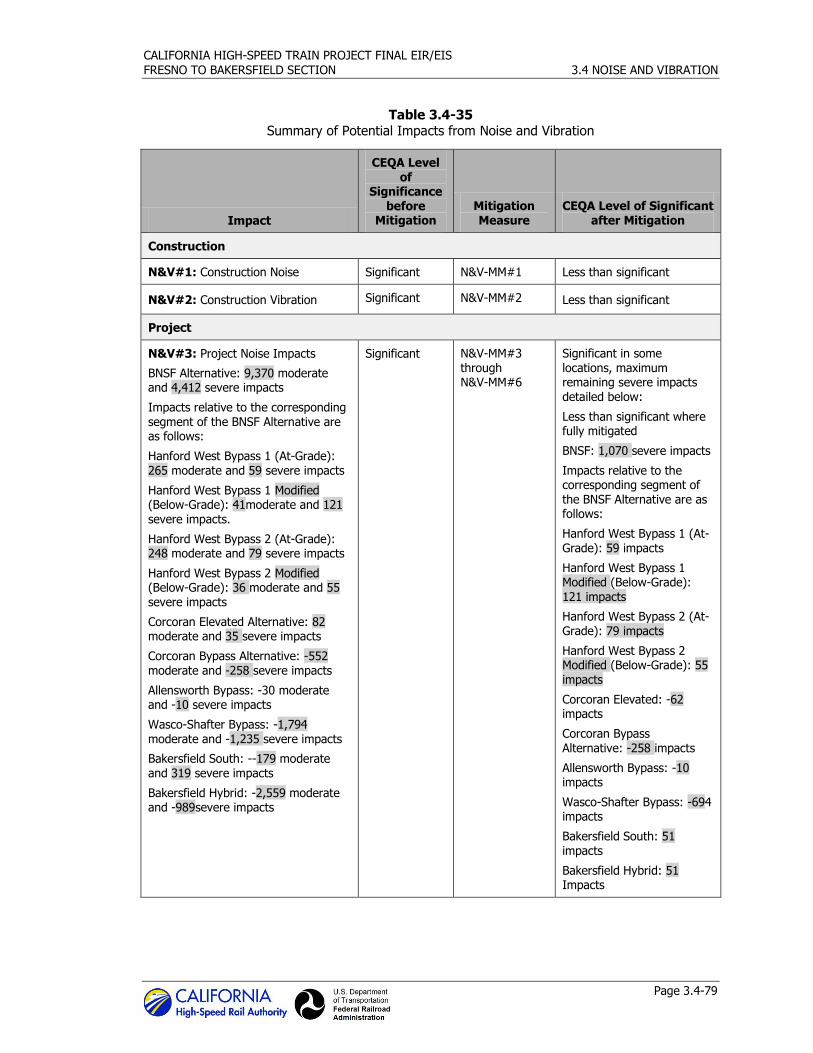
CALIFORNIA HIGH-SPEED TRAIN PROJECT FINAL EIR/EIS
FRESNO TO BAKERSFIELD SECTION 3.4 NOISE AND VIBRATION
Page 3.4-79
Table 3.4-35 Summary of Potential Impacts from Noise and Vibration
Impact
CEQA Level of
Significance before
Mitigation Mitigation Measure
CEQA Level of Significant after Mitigation
Construction
N&V#1: Construction Noise Significant N&V-MM#1 Less than significant
N&V#2: Construction Vibration Significant N&V-MM#2 Less than significant
Project
N&V#3: Project Noise Impacts
BNSF Alternative: 9,370 moderate and 4,412 severe impacts
Impacts relative to the corresponding segment of the BNSF Alternative are as follows:
Hanford West Bypass 1 (At-Grade): 265 moderate and 59 severe impacts
Hanford West Bypass 1 Modified (Below-Grade): 41moderate and 121 severe impacts.
Hanford West Bypass 2 (At-Grade): 248 moderate and 79 severe impacts
Hanford West Bypass 2 Modified (Below-Grade): 36 moderate and 55 severe impacts
Corcoran Elevated Alternative: 82 moderate and 35 severe impacts
Corcoran Bypass Alternative: -552 moderate and -258 severe impacts
Allensworth Bypass: -30 moderate and -10 severe impacts
Wasco-Shafter Bypass: -1,794 moderate and -1,235 severe impacts
Bakersfield South: --179 moderate and 319 severe impacts
Bakersfield Hybrid: -2,559 moderate and -989severe impacts
Significant N&V-MM#3 through N&V-MM#6
Significant in some locations, maximum remaining severe impacts detailed below:
Less than significant where fully mitigated
BNSF: 1,070 severe impacts
Impacts relative to the corresponding segment of the BNSF Alternative are as follows:
Hanford West Bypass 1 (At-Grade): 59 impacts
Hanford West Bypass 1 Modified (Below-Grade): 121 impacts
Hanford West Bypass 2 (At-Grade): 79 impacts
Hanford West Bypass 2 Modified (Below-Grade): 55 impacts
Corcoran Elevated: -62 impacts
Corcoran Bypass Alternative: -258 impacts
Allensworth Bypass: -10 impacts
Wasco-Shafter Bypass: -694 impacts
Bakersfield South: 51 impacts
Bakersfield Hybrid: 51 Impacts
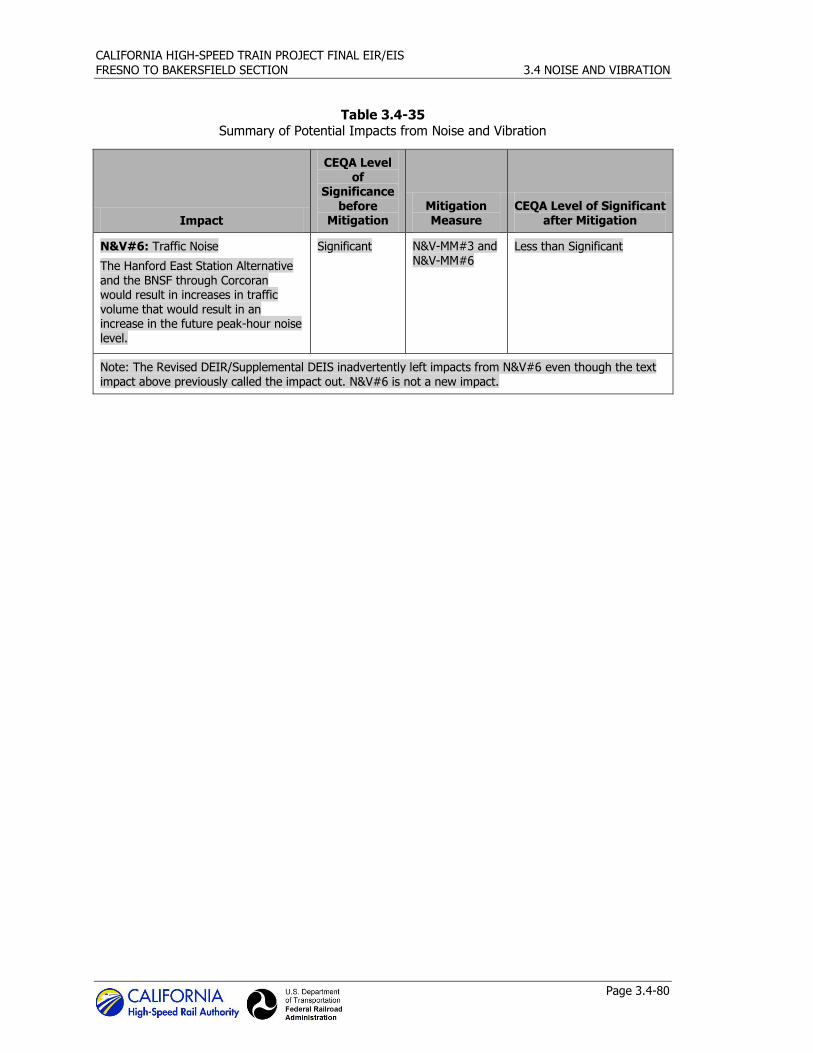
CALIFORNIA HIGH-SPEED TRAIN PROJECT FINAL EIR/EIS
FRESNO TO BAKERSFIELD SECTION 3.4 NOISE AND VIBRATION
Page 3.4-80
Table 3.4-35 Summary of Potential Impacts from Noise and Vibration
Impact
CEQA Level of
Significance before
Mitigation Mitigation Measure
CEQA Level of Significant after Mitigation
N&V#6: Traffic Noise
The Hanford East Station Alternative and the BNSF through Corcoran would result in increases in traffic volume that would result in an increase in the future peak-hour noise level.
Significant N&V-MM#3 and N&V-MM#6
Less than Significant
Note: The Revised DEIR/Supplemental DEIS inadvertently left impacts from N&V#6 even though the text impact above previously called the impact out. N&V#6 is not a new impact.