3.4 Graphing Linear Equations in Standard...
6
Section 3.4 Graphing Linear Equations in Standard Form 129 3.4 Essential Question Essential Question How can you describe the graph of the equation Ax + By = C? Using a Table to Plot Points Work with a partner. You sold a total of $16 worth of tickets to a fundraiser. You lost track of how many of each type of ticket you sold. Adult tickets are $4 each. Child tickets are $2 each. — adult ⋅ Number of adult tickets + — child ⋅ Number of child tickets = a. Let x represent the number of adult tickets. Let y represent the number of child tickets. Use the verbal model to write an equation that relates x and y. b. Copy and complete the table to show the different combinations of tickets you might have sold. c. Plot the points from the table. Describe the pattern formed by the points. d. If you remember how many adult tickets you sold, can you determine how many child tickets you sold? Explain your reasoning. Rewriting and Graphing an Equation Work with a partner. You sold a total of $48 worth of cheese. You forgot how many pounds of each type of cheese you sold. Swiss cheese costs $8 per pound. Cheddar cheese costs $6 per pound. — pound ⋅ Pounds of Swiss + — pound ⋅ Pounds of cheddar = a. Let x represent the number of pounds of Swiss cheese. Let y represent the number of pounds of cheddar cheese. Use the verbal model to write an equation that relates x and y. b. Solve the equation for y. Then use a graphing calculator to graph the equation. Given the real-life context of the problem, find the domain and range of the function. c. The x-intercept of a graph is the x-coordinate of a point where the graph crosses the x-axis. The y-intercept of a graph is the y-coordinate of a point where the graph crosses the y-axis. Use the graph to determine the x- and y-intercepts. d. How could you use the equation you found in part (a) to determine the x- and y-intercepts? Explain your reasoning. e. Explain the meaning of the intercepts in the context of the problem. Communicate Your Answer Communicate Your Answer 3. How can you describe the graph of the equation Ax + By = C? 4. Write a real-life problem that is similar to those shown in Explorations 1 and 2. FINDING AN ENTRY POINT To be proficient in math, you need to find an entry point into the solution of a problem. Determining what information you know, and what you can do with that information, can help you find an entry point. x y Graphing Linear Equations in Standard Form
Transcript of 3.4 Graphing Linear Equations in Standard...

Section 3.4 Graphing Linear Equations in Standard Form 129
3.4
Essential QuestionEssential Question How can you describe the graph of the equation
Ax + By = C?
Using a Table to Plot Points
Work with a partner. You sold a total of $16 worth of tickets to a fundraiser. You
lost track of how many of each type of ticket you sold. Adult tickets are $4 each. Child
tickets are $2 each.
— adult
⋅ Number of
adult tickets + —
child ⋅ Number of
child tickets =
a. Let x represent the number of adult tickets. Let y represent the number of child
tickets. Use the verbal model to write an equation that relates x and y.
b. Copy and complete the table to show the
different combinations of tickets you
might have sold.
c. Plot the points from the table. Describe the pattern formed by the points.
d. If you remember how many adult tickets you sold, can you determine how many
child tickets you sold? Explain your reasoning.
Rewriting and Graphing an Equation
Work with a partner. You sold a total of $48 worth of cheese. You forgot how many
pounds of each type of cheese you sold. Swiss cheese costs $8 per pound. Cheddar
cheese costs $6 per pound.
— pound
⋅ Pounds of
Swiss + —
pound ⋅ Pounds of
cheddar =
a. Let x represent the number of pounds of Swiss cheese. Let y represent the number
of pounds of cheddar cheese. Use the verbal model to write an equation that
relates x and y.
b. Solve the equation for y. Then use a graphing calculator to graph the equation.
Given the real-life context of the problem, fi nd the domain and range of
the function.
c. The x-intercept of a graph is the x-coordinate of a point where the graph crosses
the x-axis. The y-intercept of a graph is the y-coordinate of a point where the
graph crosses the y-axis. Use the graph to determine the x- and y-intercepts.
d. How could you use the equation you found in part (a) to determine the
x- and y-intercepts? Explain your reasoning.
e. Explain the meaning of the intercepts in the context of the problem.
Communicate Your AnswerCommunicate Your Answer 3. How can you describe the graph of the equation Ax + By = C?
4. Write a real-life problem that is similar to those shown in Explorations 1 and 2.
FINDING AN ENTRY POINTTo be profi cient in math, you need to fi nd an entry point into the solution of a problem. Determining what information you know, and what you can do with that information, can help you fi nd an entry point.
x
y
Graphing Linear Equations in Standard Form
alg1_ch3 book.indb 129alg1_ch3 book.indb 129 7/11/17 10:51 AM7/11/17 10:51 AM

130 Chapter 3 Graphing Linear Functions
3.4 Lesson
standard form, p. 130x-intercept, p. 131y-intercept, p. 131
Previousordered pairquadrant
Core VocabularyCore Vocabullarry
What You Will LearnWhat You Will Learn Graph equations of horizontal and vertical lines.
Graph linear equations in standard form using intercepts.
Use linear equations in standard form to solve real-life problems.
Horizontal and Vertical LinesThe standard form of a linear equation is Ax + By = C, where A, B, and C are real
numbers and A and B are not both zero.
Consider what happens when A = 0 or when B = 0. When A = 0, the equation
becomes By = C, or y = C
— B
. Because C
— B
is a constant, you can write y = b. Similarly,
when B = 0, the equation becomes Ax = C, or x = C
— A
, and you can write x = a.
STUDY TIPFor every value of x, the ordered pair (x, 4) is a solution of y = 4.
Core Core ConceptConceptHorizontal and Vertical Lines
x
y
(0, b)
y = b
The graph of y = b is a horizontal
line. The line passes through the
point (0, b).
x
y
(a, 0)
x = a
The graph of x = a is a vertical
line. The line passes through the
point (a, 0).
Horizontal and Vertical Lines
Graph (a) y = 4 and (b) x = −2.
SOLUTION
a. For every value of x, the value of
y is 4. The graph of the equation
y = 4 is a horizontal line 4 units
above the x-axis.
x
y
2
6
2−2
(0, 4)(−2, 4) (3, 4)
b. For every value of y, the value of
x is −2. The graph of the equation
x = −2 is a vertical line 2 units to
the left of the y-axis.
x
y4
2
−2
1−1−3−5
(−2, 3)
(−2, 0)
(−2, −2)
Monitoring ProgressMonitoring Progress
Graph the linear equation.
1. y = −2.5 2. x = 5
alg1_ch3 book.indb 130alg1_ch3 book.indb 130 7/11/17 10:51 AM7/11/17 10:51 AM

Section 3.4 Graphing Linear Equations in Standard Form 131
Core Core ConceptConceptUsing Intercepts to Graph EquationsThe x-intercept of a graph is the x-coordinate
of a point where the graph crosses the x-axis.
It occurs when y = 0.
The y-intercept of a graph is the y-coordinate
of a point where the graph crosses the y-axis.
It occurs when x = 0.
To graph the linear equation Ax + By = C, fi nd the intercepts and draw
the line that passes through the two intercepts.
• To fi nd the x-intercept, let y = 0 and solve for x.
• To fi nd the y-intercept, let x = 0 and solve for y.
Using Intercepts to Graph a Linear Equation
Use intercepts to graph the equation 3x + 4y = 12.
SOLUTION
Step 1 Find the intercepts.
To fi nd the x-intercept, substitute 0 for y and solve for x.
3x + 4y = 12 Write the original equation.
3x + 4(0) = 12 Substitute 0 for y.
x = 4 Solve for x.
To fi nd the y-intercept, substitute 0 for x and solve for y.
3x + 4y = 12 Write the original equation.
3(0) + 4y = 12 Substitute 0 for x.
y = 3 Solve for y.
Step 2 Plot the points and draw the line.
The x-intercept is 4, so plot the point (4, 0).
The y-intercept is 3, so plot the point (0, 3).
Draw a line through the points.
Monitoring ProgressMonitoring Progress
Use intercepts to graph the linear equation. Label the points corresponding to the intercepts.
3. 2x − y = 4 4. x + 3y = −9
Using Intercepts to Graph Linear Equations
You can use the fact that two points determine a line to graph a linear equation. Two
convenient points are the points where the graph crosses the axes.
STUDY TIPAs a check, you can fi nd a third solution of the equation and verify that the corresponding point is on the graph. To fi nd a third solution, substitute any value for one of the variables and solve for the other variable.
x
y
(0, b)
(a, 0)O
y-intercept = b
x-intercept = a
x
y
4
2
42
(0, 3)
(4, 0)
alg1_ch3 book.indb 131alg1_ch3 book.indb 131 7/11/17 10:52 AM7/11/17 10:52 AM

132 Chapter 3 Graphing Linear Functions
Solving Real-Life Problems
Modeling with Mathematics
You are planning an awards banquet for your school. You need to rent tables to seat
180 people. Tables come in two sizes. Small tables seat 6 people, and large tables seat
10 people. The equation 6x + 10y = 180 models this situation, where x is the number
of small tables and y is the number of large tables.
a. Graph the equation. Interpret the intercepts.
b. Find four possible solutions in the context of the problem.
SOLUTION
1. Understand the Problem You know the equation that models the situation. You
are asked to graph the equation, interpret the intercepts, and fi nd four solutions.
2. Make a Plan Use intercepts to graph the equation. Then use the graph to interpret
the intercepts and fi nd other solutions.
3. Solve the Problem
a. Use intercepts to graph the equation. Neither x nor y can be negative, so only
graph the equation in the fi rst quadrant.
x
y
8
4
0
16
12
840 1612 282420 3632
(0, 18)
(30, 0)
6x + 10y = 180
The y-intercept is 18.So, plot (0, 18).
The x-intercept is 30.So, plot (30, 0).
The x-intercept shows that you can rent 30 small tables when you do not
rent any large tables. The y-intercept shows that you can rent 18 large tables
when you do not rent any small tables.
b. Only whole-number values of x and y make sense in the context of the problem.
Besides the intercepts, it appears that the line passes through the points (10, 12)
and (20, 6). To verify that these points are solutions, check them in the equation,
as shown.
So, four possible combinations of tables that will seat 180 people are
0 small and 18 large, 10 small and 12 large, 20 small and 6 large, and
30 small and 0 large.
4. Look Back The graph shows that as the number x of small tables increases, the
number y of large tables decreases. This makes sense in the context of the problem.
So, the graph is reasonable.
Monitoring ProgressMonitoring Progress
5. WHAT IF? You decide to rent tables from a different company. The situation can be
modeled by the equation 4x + 6y = 180, where x is the number of small tables and
y is the number of large tables. Graph the equation and interpret the intercepts.
STUDY TIPAlthough x and y represent whole numbers, it is convenient to draw a line segment that includes points whose coordinates are not whole numbers.
Check
6x + 10y = 180
6(10) + 10(12) =?
180
180 = 180 ✓
6x + 10y = 180
6(20) + 10(6) =?
180
180 = 180 ✓
alg1_ch3 book.indb 132alg1_ch3 book.indb 132 7/11/17 10:52 AM7/11/17 10:52 AM
Section 3.4 Graphing Linear Equations in Standard Form 133
Exercises3.4 Dynamic Solutions available at BigIdeasMath.com
In Exercises 3– 6, graph the linear equation. (See Example 1.)
3. x = 4 4. y = 2
5. y = −3 6. x = −1
In Exercises 7–12, fi nd the x- and y-intercepts of the graph of the linear equation.
7. 2x + 3y = 12 8. 3x + 6y = 24
9. −4x + 8y = −16 10. −6x + 9y = −18
11. 3x − 6y = 2 12. −x + 8y = 4
In Exercises 13–22, use intercepts to graph the linear equation. Label the points corresponding to the intercepts. (See Example 2.)
13. 5x + 3y = 30 14. 4x + 6y = 12
15. −12x + 3y = 24 16. −2x + 6y = 18
17. −4x + 3y = −30 18. −2x + 7y = −21
19. −x + 2y = 7 20. 3x − y = −5
21. − 5 —
2 x + y = 10 22. −
1 —
2 x + y = −4
23. MODELING WITH MATHEMATICS A football team
has an away game, and the bus breaks down. The
coaches decide to drive the players to the game in
cars and vans. Four players can ride in each car. Six
players can ride in each van. There are 48 players
on the team. The equation 4x + 6y = 48 models this
situation, where x is the number of cars and y is the
number of vans. (See Example 3.)
a. Graph the equation. Interpret the intercepts.
b. Find four possible solutions in the context of
the problem.
24. MODELING WITH MATHEMATICS You are ordering
shirts for the math club at your school. Short-sleeved
shirts cost $10 each. Long-sleeved shirts cost
$12 each. You have a budget of $300 for the shirts.
The equation 10x + 12y = 300 models the total cost,
where x is the number of short-sleeved shirts and
y is the number of long-sleeved shirts.
a. Graph the equation. Interpret the intercepts.
b. Twelve students decide they want short-sleeved
shirts. How many long-sleeved shirts can
you order?
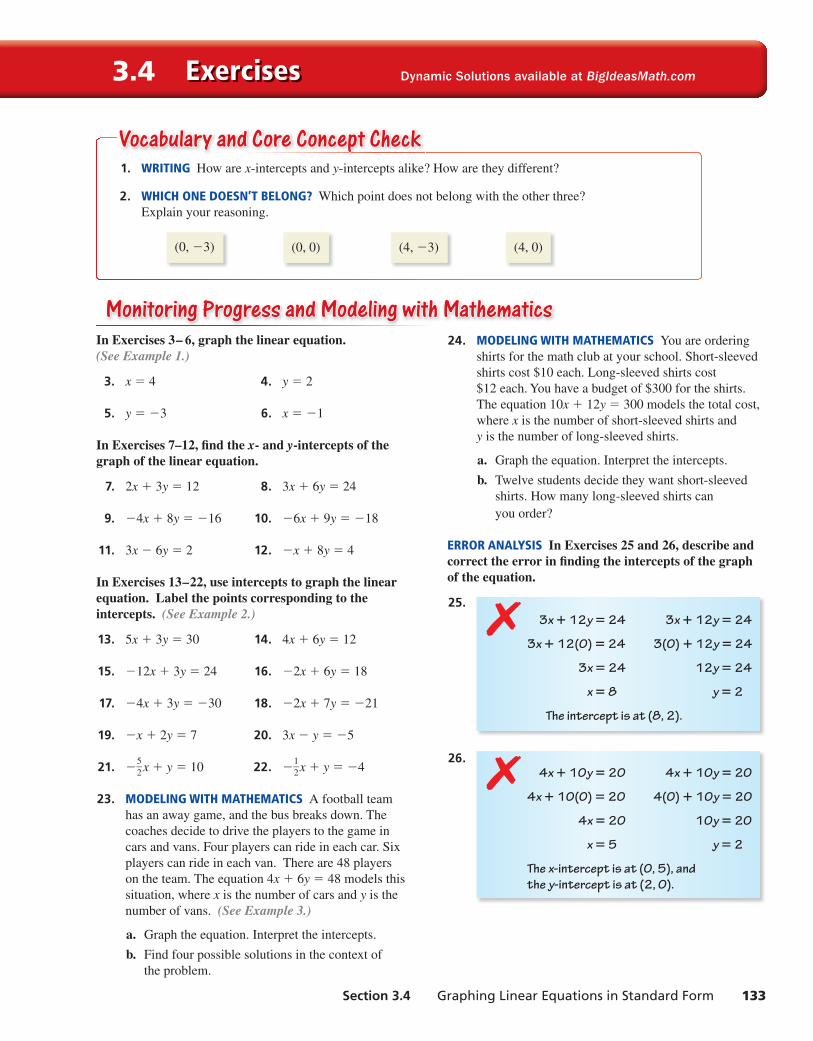
ERROR ANALYSIS In Exercises 25 and 26, describe and correct the error in fi nding the intercepts of the graph of the equation.
25. 3x + 12y = 24 3x + 12y = 24
3x + 12(0) = 24 3(0) + 12y = 24
3x = 24 12y = 24
x = 8 y = 2
The intercept is at (8, 2).
✗
26. 4x + 10y = 20 4x + 10y = 20
4x + 10(0) = 20 4(0) + 10y = 20
4x = 20 10y = 20
x = 5 y = 2
The x-intercept is at (0, 5), and
the y-intercept is at (2, 0).
✗
Monitoring Progress and Modeling with MathematicsMonitoring Progress and Modeling with Mathematics
1. WRITING How are x-intercepts and y-intercepts alike? How are they different?
2. WHICH ONE DOESN’T BELONG? Which point does not belong with the other three?
Explain your reasoning.
(0, −3)
(0, 0)
(4, −3)
(4, 0)
Vocabulary and Core Concept CheckVocabulary and Core Concept Check
alg1_ch3 book.indb 133alg1_ch3 book.indb 133 7/11/17 10:52 AM7/11/17 10:52 AM
134 Chapter 3 Graphing Linear Functions
Reviewing what you learned in previous grades and lessonsMaintaining Mathematical ProficiencySimplify the expression.
39. 2 − (−2) —
4 − (−4) 40. 14 − 18
— 0 − 2
41. −3 − 9 —
8 − (−7) 42. 12 − 17
— −5 − (−2)
27. MAKING AN ARGUMENT You overhear your friend
explaining how to fi nd intercepts to a classmate. Your
friend says, “When you want to fi nd the x-intercept,
just substitute 0 for x and continue to solve the
equation.” Is your friend’s explanation correct?
Explain.
28. ANALYZING RELATIONSHIPS You lose track of how
many 2-point baskets and 3-point baskets a team
makes in a basketball game. The team misses all
the 1-point baskets and still scores 54 points. The
equation 2x + 3y = 54 models the total points scored,
where x is the number of 2-point baskets made and
y is the number of 3-point baskets made.
a. Find and interpret the intercepts.
b. Can the number of 3-point
baskets made be odd?
Explain your reasoning.
c. Graph the equation. Find
two more possible solutions
in the context of the problem.
MULTIPLE REPRESENTATIONS In Exercises 29–32, match the equation with its graph.
29. 5x + 3y = 30 30. 5x + 3y = −30
31. 5x − 3y = 30 32. 5x − 3y = −30
A.
x
y
8
4
8 124
B.
x
y
4
4−4−8
12
C.
x
y2
−12
−4
4−8
D.
x
y2
−8
−4
84−4
33. MATHEMATICAL CONNECTIONS Graph the equations
x = 5, x = 2, y = −2, and y = 1. What enclosed
shape do the lines form? Explain your reasoning.
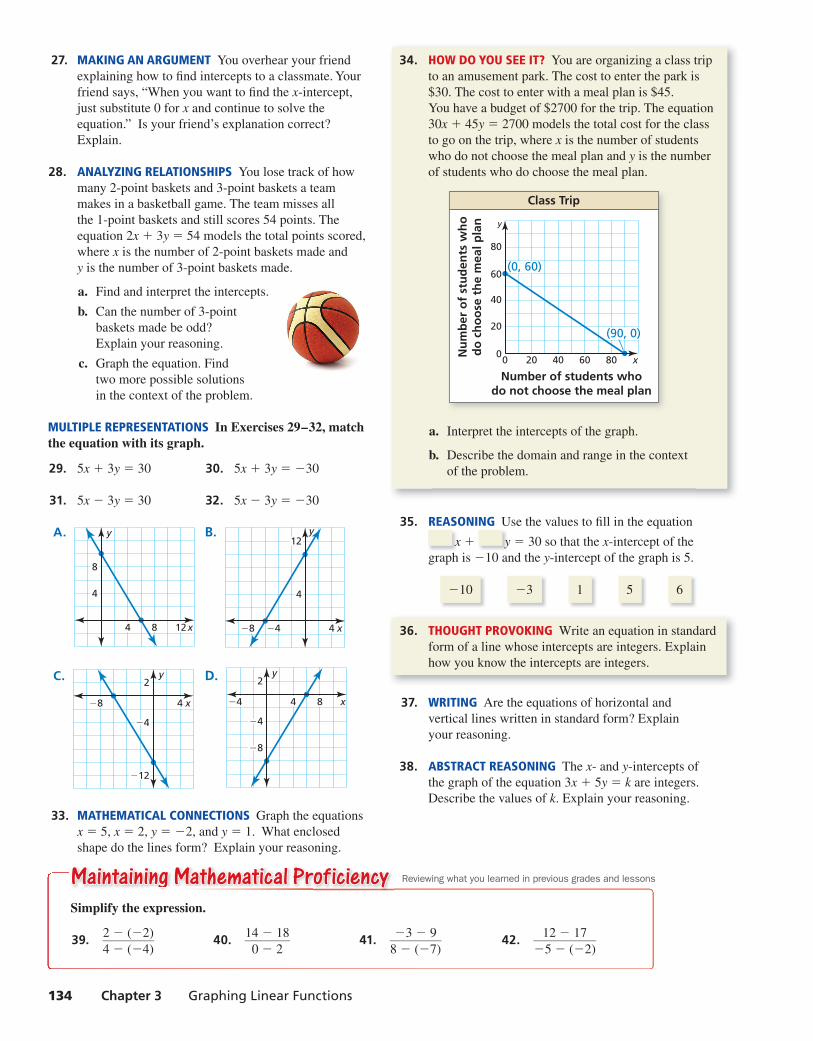
34. HOW DO YOU SEE IT? You are organizing a class trip
to an amusement park. The cost to enter the park is
$30. The cost to enter with a meal plan is $45.
You have a budget of $2700 for the trip. The equation
30x + 45y = 2700 models the total cost for the class
to go on the trip, where x is the number of students
who do not choose the meal plan and y is the number
of students who do choose the meal plan.
x
y
40
20
0
80
60
40200 8060
Class Trip
Nu
mb
er o
f st
ud
ents
wh
od
o c
ho
ose
th
e m
eal p
lan
Number of students whodo not choose the meal plan
(0, 60)
(90, 0)
a. Interpret the intercepts of the graph.
b. Describe the domain and range in the context
of the problem.
35. REASONING Use the values to fi ll in the equation
x + y = 30 so that the x-intercept of the
graph is −10 and the y-intercept of the graph is 5.
−10
−3
1 5
6
36. THOUGHT PROVOKING Write an equation in standard
form of a line whose intercepts are integers. Explain
how you know the intercepts are integers.
37. WRITING Are the equations of horizontal and
vertical lines written in standard form? Explain
your reasoning.
38. ABSTRACT REASONING The x- and y-intercepts of
the graph of the equation 3x + 5y = k are integers.
Describe the values of k. Explain your reasoning.
ggg
alg1_ch3 book.indb 134alg1_ch3 book.indb 134 7/11/17 10:52 AM7/11/17 10:52 AM