Appendix F Instructions for Completing Demolitions-Related Reports

3/28/2017 Annual Reports and Related Documents::
http://infopub.sgx.com/Apps?A=COW_CorpAnnouncement_Content&B=AnnouncementToday&F=3D7SY22QBC4VRWTZ&H=e2baa501f6d7123eb01642de6fe78… 1/1
Tweet 0
Annual Reports and Related Documents::
Issuer & Securities
Issuer/ Manager JAPFA LTD.
Securities JAPFA LTD. SG1AB9000005 UD2
Stapled Security No
Announcement Details
Announcement Title Annual Reports and Related Documents
Date & Time of Broadcast 28Mar2017 19:02:37
Status New
Report Type Annual Report
Announcement Reference SG170328OTHRZE0O
Submitted By (Co./ Ind. Name) Cheng Sai Hong
Designation Company Secretary
Description (Please provide a detaileddescription of the event in the box below Refer to the Online help for the format)
Attached Japfa Ltd Annual Report 2016 and Letter to Shareholders onproposed appointment of a new Auditor.
Additional Details
Period Ended 31/12/2016
Attachments Japfa Ltd AR2016.pdf
Japfa Letter to Shareholders.pdf
Total size =5037K
Share0Like
JAPFA LTD (Company Registration Number: 200819599W)
Board of Directors: Registered Office:Mr Goh Geok Khim (Non-Executive Independent Chairman)Mr Handojo Santosa @ Kang Kiem Han (Executive Deputy Chairman)Mr Tan Yong Nang (Executive Director and Chief Executive Officer)Mr Kevin John Monteiro (Executive Director and Chief Financial Officer)Mr Hendrick Kolonas (Non-Executive Director)Mr Ng Quek Peng (Independent Director)Ms Lien Siaou-Sze (Independent Director)
391B Orchard Road #18-08Ngee Ann City, Tower BSingapore 238874
28 March 2017
To: The Shareholders of Japfa Ltd
Dear Sir / Madam
THE PROPOSED APPOINTMENT OF A NEW AUDITOR
1. INTRODUCTION
1.1. Background.
We refer to:
(a) the Notice of the Annual General Meeting (“AGM”) of Japfa Ltd (the “Company”) dated 28 March 2017 (the “Notice”), accompanying the Company’s Annual Report for the financial year ended 31 December 2016 (“2016 Annual Report”), convening the annual general meeting of the Company to be held on 12 April 2017 (the “2017 AGM”); and
(b) Ordinary Resolution No. 13 relating to the proposed appointment of a new auditor (as proposed in the Notice).
1.2. Letter to Shareholders.
The purpose of this Letter is to provide shareholders of the Company (“Shareholders”) with information relating to Ordinary Resolution No. 13, regarding the proposed appointment of a new auditor.
1.3. SGX-ST.
The Singapore Exchange Securities Trading Limited (the “SGX-ST”) takes no responsibility for the accuracy of any statements or opinions made or reports contained in this Letter.
1.4. Advice to Shareholders.
Shareholders who are in any doubt as to the course of action they should take should consult their stockbroker, bank manager, solicitor, accountant or other professional advisers immediately. If you have sold or transferred all your shares in the capital of the Company, he should immediately forward this Letter (together with the 2016 Annual Report, the Notice and Proxy Form) to the purchaser or to the bank, stockbroker or other agent through whom the sale was effected for onward transmission to the purchaser or transferee.
LETTER TO SHAREHOLDERS
16_0447 Japfa_Cir16_LTS_v3.indd 1 20/3/17 3:26 PM

2
2. THE PROPOSED APPOINTMENT OF A NEW AUDITOR
2.1. Background.
Ordinary Resolution No. 13 proposed in the Notice is to appoint Ernst & Young LLP (“EY”) as the Auditor of the Company in place of the retiring Auditor, RSM Chio Lim LLP (“RSM”), and to authorise the Directors of the Company (the “Directors”) to fix their remuneration.
2.2. Rationale for the Proposed Appointment of a new Auditor.
RSM, the Company’s outgoing auditor, has served as the external Auditor of the Company more than 7 years since their appointment on 14 August 2009. The Directors are of the view that an appointment of a new auditor accords with good corporate governance practice and will enable the Company to benefit from fresh perspective. In addition, having the same auditor or its network firms auditing the major entities within the group would enhance the effectiveness of the audit. In particular, the Directors note that the Company’s principal subsidiaries, PT Japfa Comfeed Indonesia Tbk (“PT Japfa”), AustAsia Investment Holdings Pte Ltd (“AIH”) and AIH2 Pte Ltd (“AIH2”) will be appointing or have already appointed Ernst & Young LLP (“EY”) or its local affiliates as their auditors. PT Japfa (listed on the Indonesian Stock Exchange), will propose the appointment of Purwantono, Sungkoro & Surja (a member firm of Ernst & Young Global Limited) as auditors for PT Japfa and its subsidiaries (the “PT Japfa Group”) for the financial year ending 31 December 2017, at PT Japfa’s upcoming Annual General Meeting on 5 April 2017. In addition, EY is the existing and continuing auditor of AIH and AIH2.
In view of the foregoing, the Directors are of the opinion that it would be in the interest of the Company to effect the appointment of a new external auditor of the Company. Accordingly, the outgoing auditors, RSM will not be seeking re-appointment at the forthcoming AGM.
The Directors have determined, in consultation with the Audit Committee (“AC”) that the services proposals made by EY suit the needs of the Company. In addition to being appointed as auditor of the Company, EY is also proposed to be appointed as the auditor of all of the Company’s Singapore subsidiaries.
2.3. Opinion of the Audit Committee and Directors.
The AC, in their deliberation on the proposed appointment of EY, have considered various factors, including the adequacy of the resources of EY, the firm’s experience, the experience (including industry experience) of the audit engagement partners assigned to the audit, EY’s other audit engagements, the size and complexity of the Company and its subsidiaries (the “Group”), and the number and experience of supervisory and professional staff assigned to the audit of the Group. After evaluation, the AC recommended that EY be selected for the proposed appointment. The Directors have taken into account the AC’s recommendation, including the factors considered in their evaluation, and are satisfied that EY will be able to meet the audit requirements of the Company. In addition, the AC and the Directors are of the opinion that, with respect to EY’s proposed appointment, Rule 712 of the listing manual of the SGX-ST (“Listing Manual”) has been complied with.
The appointment of EY as auditor of the Company will take effect upon the approval by the Shareholders at the AGM. Upon the appointment, EY will hold office until the conclusion of the next annual general meeting of the Company
2.4. Information on EY.
EY is one of the largest accounting firms in Singapore, with more than 125 years of history providing audit, tax and professional services to a wide-range of clients comprising of publicly listed companies, private companies, multinational companies, and public sector organisations in Singapore. EY is registered with the Accounting and Corporate Regulatory Authority (“ACRA”) and is member of the global network of EY firms. Globally, EY has more than 728 offices in 150 countries and employs more than 230,000 people globally. EY has relevant industry experience with a large number of audit clients in the agriculture and resources sector.
Mr. Vincent Toong Weng Sum, an assurance partner with EY Singapore, will be in charge of the audit of the Company. Mr. Toong is a member of the Institute of Singapore Chartered Accountants and holds a Bachelor of Economics (Accountancy) degree from the University of Sydney, Australia. He has more than 28 years of audit experience in providing audit and assurance services to a variety of clients, including public companies listed on the SGX-ST.
LETTER TO SHAREHOLDERS
16_0447 Japfa_Cir16_LTS_v3.indd 2 20/3/17 3:26 PM

3
More information about EY, its values and its services are provided at EY’s website at http://www.ey.com.
2.5. Confirmations.
In accordance with the requirements of Rule 1203(5) of the Listing Manual:
(a) the outgoing Auditor, RSM, has confirmed that it is not aware of any professional reasons why the new Auditor, EY, should not accept appointment as Auditor of the Company;
(b) the Company confirms that there were no disagreements with the outgoing Auditor, RSM, on accounting treatments within the last 12 months;
(c) the Company confirms that, other than as set out above, it is not aware of any circumstances connected with the proposed change of Auditor that should be brought to the attention of Shareholders; and
(d) the Company confirms that it is or will be in compliance with Rule 712 and Rule 715 of the Listing Manual in relation to the appointment of EY as the Auditor of the Company.
2.6. Appendix.
Pursuant to Section 205 of the Companies Act, Chapter 50, a copy of the notice of nomination of the proposed new Auditor dated 22 February 2017 from a Shareholder set out in the Appendix to this Letter (the “Notice of Nomination”).
3. DIRECTORS’ AND SUBSTANTIAL SHAREHOLDERS’ INTERESTS
3.1. Directors’ Interests. The interests of the Directors in the Shares, as recorded in the Register of Directors’ Shareholdings of the Company, as at the Latest Practicable Date are set out below:
Direct Interest Deemed Interest(2)(4) Total InterestDirectors No. of Shares %(1) No. of Shares %(1) No. of Shares %(1)
Mr Goh Geok Khim 1,500,000 0.09 1,500,000 0.09
Mr Handojo Santosa @ Kang Kiem Han(3) 1,136,818,915 64.24 1,136,818,915 64.24
Mr Tan Yong Nang(4) 66,710,691 3.77 66,710,691 3.77
Mr Kevin Monteiro(5) – – 2,044,300 0.12 2,044,300 0.12
Ms Lien Siaou-Sze(6) – – 625,000 0.04 625,000 0.04
Mr Ng Quek Peng(7) – – 500,000 0.03 500,000 0.03
Notes:
(1) Based on 1,769,525,591 Shares in issue as at the Latest Practicable Date (10 March 2017).
(2) Deemed interests refer to interests determined pursuant to Section 4 of the SFA.
(3) See note (3) of paragraph 3.2 – “Substantial Shareholders’ Interests”.
(4) 65,860,691 Shares are held by Great Alpha Investments Limited. By virtue of Section 4 of the SFA, Mr Tan Yong Nang is deemed to have an interest in the Shares held by Great Alpha Investments Limited. In addition, Mr Tan Yong Nang is also deemed to have an interest in 850,000 Shares held in a joint account with his wife (through their client account with a financial institution).
(1) Held through his client account with a financial institution.
(2) Held through her client account with a financial institution.
(3) Held through his client account with a financial institution.
LETTER TO SHAREHOLDERS
16_0447 Japfa_Cir16_LTS_v3.indd 3 20/3/17 3:26 PM

4
3.2. Substantial Shareholders’ Interests. The interests of the Substantial Shareholders in the Shares, as recorded from the Register of Substantial Shareholders of the Company, as at the Latest Practicable Date are set out below:
Direct Interest Deemed Interest(2) Total InterestSubstantial Shareholders No. of Shares %(1) No. of Shares %(1) No. of Shares %(1)
Mr Handojo Santosa @ Kang Kiem Han(3) – – 1,136,818,915 64.24 1,136,818,915 64.24
Rangi Management Limited(3)(4)(6) 928,368,240 52.46 – – 928,368,240 52.46
Fusion Investment Holdings Limited(4)(6) – – 928,368,240 52.46 928,368,240 52.46
Tasburgh Limited(3)(5)(6) 126,714,375 7.16 – – 126,714,375 7.16
Morze International Limited(7) 282,527,085 15.97 – – 282,527,085 15.97
Highvern Trustees Limited (formerly known as Coutts & Co Trustees (Jersey) Limited)(5)(6)(7) – – 1,337,609,700 75.59 1,337,609,700 75.59
MNM Holdings Limited(8) – – 1,337,609,700 75.59 1,337,609,700 75.59
Mr Martin John Hall(9) – – 445,869,900 25.20 445,869,900 25.20
Ms Naomi Julia Rive(9) – – 445,869,900 25.20 445,869,900 25.20
Mr Miles Aidan Le Cornu(9) – – 445,869,900 25.20 445,869,900 25.20
Scuderia Trust(6) – – 1,055,082,615 59.63 1,055,082,615 59.63
Capital Two Trust(7) – – 282,527,085 15.97 282,527,085 15.97
Ms Rachel Anastasia Kolonas(7)(10) – – 282,527,085 15.97 282,527,085 15.97
Mdm Farida Gustimego Santosa (3)(6)(11) – – 1,055,818,915 59.67 1,055,818,915 59.67
Mr Renaldo Santosa(6)(12) – – 1,055,942,615 59.67 1,055,942,615 59.67
Notes:
(1) Based on 1,769,525,591 Shares in issue as at the Latest Practicable Date (10 March 2017).
(2) Deemed interests refer to interests determined pursuant to Section 4 of the SFA.
(3) Mr Handojo Santosa is the settlor of the Scuderia Trust. Under the terms of the Scuderia Trust, he is entitled, as an investment power holder, to direct the trustee of the Scuderia Trust to procure to the best of its ability that the directors of Fusion Investment Holdings Limited and Tasburgh Limited act in accordance with his instructions in relation to the investments of the Scuderia Trust. See Note (6) below. As the sole shareholder of Rangi Management Limited, Fusion Investment Holdings Limited is entitled to determine the composition of the board of directors of Rangi Management Limited. Accordingly, Mr. Handojo Santosa can control the exercise of the rights of the shares held by Fusion Investment Holdings Limited in Rangi Management Limited and through the board of directors appointed by Fusion Investment Holdings Limited, control the exercise of the rights of the Shares held by Rangi Management Limited under the Scuderia Trust. By virtue of Section 4 of the SFA, Mr. Handojo Santosa is deemed to have an interest in the Shares held by Rangi Management Limited and Tasburgh Limited. Tallowe Services Inc holds 81,000,000 Shares. The Shares of Tallowe Services Inc are held by Magnus Nominees Limited and Fidelis Nominees Limited as bare trustees for Mr. Handojo Santosa. By virtue of Section 4 of the SFA, Mr Handojo Santosa is also deemed to have an interest in the Shares held by Tallowe Services Inc. In addition, Mr Handojo Santosa is also deemed to have an interest in 736,300 Shares held in a joint account with his wife (through their client account with a financial institution).
(4) Fusion Investment Holdings Limited holds the entire issued and paid-up capital of Rangi Management Limited. By virtue of Section 4 of the SFA, Fusion Investment Holdings Limited is deemed to have an interest in the Shares held by Rangi Management Limited.
(5) The shares in each of Fusion Investment Holdings Limited, Tasburgh Limited and Morze International Limited are collectively held by Magnus Nominees Limited and Fidelis Nominees Limited as bare trustees on trust for their sole shareholder, Highvern Trustees Limited, as trustee of the Scuderia Trust and the Capital Two Trust. By virtue of Section 4 of the SFA, Highvern Trustees Limited is deemed to have an interest in the Shares held by Rangi Management Limited, Tasburgh Limited and Morze International Limited. Highvern Trustees Limited is a professional trustee and is wholly-owned by MNM Holdings Limited.
(6) Highvern Trustees Limited is the trustee of the Scuderia Trust which is a reserved power discretionary trust. The Shares held by Rangi Management Limited and Tasburgh Limited are assets of the Scuderia Trust. The settlor of Scuderia Trust is Mr. Handojo Santosa. The beneficiaries of the Scuderia Trust are Mr. Handojo Santosa’s spouse (Farida Gustimego Santosa), children (Renaldo Santosa, Gabriella Santosa, Mikael Santosa and Raffaela Santosa) and remoter issue. Pursuant to Section 4 of the SFA, the beneficiaries of the Scuderia Trust are deemed to have an interest in the Shares held by Rangi Management Limited and Tasburgh Limited.
(7) Highvern Trustees Limited is the trustee of the Capital Two Trust which is a reserved power discretionary trust. The Shares held by Morze International Limited are assets of the Capital Two Trust. The settlor of Capital Two Trust is Ms. Rachel Anastasia Kolonas, the daughter of Mr. Hendrick Kolonas. The beneficiaries of the Capital Two Trust are t Rachel Anastasia Kolonas, her issue and remoter issue and Tati Santosa. Pursuant to Section 4 of the SFA, the beneficiaries of the Capital Two Trust are deemed to have an interest in the Shares held by Morze International Limited.
(8) MNM Holdings Limited is the direct holding company of Highvern Trustees Limited. By virtue of Section 4 of the SFA, MNM Holdings Limited is deemed to be indirectly interested in the Shares that Highvern Trustees Limited is interested in.
LETTER TO SHAREHOLDERS
16_0447 Japfa_Cir16_LTS_v3.indd 4 20/3/17 3:26 PM

5
LETTER TO SHAREHOLDERS
(9) Mr Martin John Hall, Ms Naomi Julia Rive and Mr Miles Aidan Le Cornu each has a direct interest in 33.33% of MNM Holdings Limited, which is the direct holding company of Highvern Trustees Limited. By virtue of Section 4 of the SFA, each of Mr Martin John Hall, Ms Naomi Julia Rive and Mr Miles Aidan Le Cornu is deemed to be indirectly interested in the Shares that Highvern Trustees Limited is interested in.
(10) Ms. Rachel Anastasia Kolonas is the settlor of the Capital Two Trust. Under the terms of the Capital Two Trust, she is entitled, as an investment power holder, to direct the trustee of the Capital Two Trust to procure to the best of its ability that the directors of Morze International Limited act in accordance with her instructions in relation to the investments of the Capital Two Trust. Accordingly she can control the exercise of the rights of the Shares held under the Capital Two Trust. By virtue of Section 4 of the SFA, Ms. Rachel Anastasia Kolonas is deemed to have an interest in the Shares held by Morze International Limited.
(11) Mdm Farida Gustimego Santosa is a beneficiary under the Scuderia Trust. See Note (6) above. Mdm Farida Gustimego Santosa is also deemed to have an interest in 736,300 Shares held in a joint account with her husband (through their client account with a financial institution).
(12) Mr Renaldo Santosa is a beneficiary under the Scuderia Trust. See Note (6) above. Mr Renaldo Santosa additionally holds 860,000 Shares through his client account with a financial institution.
4. DIRECTORS’ RECOMMENDATION
The Directors are of the opinion that the proposed appointment of EY as Auditor of the Company in place of the retiring Auditor, RSM, is in the best interests of the Company. They accordingly recommend that Shareholders vote in favour of Ordinary Resolution No. 13, being the Ordinary Resolution relating to the appointment of EY as Auditor of the Company in place of the retiring Auditor, RSM, to be proposed at the 2017 AGM.
5. ACTION TO BE TAKEN BY SHAREHOLDERS
5.1. Appointment of Proxies. If a Shareholder is unable to attend the 2017 AGM and wishes to appoint a proxy to attend and vote on his behalf, he should complete, sign and return the attached Proxy Form in accordance with the instructions printed thereon as soon as possible and, in any event, so as to reach the Company’s Share Registrar, Boardroom Corporate & Advisory Services Pte. Ltd., 50 Raffles Place, #32-01 Singapore Land Tower, Singapore 048623, not less than 48 hours before the time fixed for the 2017 AGM. The completion and return of a Proxy Form by a Shareholder does not preclude him from attending and voting in person at the 2017 AGM if he subsequently wishes to do so. In such event, the relevant Proxy Forms will be deemed to be revoked and the Company reserves the right to refuse to admit any person or persons appointed under the Proxy Form to the 2017 AGM.
5.2. When Depositor regarded as Shareholder. A Depositor shall not be regarded as a Shareholder of the Company entitled to attend the 2017 AGM and to speak and vote thereat unless his name appears on the Depository Register at least 72 hours before the time fixed for the 2017 AGM.
6. DIRECTOR’S RESPONSIBILITY STATEMENT
The Directors collectively and individually accept full responsibility for the accuracy of the information given in this Letter and confirm after making all reasonable enquiries that, to the best of their knowledge and belief, this Letter constitutes full and true disclosure of all material facts about the proposed appointment of EY as the Company’s auditor (“Proposed Appointment”) and the Company and its subsidiaries which are relevant to the Proposed Appointment, and the Directors are not aware of any facts the omission of which would make any statement in this Letter misleading. Where information in this Letter has been extracted from published or otherwise publicly available sources or obtained from a named source, the sole responsibility of the Directors has been to ensure that such information has been accurately and correctly extracted from those sources and/or reproduced in this Letter in its proper form and context.
16_0447 Japfa_Cir16_LTS_v3.indd 5 20/3/17 3:26 PM

6
7. INSPECTION OF DOCUMENTS
The following documents are available for inspection at the registered office of the Company at 391B Orchard Road #18-08 Ngee Ann City, Tower B, Singapore 238874 during normal business hours from the date of this Circular up to and including the date of the 2017 AGM:
(a) the Constitution of the Company;
(b) the Annual Report for the financial year ended 31 December 2016;
(c) Ernst & Young LLP’s formal letter of consent to act as Auditor of the Company; and
(d) the Notice of Nomination.
Yours faithfully
For and on behalf of the Board of Directors of JAPFA LTD
Tan Yong NangExecutive Director and Chief Executive Officer
LETTER TO SHAREHOLDERS
16_0447 Japfa_Cir16_LTS_v3.indd 6 20/3/17 3:26 PM

7
22 February 2017
The Board of DirectorsJapfa Ltd391B Orchard Road #18-08 Ngee Ann City Tower BSingapore 238874
Dear Sirs
Pursuant to Section 205 of the Companies Act, Cap 50, I, Cheng Sai Hong, being a member of Japfa Ltd, hereby nominate Ernst & Young LLP for appointment as Auditors of the Company in place of RSM Chio Lim LLP who is due to retire at the forthcoming Annual General Meeting.
Yours faithfully
(sgn.)Cheng Sai Hong
APPENDIX –NOTICE OF NOMINATION
16_0447 Japfa_Cir16_LTS_v3.indd 7 20/3/17 3:26 PM

This page has been intentionally left blank.
16_0447 Japfa_Cir16_LTS_v3.indd 8 20/3/17 3:26 PM

Nurturing A Sustainable Future

Headquartered in Singapore, we employ over 32,000 people across an integrated network of industrial farms, processing and distribution facilities in Indonesia, China, Vietnam, India and Myanmar.
WE ARE A LEADING, PAN-ASIAN, INDUSTRIAL AGRI-FOOD COMPANY DEDICATED TO FEEDING EMERGING ASIA WITH ESSENTIAL PROTEINS.
J A P F A L T D
A N N U A L R E P O R T 2 0 1 6

01
JAPFA LTD | Annual Report 2016
Corporate Profile 02
At A Glance
Business Segments 04
Business Model 05
PT Japfa Tbk 08
Animal Protein Other 09
Dairy 10
Consumer Food 11
Chairman’s Message 14
CEO’s Message 16
Board of Directors 18
Senior Management 22
Financial Highlights 24
Operating & Financial Review 26
Sustainability & Responsibility 40
Corporate Information 48
Corporate Governance 49
Contents
Our Mission
Our Values
To be the leading dependable
provider of affordable protein foods
in emerging Asia by building on the
foundation of our excellent teamwork
and proven experience for the benefit
of all stakeholders.
Central to our Corporate Culture
& Responsibility is the nurturing
of sustainable, growth orientated
relationships based on trust and integrity.
Growing Towards Mutual Prosperity is the
vision which we practise and uphold with
Japfa’s various stakeholder groups.

Annual Report 2016 | JAPFA LTD
02
Corporate Profile
Japfa Ltd (“Japfa”, or together with its subsidiaries, the “Group”) is a leading, pan-Asian, industrialised agri-food company dedicated to feeding emerging Asia with essential proteins.
Headquartered in Singapore, we employ over 32,000 people across an integrated network of modern farming, processing and distribution facilities in Indonesia, Vietnam, Myanmar, India and China. We specialise in producing quality dairy, protein staples (poultry, beef, swine and aquaculture) and packaged food that nourish millions of people.
For over 40 years, we have grown in scale to become leaders in multiple protein foods, by embracing an integrated industrialised approach to farming and food production across the entire value chain. We created large-scale standardised operations which allow us to consistently produce high quality proteins and to replicate our business model across different markets and protein types.
In addition, our business is vertically integrated from animal feed production and breeding to commercial farming and food processing. This not only creates opportunities for us to capture value at different points in the agri-food chain but also provides our customers with greater food security and traceability.
We pride ourselves on our use of superior breeds, and a sophisticated
approach to animal husbandry, animal health, nutrition and welfare – all of which reinforce the quality of our products and the high production yields. We place a strong focus on bio-security with stringent operating procedures, while building strategic alliances with global leaders in breeding research.
Today, we are one of the two largest producers of poultry in Indonesia. We have also replicated our industrialised, vertically integrated business model for poultry operations in Vietnam, Myanmar and India, as well as swine operations in Vietnam.
On top of this, we have successfully replicated our Indonesian dairy business in China, where we are now amongst the leading producers of premium raw milk in the country. Our raw milk in Indonesia and China is also of the highest quality in terms of nutritional standards.
We leverage the high quality of our raw materials to produce premium and mass market consumer branded food products under leading brands such as So Good and Greenfields.
Given the growing affluence of our target middle- and lower-income consumer groups, we expect protein food consumption in these markets to rise. Well-poised to capitalise on this trend, we plan to forge ahead with our strategy of expanding across multiple protein segments in our five high-growth emerging Asian markets.
PT JAPFA TBKIndonesia• Poultry feed manufacturing,
breeding, and commercial farming and poultry slaughterhouses
• Beef cattle breeding, fattening and processing
• Aquaculture feed manufacturing, hatcheries, cold storage and processing
ANIMAL PROTEIN OTHERVietnam• Poultry feed manufacturing, breeding
and commercial farming• Swine feed manufacturing, breeding
and fattening
Myanmar• Poultry feed manufacturing, breeding
and commercial farming
India• Poultry feed manufacturing, breeding
and commercial farming• Poultry diagnostic lab
China• Beef cattle fattening
Creating Value for Asia

JAPFA LTD | Annual Report 2016
INDIA
VIETNAM
MYANMAR
CHINA
INDONESIA
CORPORATE HEAD OFFICE
SINGAPORE
LEGEND
Corporate Head Office
PT Japfa Tbk
Animal Protein Other
Dairy
Consumer Food
1 Dairy: As at 31 December 2016, Japfa Ltd’s shareholdings in Dairy is held through Austasia Investment Holdings Pte Ltd (“AIH”) and AIH2 Pte Ltd (“AIH2”). Japfa Ltd owns 61.9% and 64.5% of AIH and AIH2, respectively.
2 Indonesia Animal Protein: As at 31 December 2016, Japfa Ltd’s shareholding in PT Japfa Comfeed Indonesia Tbk is 51.0%.
03
DAIRYChina• Dairy farming• Raw milk production
Indonesia• Dairy farming• Milk processing• Distribution of branded premium
milk and dairy products
CONSUMER FOODIndonesia• Branded ready-to-eat poultry,
beef and milk-based food• Branded ready-to-cook poultry,
beef and seafood-based food• Food manufacturing, sales and
distribution and consumer marketing
Vietnam• Branded ready-to-eat meat-based
food products• Food manufacturing, sales and
distribution, and consumer marketing

Annual Report 2016 | JAPFA LTD
In Indonesia, we carry out our animal protein operations through IDX-listed PT Japfa Comfeed Indonesia Tbk (“PT Japfa Tbk”), which we own 51.0% of the share capital. We produce specially-formulated premium animal feed, and multiple high-quality animal proteins, namely, poultry, beef and aquaculture.
We have wholly-owned animal protein operations in Vietnam, Myanmar and India, which produce premium animal feed, poultry and swine. We have successfully replicated our industrialised, vertically integrated business model for poultry production in Vietnam, Myanmar and India, as well as established our swine operations in Vietnam.
We carry out our dairy operations mainly in China and Indonesia. In China, we focus on upstream dairy farming to produce premium raw milk for downstream customers, while in Indonesia, we operate a vertically integrated dairy business which produces premium raw milk that is used further downstream for our Greenfields dairy products.
We use our animal protein products as raw materials for our own downstream consumer food segment. Our So Good, So Good Sozzis and So Nice brands are leading brands in Indonesia for processed meats, such as chicken nuggets, meat balls and shelf-stable sausages. We also manufacture and market small-pack UHT liquid milk under the Real Good brand in Indonesia, and branded shelf-stable sausages under the So Yumm brand in Vietnam.
At A GlanceBUSINESS SEGMENTS
PT JAPFA TBK
ANIMAL PROTEIN OTHER
DAIRY
CONSUMER FOOD

05
JAPFA LTD | Annual Report 2016
At A GlanceBUSINESS MODEL
VERTICALLY INTEGRATED BUSINESS ACROSS ENTIRE VALUE CHAIN
Five Proteins | Five Countries
Ver
tica
lly
In
teg
rate
d B
usi
nes
s M
od
el
UPSTREAM
MIDSTREAM
DOWNSTREAM
We have a vertically integrated business model that covers the entire value chain for many of our protein products, from feed production and breeding to commercial farming and processing.
In addition, we are able to leverage our premium protein production operations through our downstream consumer food business.
ANIMAL FEED PRODUCTION
MILKING &FATTENINGFARMS
PROCESSING &DISTRIBUTION
BREEDINGFARMS
ANIMAL PROTEIN – PT JAPFA TBKIndonesia
CONSUMER FOODIndonesia | Vietnam
ANIMAL PROTEIN – OTHERVietnam | Myanmar | India
DAIRYChina | Indonesia
DAIRYMILKING
BRANDED DAIRY
PRODUCTS
BRANDED CONSUMER
FOODS
POULTRYBREEDING
POULTRYBREEDING
POULTRYFEED
POULTRYFEED
SWINEFEED
CATTLEFEED
CATTLEFEED
AQUACULTUREFEED
POULTRYCOMMERCIAL
FARMING
POULTRYCOMMERCIAL
FARMING
SWINE BREEDING
SWINEFATTENING
BEEF CATTLEBREEDING
BEEF CATTLEBREEDING
BEEFFEEDLOTS
AQUACULTURE BREEDING
AQUACULTURE COMMERCIAL
FARMING

06
Annual Report 2016 | JAPFA LTD
One of our key success factors lies in our industrialised approach to agri-food production, which we have diligently
honed over the past 40 years.

JAPFA LTD | Annual Report 2016
Large-scale operations with over 32,000 employees
managing mega-scale farms
Technology and genetics know-how via joint ventures
with Aviagen and Hypor
Stringent bio-security standards and in-house vaccine production firm
Standardisation of best farm management practices across
core pillars
OUR CORE COMPETENCIES
1
2
3
4

08
Annual Report 2016 | JAPFA LTD
At A GlancePT JAPFA TBK
We produce high-quality animal p ro te ins (pou l t ry , bee f and aquaculture) and premium specially-formulated animal feed in Indonesia. Our animal protein operations are vertically integrated and cover the entire value chain of animal protein production, and we partner with world-leading genetics companies to breed high performance parent livestock in modern farm facilities using advanced management systems.
In addition, we help thousands of farmers succeed commercially with a full range of customized animal nutrition, quality breeder livestock and technical assistance. We also engage in commercial farming and further processing of livestock products in markets where we have established downstream distribution.
PoultryWe produce premium-quality animal feed in Indonesia, both for our own poultry and aquaculture operations, as well as for sale to third parties. Our production capacity is 4.6 million tons in 2016. Our feed brands are among the most recognised in Indonesia, backed by feed conversion ratios (i.e. total amount of feed required per bird kilogram) that are among the best in the industry.
PRODUCE HIGH-QUALITY ANIMAL PROTEINS AND PREMIUM ANIMAL FEED IN INDONESIA
We began our poultry business in Indonesia 40 years ago, and we are now the second largest integrated company in Indonesia. In collaboration with Aviagen, a world leading poultry genetics company, we are able to deliver high performance day-old chicks (“DOCs”) which are adapted to tropical conditions. To combat the threat of disease, we have PT Vaksindo Satwa Nusantara, a leading animal vaccine company in Indonesia, to conduct research, and produce autogenous vaccines on a timely basis.
AquacultureFeed manufacturing is the core activity of our aquaculture business. Our five aqua-feedmills produce a wide range of feed products for commercial fish and shrimp farms which are sold directly to local farmers and independent distributors throughout Indonesia. We also operate cold storage and processing plants, fresh water fish farming, shrimp pond and shrimp hatcheries to support our customers who require commercial quality seeds.
13 poultry feedmills
3 breeder feedmills
66 breeding farms
24 hatcheries
9 slaughterhouses and primary processing plants
Over 100 company
farms and over 9,000 contract farms
5 aqua-feedmills
3 centres for aquaculture research
4 cattle fattening farms
2 cattle breeding farms
1 beef processing operation
POULTRY
AQUACULTURE
BEEF
BeefWe are the leading integrated beef company in Indonesia with a capacity of over 150,000 heads of cattle per
year for domestic consumption. To meet the growing domestic demand for speciality beef products, we built our own deboning and processing plant in Indonesia to produce speciality cuts and Wagyu beef products for grocery chain retailers, modern food services, hotels and restaurants.

09
JAPFA LTD | Annual Report 2016
At A GlanceANIMAL PROTEIN OTHER
We have successfully replicated our large-scale and industrialised animal protein operations across emerging Asia markets. In recent years, we have established poultry operations in Vietnam, Myanmar and India, swine operations in Vietnam, as well as beef cattle operations in China.
SUCCESSFULLY REPLICATED ANIMAL PROTEIN OPERATIONS ACROSS EMERGING ASIA MARKETS
VietnamWe produce premium-quality animal feed in Vietnam, both for our own poultry and swine operations, as well as for sale to third parties. Our customers appreciate our ability to customise our feed, as specifically formulated feed has been proven to enhance growth rates, while being cost efficient.
We operate a network of over 30 company farms and over 230 contract farms for poultry across Vietnam, and we also own poultry processing facilities in the country. Commercial broiler farming operations are carried out through our company farms (farms that we either own or operate on lease), or contract farms (farms that are operated by external commercial farmers).
In addition, we manufacture specially formulated swine feed and produce a high-performance breed of piglets for our external customers and our company/contract fattening farms. We also partner with Hypor, one
of the world’s leading suppliers of swine genetics, to operate a great grandparent breeding farm. Japfa on its own, then operates the entire chain from grandparent and parent breeding farms to swine fattening farms for domestic consumption.
Myanmar We produce premium-quality animal feed in Myanmar, which is mostly sold to third-party customers all over Myanmar, and the rest are used for our own poultry operations. We also produce day-old chicks, which are mostly distributed to third-party customers. In addition, we operate a network of over 120 company farms and over 80 contract farms across the country, where we carry out commercial broiler farming operations.
In October 2016, we opened up a new feedmill in Mandalay (Northern Myanmar) to cater the growing demand for premium quality animal feed in the region. To complement our feedmill in Yangon, we added a new facility with corn dryer and silos to improve the quality of our corn, which is one of the major raw material for feed.
IndiaWe operate 6 poultry feedmills in India, which consist of 4 company feedmills and 2 toll processing feedmills, as well as 1 poultry diagnostic lab which was established in 2016. In addition, we carry out commercial broiler farming operations through an extensive network of over 400 contract farms. To cater to the growing demand for premium-quality animal feed in India, we have acquired a new property to build a new poultry feedmill.
ChinaIn 2014, we established feedlot operations in China, and a 10,000-head carrying capacity feedlot spread over 200 hectares in the Hekou district in the Shandong Province of China, with an additional 500 hectares for cultivation. The bull calves born at our dairy farms in China provide the source of cattle for our beef feedlot, thereby providing integration across our dairy and animal protein beef segments.
Beef1 cattle fattening farm
5 poultry/swine feedmills
Poultry12 poultry breeding farms
4 hatcheries
Over 30 company farms
Over 230 contract farms
Swine• 1 Great Grand Parent (“GGP”) swine farm• 5 Grand Parent (“GP”) swine farms• 19 Parent Stock (“PS”) swine farms• 3 nursery farms• Over 50 contract nursery farms• 9 fattening farms• Over 80 contract fattening farms
VIETNAM
Poultry 2 poultry feedmills, 2 poultry breeding farms and 2 hatcheries
Over 120 company farms
Over 80 contract farms
MYANMAR
Poultry 6 poultry feedmills
1 poultry breeding farm
2 hatcheries
Over 400 contract farms
INDIA
CHINA

10
Annual Report 2016 | JAPFA LTD
At A GlanceDAIRY
We pioneered the first “grass-to-glass” vertically integrated modern dairy in Indonesia in 1998, and we now own, in Indonesia and China, seven world-class fully operational dairy farms and a processing plant that are designed, equipped and managed to meet and exceed international standards in productivity and bio-security.
Our large-scale industrialised-dairy farms, with a standardised 10,000-head farm design, maximises operational efficiency and quality, and generates high yields from our milking cows which surpass both local and international nutritional and safety standards.
Our success is largely due to the scale and design of our farms, experienced farm managers, advanced and industrialised farm management practices, high-yielding livestock, as well as the strategic locations of our farms where environmental factors are ideal.
ChinaWe have a five-farm hub of dairy farms in Dongying city, Shandong Province, with close to 55,000 heads of Holstein cattle. In China, we focus on producing premium raw milk that is sold to leading dairies such as Yili, Mengniu and New Hope.
GREENFIELDS, #1 BRAND OF FRESH PASTEURIZED MILK IN INDONESIA1
With rising consumer demand for traceable, premium dairy products, we plan to grow our capacity by building a new five-farm hub in Inner Mongolia. Farm 6 started milking in January 2016 and was fully milking in November 2016. In addition, Farm 7 has also started milking in November 2016 and we anticipated it to be fully milking in the current financial year.
Since mid-2014, we have also appointed a third party contract packer in China to pack the premium raw milk from our dairy farms under our Greenfields brand for distribution in China.
In support of our future downstream business, in 2015, we entered into a joint venture with Food Union (Asia) Limited (“Food Union”), an European-based dairy and milk processing company, to build, own and operate a premium milk processing plant in Shandong Province, China. We currently own a 19% share in the joint venture company, Food Union AustAsia Holdings Pte Ltd. We will also supply raw milk to the plant, which will in turn manufacture high value-added dairy products for the Group, Food Union, as well as leading third party international food companies.
IndonesiaIn Malang, East Java, Indonesia, we operate a vertically integrated dairy business, where our dairy farm is the largest dairy farm operation in the country by volume of premium fresh milk produced. The farm is linked to our downstream dairy processing plant, and this production model enables us to seal in the maximum
38,420 heads of milkable cows1
73,678 heads of Holstein cattle in Farms 1 to 5 in Shandong province2 and Farms 6 and 7 in Inner Mongolia
CHINA
4,553 heads of milkable cows1
8,416 heads of Holstein cattle in our farm in Malang, East Java2
INDONESIA
1 As at 31 December 2016. 2 Approximate numbers only.
1 PT Austasia Food calculation and claim based on value and volume sales data provided by Nielsen Scan Track Service for Pasteurized Milk category for the 12 months ending September 2016 for Indonesia market. (Copyright © 2016, Nielsen).
amount of natural nutrients in all our fresh dairy products.
In 2000, we launched our consumer brand Greenfields for the premium segment, and subsequently introduced other value-added dairy products to target affluent consumers. Today, Greenfields is Indonesia’s number one brand for fresh quality milk, and also exported to neighbouring Southeast Asian countries, including Singapore, Malaysia and the Philippines.

11
JAPFA LTD | Annual Report 2016
At A GlanceCONSUMER FOOD
By combining Japfa’s expertise in agri-food production with our passion to provide world-class downstream consumer food products in the long term, we have grown to be the pioneer provider of protein-based food and beverage to our consumers in Indonesia.
IndonesiaFounded in 1996, the Group’s wholly-owned subsidiary, PT So Good Food, is a downstream consumer food company specializing in the manufacturing and distribution of branded protein-based and ready-to-eat, frozen and chilled products, including ready-to-drink UHT milk products.
Headquartered in Jakarta, PT So Good Food is today one of the largest Indonesian producers in the branded processed meat and poultry segment, with approximately 40% market share by sales volume and high consumer brand recognition in 2016. It currently has over 5,000 employees, with a turnover of US$200 million in FY2016, and annual sales volumes of over 50,000 tonnes of processed poultry and meat products and over 38 million liters of UHT milk.
PROVIDING PROTEIN RICH CONSUMER FOOD AND DAIRY NOURISHMENT SOLUTIONS
We process quality ingredients sourced directly from our upstream animal protein operations into a wide range of branded protein-based and ready-to-eat, frozen and chilled products, so as to cater to the trend towards urbanisation and high consumer demand for healthy and convenient ready-to-eat food. By having a reliable source of quality protein products, we are able to set high standards and provide consumers with a wide variety of protein-rich consumer food products.
We now have manufacturing and processing facilities strategically located across Indonesia, which are supported by a network of sales branches and sales depots. All our food processing facilities in Indonesia are Halal-compliant, with the main raw materials directly sourced directly from our upstream operations.
We adopt a multi-target marketing strategy to reach high-growth consumer groups. With the So Good brand, we aim to fulfill the needs of the Indonesian market by providing a wide variety of nutritious, tasty and premium protein food for the family, while the So Nice brand offers practical and innovative ready-to-eat and ready-to-cook products which are available all over Indonesia.
With the Real Good brand, we provide milk experience with a variety of tastes, product serving suggestions and applications by developing unique UHT milk products for the needs of
the family household. We offer ready-to-drink, small pack milk products for health and enjoyment.
VietnamIn 2011, we launched ready-to-eat, shelf-stable, sausages under So Yumm brand in Vietnam where we already have a significant foot print in livestock production. Our new sausage processing and packaging plant is strategically located in Binh Duong Province, about 45 km from Ho Chi Minh City, home to the country’s largest urban consumer market. We have also started exporting So Yumm sausages to Myanmar.
6 meat processing plants
5 poultry slaughterhouses
1 UHT milk processing plant
7 regional sales branches
INDONESIA
1 meat processing plant
VIETNAM
12
Annual Report 2016 | JAPFA LTD
With three billion people living in our target markets, there are significant growth opportunities for the Group as their
appetite for proteins continues to grow.

13
JAPFA LTD | Annual Report 2016
8.5 kgof poultry
per person/year
44.3 kgof poultry
per person/year
12.8 kgof pork
per person/year
21.1 kgof pork
per person/year
CONSUMPTION OF MEAT PER CAPITA
CONSUMPTION OF FRESH DAIRY
PRODUCTS PER CAPITA
Asia and Pacific
IN 2015
Source: OECD/FAO (2016), “OECD-FAO Agricultural Outlook”, OECD Agriculture statistics (database).
OUTLOOK FOR 2025
By 2025, per capita consumption of fresh dairy
products is set to increase to around 29 kg in least
developed countries, compared to an average 56 kg in developing countries.
North America

Annual Report 2016 | JAPFA LTD
Chairman’s Message
Dear Shareholders,
On behalf of the Board of Directors, I am pleased to present to you Japfa’s annual report for the financial year ended 31 December 2016 (“FY2016”).
Broad-based Growth in FY2016The Group achieved broad-based growth and improved profitability in FY2016, owing to better market conditions, our continued strategy of diversification across different
protein and geographical segments, as well as higher efficiencies.
We reported an 8.8% growth in the Group’s revenue, from US$2.8 billion in FY2015 to US$3.0 billion in FY2016. The Group’s Core PATMI w/o Forex increased by 47.6% from US$88.3 million in FY2015 to US$130.2 million in FY2016.
Of the Group’s three core pillars, PT Japfa Tbk contributed the most to the Group’s improvements in revenue
OPERATING PROFIT
REVENUE
CORE PATMI W/O FOREX1
PROFIT AFTER TAX
43.7%
311.4US$
million
8.8%
3.0US$
billion
47.6%
130.2US$
million
115.5%
197.7US$
million
G O H G E O K K H I M – C H A I R M A N
14
and profitability. The Group’s other two core pillars of Animal Protein Other and Dairy also contributed significantly as a result of higher sales volumes across multiple markets and product categories, which offset fluctuations in the selling prices of certain product categories.
In view of the Group’s positive results and in appreciation of shareholders’ support, the Board of Directors has recommended a final dividend of 1.0 Singapore cent per share for FY2016.
1 We derived “Core PATMI” from “Profit Attributable to Owners of the Parent, Net of Tax” by excluding changes in fair value of biological assets (net of tax) and derivatives and by excluding extraordinary items (namely the gain from the buyback of USD bonds in PT Japfa Tbk and the gain on disposal of asset held for sale), attributable to owners of the parent.
“Core PATMI w/o Forex” is an estimate derived from Core PATMI by excluding foreign exchange gains/losses (before tax) attributable to the owners of the parent. As the majority of the foreign exchange gains/losses are unrealised and arises from the translation of USD bonds in PT Japfa Tbk, which has no tax implication, we have not made an estimate of the tax impact on foreign exchange gains/losses.

JAPFA LTD | Annual Report 2016
15
Nurturing Sustainable GrowthFY2016 marks the first instance that the Group’s revenue has crossed US$3.0 billion. This is a significant step towards fulfilling our vision of becoming the leading pan-Asian, industrialised agri-food company.
In the years ahead, we will work hard to execute our strategy of diversification across multiple proteins and geographies, as well as replicating our industrialised and scalable businesses across Asia. This will be built on our three core pillars
and core competencies in large scale farming and food production. It will also be nurtured through strategic, growth-oriented partnerships across our businesses.
While the Group’s performance may, from time to time, be subject to external influences such as the macro-economic environment, currency fluctuations and other market forces, we will r ise to these challenges by continuously enhancing the efficiency of our operations, maximising the returns
from our assets, and tapping on emerging growth opportunities.
AcknowledgementsOn behalf of the Board of Directors, I would like to take this opportunity to thank all our shareholders, business partners and customers for their continued support and confidence in the Group.
I would also like to thank the Board of Directors for their stewardship and guidance, as well as our management team and more than 32,000 employees for their dedicated efforts. The Group’s success is directly attributable to their care and diligence in executing their roles.
We remain resolutely focused in our quest to deliver sustainable long term growth and shareholder value. Thank you and we look forward to your continued support in the years ahead.
Goh Geok KhimChairman

Annual Report 2016 | JAPFA LTD
TA N Y O N G N A N G – C H I E F E X E C U T I V E O F F I C E R
CEO’s Message
Dear Shareholders,
Diversification Strategy Bears FruitWe are delighted to report a robust set of results for FY2016, which is anchored by the year-on-year improvement in profitability across our core pillars and stable profits provided by our animal feed business across all geographies.
While we have benefited from better market conditions, our relentless push for operational diversification and higher efficiencies has also put us in good stead to tap on the positive market tailwinds and overcome pockets of industry headwinds.
In the past year, we also dedicated our energies to refining our vertically integrated business model and industrialised approach to farming and food production, and we now have a very strong foundation, which is demonstrated by the positive contributions by the three key core pillars of PT Japfa Tbk, Animal Protein Other and Dairy in FY2016.
Steady Growth in FY2016 For the full year, we delivered Core PATMI w/o Forex of US$130.2 million on the back of the 8.8% year-on-year growth in the Group’s revenue to US$3.0 billion. This was due to the stable base of profits from our animal feed operations across all geographies, coupled with the improved performance of the three core pillars.
In addition, the higher revenue and operating profit margin has led to a 43.7% growth in operating profit to US$311.4 million, while EBITDA rose by 42.3% to US$423.3 million.
As at 31 December 2016, the Group’s total assets stood at US$2.5 billion, and we recorded positive cash flow of US$362.9 million from operating activities.
Three Core Pillars Delivers ResultsIn FY2016, our three core pillars demonstrated the resilience of our diversification strategy by delivering improved performance in terms of revenue and profits.
PT Japfa TbkPT Japfa Tbk was the main contributor for the Group’s growth, with significant improvement across the board to register a 9.4% increase in revenue to US$2.0 billion in FY2016, mainly due to the increase in sales volumes for feed and day-old chicks (“DOCs”).
Besides recording better feed margins during the year, PT Japfa Tbk also benefited from the stable poultry prices throughout FY2016 which led to improved breeding margins. In addition, commercial farming sales volumes and margins remained stable in FY2016.
With the higher sales volumes and margins, PT Japfa Tbk recorded one of its strongest performance in recent years and this core pillar’s contribution to the Group’s Core PATMI w/o Forex jumped 124.4% to US$77.4 million in FY2016.
Animal Protein OtherThis core pillar achieved a 5.2% increase in revenue to US$562.0 million, mainly due to contributions by Vietnam and
CORE PATMI W/O FOREX
OPERATING PROFIT MARGIN
47.6%
130.2US$
million
2.5ppt
10.3%
16

17
JAPFA LTD | Annual Report 2016
Myanmar which recorded higher sales volumes. Overall, profitability also improved year-on-year, with a contribution of US$36.7 million to the Group’s Core PATMI w/o Forex in FY2016.
In FY2016, Vietnam operations contributed more than 60% of this segment’s revenue, and about 70% of operating profit, with sales volumes for feed and swine fattening recording solid year-on-year growth.
In addition, Myanmar operations registered a growth in sales volumes for feed, DOCs and broilers. To build on our growth momentum, on 16 October 2016, we officially launched our second feedmill in Myanmar to produce high-quality animal feed for third party farmers in the Mandalay region.
In India, the consumer demand for chicken has declined due to the demonetization of the Indian Rupee in November 2016, which resulted in lower poultry sales volumes. In the near term, our focus continues to be on feed operations which consistently delivers profits.
DairyIn FY2016, the continuing pressure on raw milk prices was compensated by our improvement in milk yield and higher sales volumes, as we continued to expand strategically in China.
While this core pillar’s revenue and profit generation is mainly driven by China, our dairy operations in South-east Asia continued to show improvement in profitability even as we invest strategically in building the Greenfields brand of fresh milk and dairy products.
For the full year, revenue grew mainly due to the increase in raw milk sales volumes in China. Milkable cows in China increased by 27% to a population of 38,420 heads, as Farm 6 started milking in January 2016 and fully milking in November 2016. In addition, Farm 7 has also started milking in November 2016 and we anticipated it to be fully milking in 2017.
Despite the decline in raw milk prices in China, which is expected to remain sluggish in the near term, our higher milk sales volumes and milk yields have helped to offset the decline, and this core pillar’s contribution to the Group’s Core PATMI w/o Forex grew by 20.1% to US$26.7 million in FY2016.
Building Future Growth DriverWithin our animal protein segment, feed is the stable pillar of profitability. The livestock selling prices from our breeding and fattening operations, however, are subject to demand and supply dynamics, which can change due to seasonality and macroeconomic factors in the different markets we operate in. In our dairy segment, the raw milk pricing environment in China is also subject to similar factors.
As such, our key operational focus in the livestock business is to ensure that Japfa is one of the most efficient and lowest cost producers in that competitive environment. With this operational focus, we are able to mitigate the impact of fluctuations in livestock and raw milk prices that occur in our agri-food business from time to time.
Even as we enjoy the fruits of our labour in the feed business and in livestock farming, we are also expanding our expertise in the
downstream business of consumer food processing, so as to develop this segment to be our fourth core pillar in the long term. With this in mind, we have built strategic alliances with key players in the agri-food industry, including a joint venture (“JV”) company with Cargill to produce and supply fully-cooked poultry products in Indonesia.
With our three core pillars in place, we are confident that our core competencies in large-scale farming and food production, diversified strategy across multiple proteins and geographies, together with our track record in replicating the Group’s industrialised and scalable business across the region, will enable us to overcome market challenges and tap on growth opportunities.
AcknowledgmentsThe steady growth in FY2016 was a culmination of the strategic initiatives that the Group has implemented in recent years. It was also due to the hard work put in by our workforce of 32,000 across Asia to further heighten our operational efficiencies, and we are sincerely appreciative of their continuous dedication to Japfa.
We would also like to thank our shareholders for your continuous support and believe in the Group’s mission to feed emerging Asia with essential proteins. While the outlook for the global economy remains uncertain, with the support of all our stakeholders, I have full confidence that Japfa will be able to sustain its growth for the long term.
Tan Yong NangChief Executive Officer

18
Annual Report 2016 | JAPFA LTD
Board ofDirectors
Mr Goh was appointed to our Board on 30 June 2014. He is currently Chairman of the Board of Directors of G. K. Goh Holdings Limited, Boardroom Limited, Temasek Foundation CLG Limited and Federal Iron Works Sdn Bhd.
Mr Goh started his career in his family’s business, which was active in trading, rubber, property and manufacturing steel products. He left in 1968 to join the stockbroking industry, and in 1979, he established the G. K. Goh stockbroking group.
Mr Goh had previously served as a Non-Executive Director of Lam Soon (M) Bhd, a member of the National Heritage Board and Chairman of the National Museum of Singapore. He was also a member of the SGX-ST Disciplinary Committee from 1998 to 2006.
Mr Goh graduated with a Bachelor of Science degree in Civil Engineering from the University of Colorado.
GOH GEOK KHIMNON-EXECUTIVE
INDEPENDENT CHAIRMAN
Mr Santosa was appointed as an Executive Director on 19 December 2008. He is in charge of the overall management of our Group’s business and operations, including making any major corporate decisions. He oversees the formulation of our Group’s corporate planning, strategic direction, business and corporate policies.
Mr Santosa joined our Group in 1986 as a manager in the edible oil division at Nilam in Surabaya where he was in charge of the edible oil division’s day to day operations. From 1989 to 1997, he served as Vice-President Director of our subsidiary, PT Japfa Comfeed Indonesia Tbk.
In 1997, he was appointed as President Director of PT Japfa Comfeed Indonesia Tbk, a role in which he has oversight of the PT Japfa Group’s operations. His responsibilities include overseeing the entire operations of the PT Japfa Group including the Aquaculture Division, Trading Division and the Beef Cattle Division.
HANDOJO SANTOSA@ KANG KIEM HAN
EXECUTIVE DEPUTY CHAIRMAN

JAPFA LTD | Annual Report 2016
19
Mr Kolonas was appointed as an Non-Executive Director on 18 February 2013. He joined our Group in 2012 as Vice-President Commissioner of our subsidiary, PT Japfa Comfeed Indonesia Tbk. Prior to joining our Group, Mr Kolonas was the branch manager at the Head Office (Operational) of Bank Dagang Nasional Indonesia. During his time there from 1983 to 1988, he was involved in organising and managing various departments of the branch.
Mr Kolonas has also served on the board of Bank Tiara Asia, where he was President Director from 1989 to 1997 and Vice-President Commissioner from 1997 to 1998. Mr Kolonas founded PT Celebes Artha Ventura in 1996 and spearheaded investments into various financial services businesses. He has been the President Commissioner of PT Celebes Artha Ventura since 2010.
Mr Kolonas graduated from Middlesex University, United Kingdom (“UK”) in 1982 with a Bachelor of Arts (Hons) degree in Accounting and Finance. He also has a Masters degree in Business Administration from Schiller International University, UK and a Masters of Arts degree in Banking Administration from University of Hull, UK, which he attained in 1983 and 1989, respectively.
HENDRICK KOLONASNON-EXECUTIVE
NON-INDEPENDENT DIRECTOR
Mr Tan was appointed as an Executive Director on 1 June 2009. As the Group’s Chief Executive Officer (“CEO”), he is in charge of leading the development and execution of our long-term strategy and is also responsible for all day-to-day management decisions.
Mr Tan joined our Group in 2007 as an assistant to the CEO and Chief Operating Officer (“COO”) of Corporate Services before taking on the position of COO of our Group in 2011. Mr Tan was involved in the growth of our Group’s operations in the region such as the expansion of our swine and dairy business segments, and had oversight of the management functions across our Group’s businesses. Mr Tan is also involved in the management of our Group’s financial liabilities and has assisted our Group in diversifying our financial relationships to include regional and international banking organizations.
Mr Tan started his career as a statistician at the Department of Statistics, Singapore in 1985 and went on to become a research economist with Singapore’s Ministry of Trade and Industry in 1986. He joined the Prudential group in 1988 as an investment analyst and was based in Hong Kong and the USA.
From 1991 to 2003, Mr Tan was employed by the PAMA Group Inc.’s group of companies (“PAMA Group”), becoming a partner of PAMA BVI in 2001. He was involved in setting up several equity funds of the PAMA Group and handling the funds’ investment portfolio in South East Asia. He was also an Investment Committee member of PAMA BVI from 1997 to 2003. In 2003, Mr Tan joined Delifrance Asia Ltd as its CEO, and in 2005, he joined Li & Fung Group in 2005 as its Project Director and COO.
Mr Tan graduated with a Bachelor of Arts (Economics) degree from the University of Cambridge, UK in 1983. He was also registered as a Chartered Financial Analyst with The Institute of Chartered Financial Analysts, USA in 1992 and is currently a member of Mensa International.
TAN YONG NANGEXECUTIVE DIRECTOR ANDCHIEF EXECUTIVE OFFICER
Annual Report 2016 | JAPFA LTD
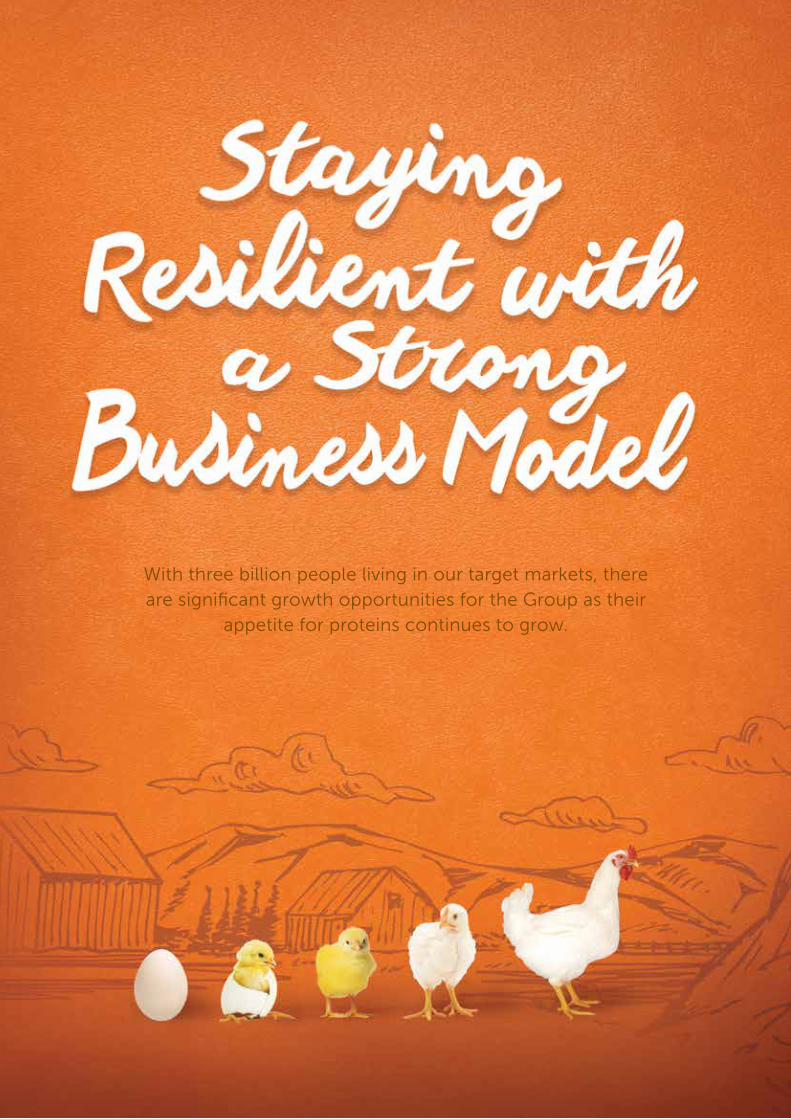
Mr Monteiro was appointed as an Executive Director on 16 April 2014. As Chief Financial Officer, his key roles are to develop a balanced capital structure, to source adequate funding for our Group, and to ensure the integrity of the Group’s financial data. He has oversight over all the financial operations of our Group.
Mr Monteiro was previously the Head of Corporate Finance of our subsidiary, PT Japfa Comfeed Indonesia Tbk and has over 14 years of experience of working in the agri-food industry, having joined PT Japfa Comfeed Indonesia Tbk in 1999. His responsibilities in this position include overseeing its capital structure and managing equity-related matters such as investor relations, annual reports and IDX-compliance. He also oversees merger and acquisition activities and fund-raising activities of the PT Japfa Group which included a SGX-listed US$225 million Senior Notes issuance in 2013 and three mergers by PT Japfa Comfeed Indonesia Tbk of which two involved public-listed targets.
Prior to joining PT Japfa Comfeed Indonesia Tbk, Mr Monteiro was a financial advisor to another IDX-listed company between 1995 and 1999. Between 1985 and 1995, Mr Monteiro practised as a chartered accountant, first as a sole practitioner, and later as a partner of Callaway & Hecht in Melbourne. Whilst in practice, Mr Monteiro was a registered tax agent and registered company auditor in Australia.
Mr Monteiro obtained a Bachelor of Economics degree from MonashUniversity, Australia in 1979 and has been a member of the Institute of Chartered Accountants in Australia since 1982.
KEVIN JOHN MONTEIRO
EXECUTIVE DIRECTOR AND CHIEF FINANCIAL OFFICER
Mr Ng was appointed to our Board on 29 July 2014. He has more than 30 years of experience in the corporate finance and securities industry in Singapore and Malaysia, advising clients on corporate restructuring, mergers and acquisitions and fund raising. During his career, he has held positions in foreign and local financial institutions, including Citicorp Investment Bank (Singapore) Ltd, OCBC Securities Pte Ltd, ABN Amro Bank and CIMB Bank Berhad, Singapore Branch.
Mr Ng was also with Temasek Holdings Private Ltd as a Managing Director of its Portfolio Management division and as Chief Representative China. He was also a Director of GMR Infrastructure (Singapore) Pte. Limited (part of the India-based GMR Group) and was involved in the development of their infrastructure projects in South East Asia.
Mr Ng graduated with a degree in Civil Engineering from the University of London in 1976 and has been a member of the Institute of Chartered Accountants in England and Wales since 1980.
NG QUEK PENGINDEPENDENT DIRECTOR
Board ofDirectors
20

JAPFA LTD | Annual Report 2016
21
Ms Lien was appointed to our Board on 29 July 2014. She is currently a Senior Executive Coach at Mobley Group Pacific, a management consulting firm which she joined in 2006.
Ms Lien joined Hewlett-Packard Singapore (Private) Limited (“HP”) in 1978. During her time at HP, she headed its Technology Solutions Group Asia Pacific and Japan and retired from HP in 2007 as a Senior Vice President.
Ms Lien has served on the board of Elekta AB, a company listed on the Nordic Stock Exchange, since 2011. She is also a member of the Compensation Committee for Elekta AB.
Ms Lien has also served as a member of the Board of the Confucius Institute at Nanyang Technological University (“NTU”) since 2008 and a member on the Board of Trustees at NTU.
Ms Lien graduated with a Bachelor of Science degree in Physics from the former Nanyang University in 1971 and attained a Masters degree in Computer Science from London University, Imperial College Science and Technology in 1973. In 2011, she was awarded the Bintang Bakti Masyarakat (Public Service Star) for valuable public service by the Singapore Government and was also appointed a Justice of the Peace by the President of Singapore in 2013.
LIEN SIAOU-SZEINDEPENDENT DIRECTOR

22
Annual Report 2016 | JAPFA LTD
SeniorManagement
BAMBANG BUDI HENDARTOHEAD OF POULTRY
Mr Hendarto oversees the entire poultry operations of our Group, including the feed, breeding and commercial aspects, and is responsible for establishing corporate objectives, strategies and plans for our Group’s poultry operations. Mr Hendarto joined our Group in 1978 as a Nutrition Manager in the Production Planning Control Department where he was involved in supervising and coordinating the activities for the production of formula
BAMBANG BUDI HENDARTO
CHRISTINA CHUA SOOK PING
EDGAR DOWSE COLLINS
JASPER TAN KAI LOON
HEAD OF POULTRY
HEAD OF LEGAL AND COMPLIANCE
ANTONIUS HARWANTO
DEPUTY CHIEF OPERATING OFFICER, OPERATIONAL 1, POULTRY BUSINESS, INDONESIA
HEAD OF DAIRY
HEAD OF HUMAN RESOURCE
feed. He became a Vice Director (Deputy Director) of PT Comfeed Indonesia in 1981 and led the Feed Division of our Group’s operations in Indonesia. Over the years with our Group, he was promoted several times and was appointed the Vice-President Director of PT Japfa Comfeed Indonesia Tbk in 1997. He holds this position till today and his roles and responsibilities in this position include leading the breeding and commercial poultry operations of our Group and to oversee and ensure that our Group’s corporate objectives and strategies relating to such operations are met.
Mr Hendarto graduated from Brawijaya University in 1972 with an Engineering degree in Animal Husbandry.
EDGAR DOWSE COLLINSHEAD OF DAIRY
Mr Collins is responsible for the day-to-day operations of our Group’s Dairy Division and is in charge of formulating, developing and implementing both strategic and long-term business plans for our Group’s Dairy operations.
23
JAPFA LTD | Annual Report 2016
Having been involved in beef and cattle operations throughout his career, Mr Collins has accumulated many years of industry experience. He has been with AustAsia Food Pte. Ltd. since 1999 and is currently its Managing Director. Before joining AustAsia Food Pte. Ltd., he was Head of Operations of PT Santosa Agrindo, currently a subsidiary of our Group, where he was involved in the development of a cattle and beef business in Indonesia. Mr Collins was also a General Manager for approximately two years at BxE Commodities Pty Ltd (“BxE”), a company engaged in the business of import and trading of cattle feed commodities in Australia’s and New Zealand’s dairy industries. During his time at BxE, he was involved in the establishment of a system for the importation, trading and distribution of feed products such as copra meal and palm kernel extract to commercial farmers and feedmills.
ANTONIUS HARWANTODEPUTY CHIEF OPERATING OFFICER, OPERATIONAL 1, POULTRY BUSINESS, INDONESIA
Mr Harwanto is Deputy Chief Operating Officer, Operational 1, Poultry Business, Indonesia, and he is responsible for setting up the vision, mission and strategies to further grow the Group’s poultry business in Indonesia.
Mr Harwanto has been with PT Japfa Comfeed Indonesia Tbk since 1979. From 1979 to 1999, he held various positions in transportation, sales and marketing and served as unit head of Cikupa, Cirebon and Sidoarjo, respectively.
In addition, Mr Harwanto is serving as a Director of PT Indojaya Agrinusa since 1995. From 1999 to 2012, he was also the Commissioner of PT Mul t ibreeder Adi rama Indonesia Tbk. Separately, he
served as a Director of PT Multiphala Agrinusa from 2001 to 2008, and was subsequently appointed to President Director from 2008 till 2010.
Between 2003 and 2017, Mr Harwanto was the Head of Feed Division, before he was promoted to his current position as Deputy Chief Operating Officer, Operation 1, Poultry Business, Indonesia on 1 January 2017.
Mr Harwanto graduated from the 17 August 1945 University in Jakarta, Indonesia, in 1986 with an Economics degree.
CHRISTINA CHUA SOOK PINGHEAD OF LEGAL AND COMPLIANCE
Ms Chua oversees all legal, compliance and secretarial functions of our Group’s operations. She joined our Group in 2010.
Ms Chua has more than 20 years of experience in legal practice. She joined Drew & Napier LLC in 1990 and later joined Rajah & Tann LLP in 2007. During her time in practice, Ms Chua was a partner in the corporate and tax departments of both firms and was recommended in the 2003/2004, 2004/2005 and 2006/2007 editions of The Asia Pacific Legal 500 for Mergers & Acquisitions with a technology specialization, for her role in advising in the Bharti Changi Consortium in respect of the modernization and restructuring of the Mumbai and Delhi airports and as a leading individual, respectively.
She was also named in both Who’s Who—Legal (Singapore) for Mergers & Acquisitions and the International Tax Review 2004 as a leading tax practitioner in Singapore. She was highly recommended for tax (particularly infrastructure and cross border) transactions in PLC Which Lawyer? Yearbook
Singapore 2008/2009 edition and was also named as a highly recommended tax lawyer in PLC Tax on Transactions Handbook 2009/2010 edition. Ms Chua graduated with a Bachelor of Laws (Honors) degree from the National University of Singapore in 1989 and was admitted as an advocate and solicitor of the Supreme Court of the Republic of Singapore in 1989. She has been a member of both the Law Society of Singapore and the Singapore Academy of Law since 1990.
JASPER TAN KAI LOONHEAD OF HUMAN RESOURCE
Mr Tan is in charge of all human resource matters in our Group and is responsible for human resource management, policy governance and administration. Prior to joining our Group in 2012, Mr Tan was employed by the Singapore Ministry of Defense from 1998 to 2012. He was engaged in various positions including Head of the Singapore Armed Forces Careers Centre and Head of Mindef Scholarship Centre. He was appointed as the Head of the Human Resource Department of the Ministry of Defense in 2009 and was responsible for all human resource matters for all non-uniformed personnel of the Ministry of Defense and Singapore Armed Forces. Mr Tan graduated with a Bachelor of Arts and Social Sciences degree from the National University of Singapore in 1997.

Annual Report 2016 | JAPFA LTD
FinancialHighlights
DELIVERING RESILIENT RESULTS
1 We define “EBITDA” as profit before tax from continuing operations, excluding interest income, changes in fair value of biological assets and marketable securities, foreign exchange adjustments gains/(losses), finance costs, depreciation of property, plant and equipment, depreciation of investment properties and amortisation of intangible assets.
2 We derived “Core PATMI” from “Profit Attributable to Owners of the Parent, Net of Tax” by excluding changes in fair value of biological assets (net of tax) and derivatives and by excluding extraordinary items (namely the gain from the buyback of USD bonds in PT Japfa Tbk and the gain on disposal of asset held for sale), attributable to owners of the parent.
“Core PATMI w/o Forex” is an estimate derived from Core PATMI by excluding foreign exchange gains/losses (before tax) attributable to the owners of the parent. As the majority of the foreign exchange gains/losses are unrealised and arises from the translation of USD bonds in PT Japfa Tbk, which has no tax implication, we have not made an estimate of the tax impact on foreign exchange gains/losses.
REVENUE
EBITDA1
OPERATING PROFIT
PATMI
OPERATING PROFIT MARGIN
CORE PATMI W/O FOREX2
US$3.0b
US$423.3m
US$311.4m
US$118.8m
10.3%
US$130.2m
PROFITABILITY FOR FY2016 IMPROVED YEAR-ON-YEAR, ACROSS THE BOARD, DRIVEN BY BETTER MARKET CONDITIONS,
DIVERSIFICATION STRATEGY AND HIGHER EFFICIENCIES
Animal feed business continues to be one of our core stable strengths
Stable price environment for
poultry in Indonesia
Improvements to cost structure in Vietnam swine
fattening operations
Improvement in milk volumes and
yields helped offset lower milk prices
2.5ppt
47.6%
43.7%
83.6%
8.8%
42.3%
24

JAPFA LTD | Annual Report 2016
25
REVENUE (US$M)
2,787.13,032.9+8.8%
YoY
FY2015 FY2016
OPERATING PROFIT (US$M)
216.6
311.4+43.7%YoY
FY2015 FY2016
EBITDA (US$M)
297.5
423.3+42.3%YoY
FY2015 FY2016
PROFIT AFTER TAX (US$M)
91.8
197.7+115.5%YoY
FY2015 FY2016
CORE PATMI W/O FOREX (US$M)
88.3
130.2+47.6%YoY
FY2015 FY2016
EARNINGS PER SHARE (US$M)
3.67
6.73+83.4%YoY
FY2015 FY2016

26
Annual Report 2016 | JAPFA LTD
Operating and Financial ReviewGROUP OVERVIEW
Diversification Strategy Bears FruitIn FY2016, the Group registered a broad based improvement in profits, driven by better market conditions and its continued focus on higher operational efficiencies. The Group’s diversified business strategy was reflected in the balanced contribution from its three core pillars of PT Japfa Tbk, Animal Protein Other and Dairy.
On a topline basis, the Group’s consolidated revenue increased 8.8% year-on-year to US$3.0 billion, mainly underpinned by the strong volume growth in PT Japfa Tbk, Animal Protein Other and Dairy segments.
The Group also recorded year-on-year improvement in profits across all three core pillars. In its animal protein business, feed operations continue to provide stable profits across all geographical markets. In addition, the stable poultry selling
prices in Indonesia throughout FY2016 resulted in a strong increase in profits from PT Japfa Tbk, compared to the weaker selling price environment in FY2015.
As a result, operating profit grew by a healthy 43.7% to US$311.4 million, while EBITDA increased 42.3% to US$423.3 million in FY2016.
During the year, there was an extraordinary gain of US$3.5 million arising from the sale of Riveren and Inverway cattle station properties in Australia, an extraordinary gain of US$0.6 million from the buyback of USD bonds, as well as a profit of US$13.7 million from the sale of the cattle herd at the Riveren and Inverway cattle stations.
Profit attributable to Owners of the Parent, Net of Tax (“PATMI”), which includes foreign exchange and biological asset valuation losses,
grew 83.6% to US$118.8 million in FY2016, mainly due to broad based improvements across the three core pillars.
In terms of profits attributable to the Group, the management believes that Core PATMI, which excludes the fair value changes of biological assets and derivatives as well as extraordinary items, is an important measure of income attributable to shareholders, while Core PATMI w/o Forex is a reflection of the Group’s operating performance.
During the year, the Group recorded a 96.2% growth in Core PATMI from US$63.7 million in FY2015 to US$125.0 million in FY2016. After removing the effects of foreign exchange, the Group’s Core PATMI w/o Forex grew by 47.6% from US$88.3 million in FY2015 to US$130.2 million in FY2016.

27
JAPFA LTD | Annual Report 2016
Looking AheadAs part of Japfa’s long-term growth strategies, the Group continued to build up its core competencies through strategic alliances. In August 2016, a global investment firm KKR invested US$81.9 million in PT Japfa Tbk, which strengthened the Group’s balance sheet and enabled Japfa to leverage on KKR’s experience and network.
In September 2016, the Group’s wholly-owned Indonesian subsidiary, PT So Good Food, formed a joint venture with Cargill to establish a 40-60 joint venture entity, PT Cahaya Gunung Foods, to produce and supply fully-cooked poultry products in Indonesia. Besides enhancing the depth and breadth of Japfa’s consumer food processing capacities, the strategic partnership also enabled Japfa to widen its product range to tap on the growing consumer food market in Indonesia.
On 23 February 2017, PT Cahaya Gunung Foods announced that it
has started supplying to McDonald’s Indonesia with chicken products, including Chicken McNuggets, McChicken, McSpicy amongst others across its restaurants in Indonesia. In February 2017, the Japanese Government approved four processed chicken business units from Indonesia to export processed chicken, including nuggets and karaage to Japan. PT So Good Food’s processing plant in Cikupa is amongst the four plants to receive the export approval. In addition, PT Cahaya Gunung Foods’ processing plant in Boyolali has also been assessed by a team from Japan and final approval is expected in 2017.
In early 2016, Indonesia’s Business Competition Supervisory Commission (“KPPU”) issued a guilty verdict on 32 beef companies, including two subsidiaries of PT Japfa Tbk, of cartel and production arrangements. In the third quarter of 2016, the KPPU also issued a guilty verdict in its case against PT Japfa Tbk and 11 poultry companies in relation to
the culling programme of 6 million parent stock. However, both cases are not expected to have a material financial effect on the Group.
Despite the macroeconomic challenges which softened consumption in some of the emerging Asian markets in FY2016, the Group’s fundamentals has remained strong and its three core pillars have delivered a strong set of financial results which bear testimony to its successful growth strategies.
While the Group’s performance will continue to be impacted by the macroeconomic environment and currency fluctuations of the countries it operates in, as well as the market environment of the animal protein industries and fluctuations in raw material costs and selling prices, the Group remains confident that its core competencies and focus on operational efficiencies will sustain its business into the future.

28
Annual Report 2016 | JAPFA LTD
Revenue1
51% Japfa Ltd12% KKR 37% Public
9.4% YoY
124.4% YoY
5.2% YoY
22.1% YoY
9.8% YoY
20.1% YoY
7.4% YoY
35.3% YoY
100% Japfa Ltd 100% Japfa Ltd62% Japfa Ltd38% Blackriver
Operating Profit1
Core PATMI w/o Forex1,2
ATTRIBUTABLE INCOME TO JAPFA LTD
GROUP FINANCIALS ON CONSOLIDATED BASIS
US$2.0b
67%
PT JAPFA TBK ANIMAL PROTEIN OTHER DAIRY CONSUMER FOOD
REVENUE
CORE PATMI W/O FOREX
US$216.7m
70%
US$77.4m
59%
US$26.7m
20%
US$3.0m
1%
US$200.0m
7%US$284.9m
9%
US$562.0m
19% US$51.4m
17%
US$42.5m
14%
US$36.7m
28%
1 The Revenue, Operating Profit and Core PATMI w/o Forex exclude the central purchasing subsidiary, headquarter costs and elimination adjustments between segments.
2 Core PATMI w/o Forex excludes US$5.0 million loss in Consumer Food segment.
Note: All shareholding percentages shown above are approximate only.
BREAKDOWN BY BUSINESS SEGMENTS
Operating and Financial Review

JAPFA LTD | Annual Report 2016
(US$m) FY2015 FY2016 % change
Revenue 2,787.1 3,032.9 +8.8%
Operating profit 216.6 311.4 +43.7%
Operating profit margin 7.8% 10.3% +2.5 ppt
EBITDA2 297.5 423.3 +42.3%
PAT 91.8 197.7 +115.5%
PATMI 64.7 118.8 +83.6%
Core PATMI w/o Forex 88.3 130.2 +47.6%
(US$m) FY2015 FY2016 % change
Revenue3 1,854.6 2,028.6 +9.4%
Operating profit 126.4 216.7 +71.4%
Operating profit margin 6.8% 10.7% +3.9ppt
EBITDA2 179.9 288.2 +60.2%
PAT 36.0 154.1 +327.5%
PATMI 18.4 81.1 +340.5%
Core PATMI w/o Forex 34.5 77.4 +124.4%
(US$m) FY2015 FY2016 % change
Revenue3 534.1 562.0 +5.2%
Operating profit 35.8 42.5 +18.6%
Operating profit margin 6.7% 7.6% +0.9ppt
EBITDA2 42.5 49.8 +17.1%
PAT 30.8 37.2 +20.8%
PATMI 30.0 36.8 +22.6%
Core PATMI w/o Forex 30.1 36.7 +22.1%
(US$m) FY2015 FY2016 % change
Revenue4 259.4 284.9 +9.8%
Operating profit 45.1 51.4 +13.9%
Operating profit margin 17.4% 18.0% +0.6ppt
EBITDA2 60.7 74.4 +22.6%
PAT 22.7 15.0 -33.6%
PATMI 13.9 9.5 -31.9%
Core PATMI w/o Forex 22.2 26.7 +20.1%
(US$m) FY2015 FY2016 % change
Revenue5 186.3 200.0 +7.4%
Operating profit 4.3 3.0 -31.2%
Operating profit margin 2.3% 1.5% -0.8ppt
EBITDA2 8.8 9.4 +7.5%
PAT -2.4 -6.0 -151.1%
PATMI -2.4 -6.0 -151.1%
Core PATMI w/o Forex -3.7 -5.0 -35.3%
GROUP1
SEGMENTAL
JA
PFA
LT
DP
T J
AP
FA T
BK
AN
IMA
L P
RO
TE
IN O
TH
ER
DA
IRY
CO
NS
UM
ER
FO
OD
1 The Group’s financials shown above comprises all business segments (PT Japfa Tbk, Animal Protein Other, Dairy and Consumer Food) plus central purchasing subsidiary, headquarter costs and elimination adjustments between segments.
2 We define EBITDA as profit before tax from continuing operations, excluding interest income, changes in fair value of biological assets and marketable securities, foreign exchange adjustments gains/(losses), finance costs, depreciation of property, plant and equipment, depreciation of investment properties and amortisation of intangible assets.
3 The combined revenue for PT Japfa Tbk and Animal Protein Other includes inter-segment revenue of US$42.0 million in FY2016 (FY2015: US$40.1 million).4 The Dairy segment revenue includes inter-segment revenue of US$2.3 million in FY2016 (FY2015: US$2.0 million).5 The Consumer Food segment revenue includes inter-segment revenue of US$1.3 million in FY2016 (FY2015: US$5.2 million).
29

30
Annual Report 2016 | JAPFA LTD
Operating and Financial ReviewPT JAPFA TBK
In Indonesia, the Group carries out its animal protein operations through its IDX-listed subsidiary, PT Japfa Tbk, which is one of the market leaders in producing premium animal feed and multiple animal protein staples, namely, poultry, beef and aquaculture.
During the year in review, revenue for PT Japfa Tbk grew by 9.4% from US$1.9 billion in FY2015 to US$2.0 billion in FY2016, mainly driven by higher Feed and DOC sales volumes.
In addition, PT Japfa Tbk’s animal feed operations continued to be the stable pillar of profitability, and feed margins improved due to lower material costs during the year. PT Japfa Tbk also benefited from the stable poultry prices throughout FY2016 which led to improved breeding margins, whereas in the previous financial year ended 31 December 2015, poultry prices only recovered in the second half of 2015. In addition, commercial farming sales volumes and margins remained stable in FY2016.
Overall, FY2016 was one of the strongest years of revenue and profitability for PT Japfa Tbk since it commenced its poultry operations in Indonesia over 40 years ago. In terms of operating profit, PT Japfa Tbk generated a robust 71.4% growth to US$216.7 million in FY2016, while
EBITDA rose 60.2% to US$288.2 million. With the all-round improved performance for PT Japfa Tbk’s business units, this core pillar’s contribution to the Group’s Core PATMI w/o Forex jumped 124.4% to US$77.4 million in FY2016.
SEGMENTAL PROFITABILITY OVERVIEW
FY2016
250
200
150
100
50
0
10
5
0
US$m %FY2015
6.8%
10.7%
Operating Profit Profit After Tax
Operating Profit Margin
216.7
36.0
154.1
126.4

31
JAPFA LTD | Annual Report 2016
ANIMAL PROTEIN OTHER
The Group has replicated its large-scale, industrialised animal protein operations in key emerging Asian markets. It currently produces high-quality protein staples in Vietnam (poultry and swine), Myanmar (poultry), India (poultry) and China (beef), which are collectively reported under its Animal Protein Other segment.
The Animal Protein Other operations constitute a key part of the Group’s diversification strategy to ensure long term sustainable earnings, and is one of the Group’s core pillars. Over the past four years, profitability of this segment has been strengthening, with strong contributions from the operations in Vietnam and Myanmar.
For FY2016, Animal Protein Other achieved a 5.2% increase in revenue to US$562.0 million and overall profitability improved year-on-year, mainly due to contributions by Vietnam and Myanmar. This core pillar’s operating profit grew 18.6% to US$42.5 million, while its contribution to the Group’s Core PATMI w/o Forex grew 22.1% to US$36.7 million in FY2016.
SEGMENTAL PROFITABILITY OVERVIEW
FY2016
45
40
35
30
25
20
15
10
5
0
8
6
4
2
0
US$m %FY2015
6.7%
7.6%
Operating Profit Profit After Tax
Operating Profit Margin
42.5
30.8
37.235.8
Overall, revenue and operating profit grew across all geographies, due to higher sales volumes, with Vietnam contributing more than 60% of this segment’s revenue, and about 70% of operating profit. On a year-on-year basis, poultry feed volumes increased by 8% in Vietnam and 18% in Myanmar, while swine feed increased by 16% and swine fattening increased by 23% in Vietnam in FY2016.
Despite the higher sales volumes, revenue only grew 5.2% due to lower average selling price (“ASP”) in Vietnam for poultry feed, swine feed and swine fattening operations, as well as lower revenue recorded in USD terms by Myanmar and India due to the depreciation of respective currencies against the USD.

32
Annual Report 2016 | JAPFA LTD
The strong performance by Vietnam’s operations was in part due to the growth of its swine business. Replicating the success model of the poultry business, the Group entered the swine market in Vietnam in FY2013, and successfully built up the swine business in the past three years.
During the year, Myanmar operations registered a growth in sales volumes for feed, DOCs and broilers. On 16 October 2016, the Group officially launched its second feedmill in Myanmar to tap on the growing poultry consumption in Myanmar. Sited in the Mandalay Myotha Industrial Zone, the modern and highly-efficient will produce high-quality animal
feed for third party farmers in the Mandalay region.
In India, the consumer demand for chicken has declined due to the demonetization of the Indian Rupee in November 2016, which has resulted in lower poultry sales volumes. The focus continues to be on feed operations which consistently delivers profits.
Operating and Financial ReviewANIMAL PROTEIN OTHER (CONT’D)
ANIMAL PROTEIN – OPERATIONAL PERFORMANCE
ANIMAL FEED – POULTRY
DOC – BROILER COMMERCIAL FARM – LIVE BIRDS
FY2016 FY2016
FY2016
4,000
3,500
3,000
2,500
2,000
1,500
1,000
500
0
800
700
600
500
400
300
200
100
0
800
700
600
500
400
300
200
100
0
(‘000 tons)
(mil birds) (‘000 tons)
FY2015
FY2015 FY2015
PT Japfa Tbk Japfa Vietnam Japfa Myanmar Japfa India
3,301
617 669662 679
3,477
SALES VOLUME
SALES VOLUME SALES VOLUME

33
JAPFA LTD | Annual Report 2016
BEEF – LIVE CATTLE
SWINE FATTENING
AQUACULTURE – AQUA-FEED
ANIMAL FEED – SWINE
FY2016
FY2016
FY2016
FY2016
40
30
20
10
0
50454035302520151050
250
200
150
100
50
0
400
350
300
250
200
150
100
50
0
(‘000 tons)
(‘000 tons)
(‘000 tons)
(‘000 tons)
FY2015
FY2015
FY2015
FY2015
PT Japfa Tbk
Japfa Vietnam
PT Japfa Tbk
Japfa Vietnam
37
37
212
319
311
46
224
370
1 Excludes sale of beef cattle in Australia.
SALES VOLUME SALES VOLUME
SALES VOLUMESALES VOLUME

34
Annual Report 2016 | JAPFA LTD
Operating and Financial ReviewDAIRY
The Group is a leading, industrialised producer of premium raw milk in Indonesia and China, which are of high quality in terms of nutritional and safety standards. In China, the Group sells its raw milk to leading milk producers further downstream, while in Indonesia, the Group operates a vertically integrated dairy business which produces raw milk for its own downstream Greenfields dairy products that are distributed to countries in South East Asia (“SEA”).
In FY2016, the continuing pressure on raw milk prices which declined by 9% was compensated by the Group’s improvement in milk yield and higher sales volumes, as it continued to expand strategically in China with the completion in the construction of Farm 7 in 4Q2016. Farm 7 started milking in November 2016 and is expected to be fully milking by the end of FY2017.
For the full year, revenue grew mainly due to the increase in raw milk sales volumes in China. Milkable cows in China increased by 27% to a population of 38,420 heads, as Farm 6 started milking in January 2016 and was fully milking in November 2016.
In China, milk yields improved from 36.1Kg/head/day to 37.0 Kg/head/day, while in Indonesia, the Group’s continuing push for greater efficiencies in dairy operations saw milk yields improve from 30.1 kg/head/day to 30.9 kg/head/day.
As a result of the growth in sales volumes, coupled with the improved operating margin of 18.0%, operating profit improved by 13.9% year-on-year to US$51.4 million in FY2016.
Profit after tax dropped 33.6% year-on-year from US$22.7 million to US$15.0 million, primarily due to higher bio-asset fair value loss of US$21.1 million in FY2016, compared to a lower bio-asset fair value loss of US$8.2 million in FY2015.
Despite the raw milk price pressures in China, this core pillar’s contribution to the Group’s Core PATMI w/o Forex grew 20.1% to US$26.7 million in FY2016.
SEGMENTAL PROFITABILITY OVERVIEW
FY2016
60
50
40
30
20
10
0
25
20
15
10
0
US$m %FY2015
17.4%
18.0%
Operating Profit Profit After Tax
Operating Profit Margin
51.4
22.7
15.0
45.1

35
JAPFA LTD | Annual Report 2016
CHINA RAW MILK
AVERAGE DAILY MILKING – CHINA AVERAGE DAILY MILKING – SE ASIA
SE ASIA EXTENDED SHELF LIFE BRANDED MILK
MILKABLE COWS – CHINA
MILKABLE COWS – SE ASIA
FY2016
FY2016
FY2016
FY2016
FY2016
FY2016
400
350
300
250
200
150
100
50
0
40
35
30
25
20
15
10
5
0
25
20
15
10
5
0
40,000
35,000
30,000
25,000
20,000
15,000
10,000
5,000
0
35
30
25
20
15
10
5
0
5,0004,5004,0003,5003,0002,5002,0001,5001,000
5000
(mil kg)
(kg/head/day) (kg/head/day)
(mil litres)
(heads)
(heads)
FY2015
FY2015
FY2015
FY2015
FY2015
FY2015
China
China
SE Asia
SE Asia
Milking Cows Dry Cows
Milking Cows Dry Cows
295
36
21
30,301
30
4,158
373
37
24
38,420
31
4,553
1 Number of milkable cows as at end of financial year.
SALES VOLUME HEADS1
HEADS1SALES VOLUME

36
Annual Report 2016 | JAPFA LTD
Operating and Financial ReviewCONSUMER FOOD
The Group uses some of its animal protein products that it produces in-house as raw materials for its own downstream Consumer Food segment. These ambient temperature and chilled/frozen food products made from chicken, beef and seafood are subsequently sold in Indonesia and Vietnam markets.
In recent years, the Group’s consumer food products, marketed under the So Good, So Good Sozzis and So Nice
brands have become leading brands in Indonesia for premium processed meats, and the Group currently has a strong market share in frozen consumer food and ambient temperature food in Indonesia.
The Group’s Consumer Food segment’s revenue was up 7.4% to US$200.0 million in FY2016, due to higher sales volumes of frozen products and Real Good milk in Indonesia which increased by 23% and 19%, respectively.
While the Consumer Food operations in Indonesia continued to be profitable, there was operating losses incurred in Vietnam as this business unit ramps up its operations in the country. Nonetheless, this business segment continued to deliver positive EBITDA which increased by 7.5% year-on-year to US$9.4 million in FY2016.
Operating Profit Profit After Tax
Operating Profit Margin
SEGMENTAL PROFITABILITY OVERVIEW
FY2016
543210
-1-2-3-4-5-6
543210-1-2-3-4-5-6
US$m %FY2015
2.3%
1.5%
3.0
-2.4
-6.0
4.3

37
JAPFA LTD | Annual Report 2016
Balance SheetAs at 31 December 2016, the Group’s total assets increased by US$312.6 million to US$2,525.2 million, primary due to the increase in cash and cash equivalents and property, plant and equipment.
The Group’s total liabilities as at 31 December 2016 increased to US$1,435.9 million, as compared to US$1,384.9 million a year ago, primarily due to the increase in trade and other payables.
In August 2016, KKR’s US$81.9 million-investment in PT Japfa Tbk was completed through a private placement in PT Japfa Tbk for US$53.4 million and a purchase of PT Japfa Tbk shares from Japfa Ltd for US$28.5 million. Following this transaction,
FROZEN PRODUCTS AMBIENT PRODUCTS
FY2016 FY2016
10,0009,0008,0007,0006,0005,0004,0003,0002,0001,000
0
40,000
30,000
20,000
10,000
0
(tons) (tons)
FY2015 FY2015
Frozen Products Ambient Products
7,221
38,4618,853 36,374
OTHER FINANCIAL INFORMATION
the Group recorded a capital reserve of US$18.4 million as a result of a reduction in its ownership in PT Japfa Tbk from 58.7% to 51.0%.
Group shareholders’ funds increased to US$791.7 million as at 31 December 2016, from US$670.5 million as at 31 December 2015. The total equity of the Group rose in tandem from US$827.7 million to US$1.0 billion in the same period.
Cash Flow and LiquidityCash flows from operating activities were US$362.9 million in FY2016, as compared to US$256.6 million in FY2015, which mainly arose from operating cash flows before changes in working capital of US$432.2 million, changes in working capital of US$28.5 million and income tax paid of US$40.8 million.
Net cash flows used in investing activities was US$175.2 million in FY2016, as compared to US$188.3 million in FY2015, mainly represented by the purchase of property, plant and equipment of US$168.4 million.
Net cash flows from financing activities were US$3.0 million in FY2016, mainly represented by proceeds from issuance of shares to non-controlling interests by subsidiaries of US$60.0 million, proceeds from disposal of shares in subsidiary to non-controlling interests of US$30.0 million, proceeds from issued bonds of US$73.7 million and drawing of new bank loans of US$80.3 million, which was partially offset by interest paid of US$60.0 million, dividend paid of US$17.5 million, buyback of bonds payable of US$5.3 million and repayment of loans and borrowings of US$154.6 million.
BALANCE SHEET (US$M) FY2015 FY2016 % CHANGE
Total Assets 2,212.6 2,525.1 +14.1%
Cash 147.9 336.1 +127.2%
Inventory 609.4 611.9 +0.4%
Total Liabilities 1,384.9 1,435.9 +3.5%
Debt 840.3 839.8 -0.1%
Total Equity 827.7 1,089.2 +31.0%
Net Debt / Equity Ratio (x) 0.8 0.5
Inventory Turnover Days 97.3 93.0
BALANCE SHEET (US$M) FY2015 FY2016
Net Cash Flows from Operating Activities 256.6 362.9
Net Cash Flows used in Investing Activities (188.3) (175.2)
Net Cash Flows (used in)/from Financing Activities (203.3) 3.0
Net (Decrease)/Increase in Cash and Cash Equivalents (135.0) 190.7
SALES VOLUME SALES VOLUME

38
Annual Report 2016 | JAPFA LTD
At Japfa, we wish to continuously grow and evolve with the community to create harmonious relationships that benefit and
meet the expectations of our stakeholders.

39
JAPFA LTD | Annual Report 2016
Continuously grow and evolve with the
community to create harmonious relationships
Committed to Good Corporate Governance
and continually implement initiatives
and frameworks across various business
functions
SUSTAINABLE DEVELOPMENT
CORPORATE DEVELOPMENT

40
Annual Report 2016 | JAPFA LTD
Sustainability and Responsibility
At Japfa, we wish to continuously grow and evolve with the community to create harmonious relationships that benefit and meet the expectations of our stakeholders, namely, customers, business partners, governments, shareholders, employees and the community.
We believe that a balanced approach between economic performance, environmental performance and social performance will support our role in bringing about sustainable development that meets the needs of the present generation without prejudicing the interests of future generations.
SUSTAINABLE DEVELOPMENT
THIS SECTION DESCRIBES THE GROUP’S
CONTRIBUTIONS TO RESPONSIBLE AND
SUSTAINABLE DEVELOPMENT THROUGH
ITS BUSINESS, ECONOMIC, SOCIAL AND
ENVIRONMENTAL PERFORMANCE. [G4-30]
It also contains certain Standard Disclosures from the
Global Reporting Initiative (“GRI”)’s Sustainability Reporting
Guidelines G4 Core criteria, as well as the Group’s
sustainability performance and efforts during 2016. The codes
in square brackets refer to the appropriate section of the GRI’s
Reporting Principles and Standard Disclosures guidance.

41
JAPFA LTD | Annual Report 2016
CORPORATEGOVERNANCE
In addition, we fulfil our commitment by carrying out Corporate Social Responsibility (“CSR”) programmes, by putting aside part of our profits for the benefit of human development and the environment in a sustainable, proper and professional manner.
In line with Japfa’s ethos of “Growing Towards Mutual Prosperity”, we have long standing programmes that are aligned and implemented to support our business continuity with the following commitments:
1. Responsibility for labour practices, including occupational health and safety, gender equality, and employment opportunities
2. Responsibility for quality products3. Responsibility for social, public
and the surrounding community development
4. Responsibility for the environment
The programmes described in this section mainly refer to the programmes carried out by PT Japfa Tbk in Indonesia, where most of our operations are located and where we employ the most number of staff. We intend to roll out various programmes for our offices in other countries progressively.
Japfa is committed to Good Corporate Governance (“GCG”) and the Group’s GCG initiatives and frameworks have been implemented across various business functions, from recruitment, internal control systems and risk management to performance evaluation and rewards. In addition, we continually work to improve our efforts in the management and
monitoring of our business and operations, so that they are as environmentally friendly as possible.
We have also listed out, in the Corporate Governance section of this annual report, Japfa’s corporate governance framework, with specific reference to the principles and guidelines of the revised Code of Corporate Governance 2012 (“2012 Code”) issued by the Monetary Authority of Singapore on 2 May 2012. Japfa has complied in all material aspects with the main principles and supporting guidelines of the 2012 Code, and will regularly review its governance policies and practices to track developments in best practices and regulations.
Commitment to the Prevention of CorruptionThe prevention of corruption is one of Japfa’s most important GCG commitments. Japfa undertakes every effort to eradicate corruption and criminal misconduct and works continually to improve our employees’ understanding of our anticorruption position and tools. To measure the effectiveness of our anti-corruption programmes, Japfa has established Internal Control mechanisms across our business units and headquarters, tested by our Internal Audit Unit. [G4-SO4]
In addition, we have adopted a Whistle-blowing System (“WBS”), which is a vehicle for employees, customers, vendors, and other parties to report allegations and incidents related to fraud, crimes or violations of Company Regulations and Codes. We have also implemented the Japfa Alert System, which covers Internal Control Procedures and Principles, Accounting and Finance Principles and Anti-Corruption Regulations. This is accessible by our employees
through the website www.japfalert.com and regular emails.
In the enforcement of employee discipline, we take firm actions against perpetrators of regulatory violations by imposing appropriate sanctions. If any employee is found to be involved in a criminal matter, they will be surrendered to law enforcement officers. [G4-SO8]
Application of Prevention and Prudence Principle [G4-14]Our prevention and prudence principle is reflected in our attention to environmental sustainability issues and risk management. Japfa aims to monitor, manage and mitigate risks that may adversely affect us while taking calculated risks to take advantage of growth opportunities.
During the normal course of business, we are exposed to various types of risks, including currency risk, interest rate risk, credit risk, liquidity risk and commodity price risk, among others. Our risk management strategy aims to minimise the potential adverse effects on our financial performance.
STAKEHOLDER MANAGEMENT [G4-26]
Japfa’s operational activities are wide-ranging as we need to interact with a large number of diverse stakeholders. We approach stakeholder management on the basis of transparent, accurate and timely communications and disclosures.
We nurture our relationships with internal and external stakeholders to ensure that we are constantly aware of their expectations and interests.

42
Annual Report 2016 | JAPFA LTD
Sustainability and Responsibility
Where possible, we make efforts to align our work programme with the needs and dynamics of interested parties.
Investor RelationsAs a listed company, we are a firm believer of regular engagement with all our stakeholders, including our shareholders, the investment community and members of the media.
The Investor Relations (“IR”) team for the Group, led by our CEO, believes in having effective and regular communication with all our stakeholders, and remains committed to making timely and accurate disclosure to the market.
Supply Chain [G4-12]As a reputable, public-listed company,
committed to social responsibility and sustainability, Japfa takes supply chain management seriously. We are always careful when selecting suppliers, ensuring that no regulations are violated. [G4-EN32]
ManpowerJapfa strives to comply with all applicable laws and regulations pertaining to its manpower requirements. We are committed to gender equality, job training for employee professionalism enhancement and a commensurate reward system. Japfa provides fair and equal treatment in competency improvement and development to all employees. There is no gender difference in employment, and all employees have the same right to develop their career in Japfa.
PRESERVING THE ENVIRONMENT
Environmental ManagementAs an industrialised agri-food company, Japfa observes prevailing environmental provisions. A cornerstone of our approach is the implementation of an ISO 14001 compliant Environmental Management System (“EMS”) in selected Business Units.
Developed by the International Organisation for Standardization (“ISO”), the ISO 14000 family of standards provides practical tools for companies and organisations looking to manage their environmental responsibilities. Our EMS provides the guidelines to ensure that our company remains environmentally friendly.
Commitment to Environmental ProtectionOur commitment to environmental protection is demonstrated through PT Japfa Tbk’s ”JAPFA Go Green” programme, which was first launched in Indonesia in 2013. Through this programme, PT Japfa Tbk manages waste, uses manure separators to minimise unused waste, manages biogas and distributes it to communities in need.
To monitor PT Japfa Tbk’s environmental management performance, i t periodically participates in Indonesia’s Programme for Pollution Control, Evaluation, and Rating (“PROPER”), a national-level public environmental reporting initiative led by Indonesia’s Ministry of the Environment.

43
JAPFA LTD | Annual Report 2016
Sources and Uses of Water [G4-EN8] [G4-EN9]In addition to water used in our production processes, water is also used for production supporting activit ies and by our business operation facilities. Japfa uses both groundwater and surface water, and has a clear policy to use water in an efficient and controlled manner. This policy is applied for the use of water in production activities and also for other operational needs.
Japfa also pays attention to the disposal of water from the production processes, especially in the slaughterhouse business units, by using a Wastewater Treatment Plant (“WWTP”) System in Indonesia that every month controls water disposal to meet quality standards.
Maintaining Regulatory ComplianceTo comply with the applicable regulations, Japfa always strives to meet license requirements in every activity, for example, the recommendations for Environmental Management Effort (“UKL”) and Environmental Monitoring Effort (“UPL”) in Indonesia.
In 2016, PT Japfa Tbk received the PROPER Blue (Compliance with Regulation) award for 12 of its business units and the PROPER Green (Beyond Compliance) award for four of its business units. These awards are testament to Japfa’s commitment, effort and dedication in maintaining high standards of regulatory compliance and environmental sustainability at our business sites.
PROMOTING GENERAL WELFARE
Promoting General Welfare [SO1]Japfa makes strong efforts to promote the welfare of our staff, as well as of the residents of the communities in which we operate. We believe that human welfare is critically dependent on establishing positive and healthy lifestyles from a young age. Hence, we pay great attention to children’s education and nutritional development.
Promoting Education and Improve Children’s HealthIn 2015, PT Japfa Tbk, through the JAPFA Foundation, started a school development programme for three elementary schools and one pesantren (Islamic boarding school) in four different provinces in Indonesia. This programme focused on the development of school management capacities, building on the physical school renovations carried out by corporations after the earthquake and tsunami disasters over the last decade.
Since 2008, PT Japfa Tbk has developed its JAPFA4Kids programme, which focuses on nutrition and health
campaigns for elementary school students throughout Indonesia. By 2016, JAPFA4Kids activities had reached 632 primary schools, involving 111,942 students and 7,166 teachers from 20 provinces in Indonesia.
In 2016, PT Japfa Tbk undertook an Education Financial Aid and Scholarship programme, which awarded a total of Rp398.9 million in terms of education funds to 149 outstanding students with financial constraints. This comprises 50 students who received JAPFA4Kids Scholarships and 99 students who received Internal Education Assistance program (BPI) Scholarships.
Social Investment and Other Social Contributions Established in July 2015, the JAPFA Foundation has a vision to maximise youth potential through Education, Nutrition and Sports. In pursuing its vision, the Foundation has developed strategic and measurable programmes designed to achieve maximum results.
Fulfilling its motto of “Growing Towards Mutual Prosperity”, the JAPFA Foundation aims to ensure that Japfa’s growth is in line with the economic growth of the surrounding communities. It focuses on the
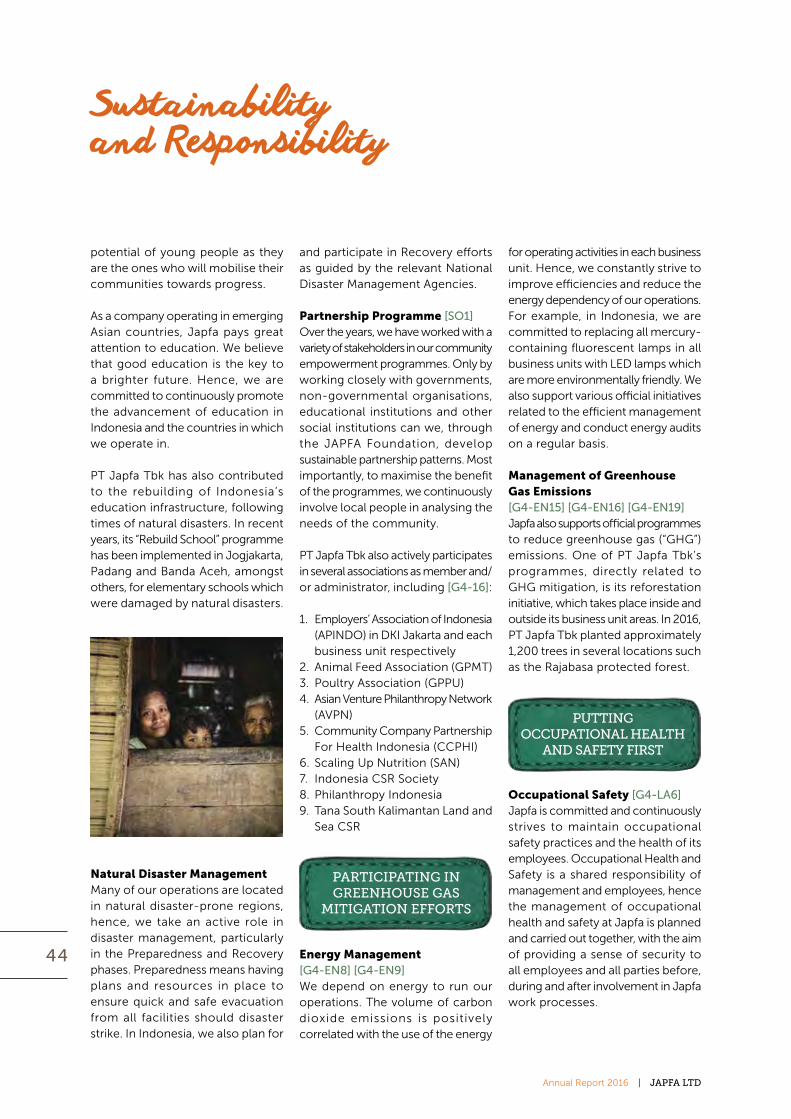
44
Annual Report 2016 | JAPFA LTD
potential of young people as they are the ones who will mobilise their communities towards progress.
As a company operating in emerging Asian countries, Japfa pays great attention to education. We believe that good education is the key to a brighter future. Hence, we are committed to continuously promote the advancement of education in Indonesia and the countries in which we operate in.
PT Japfa Tbk has also contributed to the rebuilding of Indonesia’s education infrastructure, following times of natural disasters. In recent years, its “Rebuild School” programme has been implemented in Jogjakarta, Padang and Banda Aceh, amongst others, for elementary schools which were damaged by natural disasters.
Sustainability and Responsibility
Natural Disaster ManagementMany of our operations are located in natural disaster-prone regions, hence, we take an active role in disaster management, particularly in the Preparedness and Recovery phases. Preparedness means having plans and resources in place to ensure quick and safe evacuation from all facilities should disaster strike. In Indonesia, we also plan for
and participate in Recovery efforts as guided by the relevant National Disaster Management Agencies.
Partnership Programme [SO1]Over the years, we have worked with a variety of stakeholders in our community empowerment programmes. Only by working closely with governments, non-governmental organisations, educational institutions and other social institutions can we, through the JAPFA Foundation, develop sustainable partnership patterns. Most importantly, to maximise the benefit of the programmes, we continuously involve local people in analysing the needs of the community.
PT Japfa Tbk also actively participates in several associations as member and/or administrator, including [G4-16]:
1. Employers’ Association of Indonesia (APINDO) in DKI Jakarta and each business unit respectively
2. Animal Feed Association (GPMT) 3. Poultry Association (GPPU) 4. Asian Venture Philanthropy Network
(AVPN) 5. Community Company Partnership
For Health Indonesia (CCPHI) 6. Scaling Up Nutrition (SAN) 7. Indonesia CSR Society8. Philanthropy Indonesia9. Tana South Kalimantan Land and
Sea CSR
PARTICIPATING IN GREENHOUSE GAS
MITIGATION EFFORTS
Energy Management [G4-EN8] [G4-EN9]We depend on energy to run our operations. The volume of carbon dioxide emissions is positively correlated with the use of the energy
for operating activities in each business unit. Hence, we constantly strive to improve efficiencies and reduce the energy dependency of our operations. For example, in Indonesia, we are committed to replacing all mercury-containing fluorescent lamps in all business units with LED lamps which are more environmentally friendly. We also support various official initiatives related to the efficient management of energy and conduct energy audits on a regular basis.
Management of Greenhouse Gas Emissions [G4-EN15] [G4-EN16] [G4-EN19]Japfa also supports official programmes to reduce greenhouse gas (“GHG”) emissions. One of PT Japfa Tbk’s programmes, directly related to GHG mitigation, is its reforestation initiative, which takes place inside and outside its business unit areas. In 2016, PT Japfa Tbk planted approximately 1,200 trees in several locations such as the Rajabasa protected forest.
PUTTING OCCUPATIONAL HEALTH
AND SAFETY FIRST
Occupational Safety [G4-LA6]Japfa is committed and continuously strives to maintain occupational safety practices and the health of its employees. Occupational Health and Safety is a shared responsibility of management and employees, hence the management of occupational health and safety at Japfa is planned and carried out together, with the aim of providing a sense of security to all employees and all parties before, during and after involvement in Japfa work processes.

45
JAPFA LTD | Annual Report 2016
Occupational Health [G4-LA7]Regarding the occupational health aspect, we have in place a policy to prevent occupational diseases and continue to keep our employees and their families healthy. We have adopted some measures in the prevention of diseases through promotional and preventive programmes, such as health counselling, mothers and children health programmes and community health service centres. Japfa makes efforts in employee healthcare, for instance, by registering its employees in Indonesia in Employment and Health Insurance Programmes, in accordance with the legislation in force, providing maternity allowances and employee healthcare and treatment.
SUSTAINABLE ECONOMIC GROWTH
[G4-EC1]
Japfa benefits from large economies of scale that enable integrated and extensive production and marketing coverage. In terms of national economic development, Japfa has taken a role and contributed directly to the people in the countries it operates in, especially in providing animal protein staples, encouraging entrepreneurship, improving partnerships with farmers, creating jobs and paying taxes.
The Group currently has more than 32,000 employees across its network of industrialised farms, with a large proportion in Indonesia. PT Japfa Tbk has entered into strategic partnerships with farmers, providing employment opportunities for many more beyond its own farms. Our relationships with breeder partners often form the basis for our local
community economic development programmes. With these programmes, local farmers also contribute to the economic growth of their regions through the provision of food protein, job creation and local tax contributions. [G4-EC8]
PRIORITISING CUSTOMERS
Delivering Best Services to CustomersCustomer satisfaction is a fundamental and important aspect of Japfa’s core values, and we aim to achieve this by simply providing the best service to customers. We do this in three ways: by building partnerships with customers, by being responsive in handling complaints, and by enhancing our human resources’ competencies. PT Japfa Tbk has implemented a complaints mechanism for its products, whereby questions, feedback, criticism and requests for information can be directly made through written requests to PT Japfa Tbk’s Head Office.
Maintaining Product Quality [PR3]In an effort to maintain the quality of our products, we implement quality and standardised production processes. Currently, several divisions within PT Japfa Tbk have passed an audit process conducted by the Certification Agency of TUV Rheinland and SAI Global, as well as obtained ISO 9001: 2008 certification.
Some of PT Japfa Tbk’s divisions have also obtained the Certificate of Good Fish Hatchery (CPIB). This certificate is issued by the Ministry of Marine and Fisheries Directorate General of Aquaculture. PT Japfa Tbk has also received the Certificate of Good Fish Farming Method (CBIB), which is awarded based on an assessment of its compliance in maintaining, raising, and harvesting fish in a controlled environment. These certifications provide assurances on the food produced at aquaculture farms.
PT Japfa Tbk has also formed a technical services team which is in charge of monitoring, guiding and fostering farmers. This team ensures that farmers are continually able to

46
Annual Report 2016 | JAPFA LTD
produce quality farm products for our customers.
In addition, PT Japfa Tbk also ensures that its products are safe and permissible to be consumed by anybody. We apply the ISO 9001:2008 Quality Management System in most of our Poultry Feedmills, Fish and Shrimp Feed Units, as well as Beef Cattle Fattening Units. Accordingly, PT Japfa Tbk also operates its Beef Division animal slaughterhouses according to ISO 22000:2005.
Maintaining Customer SatisfactionTo support our customer base and maintain customer satisfaction, Japfa has established a wide customer service network. In Indonesia, this is supported by more than 1,400 technical and marketing staff offering a full range of support services to help customers. We believe that this strategy has succeeded in maintaining Japfa’s operational performance during 2016.
Sustainability and Responsibility
Customer Health & Safety [PR1, PR3]Japfa is committed to maintaining consumer health and safety. To realize this commitment, PT Japfa Tbk has successfully implemented ISO 22000:2005 and passed the certification audit process of the global certification body.
PT Japfa Tbk has also received a Veterinary Control Number (“NKV”) for its poultry and beef divisions, which is a certificate for businesses to conduct slaughtering, processing, and marketing of farm products. It also serves as a validation of our fulfilment of hygiene and sanitation requirements as a basic qualification in the quality of animal protein products.
In addition, PT Japfa Tbk has made efforts to maintain customer security and safety by asking the GLOBAL G.A.P. to standardise its production process to provide extra assurances to customers that the food processing is environmentally-friendly, and
safe for worker’s health and animal welfare. Separately, PT Japfa Tbk is also committed to obtaining the Certificate of Good Manufacturing Practice (“CPOHB”), which is a guideline on manufacturing veterinary medicine for the veterinary medicine industry in Indonesia.
Besides ensuring that our products are safe for consumption, we also provide assurance that our products can be consumed by all consumers. For that purpose, PT Japfa Tbk has asked the Indonesian Council of Ulama (“MUI”) to conduct audits and issue “Halal” certification for its slaughterhouse unit in Indonesia and has since obtained a permit to place the “Halal” label on its product packaging.
Animal Health & SafetyCattle Welfare and Disease ControlFor our dairy business, it is our philosophy to give priority to cattle welfare. Cows produce more milk, have fewer health problems and live longer if they live in a comfortable environment.
To make our cattle happy and hence more productive, we engaged Mr Mark Deesing, a custom design consultant for Grandin Livestock Handling Systems, during the development

47
JAPFA LTD | Annual Report 2016
stage of our cattle feedlots in China. Our processing yards incorporate the famous S-shape design of livestock handling expert, Temple Grandin, and we will continue to conduct continuous measurement of critical control points to maintain the high standards of our dairy operations.
We have also implemented a strict and effective disease control policy to maintain the overall health of our herd. Routine checks are performed on our dairy cows twice daily, with extra monitoring during the winter months in China.
The incidence and prevalence of lameness and mastitis, the two most common diseases affecting dairy farms, is relatively low in our farms. This is due to our good hygiene practices, our well-managed free stalls, the clean environment of our facilities and our attention to the health and welfare of our cattle.
Strict Farm and Production Facility ProtocolEmployees are required to change and disinfect themselves before entering the production facilities, and vehicles must be disinfected before entering the farm. In addition, unauthorised vehicles, persons, animals and equipment are prohibited from entering the farm. We also disinfect our staff living quarters, milking halls and our veterinary hospital regularly.
Quality Control and Environmental SafetyGood quality control is critical for us to maintain our reputation as a leading company producing premium agri-food products. Our dairy farm in Indonesia has received ISO 22000 certification for systematic procedure from Good Manufacturing Practice and Hazard Analysis and Critical Control Point (“HACCP”) in November 2007.
We have also implemented strict monitoring and quality control systems to manage our operations and to ensure the safety and high quality of our raw milk. Our control over the quality of our dairy cows and our efforts to keep a clean living environment enable us to produce raw milk with low microbe count and low somatic cell count.
As a result, our raw milk in China and Indonesia surpasses local and international nutritional and safety standards, including the EU raw milk standard, which is among the most stringent industrial standards for raw milk and other dairy products in the world.
Bio-securityWe believe that we have one of the most stringent bio-security systems in the animal protein industry. We also believe that in animal protein production, prevention is the most viable and economically feasible approach to the control of infectious disease agents.
Our bio-security measures are premised on three components: (1) isolation (i.e. the process of keeping our livestock confined and protected in specialised areas); (2) sanitation and disinfection; and (3) traffic control (i.e. the control of traffic in and out of our premises).
In addition, we undertake modern farming practices, vaccination and medication, ongoing monitoring, auditing and education of our staff, suppliers and customers. In line with our policy of isolation, our DOC breeding farms, in particular, are located in separate, isolated locations, in order to minimise the risk of the spread of infection.
48
Annual Report 2016 | JAPFA LTD
CorporateInformationBOARD OF DIRECTORS
GOH GEOK KHIM Non-Executive Independent Chairman
HANDOJO SANTOSA @ KANG KIEM HAN Executive Deputy Chairman
HENDRICK KOLONAS Non-Executive, Non-Independent Director
TAN YONG NANG Executive Director and Chief Executive Officer
KEVIN JOHN MONTEIRO Executive Director and Chief Financial Officer
NG QUEK PENG Independent Director
LIEN SIAOU-SZE Independent Director
AUDIT COMMITTEE
NG QUEK PENG Chairman
HENDRICK KOLONAS
LIEN SIAOU-SZE
NOMINATING COMMITTEE
LIEN SIAOU-SZE Chairwoman
HANDOJO SANTOSA @ KANG KIEM HAN
NG QUEK PENG
REMUNERATION COMMITTEE
LIEN SIAOU-SZE Chairwoman
HENDRICK KOLONAS
NG QUEK PENG
COMPANY SECRETARIES
CHRISTINA CHUA SOOK PING LLB (Hons)
CHENG SAI HONG ACS, ACIS
AUDITOR
RSM CHIO LIM LLP 8 Wilkie Road #03-08 Wilkie Edge Singapore 228095 Partner-in-charge: Chan Weng Keen (Chartered Accountant of Singapore) Effective from reporting year ended 31 December 2016
SHARE REGISTRAR AND SHARE TRANSFER OFFICE
BOARDROOM CORPORATE & ADVISORY SERVICES PTE LTD
50 Raffles Place#32-01 Singapore Land TowerSingapore 048623
PRINCIPAL BANKERS
DBS BANK LTD. 12 Marina Boulevard Marina Bay Financial Centre Tower 3 Singapore 018982
COÖPERATIEVE CENTRALE RAIFFEISEN-BOERENLEENBANK B.A. (TRADING AS RABOBANK INTERNATIONAL), SINGAPORE BRANCH 38 Beach Road #31-11 South Beach Tower Singapore 189767
PT BANK CENTRAL ASIA TBK Menara BCA Jl. MH Thamrin No. 1 Jakarta 10310 Indonesia
PT BANK MANDIRI (PERSERO) TBK Jl. Jenderal Gatot Subroto Kav. 36-38 Jakarta 12190 Indonesia
PT BANK RAKYAT INDONESIA (PERSERO) TBK Kantor Pusat Gedung BRI 1 Jl. Jenderal Sudirman Kav. 44-46 Jakarta 10210 Indonesia
REGISTERED OFFICE
391B Orchard Road #18-08 Ngee Ann City, Tower BSingapore 238874
STOCK CODES
SGX JAPFABLOOMBERG JAP:SPREUTERS JAPF:SI
WEBSITE
www.japfa.com

49
JAPFA LTD | Annual Report 2016
CORPORATE GOVERNANCE
Japfa Ltd (“Japfa” or the “Company”, and together with its subsidiaries, the “Group”) is committed to maintaining good corporate governance and business integrity in the Group’s business activities, so as to deliver long-term and sustained value for its stakeholders.
This report lists out Japfa’s corporate governance framework, with specific reference to the principles and guidelines of the revised Code of Corporate Governance 2012 (“2012 Code”) issued by the Monetary Authority of Singapore on 2 May 2012.
Japfa has complied in all material aspects with the main principles and supporting guidelines of the 2012 Code, and will regularly review its governance policies and practices to track developments in market best practices and regulations.
PRINCIPLE 1: THE BOARD’S CONDUCT OF AFFAIRS
The principal functions of the Board of Directors (the “Board”) are to:
• Supervise the management of the business and affairs of the Company;• Approve the Group’s strategic plans, major investments, disposals and funding decisions; • Identify the Group’s business risks;• Review on the implementation of appropriate systems to manage identified risks; • Monitor and review the Group’s financial performance; and• Review management’s performance.
To assist in the execution of its responsibilities, the Board is supported by the Executive Director Committee (“Exco”), Nominating Committee (“NC”), the Remuneration Committee (“RC”), and the Audit Committee (“AC”). Each Board Committee has clear terms of reference of its duties, responsibilities and authority.
The Board will meet at least four times a year to consider and resolve major financial and business matters of the Group. Where necessary, informal meetings will be held to deliberate on various issues. Between scheduled meetings, material matters which exceed the authority conferred to the Exco are put to the Board for its decision by way of circular resolutions.
Management of the day-to-day operations and the implementation of internal control systems are delegated to the Exco comprising the Deputy Chairman, Chief Executive Officer (“CEO”) and the Chief Financial Officer (“CFO”) of the Company. The Exco operates under a set of authority matrix as set by the Board and the CEO periodically reports to the entire Board on material decisions and actions taken by the Exco in the previous quarter, or that are foreseen for the next quarter.
Material transactions requiring board approval include corporate restructuring, joint venture, mergers and acquisition, debt or capital market transaction, change of the Company’s constitutional documents and commencement of any litigation by the Company.
Our Directors generally keep themselves familiar with new laws and regulations as well as changing commercial risks and developments in order to keep abreast of changes in the industry and general economic environment. The Company has also engaged external lawyers to brief the Board on their statutory duties and to update them on relevant changes in law and regulations. External seminars and conferences are arranged for the Directors when required.
New Directors joining the Company will be given an orientation (which includes site visits to our operating subsidiaries) by the Executive Directors and senior management to help new Directors to familiarize themselves with the Group’s operations.

50
Annual Report 2016 | JAPFA LTD
CORPORATE GOVERNANCE
Attendance of Board and Committee meetings in 2016:
BoardMeetings
ACMeetings NC Meetings
RC Meetings
Number of meetings held 4 4 1 1
Name of Directors Number of meetings attended
Goh Geok Khim (Chairman) 4 4^ 1^ –
Handojo Santosa @ Kang Kiem Han(Deputy Chairman) 4 4^ 1 –
Hendrick Kolonas 4 4 1^ 1
Tan Yong Nang 4 4^ 1^ –
Kevin John Monteiro 4 4^ 1^ –
Ng Quek Peng 4 4 1^ 1
Lien Siaou-Sze 4 4 1 1
Liu Chee Ming (Retired on 14 April 2016) 1* 1* 1* – ^ By invitation * 1 meeting held prior to retirement
PRINCIPLE 2: BOARD COMPOSITION AND GUIDANCE
As at the date of this Annual Report, the Board comprises seven Directors of whom three are Independent Directors. The nature of the Directors’ appointment and committee membership for 2016 is set out below:
Board Composition Table
NameDate of
AppointmentDate of re-
electionBoard
Membership AC NC RC
Goh Geok Khim 30 June 2014 14 April 2016 Non-Executive Independent
Chairman
– – –
Handojo Santosa @ Kang Kiem Han
19 December 2008
14 April 2016 Executive, Non-IndependentDeputy Chairman
– Member –
Hendrick Kolonas 18 February 2013
14 April 2016 Non-Executive, Non-Independent
Member – Member
Tan Yong Nang 1 June 2009 14 April 2016 Executive – – –
Kevin John Monteiro 16 April 2014 14 April 2016 Executive – – –
Ng Quek Peng 29 July 2014 14 April 2016 Independent Chairman Member(Appointed on 14 April
2016)
Member
Lien Siaou-Sze 29 July 2014 14 April 2016 Independent Member(Appointed on 14 April
2016)
Chairwoman Chairwoman
Liu Chee Ming 29 July 2014 N.A. Retired on
14 April 2016
Independent Member(Retired on
14 April 2016)
Member(Retired on
14 April 2016)
–
The Board has examined its size and is satisfied that its current board size is appropriate for the Company.

51
JAPFA LTD | Annual Report 2016
CORPORATE GOVERNANCE
PRINCIPLE 3: CHAIRMAN AND CEO
The Chairman and the CEO of the Company are separate persons and are not related to each other.
The Chairman is a Non-Executive Independent Director while the CEO is an Executive Director.
The roles of the Chairman and the CEO are kept separate and the division of responsibilities between them are set out in writing.
The Chairman is primarily responsible for the workings of the Board. He leads the Board in its discussions and deliberation, facilitates effective contribution by Directors and exercises control over the timeliness of information flow between the Board and management.
The CEO manages the business of the Company, implements the Board’s decisions and is responsible for the day-to-day operations of the Company.
PRINCIPLE 4: BOARD MEMBERSHIPPRINCIPLE 5: BOARD PERFORMANCE
NC Composition and Role
The NC comprises three Directors, the majority of whom, including the NC Chairwoman, are Independent Directors.
Please refer to the Board Composition Table for the names and composition of the NC.
The NC is responsible for:
1. making recommendations to the Board on matters relating to:
(i) the review of board succession plans for Directors, in particular, the Chairman of the Board and the CEO;
(ii) the reviewing of training and professional development programs for the Board; and (iii) the appointment and re-appointment of Directors (including alternate Directors, if applicable);
2. reviewing and determining annually, and as and when circumstances require, whether a Director is independent, in accordance with the 2012 Code and any other salient factors;
3. reviewing the composition of the Board annually to ensure that the Board and its committees comprise Directors who as a group provide an appropriate balance and diversity of skills, expertise, gender and knowledge of the Company and provide core competencies such as accounting or finance, business or management experience, industry knowledge, strategic planning experience and customer-based experience and knowledge;
4. (where a Director has multiple board representations), deciding whether the Director is able to and has been adequately carrying out his duties as Director, taking into consideration the Director’s number of listed company board representation and other principal commitments;
5. making recommendations to the Board on the development of a process for evaluation and performance of the Board, its committees and Directors; and
6. implementing process for assessing the effectiveness of the Board as a whole and its Board Committees and the contributions of each individual Director to the effectiveness of the Board.

52
Annual Report 2016 | JAPFA LTD
CORPORATE GOVERNANCE
The Board evaluates its effectiveness by completing an evaluation questionnaire that covers topics such as Board Structure, Strategy and Performance, Risk Management and Internal Control, Information to Board and Shareholders and Board Functions and Standards of Conduct.
The evaluation results are compiled by the NC and tabled for review by the Board collectively.
The NC, having considered the results of the Board evaluation and the following factors:
(i) the number of listed company directorships by each Independent Director;
(ii) the principal commitments of Independent Directors;
(iii) the confirmations by Independent Directors stating that they are each able to devote sufficient time and attention to the matters of the Company;
(iv) the confirmations by Independent Directors that each of them is not accustomed or under an obligation, whether formal or informal, to act in accordance with the directions, instructions or wishes of any Controlling Shareholder, has no relationship with the Company, its related corporations or with any Director of these corporations, its 10% Shareholders or its officers that could interfere or be reasonably perceived to interfere, with the exercise of his or her independent business judgment with a view to the best interests of the Company;
(v) the Independent Directors’ working experience and expertise in different areas of specialization; and
(vi) the composition of the Board,
is of the view that:
(i) each Director is individually and collectively suitable and possess relevant experience to act as Directors of the Company;
(ii) the Independent Directors, as a whole, represent a strong and independent element on the Board which is able to exercise objective judgment on corporate affairs independently from the controlling shareholders; and
(iii) there is no requirement to set the limitation of board representations as the Directors are able to devote sufficient time to the discharge of their duties.
Directors will retire from office at the Annual General Meeting (“AGM”) and will submit themselves for re-nomination and re-election each year. All Directors have submitted themselves for re-election at the forthcoming AGM.
PRINCIPLE 6: ACCESS TO INFORMATION
All members of the Board have separate and independent access to the Company’s senior management and the Company Secretary at all times.
Prior to the Board meetings, all Directors are provided with board papers so that the Directors have complete, adequate, and timely information to enable them to be adequately prepared for the meeting.
Directors are also informed on a regular basis as and when there are any significant developments or events relating to the Group’s business operation.
The Company Secretary attends all Board and Board Committee meetings and is responsible for, among other things, ensuring that Board procedures are observed and that applicable rules and regulations are complied with and is also responsible for advising the Board on all matters relating to corporate governance. The appointment and the removal of the Company Secretary is a matter for the Board as a whole.

53
JAPFA LTD | Annual Report 2016
CORPORATE GOVERNANCE
The Board takes independent professional advice as and when necessary to enable it or the Independent Directors to discharge their responsibilities effectively and such costs are borne by the Company.
PRINCIPLE 7: PROCEDURES FOR DEVELOPING REMUNERATION POLICIES
RC Composition and Role
The RC comprises three Directors, the majority of whom, including the RC Chairwoman, are Independent Directors.
Please refer to the Board Composition Table for the names and composition of the RC.
The RC is responsible for:
1. reviewing and recommending to the Board for endorsement, a comprehensive remuneration policy framework and guidelines for the Directors, the CEO and other persons having authority and responsibility for planning, directing and controlling the activities of the Company (“Key Management Personnel”);
2. reviewing and recommending to the Board, for endorsement, the specific remuneration packages for each Director and Key Management Personnel;
3. reviewing and approving the design of all share option plans, performance share plans and/or other equity based plans;
4. in the case of service contracts, reviewing the Company’s obligations arising in the event of termination of the Executive Directors’ or Key Management Personnel’s contracts of service, to ensure that such contracts of service contain fair and reasonable termination clauses which are not overly generous, with a view to being fair and avoiding the reward of poor performance;
5. approving performance targets for assessing the performance of each of the Key Management Personnel and recommend such targets as well as employee specific remuneration packages for each of such Key Management Personnel, for endorsement by the Board; and
6. considering and reviewing the remuneration packages periodically in order to maintain their attractiveness, to retain and motivate the Directors and Key Management Personnel and to align the level and structure of remuneration with the long-term interests and risk policies of the Company.
Executive Directors who are employees of the Company do not receive Directors’ fee.
PRINCIPLE 8: LEVEL AND MIX OF REMUNERATION
The level of remuneration takes into consideration the Company’s ability to attract, retain and motivate our directors and key executives to run the Company well. When determining the remuneration of each key executive, the following factors are also considered:
– Remuneration and compensation conditions in the market and in comparable companies within our industry;
– The Company’s relative performance against the performance of the key executives; and– Remuneration that reflects the key executives’ roles and responsibilities within the Company.
PRINCIPLE 9: DISCLOSURE ON REMUNERATION DIRECTORS’ REMUNERATION
Directors’ fees comprise a basic fee and additional fees for other duties, such as holding the appointment of Chairman of the Board or a Committee. No additional fee is paid for meeting attendance.

54
Annual Report 2016 | JAPFA LTD
CORPORATE GOVERNANCE
Shareholders approved the payment of FY2016 Directors’ fees at the previous Annual General Meeting held on 14 April 2016.
The approved fee structure for Non-Executive Directors is as follows:
Fee Structure
AppointmentFees (Per Annum)
S$
Board Chairman 150,000.00
Board Member 80,000.00
Audit Committee Chairman 30,000.00
Other Committee Chairman 20,000.00
Committee Member 10,000.00
Breakdown of the Directors’ fees paid in FY2016 is as follows
Directors’ Fees (S$)
Name BOARD AC RC NC TOTAL
Goh Geok Khim 150,000 – – – 150,000
Hendrick Kolonas 80,000 10,000 10,000 – 100,000
Ng Quek Peng 80,000 30,000 10,000 7,500^ 127,500^
Lien Siaou-Sze 80,000 7,500^ 20,000 20,000 127,500^
Liu Chee Meng 20,000^ 2,500^ – 2,500^ 25,000^
SUB TOTAL 410,000 50,000 40,000 30,000 530,000
^ Prorated fees paid based on period of appointment
Executive Directors do not receive Directors’ fees.
The breakdown (in percentage terms) of the Directors’ remuneration for FY2016 is set out below:
Name of Director
Directors’ Fees Salary*Allowances/
BenefitsVariable
Bonus ** Total
% % % % %
Non-Executive DirectorsBelow S$250,000Mr Goh Geok Khim 100 – – – 100
Ms Lien Siaou-Sze 100 – – – 100
Mr Liu Chee Meng 100 – – – 100
Mr Ng Quek Peng 100 – – – 100
S$1,250,000 to S$1,500,000Mr Hendrick Kolonas*** 7 47 29 17 100
Executive DirectorsS$750,001 to S$1,000,000Mr Kevin Monteiro – 65 15 20 100
S$3,000,001 to S$3,250,000Mr Handojo Santosa – 78 2 20 100
S$5,000,001 to S$7,500,000Mr Tan Yong Nang – 23 0 77 100
* Salary includes CPF Contributions and AWS where applicable** Variable Bonus includes Share-based awards*** The total remuneration of Hendrick Kolonas includes remuneration received from PT Japfa Comfeed Indonesia Tbk for his role as Commissioner.

55
JAPFA LTD | Annual Report 2016
CORPORATE GOVERNANCE
Key Executives’ Remuneration for FY2016
The breakdown (in percentage terms) of the Key Executives’ remuneration for FY2016 is set out below:
Name of Key Executive
Salary*Allowances/
BenefitsVariable Bonus** Total
% % % %
S$500,001 to S$750,000Mr Jasper Tan Kai Loon 75 2 23 100
S$750,001 to S$1,000,000Mr Edgar Dowse Collins 46 31 23 100
Ms Christina Chua Sook Ping 74 3 23 100
Mr Antonius Harwanto 40 5 55 100
S$3,2500,001 to S$3,500,000Mr Bambang Budi Hendarto 14 2 84 100
* Salary includes CPF Contributions and AWS where applicable** Variable Bonus includes Share-based awards
Mr Renaldo Santosa is the son of the Executive Deputy Chairman, Mr Handojo Santosa, and has received compensation in the remuneration band of S$150,000 to S$200,000 as Business Development Manager for FY2016.
Ms Gabriella Santosa is the daughter of the Executive Deputy Chairman, Mr Handojo Santosa, and has received compensation in the remuneration band of S$50,000 to S$100,000 for FY2016. She joined the company on 16 May 2016 as an intern, and was offered permanent employment as Business Development Executive with effect from 12 August 2016.
The remuneration of Directors and Executives are set out in incremental bands of S$250,000. The Company believes that it is not in the Group’s interest to disclose their remuneration to the full extent recommended due to confidentiality of remuneration, and such disclosure may hamper its ability to retain the Group’s talent pool in a competitive environment.
Proposed New Fee Structure for Non-Executive Directors:
The existing fee structure for Non-Executive Directors was established in 2014. In line with the greater responsibilities of the Directors, RC has accepted the Management’s recommendation to present the following proposed fee structure for Non-Executive Directors for Shareholders’ approval at the forthcoming AGM. If approved, the New Fee Structure will apply from 2Q2017 to 1Q2018:
Appointment Fees (Per Annum) S$
Board Chairman 165,000.00
Board Member 85,000.00
Audit Committee Chairman 33,000.00
Other Committee Chairman 22,000.00
Committee Member 11,000.00
Share Based Incentives
The “Japfa Performance Share Plan” came into effect on 23 July 2014. For details of this employee performance share plan, please refer to Note 26E of the financial statements.
On 1 March 2017, 4,855,200 ordinary shares in the capital of the Company were issued and allotted for performance shares granted under the Japfa Performance Share Plan for FY2016.
AustAsia Investment Holdings Pte Ltd, a subsidiary company, had implemented a share option scheme known as the “AustAsia Subsidiaries Employee Share Option Scheme” which came into effect on 1 January 2010.

56
Annual Report 2016 | JAPFA LTD
CORPORATE GOVERNANCE
2,459,230 share options were granted under the AustAsia Subsidiaries Employee Share Option Scheme during FY2016 and duly announced on SGXNET on 29 April 2016.
Information on the share options granted by the subsidiary can be found in Note 26D of the financial statements.
PRINCIPLE 10: ACCOUNTABILITYPRINCIPLE 14: SHAREHOLDER RIGHTSPRINCIPLE 15: COMMUNICATION WITH SHAREHOLDERSPRINCIPLE 16: CONDUCT OF SHAREHOLDER MEETINGS
The Company respects the rights of shareholders and aims to promote fair and equitable treatment of all shareholders by keeping shareholders sufficiently informed of its corporate development and activities, on a timely basis. In particular, new information relating to the Group, which are material and price sensitive, are released through SGXNET before any media or analyst meetings or conference update calls are conducted. This ensures fair and non-selective disclosure of information to all investors.
All announcements released through SGXNET are also uploaded onto the Company’s website (www.japfa.com). Investor Relations contact details are listed in our website which contains an email link to our Investor Relations team.
The Company actively engages its shareholders and investors through regular and non-discriminatory communication, and provides regular and timely information to the investment community regarding the Group’s performance and prospects as well as major industry and corporate developments.
This is done via analyst and media face-to-face briefings and teleconferences throughout the year, which are typically held in conjunction with the release of the financial results. In addition, the management takes an active role in engaging investors by holding regular meetings with institutional investors through local and international roadshows and conferences which are organised by the major brokerage firms.
The Board provides shareholders with quarterly and annual financial reports. Results for the first three quarters will be released to the shareholders within 45 days of the reporting period while the full-year results will be released to the shareholders within 60 days of the financial year-end.
In presenting the financial reports, the Board aims to provide a balanced and understandable assessment of the Group’s financial performance and prospects.
For FY2016, the CEO and the CFO have provided assurance to the Board on the integrity of the financial statements of the Company and its subsidiaries.
The Company recognises that timely information is central to good corporate governance and is necessary for shareholders to make informed investment decisions. Shareholders are kept informed of developments and performances of the Group regularly through timely announcements and press releases (where appropriate) via the SGXNET, as well as the annual report. At the same time, shareholders and investors can contact the Company or access information on the Company at its website at www.japfa.com.
Active participation from shareholders at general meetings is welcomed by the Company.
The Company’s Articles of Association allow a shareholder to appoint one or two proxies to attend and vote in his place at general meetings. Where a member of the Company is a Relevant Intermediary, as defined in the Company’s Act, the member is entitled to appoint more than two proxies to attend and vote at general meetings.
The Chairman will be exercising his right under Article 85(a) of the Articles of Association of the Company to demand a poll for all resolutions to be put to the vote at the forthcoming AGM and Extraordinary General Meeting (“EGM”) and at any adjournment thereof. Accordingly, all resolutions at the AGM and EGM will be voted on by way of a poll.
The Company issues its notice of general meetings together with its annual report and circular to shareholders at least 14 days prior to the scheduled general meetings. This is aimed at providing ample time for shareholders to review the notice of meetings, annual report and circular before the meetings, and if required, appoint their proxies to attend the AGM and/or EGM.

57
JAPFA LTD | Annual Report 2016
CORPORATE GOVERNANCE
PRINCIPLE 11: RISK MANAGEMENT AND INTERNAL CONTROLSPRINCIPLE 12: AUDIT COMMITTEEPRINCIPLE 13: INTERNAL AUDIT
AC Composition and Role
The AC comprise three non-Executive Directors, the majority of whom, including the AC Chairman, are Independent Directors.
Please refer to the Board Composition Table for the names and composition of the AC.
The AC is responsible for:
1. assisting the Board in discharging its statutory responsibilities on financing and accounting matters;
2. reviewing significant financial reporting issues and judgments to ensure the integrity of the financial statements and any formal announcements relating to financial performance;
3. reviewing the scope and results of the audit and its cost effectiveness, and the independence and objectivity of the external auditors;
4. reviewing the external auditor’s audit plan and audit report and any recommendations to address any control weaknesses highlighted by the external auditor;
5. reviewing the key financial risk areas, including the Company’s hedging practices in respect of its exposure to fluctuations in foreign exchange and raw material costs;
6. reviewing the risk management structure and any oversight of the risk management process and activities to mitigate and manage risk at acceptable levels determined by the Board;
7. reviewing the statements to be included in the annual report concerning the adequacy and effectiveness of the Company’s risk management and internal controls systems, including financial, operational, compliance controls, and information technology controls;
8. reviewing any interested person transactions and monitoring the procedures established to regulate interested person transactions, including ensuring compliance with the Company’s internal control system and the relevant provisions of the Listing Manual, as well as all conflicts of interests to ensure that proper measures to mitigate such conflicts of interests have been put in place;
9. reviewing the scope and results of the internal audit procedures, and at least annually, the adequacy and effectiveness of the internal audit function;
10. approving the hiring, removal, evaluation and compensation of the head of the internal audit function, or the accounting / auditing firm or corporation to which the internal audit function is outsourced;
11. appraising and reporting to the Board on the audits undertaken by the external auditors and internal auditors, the adequacy of disclosure of information;
12. making recommendations to the Board on the proposals to Shareholders on the appointment, reappointment and removal of the external auditor, and approving the remuneration and terms of engagement of the external auditor;
13. reviewing the effectiveness of the internal audit function and, where deemed necessary, expand the internal audit function to ensure its effectiveness within the Company;
14. reviewing the policy and arrangements by which staff of the Company and any other persons may, in confidence, raise concerns about possible improprieties in matters of financial reporting or other matters with the objects of ensuring that arrangements are in place for such concerns to be raised and independently investigated and for appropriate follow-up action to be taken;

58
Annual Report 2016 | JAPFA LTD
CORPORATE GOVERNANCE
15. undertaking such other reviews and projects as may be requested by the Board and report to the Board its findings from time to time on matters arising and requiring the attention of the AC; and
16. undertaking generally such other functions and duties as may be required by law or the Listing Manual, and by amendments made thereto from time to time.
Board members (who are not AC members) are invited by the AC Chairman to attend the AC meetings.
AC has reviewed the aggregate fees paid to the external auditors, including a breakdown of the fees paid for audit and non audit services provided by the auditors. AC is of the opinion that the independence of the external auditors have not been affected by the provision of the non-audit services.
AC noted that the appointment of the external auditors for the Company, its subsidiaries and associated companies are in compliance with Rules 712 and 715 of the SGX-ST Listing Manual. In the interest of good corporate governance practice, the Directors, in consultation with AC, is recommending the appointment of Messrs Ernst & Young LLP for appointment as external auditors of the Company at the forthcoming AGM. Accordingly, Messrs RSM Chio Lim LLP will not be seeking re-appointment at the forthcoming AGM.
Internal Controls
The Group’s internal controls structure consists of the policies and procedures established, to provide reasonable assurance that the organization’s related objectives would be achieved. Business Units (“BU”) Management have primary responsibility for implementation and continuous improvement of their internal control system. Policies are established at the BU or corporate level, depending on the context of operations.
At the corporate level, the Systems and Procedure department and an Internal Control Manager assist the BUs to create the Standard Operating Procedures (“SOPs”) for business processes. For some large BUs (in Indonesia, Vietnam, India and China), there is an in-house Internal Control function for design and implementation of the internal controls system.
ERM Process
The Group’s risk management framework comprises a repeatable interaction process that facilitates active involvement by the Board in risk evaluation of strategic alternatives and operational decisions. These processes serve as a forum for the Management to highlight both favorable and adverse factors affecting the business.
Assurance from the CEO and CFO
In addition to the above, the Board has received assurance from the CEO and the CFO that:
(a) the financial records of the Group for FY2016 have been properly maintained and the financial statements give a true and fair view of the Group’s operations and finances in accordance with the applicable financial reporting framework that are free from material misstatement; and
(b) the system of risk management and internal controls in place within the Group is adequate and effective in addressing the material risks in the Group in its current business environment including material financial, operational, compliance and information technology risks.
Opinion on Adequacy and Effectiveness of Internal Control and Risk Management Systems
The AC is responsible for making the necessary recommendations to the Board such that the Board may make an opinion regarding the adequacy and effectiveness of the risk management and internal control systems of the Group. The Management is responsible for assuring the Board as to the adequacy and effectiveness of the risk management systems and ensuring the quality and timeliness of information.
Based on the assurance received from the CEO and CFO and the work performed by the internal audit function, the Board with the concurrence of the AC, is of the opinion that the Group’s internal controls including financial, operational, compliance and information technology controls, and risk management systems, were adequate and effective to meet the needs of the Group in its current business environment.

59
JAPFA LTD | Annual Report 2016
CORPORATE GOVERNANCE
The Board notes that the system of internal controls maintained by the Group’s management provides reasonable, but not absolute, assurance against material financial misstatements or loss, and includes the safeguarding of assets, the maintenance of proper accounting records, the reliability of financial information, the compliance with appropriate legislation, regulation and best practices, and the identification and containment of business risk. The Board further notes that no system of internal controls can provide absolute assurance against human errors including, without limitation, errors in judgment in the course of decision-making. In addition, no such controls can provide absolute protection against fraud or similar misconduct.
Key Audit Matters
In the review of the financial statements for FY2016, the AC has discussed with the Management and the external auditors on significant issues and assumptions that impact the financial statements. The most significant matters have also been included in the Independent Auditor’s Report to the members of the Company under “Key Audit Matters”. Following the review, the AC is satisfied that those matters, including the valuation of biological assets and put options, have been properly dealt with and recommended the Board to approve the financial statements. The Board has on 14 March 2017 approved the financial statements.
Internal Audit
The Group has an in-house Internal Audit (“IA”) function, based in Singapore and Indonesia. The Chief Audit Executive (“CAE”), is based in Singapore and reports functionally to the AC Chairman and administratively, to the CEO, as per the IA Charter.
The CAE has met the standards set by nationally or internationally recognised professional bodies including the Standards for the Professional Practice of Internal Auditing set by The Institute of Internal Auditors.
The annual internal audit plan is established by the CAE in consultation with, but independent of, Management, and is reviewed and approved by the AC. On a quarterly basis, the AC and Management review and discuss internal audit findings, recommendations and status of remediation, at AC meetings.
The internal auditors have unfettered access to the Group’s documents, records, properties and personnel, including access to the AC.
Whistleblowing
The Group has implemented a whistleblowing avenue called Japfalert. Any employee/supplier/business associate who is aware of a violation of internal control, accounting and financial principles or anti-corruption regulations/procedures is encouraged to report it. The whistleblower can use the Japfalert internet site www.japfalert.com or send a letter to the dedicated postal address 391B Orchard Road #18-08, Ngee Ann City Tower B, Singapore 238874, with attention to Japfalert Committee. The information disclosed using Japfalert will be kept confidential. Any whistleblower using this alert system is not at risk of any sanction, in relation to the matter disclosed, from his or her employer or the Group.
LISTING RULE 1207(19) – DEALING IN SECURITIES
Company has adopted a security dealing policy similar to Rule 1207(19) of the SGX-ST’s Listing Manual with respect to dealings in securities.
The security trading policy is applicable to:
1) Directors of the Company and its principal subsidiaries;
2) Key Executives of the Company, its principal subsidiaries;
3) All Financial Controllers of the Company, its principal subsidiaries and operating division;
4) Senior Financial Officers the Company and its principal subsidiaries who have access to financial results; and

60
Annual Report 2016 | JAPFA LTD
CORPORATE GOVERNANCE
5) Family members of Directors of the Company, its principal subsidiaries and operating division,
where the above listed persons are not allowed to deal in the Company’s securities and of its listed subsidiary’s securities two weeks before quarterly results are announced and one month before full year results are announced or while they are in possession of unpublished price-sensitive information.
Directors and officers are also discouraged from dealing in the Company’s and its listed subsidiary’s securities on short-term consideration.
INTERESTED PERSON TRANSACTIONS
The Company has put in place internal procedures to ensure compliance with the requirement of Chapter 9 of the Listing Manual on interested person transactions.
Under the procedures, the Group Financial Controller maintain a register on all interested person transactions. The register will be updated on submission by designated persons for review by AC to ensure that such transactions are carried out on normal business terms in accordance and are not prejudicial to the interest of the Company and its minority shareholders.
The aggregate value of interested person transactions entered into the Group in FY2016 are as follows:
Name of Interested Person
Aggregate value of all interested person
transactions during the financial year under review
(excluding transactions less than S$100,000 and transactions conducted
under shareholders’ mandate pursuant to Rule 920)
US$’000
Aggregate value of all interested
person transactions conducted under
shareholders’ mandate pursuant to Rule 920
(excluding transactions less than S$100,000)1
US$’000
Associates of Handojo Santosa – Lease of vehicles– Lease of office/warehouse
598748
– –
– Provision of services and supply of goods (including construction and advertising services and supply of parts) 10,396 –
– Group club membership fees 89 –
Associates of Hendrick Kolonas Provision of packaging service, supply of goods, insurance 4,189 –
Associates of both Handojo Santosa, Hendrick Kolonas Lease of office / recreational facilities 279 –
MATERIAL CONTRACTS
Saved as disclosed in the Interested Person Transaction section above, there were no material contracts entered into by the Group involving the interest of the Directors.
1 The Group has not obtained a general mandate from shareholders for interested person transactions under Rule 920 of the Listing Manual.

61
JAPFA LTD | Annual Report 2016
CORPORATE GOVERNANCE
FINANCIAL STATEMENTS
FinancialStatementsStatement by Directors 62
Independent Auditor’s Report 65
Consolidated Statement of Profit or Loss and Other Comprehensive Income 69
Statements of Financial Position 70
Statements of Changes in Equity 71
Consolidated Statement of Cash Flows 74
Notes to the Financial Statements 76
Statistics of Shareholdings 158
Notice of Annual General Meeting 161
Proxy Form

62
Annual Report 2016 | JAPFA LTD
The directors of the Company are pleased to present the accompanying consolidated financial statements of the Group, and the statement of financial position and statement of changes in equity of the Company for the reporting year ended 31 December 2016.
1. OPINION OF THE DIRECTORS
In the opinion of the directors,
(a) the accompanying consolidated financial statements of the Group and statement of financial position and statement of changes in equity of the Company are drawn up so as to give a true and fair view of the financial position of the Group and of the Company as at 31 December 2016 and of the financial performance, changes in equity and cash flows of the Group, and statement of changes in equity of the Company for the reporting year ended on that date; and
(b) at the date of the statement, there are reasonable grounds to believe that the Company will be able to pay its debts as and when they fall due.
The board of directors approved and authorised these financial statements for issue.
2. DIRECTORS IN OFFICE AT DATE OF STATEMENT
The directors of the Company in office at the date of this statement are:
Goh Geok Khim
Handojo Santosa @ Kang Kiem Han
Hendrick Kolonas
Tan Yong Nang
Kevin John Monteiro
Ng Quek Peng
Lien Siaou-Sze
3. DIRECTORS’ INTERESTS IN SHARES AND DEBENTURES
The directors of the Company holding office at the end of the reporting year were not interested in shares in or debentures of the Company or other related body corporate as recorded in the register of directors’ shareholdings kept by the Company under section 164 of the Singapore Companies Act, Chapter 50 (the “Act”) except as follows:
Direct interest
Name of directors and companies in which interests are held
At 1 January 2016
At 31 December2016
As at 21 January 2017
Japfa Ltd Number of shares of no par value
Goh Geok Khim 1,500,000 1,500,000 1,500,000
STATEMENT BY DIRECTORS

63
JAPFA LTD | Annual Report 2016
3. DIRECTORS’ INTERESTS IN SHARES AND DEBENTURES (CONTINUED)
Deemed interest
Name of directors and companies in which interests are held
At 1 January 2016
At 31 December2016
As at 21 January 2017
Japfa Ltd Number of shares of no par value
Handojo Santosa @ Kang Kiem Han 1,154,048,615 1,136,763,115 1,136,818,915
Hendrick Kolonas 282,527,085 – –
Tan Yong Nang 62,110,691 62,110,691 62,110,691
Kevin John Monteiro 2,000,000 2,000,000 2,000,000
Ng Quek Peng 500,000 500,000 500,000
Lien Siaou-Sze 625,000 625,000 625,000
Related body corporate
PT Japfa Comfeed Indonesia TbkNumber of shares of IDR200 each (series A shares)
and IDR40 each (series B shares)
Handojo Santosa @ Kang Kiem Han – 14,457,200 14,457,200
Kevin John Monteiro 1,070,000 1,070,000 1,070,000
Comfeed Finance B.V. Principal amount of bonds (US$)
Goh Geok Khim 3,000,000 – –
Tan Yong Nang 600,000 600,000 –
Further details regarding directors’ interests in holding corporations are disclosed in the statistics of shareholdings section of the annual report.
By virtue of section 7 of the Act, Mr Handojo Santosa @ Kang Kiem Han is deemed to have an interest in the Company and all related body corporates of the Company.
4. ARRANGEMENTS TO ENABLE DIRECTORS TO ACQUIRE BENEFITS BY MEANS OF THE ACQUISITION OF SHARES AND DEBENTURES
Neither at the end of the reporting year nor at any time during the reporting year did there subsist arrangements to which the Company is a party, being arrangements whose objects are, or one of whose objects is, to enable directors of the Company to acquire benefits by means of the acquisition of shares in or debentures of the Company or any other body corporate except as mentioned below.
5. OPTIONS
During the reporting year, no option to take up unissued shares of the Company or other body corporate in the Group was granted and there were no shares issued by virtue of the exercise of an option to take up unissued shares, except as disclosed in Notes 26D and 26E of the financial statements.
At the end of the reporting year, there were no unissued shares under option, except as disclosed in Note 26D of the financial statements.
STATEMENT BY DIRECTORS

64
Annual Report 2016 | JAPFA LTD
6. REPORT OF AUDIT COMMITTEE
The members of the audit committee (“AC”) at the date of this statement are as follows:
Ng Quek Peng (Chairman of AC)Hendrick KolonasLien Siaou-Sze
The AC performs the functions specified in section 201B (5) of the Act. The principal responsibility of the AC is to assist the Board of Directors in fulfilling its oversight responsibilities. The Board is of the opinion that the members of the AC have sufficient accounting, financial and management expertise and experience to discharge their duties.
Further details regarding the AC and its functions are disclosed in the report on corporate governance included in the annual report of the Company.
7. SUBSEQUENT DEVELOPMENTS
There are no significant developments subsequent to the release of the Group’s and the Company’s preliminary financial statements, as announced on 1 March 2017, which would materially affect the Group’s and the Company’s operating and financial performance as of the date of this statement.
On behalf of the directors
...........................................……….... ...........................................………....
Tan Yong Nang Kevin John Monteiro
Director Director
14 March 2017
STATEMENT BY DIRECTORS

65
JAPFA LTD | Annual Report 2016
REPORT ON THE AUDIT OF THE FINANCIAL STATEMENTS
Opinion
We have audited the accompanying financial statements of Japfa Ltd (the “Company”) and its subsidiaries (collectively, the “Group”), which comprise the consolidated statement of financial position of the Group and the statement of financial position of the Company as at 31 December 2016, and the consolidated statement of profit or loss and other comprehensive income, consolidated statement of changes in equity and consolidated statement of cash flows of the Group, and statement of changes in equity of the Company for the reporting year then ended, and notes to the financial statements, including the significant accounting policies.
In our opinion, the accompanying consolidated financial statements of the Group and the statement of financial position and statement of changes in equity of the Company are properly drawn up in accordance with the provisions of the Singapore Companies Act, Chapter 50 (the “Act”) and Financial Reporting Standards in Singapore (“FRSs”) so as to give a true and fair view of the consolidated financial position of the Group and the financial position of the Company as at 31 December 2016 and of the consolidated financial performance, consolidated changes in equity and consolidated cash flows of the Group and the changes in equity of the Company for the reporting year ended on that date.
Basis for opinion
We conducted our audit in accordance with Singapore Standards on Auditing (“SSAs”). Our responsibilities under those standards are further described in the auditor’s responsibilities for the audit of the financial statements section of our report. We are independent of the company in accordance with the Accounting and Corporate Regulatory Authority (“ACRA”) Code of Professional Conduct and Ethics for Public Accountants and Accounting Entities (“ACRA Code”) together with the ethical requirements that are relevant to our audit of the financial statements in Singapore, and we have fulfilled our other ethical responsibilities in accordance with these requirements and the ACRA Code. We believe that the audit evidence we have obtained is sufficient and appropriate to provide a basis for our opinion.
Key audit matters
Key audit matters are those matters that, in our professional judgement, were of most significance in our audit of the financial statements of the current reporting year. These matters were addressed in the context of our audit of the financial statements as a whole, and in forming our opinion thereon, and we do not provide a separate opinion on these matters.
(1) Fair value of biological assets
Please refer to Notes 2A,2B and 19 to the financial statements.
The carrying amount of the Group’s biological assets totaled US$363,149,000 (2015: US$341,981,000) as at the end of the reporting year. Biological assets are measured at fair value less costs to sell. In measuring the fair value of the biological assets such as dairy cows, breeding cattle and swine, the fair value is measured based on either the market determined prices as at the end of the reporting year adjusted with reference to the species, age, growing condition, costs incurred and expected yield to reflect differences in characteristics and/or stages of growth of the biological assets; or the present value of expected net cash flows from the biological assets discounted at a current market-determined rate, when market-determined prices are unavailable. Any change in the estimates may affect the fair value of the biological assets significantly.
We assessed management’s processes for the selection of its appointed external valuation expert, including the determination of the scope of work to be performed by the valuation expert and the review and acceptance of the valuation expert’s reports. We also evaluated the competency of the external valuation expert by considering the expert’s qualifications and relevant work experience.
INDEPENDENT AUDITOR’S REPORTTO THE MEMBERS OF JAPFA LTD.

66
Annual Report 2016 | JAPFA LTD
Key audit matters (continued)
(1) Fair value of biological assets (continued)
With the assistance of our in-house valuation specialists, we compared the valuation methodology to generally acceptable market practices and tested management’s inputs to the valuation by comparing them against available industry data and by performing sensitivity analysis on the outcome of the calculations.
We instructed the component auditor to carry out the same audit procedures and reviewed their work.
We evaluated the adequacy of the disclosures included in the financial statements.
(2) Valuation of put option financial liabilities
Please refer to Notes 2A, 2B, 17, 27 and 39 to the financial statements.
The carrying amount of the put option financial liabilities of the Group was US$169,979,000 (2015: US$180,946,000) at the end of the reporting year. These liabilities are measured at the present value of the redemption amounts, for which the value is subject to significant judgement and estimation uncertainty. Any change in the estimates may affect the value of the put option financial liabilities significantly.
With the assistance of our in-house valuation specialists, we assessed management’s processes for the selection of its appointed external valuation expert, including the determination of the scope of work to be performed by the valuation expert and the review and acceptance of the valuation expert’s report. We have also evaluated the competency of the external valuation expert by considering the expert’s qualifications and relevant work experience. We tested management’s inputs to the valuation by comparing them against available industry data and by performing sensitivity analysis on the outcome of the calculations. Our in-house valuation specialists independently performed their valuation of the put option liabilities and compared the results with the valuation performed by management’s appointed external expert.
We evaluated the adequacy of the disclosures included in the financial statements.
Other information
Management is responsible for the other information. The other information comprises the statement by directors and the annual report but does not include the financial statements and our auditor’s report thereon.
Our opinion on the financial statements does not cover the other information and we do not express any form of assurance conclusion thereon.
In connection with our audit of the financial statements, our responsibility is to read the other information and, in doing so, consider whether the other information is materially inconsistent with the financial statements or our knowledge obtained in the audit or otherwise appears to be materially misstated. If, based on the work we have performed, we conclude that there is a material misstatement of this other information, we are required to report that fact. We have nothing to report in this regard.
INDEPENDENT AUDITOR’S REPORTTO THE MEMBERS OF JAPFA LTD.

67
JAPFA LTD | Annual Report 2016
Responsibilities of management and directors for the financial statements
Management is responsible for the preparation of financial statements that give a true and fair view in accordance with the provisions of the Act and FRSs, and for devising and maintaining a system of internal accounting controls sufficient to provide a reasonable assurance that assets are safeguarded against loss from unauthorised use or disposition; and transactions are properly authorised and that they are recorded as necessary to permit the preparation of true and fair financial statements and to maintain accountability of assets.
In preparing the financial statements, management is responsible for assessing the Group’s ability to continue as a going concern, disclosing, as applicable, matters related to going concern and using the going concern basis of accounting unless management either intends to liquidate the Group or to cease operations, or has no realistic alternative but to do so.
The directors’ responsibilities include overseeing the Group’s financial reporting process.
Auditor’s responsibilities for the audit of the financial statements
Our objectives are to obtain reasonable assurance about whether the financial statements as a whole are free from material misstatement, whether due to fraud or error, and to issue an auditor’s report that includes our opinion. Reasonable assurance is a high level of assurance, but is not a guarantee that an audit conducted in accordance with SSAs will always detect a material misstatement when it exists. Misstatements can arise from fraud or error and are considered material if, individually or in the aggregate, they could reasonably be expected to influence the economic decisions of users taken on the basis of these financial statements.
As part of an audit in accordance with SSAs, we exercise professional judgement and maintain professional scepticism throughout the audit. We also:
(a) Identify and assess the risks of material misstatement of the financial statements, whether due to fraud or error, design and perform audit procedures responsive to those risks, and obtain audit evidence that is sufficient and appropriate to provide a basis for our opinion. The risk of not detecting a material misstatement resulting from fraud is higher than for one resulting from error, as fraud may involve collusion, forgery, intentional omissions, misrepresentations, or the override of internal control.
(b) Obtain an understanding of internal control relevant to the audit in order to design audit procedures that are appropriate in the circumstances, but not for the purpose of expressing an opinion on the effectiveness of the Group’s internal control.
(c) Evaluate the appropriateness of accounting policies used and the reasonableness of accounting estimates and related disclosures made by management.
(d) Conclude on the appropriateness of management’s use of the going concern basis of accounting and, based on the audit evidence obtained, whether a material uncertainty exists related to events or conditions that may cast significant doubt on the Group’s ability to continue as a going concern. If we conclude that a material uncertainty exists, we are required to draw attention in our auditor’s report to the related disclosures in the financial statements or, if such disclosures are inadequate, to modify our opinion. Our conclusions are based on the audit evidence obtained up to the date of our auditor’s report. However, future events or conditions may cause the Group to cease to continue as a going concern.
(e) Evaluate the overall presentation, structure and content of the financial statements, including the disclosures, and whether the financial statements represent the underlying transactions and events in a manner that achieves fair presentation.
(f) Obtain sufficient appropriate audit evidence regarding the financial information of the entities or business activities within the Group to express an opinion on the consolidated financial statements. We are responsible for the direction, supervision and performance of the Group audit. We remain solely responsible for our audit opinion.
INDEPENDENT AUDITOR’S REPORTTO THE MEMBERS OF JAPFA LTD.

68
Annual Report 2016 | JAPFA LTD
Auditor’s responsibilities for the audit of the financial statements (cont’d)
We communicate with the directors regarding, among other matters, the planned scope and timing of the audit and significant audit findings, including any significant deficiencies in internal control that we identify during our audit.
We also provide the directors with a statement that we have complied with relevant ethical requirements regarding independence, and to communicate with them all relationships and other matters that may reasonably be thought to bear on our independence, and where applicable, related safeguards.
From the matters communicated with the directors, we determine those matters that were of most significance in the audit of the financial statements of the current period and are therefore the key audit matters. We describe these matters in our auditor’s report unless law or regulation precludes public disclosure about the matter or when, in extremely rare circumstances, we determine that a matter should not be communicated in our report because the adverse consequences of doing so would reasonably be expected to outweigh the public interest benefits of such communication.
REPORT ON OTHER LEGAL AND REGULATORY REQUIREMENTS
In our opinion, the accounting and other records required by the Company and by the subsidiary corporations incorporated in Singapore of which we are the auditors have been properly kept in accordance with the provisions of the Act.
The engagement partner on the audit resulting in this independent auditor’s report is Chan Weng Keen.
RSM Chio Lim LLPPublic Accountants andChartered AccountantsSingapore
14 March 2017Engagement partner – effective from year ended 31 December 2016
INDEPENDENT AUDITOR’S REPORTTO THE MEMBERS OF JAPFA LTD.

69
JAPFA LTD | Annual Report 2016
Notes 2016 2015
US$’000 US$’000
Revenue 5 3,032,944 2,787,061Cost of sales (2,367,575) (2,266,806)Gross profit 665,369 520,255Interest income 6 3,580 2,859Other gains 7 28,467 12,810Other losses 7 (1,450) (1,925)Marketing and distribution costs 8 (120,669) (109,049)Administrative expenses 9 (233,282) (194,561)Finance costs 10 (60,035) (70,079)Foreign exchange adjustments losses, net (8,284) (41,954)Decrease in fair value of biological assets 19 (18,703) (5,633)Share of loss from equity-accounted joint ventures 18 (367) (798)Profit before income tax 254,626 111,925Income tax expense 12 (56,905) (20,159)Profit, net of income tax 197,721 91,766Other comprehensive loss
Items that will not be reclassified to profit or loss:
Remeasurement of the net defined benefits plan, net of tax 28 (5,589) 2,763
Items that may be reclassified subsequently to profit or loss:
Exchange differences on translating foreign operations (12,068) (82,402)
Share of other comprehensive income of equity-accounted joint ventures, net of tax 18 (4) –
Total other comprehensive loss, net of tax (17,661) (79,639)Total comprehensive income 180,060 12,127
Profit, net of income tax attributable to:
– Owners of the parent 118,784 64,696– Non-controlling interests 78,937 27,070
197,721 91,766
Total comprehensive income attributable to:
– Owners of the parent 107,162 10,100– Non-controlling interests 72,898 2,027
180,060 12,127
Cents Cents
Basic and diluted earnings per share 13 6.73 3.67
The accompanying notes form an integral part of these financial statements.
CONSOLIDATED STATEMENT OF PROFIT OR LOSS AND OTHER COMPREHENSIVE INCOMEREPORTING YEAR ENDED 31 DECEMBER 2016

70
Annual Report 2016 | JAPFA LTD
Group Company
Notes31 December
201631 December
20151 January
201531 December
201631 December
2015US$’000 US$’000 US$’000 US$’000 US$’000
(Restated) (Restated)
ASSETSNon-current assetsProperty, plant and equipment 14 897,809 834,952 833,758 555 416Investment properties 15 10,568 924 2,670 – –Intangible assets 16 8,384 8,525 9,440 – –Investments in subsidiaries 17 – – – 947,206 790,075Investments in joint ventures 18 3,825 3,476 3,054 – –Biological assets, non-current 19 299,552 290,064 260,289 – –Deferred tax assets 12 15,714 12,729 16,190 – –Other receivables, non-current 20 1,797 349 367 – –Other financial assets, non-current 21 11,164 – – 2,948 –Other assets, non-current 22 15,530 15,065 17,579 – –Total non-current assets 1,264,343 1,166,084 1,143,347 950,709 790,491
Current assetsInventories 23 611,907 609,437 598,118 – –Biological assets, current 19 63,597 51,917 62,393 – –Trade and other receivables, current 20 161,428 132,381 150,616 41,495 177,177Other financial assets, current 21 791 9,529 2,849 546 4,092Other assets, current 22 86,965 95,304 83,026 59 58Cash and cash equivalents 24 336,153 147,935 286,661 10,166 14,258Total current assets 1,260,841 1,046,503 1,183,663 52,266 195,585
Total assets 2,525,184 2,212,587 2,327,010 1,002,975 986,076
EQUITY AND LIABILITIESEquity attributable to owners of the
parent Share capital 25 937,614 937,614 937,614 937,614 937,614Retained earnings 408,167 301,022 238,601 60,199 26,093Other reserves 26 (374,504) (396,315) (398,931) 3,138 –Translation reserve 26 (179,614) (171,776) (115,416) – –Equity, attributable to owners of the
parent 791,663 670,545 661,868 1,000,951 963,707Non-controlling interests 467,505 338,071 332,406 – –Put options reserve (169,979) (180,946) (166,536) – –Total equity 1,089,189 827,670 827,738 1,000,951 963,707
Non-current liabilitiesPut option financial liabilities 27 169,979 180,946 166,536 – –Provisions 28 89,525 74,801 81,316 – –Deferred tax liabilities 12 3,817 4,512 7,317 – –Trade and other payables, non-current 29 2,107 642 352 – –Loan and borrowings, non-current 30 520,093 510,436 506,878 – –Other liabilities, non-current 32 3,208 3,267 2,408 – –Total non-current liabilities 788,729 774,604 764,807 – –
Current liabilitiesIncome tax payable 16,812 13,045 7,885 – –Trade and other payables, current 29 301,507 259,971 233,129 2,024 2,119Loan and borrowings, current 30 319,715 329,905 485,597 – 20,250Other financial liabilities 31 274 166 96 – –Other liabilities, current 32 8,958 7,226 7,758 – –Total current liabilities 647,266 610,313 734,465 2,024 22,369
Total liabilities 1,435,995 1,384,917 1,499,272 2,024 22,369
Total equity and liabilities 2,525,184 2,212,587 2,327,010 1,002,975 986,076
The accompanying notes form an integral part of these financial statements.
STATEMENTS OF FINANCIAL POSITION AS AT 31 DECEMBER 2016

71
JAPFA LTD | Annual Report 2016
Attributable Non- Put
Total to parent Share Retained Other Translation controlling options
equity sub-total capital earnings reserves reserve interests reserve
Group US$’000 US$’000 US$’000 US$’000 US$’000 US$’000 US$’000 US$’000
Current year:Opening balance at
1 January 2016, as previously reported 1,008,616 670,545 937,614 301,022 (396,315) (171,776) 338,071 –
Restatement (Note 39) (180,946) – – – – – – (180,946)
Opening balance at 1 January 2016, restated 827,670 670,545 937,614 301,022 (396,315) (171,776) 338,071 (180,946)
Total comprehensive income / (loss) for the year 180,060 107,162 – 115,000 – (7,838) 72,898 –
Issue of new shares by subsidiaries to non-controlling interests 6,612 – – – – – 6,612 –
Disposal of shares in subsidiary to non-controlling interests without change in control (Note 17E) 28,994 7,876 – – 7,876 – 21,118 –
Deemed disposal of subsidiary without a change in control (Note 17E) 53,410 10,660 – – 10,660 – 42,750 –
Acquisition of non-controlling interests without change in control (Note 17E) (4,634) (1,745) – – (1,745) – (2,889) –
Grant of share options (Note 26D) 491 491 – – 491 – – –
Changes in present value of the put option financial liabilities (Note 27) 10,967 – – – – – – 10,967
Value of employee services pursuant to performance share plan (Note 26E) 3,138 3,138 – – 3,138 – – –
Dividend paid to equity holders of the Company (Note 33) (6,464) (6,464) – (6,464) – – – –
Dividend paid by subsidiary to non-controlling interests (11,055) – – – – – (11,055) –
Transfer to statutory reserve (Note 26C) – – – (1,391) 1,391 – – –
Closing balance at 31 December 2016 1,089,189 791,663 937,614 408,167 (374,504) (179,614) 467,505 (169,979)
STATEMENTS OF CHANGES IN EQUITYYEAR ENDED 31 DECEMBER 2016
The accompanying notes form an integral part of these financial statements.

72
Annual Report 2016 | JAPFA LTD
Attributable Non- PutTotal to parent Share Retained Other Translation controlling options
equity sub-total capital earnings reserves reserve interests reserveGroup US$’000 US$’000 US$’000 US$’000 US$’000 US$’000 US$’000 US$’000
Previous year:Opening balance at
1 January 2015, as previously reported 994,274 661,868 937,614 238,601 (398,931) (115,416) 332,406 –
Restatement (Note 39) (166,536) – – – – – – (166,536)
Opening balance at 1 January 2015, restated 827,738 661,868 937,614 238,601 (398,931) (115,416) 332,406 (166,536)
Total comprehensive income / (loss) for the
year 12,127 10,100 – 66,460 – (56,360) 2,027 –
Issue of new shares by subsidiaries to non-controlling interests 9,590 – – – – – 9,590 –
Acquisition of non-controlling interests without change in control (Note 17F) (7,692) (1,725) – – (1,725) – (5,967) –
Acquisition of a subsidiary (Note 17G) 15 – – – – – 15 –
Changes in present value of the put option financial liabilities (Note 27) (14,410) – – – – – – (14,410)
Grant of share options (Note 26D) 302 302 – – 302 – – –
Transfer to statutory reserve (Note 26C) – – – (4,039) 4,039 – – –
Closing balance at 31 December 2015 827,670 670,545 937,614 301,022 (396,315) (171,776) 338,071 (180,946)
The accompanying notes form an integral part of these financial statements.
STATEMENTS OF CHANGES IN EQUITYYEAR ENDED 31 DECEMBER 2016

73
JAPFA LTD | Annual Report 2016
Total Share Retained Other
equity capital earnings reserve
Company US$’000 US$’000 US$’000 US$’000
Current year:Opening balance at 1 January 2016 963,707 937,614 26,093 –
Total comprehensive income for the year 40,570 – 40,570 –
Value of employee services pursuant to performance share plan (Note 26E) 3,138 – – 3,138
Dividend paid to equity holders of the Company (6,464) – (6,464) –
Closing balance at 31 December 2016 1,000,951 937,614 60,199 3,138
Previous year:Opening balance at 1 January 2015 959,643 937,614 22,029 –
Total comprehensive income for the year 4,064 – 4,064 –
Closing balance at 31 December 2015 963,707 937,614 26,093 –
The accompanying notes form an integral part of these financial statements.
STATEMENTS OF CHANGES IN EQUITYYEAR ENDED 31 DECEMBER 2016

74
Annual Report 2016 | JAPFA LTD
2016 2015
US$’000 US$’000
Cash flows from operating activitiesProfit before income tax 254,626 111,925
Adjustments for:
Amortisation of intangible assets 1,496 1,254
Amortisation of land use rights 238 23
Depreciation of property, plant and equipment 82,802 71,892
Depreciation of investment properties 468 115
Fair value loss/(gain) on financial assets 473 (2,497)
Fair value loss/(gain) on derivative financial instruments 278 (544)
Fair value loss on biological assets 18,703 5,633
(Gain)/loss on disposal of other financial assets (149) 63
Gain on disposal of property, plant and equipment (2,915) (317)
Fair value gain on call option assets (2,948) –
Gain on buy back of bonds payable (589) (6,400)
Increase in provision for retirement benefits 10,500 12,836
Interest income (3,580) (2,859)
Interest expense 60,035 70,079
Share options granted by a subsidiary 491 302
Value of employee services received pursuant to performance share plan 3,138 –
Share of loss from equity-accounted joint ventures 367 798
Write-off of property, plant and equipment 699 119
Net effect of exchange rate changes 8,101 8,103
Operating cash flows before changes in working capital 432,234 270,525
Inventories (2,470) (11,319)
Biological assets (27,026) (17,938)
Trade and other receivables (30,495) 18,253
Other assets (1,306) (10,553)
Trade and other payables 36,228 32,624
Provisions (5,123) (7,110)
Other liabilities 1,673 326
Net cash flows from operations before tax 403,715 274,808
Income taxes paid (40,773) (18,221)
Net cash flows from operating activities 362,942 256,587
Cash flows used in investing activitiesAcquisition of subsidiaries – 6
Additional investment in joint ventures (666) (1,460)
Purchase of property, plant and equipment (Note 24B) (168,421) (152,866)
Proceeds from disposal of property, plant and equipment 22,524 958
Proceeds from disposal of investment properties 511 –
Proceeds from disposal of investment in other financial assets 3,222 1,173
Purchase of financial assets (3,200) (5,000)
Purchase of biological assets (26,726) (31,782)
Purchase of intangible assets (1,121) (1,150)
Purchase of land use rights (4,900) (1,016)
Interest income received 3,580 2,859
Net cash flows used in investing activities (175,197) (188,278)
CONSOLIDATED STATEMENT OF CASH FLOWS YEAR ENDED 31 DECEMBER 2016

75
JAPFA LTD | Annual Report 2016
2016 2015
US$’000 US$’000
Cash flows from/(used in) financing activitiesDividends paid by subsidiary to non-controlling interests (11,055) –
Dividends paid to equity holders of the company (6,464) –
Proceeds from issue of bonds 73,709 –
Proceeds from issue of new shares by a subsidiary to non-controlling interests 60,022 9,590
Proceeds from disposal of shares in subsidiary to non-controlling interests without change in control 28,994 –
Acquisition of non-controlling interests without change in control (4,634) (7,692)
Decrease/(increase) in cash restricted in use 2,099 (1,697)
Buy back of bonds payable (5,323) (15,385)
Proceeds from new bank loans 80,270 93,246
Repayment of loans and borrowings (154,601) (211,319)
Interest expense paid (60,035) (70,079)
Net cash flows from/(used in) from financing activities 2,982 (203,336)
Net increase/(decrease) in cash and cash equivalents 190,727 (135,027)
Effect of exchange rate changes on cash and cash equivalents (410) (5,396)
Cash and cash equivalents, beginning balance 140,769 281,192
Cash and cash equivalents, ending balance (Note 24A) 331,086 140,769
The accompanying notes form an integral part of these financial statements.
CONSOLIDATED STATEMENT OF CASH FLOWSYEAR ENDED 31 DECEMBER 2016

76
Annual Report 2016 | JAPFA LTD
NOTES TO THE FINANCIAL STATEMENTS31 DECEMBER 2016
1. GENERAL
The Company
Japfa Ltd (the “Company”) is incorporated in Singapore with limited liability. It is listed on the Main Board of Singapore Exchange Securities Trading Limited.
The financial statements are presented in United States dollars (“US$”) and they cover the Company and the subsidiaries (collectively the “Group”). All financial information in these financial statements are rounded to the nearest thousand (“US$’000”) except when otherwise indicated.
The Board of Directors approved and authorised these financial statements for issue on the date of the statement by directors.
The principal activities of the Company are those of investment holding and provision of management services.
The principal activities of the subsidiaries are described in the notes to the financial statements below.
The registered office and principle place of business of the Company is located at 391B Orchard Road, #18-08 Ngee Ann City Tower B, Singapore 238874.
Accounting convention
The financial statements have been prepared in accordance with the Financial Reporting Standards in Singapore (“FRSs”) and the related Interpretations to FRS (“INT FRS”) as issued by the Singapore Accounting Standards Council and the Singapore Companies Act, Chapter 50 (the “Act”). The financial statements are prepared on a going concern basis under the historical cost convention except where a FRS requires an alternative treatment (such as fair values) as disclosed where appropriate in these financial statements. Other comprehensive income comprises items of income and expense (including reclassification adjustments) that are not recognised in profit or loss, as required or permitted by FRS. Reclassification adjustments are amounts reclassified to profit or loss in the current reporting year that were recognised in other comprehensive income in the current or previous reporting years.
Basis of preparation of the financial statements
The preparation of financial statements in conformity with generally accepted accounting principles requires the management to make estimates and assumptions that affect the reported amounts of assets and liabilities and disclosure of contingent assets and liabilities at the date of the financial statements and the reported amounts of revenues and expenses during the reporting year. Actual results could differ from those estimates. The estimates and assumptions are reviewed on an ongoing basis. Apart from those involving estimations, management has made judgements in the process of applying the entity’s accounting policies. The areas requiring management’s most difficult, subjective or complex judgements, or areas where assumptions and estimates are significant to the financial statements, are disclosed in Note 2B below, where applicable.

77
JAPFA LTD | Annual Report 2016
NOTES TO THE FINANCIAL STATEMENTS31 DECEMBER 2016
1. GENERAL (CONTINUED)
Basis of presentation
The consolidated financial statements include the financial statements made up to the end of the reporting year of the Company and all of its subsidiaries. The consolidated financial statements are the financial statements of the Group in which the assets, liabilities, equity, income, expenses and cash flows of the parent and its subsidiaries are presented as those of a single economic entity and are prepared using uniform accounting policies for like transactions and other events in similar circumstances. All significant intragroup balances and transactions, including income, expenses and cash flows are eliminated on consolidation. Subsidiaries are consolidated from the date the Group obtains control of the investee and cease when the Group loses control of the investee. Control exists when the Group has the power to govern the financial and operating policies so as to gain benefits from its activities.
Changes in the Group’s ownership interest in a subsidiary that do not result in the loss of control are accounted for within equity as transactions with owners in their capacity as owners. The carrying amounts of the Group’s and non-controlling interests are adjusted to reflect the changes in their relative interests in the subsidiary. When the Group loses control of a subsidiary it derecognises the assets and liabilities and related equity components of the former subsidiary. Any gain or loss is recognised in profit or loss. Any investment retained in the former subsidiary is measured at fair value at the date when control is lost and is subsequently accounted as available-for-sale financial assets in accordance with FRS 39.
The Company’s separate financial statements have been prepared on the same basis, and as permitted by the Act, the Company’s separate statement of profit or loss and other comprehensive income is not presented.
Segment reporting
The Group discloses financial and descriptive information about its consolidated reportable segments. Reportable segments are operating segments or aggregations of operating segments that meet specified criteria. Operating segments are components about which separate financial information is available that is evaluated regularly by the chief operating decision maker in deciding how to allocate resources and in assessing the performance. Generally, financial information is reported on the same basis as is used internally for evaluating operating segment performance and deciding how to allocate resources to operating segments.
2. SIGNIFICANT ACCOUNTING POLICIES AND OTHER EXPLANATORY INFORMATION
2A. Significant accounting policies
Revenue recognition
The revenue amount is the fair value of the consideration received or receivable from the gross inflow of economic benefits during the reporting year arising from the course of the activities of the entity and it is shown net of any related sales taxes and rebates. Revenue from the sale of goods is recognised when significant risks and rewards of ownership are transferred to the buyer, there is neither continuing managerial involvement to the degree usually associated with ownership nor effective control over the goods sold, and the amount of revenue and the costs incurred or to be incurred in respect of the transaction can be measured reliably. Rental income is recognised on a time-proportion basis that takes into account the effective yield on the asset on a straight-line basis over the lease term. Interest income or expense is recognised using the effective interest method. Dividend income from equity instruments is recognised when the entity’s right to receive payment is established.
78
Annual Report 2016 | JAPFA LTD
NOTES TO THE FINANCIAL STATEMENTS31 DECEMBER 2016
2. SIGNIFICANT ACCOUNTING POLICIES AND OTHER EXPLANATORY INFORMATION (CONTINUED)
2A. Significant accounting policies
Employee benefits
Contributions to a defined contribution retirement benefit plan are recorded as an expense as they fall due. The entity’s legal or constructive obligation is limited to the amount that it is obligated to contribute to an independently administered fund (such as the Central Provident Fund in Singapore, a government managed defined contribution retirement benefit plan).
Certain subsidiaries overseas have arrangements for defined benefit plans. Under the defined benefit plan contributions are set at a level that is expected to be sufficient to pay the benefits falling due in the same period; and future benefits earned during the current period will be paid out of future contributions and the employees’ benefits are determined by the length of their service and their salaries at the time of the pension. Remeasurements are reflected immediately in the statement of financial position with a charge or credit recognised in other comprehensive income in the period in which they occur and not to be reclassified to profit or loss. All other costs related to the defined benefit plan are recognised in profit or loss. Long term employee benefits liability recognised in the statement of financial position represents the present value of the defined benefit obligation reduced by the fair value of plan assets. Any asset (surplus) resulting from this calculation is limited to the present value of available refunds and reductions in future contributions to the plan. Such a plan creates actuarial risk for the entity: if the ultimate cost of benefits already earned at the end of the reporting period is more than expected, the entity will have either to increase its contributions or to persuade employees to accept a reduction in benefits.
For employee leave entitlement the expected cost of short-term employee benefits in the form of compensated absences is recognised in the case of accumulating compensated absences, when the employees render service that increases their entitlement to future compensated absences; and in the case of non-accumulating compensated absences, when the absences occur. A liability for bonuses is recognised where the entity is contractually obliged or where there is constructive obligation based on past practice.
Share-based compensation – Performance share plans
Benefits to employees are also provided in the form of share-based payment transactions, whereby employees render services in exchange for shares or rights over shares (‘‘equity-settled transactions’’). The fair value of the employee services rendered is measured by reference to the fair value of the shares awarded or rights granted, excluding the impact of any non-market vesting conditions. These are fair valued based on the market price of the entity’s shares (or an estimated market price, if the entity’s shares are not publicly traded). This fair value amount is charged to profit or loss over the vesting period of the share-based payment scheme, with the corresponding increase in equity. The value of the charge is adjusted in profit or loss over the remainder of the vesting period to reflect expected and actual quantities vesting, with the corresponding adjustment made in equity. If the employee is rendering the services for the award beginning on a date earlier than the grant date, the Group estimates the cost of the award and recognises such cost over a period starting with that earlier date. The Group adjusts the fair value estimate to the grant date when approval is given. Cancellations of grants of equity instruments during the vesting period (other than a grant cancelled by forfeiture when the vesting conditions are not satisfied) are accounted for as an acceleration of vesting, therefore any amount unrecognised that would otherwise have been charged is recognised immediately in profit or loss. For share-based payment awards with non-vesting conditions, the grant date fair value of the share-based payment is measured to reflect such conditions and there is no true-up for differences between expected and actual outcomes.
79
JAPFA LTD | Annual Report 2016
NOTES TO THE FINANCIAL STATEMENTS31 DECEMBER 2016
2. SIGNIFICANT ACCOUNTING POLICIES AND OTHER EXPLANATORY INFORMATION (CONTINUED)
2A. Significant accounting policies (continued)
Share-based compensation – Employee share option plans
Certain employees of the Group receive remuneration in the form of share options as consideration for services rendered. The cost of these equity-settled share based payment transactions with employees is measured by reference to the fair value of the options at the date on which the options are granted which takes into account market conditions and non-vesting conditions. This cost is recognised in the statement of profit or loss and other comprehensive income, with a corresponding increase in the employee share option reserve, over the vesting period. The cumulative expense recognised at each reporting date until the vesting date reflects the extent to which the vesting period has expired and the Group’s best estimate of the number of options that will ultimately vest. The charge or credit to the statement of profit or loss and other comprehensive income for a period represents the movement in cumulative expense recognised as at the beginning and end of that period and is recognised in employee benefits expense.
No expense is recognised for options that do not ultimately vest, except for options where vesting is conditional upon a market or non-vesting condition, which are treated as vested irrespective of whether or not the market condition or non-vesting condition is satisfied, provided that all other performance and/or service conditions are satisfied. In the case where the option does not vest as the result of a failure to meet a non-vesting condition that is within the control of the Group or the employee, it is accounted for as a cancellation. In such case, the amount of the compensation cost that otherwise would be recognised over the remainder of the vesting period is recognised immediately in the statement of comprehensive income upon cancellation. The employee share option reserve is transferred to retained earnings upon expiry of the share option.
Borrowing costs
Borrowing costs are interest and other costs incurred in connection with the borrowing of funds. The interest expense is calculated using the effective interest method. Borrowing costs are recognised as an expense in the period in which they are incurred except that borrowing costs that are directly attributable to the acquisition, construction or production of a qualifying asset that necessarily take a substantial period of time to get ready for their intended use or sale are capitalised as part of the cost of that asset until substantially all the activities necessary to prepare the qualifying asset for its intended use or sale are complete. Investment income earned on the temporary investment of specific borrowings pending their expenditure on qualifying assets is deducted from the borrowing costs eligible for capitalisation.
Foreign currency transactions
The functional currency is the United States dollars as it reflects the primary economic environment in which the entity operates. Transactions in foreign currencies are recorded in the functional currency at the rates ruling at the dates of the transactions. At each end of the reporting year, recorded monetary balances and balances measured at fair value that are denominated in non-functional currencies are reported at the rates ruling at the end of the reporting year and fair value measurement dates respectively. All realised and unrealised exchange adjustment gains and losses are dealt with in profit or loss. The presentation is in the functional currency.
Translation of financial statements of other entities
Each entity in the Group determines the appropriate functional currency as it reflects the primary economic environment in which the relevant reporting entity operates. In translating the financial statements of such an entity for incorporation in the consolidated financial statements in the presentation currency the assets and liabilities denominated in other currencies are translated at end of the reporting year rates of exchange and income and expense items for each statement presenting profit or loss and other comprehensive income are translated at average rates of exchange for the reporting year. The resulting translation adjustments (if any) are recognised in other comprehensive income and accumulated in a separate component of equity until the disposal of that relevant reporting entity.

80
Annual Report 2016 | JAPFA LTD
NOTES TO THE FINANCIAL STATEMENTS31 DECEMBER 2016
2. SIGNIFICANT ACCOUNTING POLICIES AND OTHER EXPLANATORY INFORMATION (CONTINUED)
2A. Significant accounting policies (continued)
Income tax
The income taxes are accounted using the asset and liability method that requires the recognition of taxes payable or refundable for the current year and deferred tax liabilities and assets for the future tax consequence of events that have been recognised in the financial statements or tax returns. The measurements of current and deferred tax liabilities and assets are based on provisions of the enacted or substantially enacted tax laws by the end of the reporting year; the effects of future changes in tax laws or rates are not anticipated. Tax expense (tax income) is the aggregate amount included in the determination of profit or loss for the reporting year in respect of current tax and deferred tax.
Current and deferred income taxes are recognised as income or as an expense in profit or loss unless the tax relates to items that are recognised in the same or a different period outside profit or loss. For such items recognised outside profit or loss the current tax and deferred tax are recognised (a) in other comprehensive income if the tax is related to an item recognised in other comprehensive income and (b) directly in equity if the tax is related to an item recognised directly in equity. Deferred tax assets and liabilities are offset when they relate to income taxes levied by the same income tax authority. The carrying amount of deferred tax assets is reviewed at each end of the reporting year and is reduced, if necessary, by the amount of any tax benefits that, based on available evidence, are not expected to be realised. A deferred tax amount is recognised for all temporary differences, unless the deferred tax amount arises from the initial recognition of an asset or liability in a transaction which (i) is not a business combination; and (ii) at the time of the transaction, affects neither accounting profit nor taxable profit (tax loss). A deferred tax liability or asset is recognised for all taxable temporary differences associated with investments in subsidiaries and joint arrangements except where the reporting entity is able to control the timing of the reversal of the taxable temporary difference and it is probable that the taxable temporary difference will not reverse in the foreseeable future or for deductible temporary differences, they will not reverse in the foreseeable future and they cannot be utilised against taxable profits.
Property, plant and equipment
Property, plant and equipment are carried at cost on initial recognition and after initial recognition at cost less any accumulated depreciation and any accumulated impairment losses. The gain or loss arising from the derecognition of an item of property, plant and equipment is measured as the difference between the net disposal proceeds, if any, and the carrying amount of the item and is recognised in profit or loss. The residual value and the useful life of an asset is reviewed at least at each end of the reporting year and, if expectations differ significantly from previous estimates, the changes are accounted for as a change in an accounting estimate, and the depreciation charge for the current and future periods are adjusted.
Cost also includes acquisition cost, borrowing cost capitalised and any cost directly attributable to bringing the asset or component to the location and condition necessary for it to be capable of operating in the manner intended by management. Subsequent costs are recognised as an asset only when it is probable that future economic benefits associated with the item will flow to the entity and the cost of the item can be measured reliably. All other repairs and maintenance are charged to profit or loss when they are incurred.
Depreciation is provided on a straight-line method to allocate the gross carrying amounts of the assets less their residual values over their estimated useful lives of each part of an item of these assets. The annual rates of depreciation are as follows:
Buildings and site facilities – 2% – 25% Machinery and equipment – 3.3% – 33.3% Office furniture and fixtures – 4.75% – 50%Motor vehicles – 9.5% – 33.3% Leasehold land – Over the remaining lease terms Freehold land – Not depreciated

81
JAPFA LTD | Annual Report 2016
NOTES TO THE FINANCIAL STATEMENTS31 DECEMBER 2016
2. SIGNIFICANT ACCOUNTING POLICIES AND OTHER EXPLANATORY INFORMATION (CONTINUED)
2A. Significant accounting policies (continued)
Property, plant and equipment (continued)
An asset is depreciated when it is available for use until it is derecognised even if during that period the item is idle. Fully depreciated assets still in use are retained in the financial statements.
Investment property
Investment property is property (land or a building or part of a building or both) owned or held under a finance lease to earn rentals or for capital appreciation or both, rather than for use in the production or supply of goods or services or for administrative purposes or sale in the ordinary course of business. It includes an investment property in the course of construction. After initial recognition at cost including transaction costs, the cost model is used to measure the investment property, that is, at cost less any accumulated depreciation and any accumulated impairment losses. An investment property that meets the criteria to be classified as held for sale is carried at the lower of carrying amount and fair value. For disclosure purposes only, the fair values are determined by management. Depreciation is computed on a straight-line basis over the estimated useful lives of the investment properties of 4 to 20 years.
Leases
Leases are classified as finance leases if substantially all the risks and rewards of ownership are transferred to the lessee. All other leases are classified as operating leases. At the commencement of the lease term, a finance lease is recognised as an asset and as a liability in the statement of financial position at amounts equal to the fair value of the leased asset or, if lower, the present value of the minimum lease payments, each determined at the inception of the lease. The discount rate used in calculating the present value of the minimum lease payments is the interest rate implicit in the lease, if this is practicable to determine, the lessee’s incremental borrowing rate is used. Any initial direct costs of the lessee are added to the amount recognised as an asset. The excess of the lease payments over the recorded lease liability are treated as finance charges which are allocated to each reporting year during the lease term so as to produce a constant periodic rate of interest on the remaining balance of the liability. Contingent rents are charged as expenses in the reporting years in which they are incurred. The assets are depreciated as owned depreciable assets. Leases where the lessor effectively retains substantially all the risks and benefits of ownership of the leased assets are classified as operating leases. For operating leases, lease payments are recognised as an expense in profit or loss on a straight-line basis over the term of the relevant lease unless another systematic basis is representative of the time pattern of the user’s benefit, even if the payments are not on that basis. Lease incentives received are recognised in profit or loss as an integral part of the total lease expense.
Intangible assets
An identifiable non-monetary asset without physical substance is recognised as an intangible asset at acquisition cost if it is probable that the expected future economic benefits that are attributable to the asset will flow to the entity and the cost of the asset can be measured reliably. After initial recognition, an intangible asset with finite useful life is carried at cost less any accumulated amortisation and any accumulated impairment losses. An intangible asset with an indefinite useful life is not amortised. An intangible asset is regarded as having an indefinite useful life when, based on an analysis of all of the relevant factors, there is no foreseeable limit to the period over which the asset is expected to generate net cash inflows for the entity.
The amortisable amount of an intangible asset with finite useful life is allocated on a systematic basis over the best estimate of its useful life from the point at which the asset is ready for use. The intangible assets are amortised on a straight line basis over their estimated useful lives as follows:
Formula and technology – 20 years Non-compete fees – 5 years Customer relationships – 6 yearsComputer software – 5 to 7 years

82
Annual Report 2016 | JAPFA LTD
NOTES TO THE FINANCIAL STATEMENTS31 DECEMBER 2016
2. SIGNIFICANT ACCOUNTING POLICIES AND OTHER EXPLANATORY INFORMATION (CONTINUED)
2A. Significant accounting policies (continued)
Intangible assets (continued)
Identifiable intangible assets acquired as part of a business combination are initially recognised separately from goodwill if the asset’s fair value can be measured reliably, irrespective of whether the asset had been recognised by the acquiree before the business combination. An intangible asset is considered identifiable only if it is separable or if it arises from contractual or other legal rights, regardless of whether those rights are transferable or separable from the entity or from other rights and obligations.
Biological assets
Biological assets include dairy cows and breeding livestock. Breeding livestock includes breeding chickens, breeding cattle and breeding swine.
Dairy cows, including milkable cows, heifers and calves are measured on initial recognition and at the end of the reporting year at their fair value less costs to sell, with any resultant gain or loss recognised in profit or loss for the year in which it arises. Costs to sell are the incremental costs directly attributable to the disposal of an asset, mainly transportation costs and excluding finance costs and income taxes. The fair value of dairy cows is determined based on its present location and condition and is determined independently by professional valuers. The fair value of dairy cows for which there are active markets is determined by reference to the quoted market prices. For dairy cows where there is no active market, fair value is determined by valuation techniques, for example discounted cash flow techniques, etc.
The feeding costs and other related costs including the depreciation charge, utilities cost and consumables incurred for raising of heifers and calves are capitalised, until such time as the heifers and calves begin to produce milk.
In general, the heifers are inseminated when heifers reach an age of approximately 14 months old. After an approximately 9 month pregnancy term, a calf is born and the dairy cow begins to produce raw milk and the lactation period begins.
Breeding chickens include grandparent stocks that produce hatchable eggs for parent stocks, and parent stocks that produce hatchable eggs for trade livestock inventories. Breeding chickens are classified as productive breeding chickens and unproductive breeding chickens. Unproductive breeding chickens are stated at acquisition costs plus accumulated growing costs. The accumulated costs of unproductive breeding chickens are reclassified to productive breeding chickens at the optimal production age. In general, unproductive broiler breeding chickens reach the optimal production age after 25 weeks and unproductive layer breeding chickens reach the optimal production age after 20 weeks. Productive breeding chickens are stated at cost at the time of reclassification from unproductive breeding chickens and are amortised over the economic egg-laying lives of the breeding chickens (42 – 52 weeks) after considering residual values.
Breeding cattle are cattle that are being nurtured for production of calves. Breeding cattle are classified as productive breeding cattle and unproductive cattle. Unproductive cattle are stated at acquisition costs plus accumulated growing costs. The accumulated costs of unproductive cattle are reclassified to productive cattle at the optimal productive age. In general, unproductive cattle reach the average optimal production age after 15 months. Productive cattle are measured on initial recognition and at the end of the reporting year at fair value less costs to sell, with any resultant gain or loss recognised in profit or loss for the year in which it arises.
Breeding swine are swine that are being nurtured for production of piglets. Breeding swine are classified as productive breeding swine and unproductive swine. Unproductive swine are stated at acquisition costs plus accumulated growing costs. The accumulated costs of unproductive swine are reclassified to productive swine at the optimal productive age. In general, immature swine are carefully selected to be classified as productive breeding swine based on a combination of the right age, body weight and physical / genetic qualities. Productive swine are measured on initial recognition and at the end of the reporting year at fair value less costs to sell, with any resultant gain or loss recognised in profit or loss for the year in which it arises.

83
JAPFA LTD | Annual Report 2016
NOTES TO THE FINANCIAL STATEMENTS31 DECEMBER 2016
2. SIGNIFICANT ACCOUNTING POLICIES AND OTHER EXPLANATORY INFORMATION (CONTINUED)
2A. Significant accounting policies (continued)
Biological assets (continued)
Forage plants are immature corn and sorghum plantation costs which consist of field preparation, planting, fertilising and maintenance and an allocation of other related costs. In general, a corn plantation and a sorghum plantation take about three months to reach maturity from the time the seedings are planted. Plantations in initial stages of growth are stated at cost as market-determined prices or values are not available. Plantations close to harvest and the harvested product of the Group’s wet corn and sorghum are measured at fair value less estimated point-of-sale costs. The fair value was determined based on the actual selling prices in the local market at the point of harvest and less estimated point-of-sale costs. Gains or losses arising on initial recognition of plantations at fair value less estimated point-of-sale costs and from the change in fair value less estimated point-of-sale costs of plantations at each reporting date are recognised in profit or loss for the year in which they arise. Upon harvest, the forage plants are transferred to inventories for feeding of the dairy cows.
Subsidiaries
A subsidiary is an entity including unincorporated and special purpose entity that is controlled by the reporting entity and the reporting entity is exposed, or has rights, to variable returns from its involvement with the investee and has the ability to affect those returns through its power over the investee. The existence and effect of substantive potential voting rights that the reporting entity has the practical ability to exercise (that is, substantive rights) are considered when assessing whether the reporting entity controls another entity.
In the Company’s separate financial statements, an investment in a subsidiary is accounted for at cost less any allowance for impairment in value. Impairment loss recognised in profit or loss for a subsidiary is reversed only if there has been a change in the estimates used to determine the asset’s recoverable amount since the last impairment loss was recognised. The carrying value and the net book value of the investment in a subsidiary are not necessarily indicative of the amount that would be realised in a current market exchange.
Joint arrangements – joint venture
A joint arrangement (that is, either a joint operation or a joint venture, depending on the rights and obligations of the jointly controlling parties to the arrangement), is one in which the reporting entity is party to an arrangement of which two or more parties have joint control, which is the contractually agreed sharing of control of the arrangement; it exists only when decisions about the relevant activities (that is, activities that significantly affect the returns of the arrangement) require the unanimous consent of the parties sharing control. In a joint venture, the parties with joint control have rights to the net assets of the arrangement.
In the consolidated financial statements, the accounting for investments in a joint venture is on the equity method. Under the equity method the investment is initially recognised at cost and adjusted thereafter for the post-acquisition change in the investor’s share of the investee’s net assets. The carrying value and the net book value of the investment in the joint venture are not necessarily indicative of the amounts that would be realised in a current market exchange. The investor’s profit or loss includes its share of the investee’s profit or loss and the investor’s other comprehensive income includes its share of the investee’s other comprehensive income. Losses of a joint venture in excess of the reporting entity’s interest in the relevant joint venture are not recognised except to the extent that the reporting entity has an obligation. Profits and losses resulting from transactions between the reporting entity and a joint venture is recognised in the financial statements only to the extent of unrelated reporting entity’s interests in the joint venture. Unrealised losses are also eliminated unless the transaction provides evidence of an impairment of the asset transferred. Accounting policies of joint venture are changed where necessary to ensure consistency with the policies adopted by the reporting entity. The reporting entity discontinues the use of the equity method from the date that when its investment ceases to be a joint venture and accounts for the investment in accordance with FRS 39 from that date. Any gain or loss is recognised in profit or loss. Any investment retained in the former joint venture is measured at fair value at the date that it ceases to be a joint venture.

84
Annual Report 2016 | JAPFA LTD
NOTES TO THE FINANCIAL STATEMENTS31 DECEMBER 2016
2. SIGNIFICANT ACCOUNTING POLICIES AND OTHER EXPLANATORY INFORMATION (CONTINUED)
2A. Significant accounting policies (continued)
Joint arrangements – joint venture (continued)
In the Company’s separate financial statements, an investment in a joint venture is accounted for at cost less any allowance for impairment in value. Impairment loss recognised in profit or loss for a joint venture is reversed only if there has been a change in the estimates used to determine the asset’s recoverable amount since the last impairment loss was recognised. The carrying value and the net book value of an investment in the joint venture are not necessarily indicative of the amounts that would be realised in a current market exchange.
Business combinations
The business combination involved entities or businesses under common control that is, a business combination in which all of the combining entities or businesses are ultimately controlled by the same party or parties both before and after the business combination, and that control is not transitory. The business combination in such situation is accounted for under the pooling-of-interests or merger method. Such manner of presentation reflects the economic substance of the combined entities as a single economic enterprise.
For entities not under common control, business combinations are accounted for by applying the acquisition method.
Where the fair values are estimated on a provisional basis they are finalised within one year from the acquisition date with consequent retrospective changes to the amounts recognised at the acquisition date to reflect new information obtained about facts and circumstances that existed as of the acquisition date and, if known, would have affected the measurement of the amounts recognised as of that date.
Goodwill and fair value adjustments resulting from the application of acquisition method at the date of acquisition are treated as assets and liabilities of the foreign entity and are recorded at the exchange rates prevailing at the acquisition date and are subsequently translated at the period end exchange rate.
Non-controlling interests
The non-controlling interest is equity in a subsidiary not attributable, directly or indirectly, to the reporting entity as the parent. The non-controlling interest is presented in the consolidated statement of financial position within equity, separately from the equity of the owners of the parent. For each business combination, any non-controlling interest in the acquiree (subsidiary) is initially measured either at fair value or at the non-controlling interest’s proportionate share of the acquiree’s identifiable net assets. Where the non-controlling interest is measured at fair value, the valuation techniques and key model inputs used are disclosed in the relevant note. Profit or loss and each component of other comprehensive income are attributed to the owners of the parent and to the non-controlling interests. Total comprehensive income is attributed to the owners of the parent and to the non-controlling interests even if this results in the non-controlling interests having a deficit balance.
85
JAPFA LTD | Annual Report 2016
NOTES TO THE FINANCIAL STATEMENTS31 DECEMBER 2016
2. SIGNIFICANT ACCOUNTING POLICIES AND OTHER EXPLANATORY INFORMATION (CONTINUED)
2A. Significant accounting policies (continued)
Goodwill
Goodwill is an asset representing the future economic benefits arising from other assets acquired in a business combination that are not individually identified and separately recognised. Goodwill is recognised as of the acquisition date measured as the excess of (a) over (b); (a) being the aggregate of: (i) the consideration transferred which generally requires acquisition-date fair value; (ii) the amount of any non-controlling interest in the acquiree measured in accordance with FRS 103 (measured either at fair value or as the non-controlling interest’s proportionate share of the acquiree’s net identifiable assets); and (iii) in a business combination achieved in stages, the acquisition-date fair value of the acquirer’s previously held equity interest in the acquiree; and (b) being the net of the acquisition-date amounts of the identifiable assets acquired and the liabilities assumed measured in accordance with this FRS 103.
After initial recognition, goodwill acquired in a business combination is measured at cost less any accumulated impairment losses. Goodwill is not amortised. Irrespective of whether there is any indication of impairment, goodwill and also any intangible asset with an indefinite useful life or an intangible asset not yet available for use are tested for impairment at least annually. Goodwill impairment is not reversed in any circumstances.
For the purpose of impairment testing and since the acquisition date of the business combination, goodwill is allocated to each cash-generating unit, or groups of cash-generating units that are expected to benefit from the synergies of the combination, irrespective of whether other assets or liabilities of the acquiree were assigned to those units or groups of units. Each unit or group of units to which the goodwill is so allocated represents the lowest level within the entity at which the goodwill is monitored for internal management purposes and is not larger than a segment.
Impairment of non-financial assets
Irrespective of whether there is any indication of impairment, an annual impairment test is performed at the same time every year on an intangible asset with an indefinite useful life or an intangible asset not yet available for use. The carrying amount of other non-financial assets is reviewed at each end of the reporting year for indications of impairment and where an asset is impaired, it is written down through profit or loss to its estimated recoverable amount. The impairment loss is the excess of the carrying amount over the recoverable amount and is recognised in profit or loss. The recoverable amount of an asset or a cash-generating unit is the higher of its fair value less costs of disposal and its value in use. When the fair value less costs of disposal method is used, any available recent market transactions are taken into consideration. When the value in use method is adopted, in assessing the value in use, the estimated future cash flows are discounted to their present value using a pre-tax discount rate that reflects current market assessments of the time value of money and the risks specific to the asset. For the purposes of assessing impairment, assets are grouped at the lowest levels for which there are separately identifiable cash flows (cash-generating units). At each end of the reporting year non-financial assets other than goodwill with impairment loss recognised in prior periods are assessed for possible reversal of the impairment. An impairment loss is reversed only to the extent that the asset’s carrying amount does not exceed the carrying amount that would have been measured, net of depreciation or amortisation, if no impairment loss had been recognised.

86
Annual Report 2016 | JAPFA LTD
NOTES TO THE FINANCIAL STATEMENTS31 DECEMBER 2016
2. SIGNIFICANT ACCOUNTING POLICIES AND OTHER EXPLANATORY INFORMATION (CONTINUED)
2A. Significant accounting policies (continued)
Inventories
Inventories are measured at the lower of cost (weighted average method) and net realisable value. Net realisable value is the estimated selling price in the ordinary course of business less the estimated costs of completion and the estimated costs necessary to make the sale. A write down on cost is made where the cost is not recoverable or if the selling prices have declined. Cost includes all costs of purchase, costs of conversion and other costs incurred in bringing the inventories to their present location and condition. In the case of manufactured inventories and work-in-progress, cost includes an appropriate share of overheads based on normal operating capacity.
Financial assets
Initial recognition, measurement and derecognition:
A financial asset is recognised on the statement of financial position when, and only when, the entity becomes a party to the contractual provisions of the instrument. The initial recognition of financial assets is at fair value normally represented by the transaction price. The transaction price for financial asset not classified at fair value through profit or loss includes the transaction costs that are directly attributable to the acquisition or issue of the financial asset. Transaction costs incurred on the acquisition or issue of financial assets classified at fair value through profit or loss are expensed immediately. The transactions are recorded at the trade date. When the settlement date accounting is applied, any change in the fair value of the asset to be received during the period between the trade date and the settlement date is recognised in net profit or loss for assets classified as trading.
Irrespective of the legal form of the transactions performed, financial assets are derecognised when they pass the “substance over form” based on the derecognition test prescribed by FRS 39 relating to the transfer of risks and rewards of ownership and the transfer of control. Financial assets and financial liabilities are offset and the net amount is reported in the statement of financial position if there is currently a legally enforceable right to offset the recognised amounts and there is an intention to settle on a net basis, to realise the assets and settle the liabilities simultaneously.
Subsequent measurement:
Subsequent measurement based on the classification of the financial assets in one of the following four categories under FRS 39 is as follows:
#1. Financial assets at fair value through profit or loss: Assets are classified in this category when they are incurred principally for the purpose of selling or repurchasing in the near term (trading assets) or are derivatives (except for a derivative that is a designated and effective hedging instrument) or have been classified in this category because the conditions are met to use the “fair value option” and it is used. All changes in fair value relating to assets at fair value through profit or loss are recognised directly in profit or loss.

87
JAPFA LTD | Annual Report 2016
NOTES TO THE FINANCIAL STATEMENTS31 DECEMBER 2016
2. SIGNIFICANT ACCOUNTING POLICIES AND OTHER EXPLANATORY INFORMATION (CONTINUED)
2A. Significant accounting policies (continued)
Financial assets (continued)
Subsequent measurement (continued):
#2. Loans and receivables: Loans and receivables are non-derivative financial assets with fixed or determinable payments that are not quoted in an active market. Assets that are for sale immediately or in the near term are not classified in this category. These assets are carried at amortised costs using the effective interest method (except that short-duration receivables with no stated interest rate are normally measured at original invoice amount unless the effect of imputing interest would be significant) minus any reduction (directly or through the use of an allowance account) for impairment or uncollectibility. Impairment charges are provided only when there is objective evidence that an impairment loss has been incurred as a result of one or more events that occurred after the initial recognition of the asset (a ‘loss event’) and that loss event (or events) has an impact on the estimated future cash flows of the financial asset or group of financial assets that can be reliably estimated. The methodology ensures that an impairment loss is not recognised on the initial recognition of an asset. Losses expected as a result of future events, no matter how likely, are not recognised. For impairment, the carrying amount of the asset is reduced through use of an allowance account. The amount of the loss is recognised in profit or loss. An impairment loss is reversed if the reversal can be related objectively to an event occurring after the impairment loss was recognised. Typically the trade and other receivables are classified in this category.
#3. Held-to-maturity financial assets: As at end of the reporting year, there were no financial assets classified in this category.
#4. Available-for-sale financial assets:These are non-derivative financial assets that are designated as available-for-sale on initial recognition or are not classified in one of the previous categories. These assets are carried at fair value. Changes in fair value of available-for-sale financial assets (other than those relating to foreign exchange translation differences on monetary investments) are recognised in other comprehensive income and accumulated in a separate component of equity under the heading revaluation reserves. Such reserves are reclassified to profit or loss when realised through disposal. When there is objective evidence that the asset is impaired, the cumulative loss is reclassified from equity to profit or loss as a reclassification adjustment. A significant or prolonged decline in the fair value of the investment below its cost is considered to be objective evidence of impairment. If, in a subsequent period, the fair value of an equity instrument classified as available-for-sale increases and the increase can be objectively related to an event occurring after the impairment loss, it is reversed against revaluation reserves and is not subsequently reversed through profit or loss. However for debt instruments classified as available-for-sale impairment losses recognised in profit or loss are subsequently reversed if an increase in the fair value of the instrument can be objectively related to an event occurring after the recognition of the impairment loss.

88
Annual Report 2016 | JAPFA LTD
NOTES TO THE FINANCIAL STATEMENTS31 DECEMBER 2016
2. SIGNIFICANT ACCOUNTING POLICIES AND OTHER EXPLANATORY INFORMATION (CONTINUED)
2A. Significant accounting policies (continued)
Financial assets (continued)
Subsequent measurement (continued):
#4. Available-for-sale financial assets (continued):For non-equity instruments classified as available-for-sale the reversal of impairment is recognised in profit or loss. The weighted average method is used when determining the cost basis of publicly listed equities being disposed of. Usually non-current investments in equity shares and debt securities are classified in this category but it does not include subsidiaries, joint ventures, or associates. Unquoted investments are stated at cost less allowance for impairment in value where there are no market prices, and management is unable to establish fair value by using valuation techniques except that where management can establish fair value by using valuation techniques the relevant unquoted investments are stated at fair value. For unquoted equity instruments impairment losses are not reversed.
Cash and cash equivalents
Cash and cash equivalents include bank and cash balances and on demand deposits. For the consolidated statement of cash flows the item includes cash and cash equivalents less cash subject to restriction, if any.
Financial liabilities
Initial recognition, measurement and derecognition:
A financial liability is recognised on the statement of financial position when, and only when, the entity becomes a party to the contractual provisions of the instrument and it is derecognised when the obligation specified in the contract is discharged or cancelled or expired. The initial recognition of financial liability is at fair value normally represented by the transaction price. The transaction price for financial liability not classified at fair value through profit or loss includes the transaction costs that are directly attributable to the acquisition or issue of the financial liability. Transaction costs incurred on the acquisition or issue of financial liability classified at fair value through profit or loss are expensed immediately. The transactions are recorded at the trade date.
Subsequent measurement:
Subsequent measurement based on the classification of the financial liabilities in one of the following two categories under FRS 39 is as follows:
#1. Liabilities at fair value through profit or loss:Liabilities are classified in this category when they are incurred principally for the purpose of selling or repurchasing in the near term (trading liabilities) or are derivatives (except for a derivative that is a designated and effective hedging instrument) or have been classified in this category because the conditions are met to use the “fair value option” and it is used. All changes in fair value relating to liabilities at fair value through profit or loss are charged to profit or loss as incurred.
#2. Other financial liabilities: All liabilities, which have not been classified in the previous category fall into this residual category. These liabilities are carried at amortised cost using the effective interest method.

89
JAPFA LTD | Annual Report 2016
NOTES TO THE FINANCIAL STATEMENTS31 DECEMBER 2016
2. SIGNIFICANT ACCOUNTING POLICIES AND OTHER EXPLANATORY INFORMATION (CONTINUED)
2A. Significant accounting policies (continued)
Put option financial liabilities
Where the Group writes put options with non-controlling shareholders of subsidiaries, entitling them to sell their equity interests in the subsidiaries back to the Group for settlement in cash or another financial asset, within a stipulated period upon the non-occurrence of specified events, the Group recognises a liability based on the present value of the redemption amount of the put options. Subsequent to initial recognition of the financial liability, the Group has adopted an accounting policy choice to recognise the changes in the present value of the put option financial liabilities in equity as the transaction is within equity holders. If the put option expires unexercised, then the put option financial liability is reversed against the equity.
Derivatives
All derivatives are initially recognised and subsequently carried at fair value. Certain derivatives are entered into in order to hedge some transactions and all the strict hedging criteria prescribed by FRS 39 are not met. In those cases, even though the transaction has its economic and business rationale, hedge accounting cannot be applied. As a result, changes in the fair value of those derivatives are recognised directly in profit or loss and the hedged item follows normal accounting policies.
Fair value measurement
Fair value is taken to be the price that would be received to sell an asset or paid to transfer a liability in an orderly transaction between market participants at the measurement date (that is, an exit price). It is a market-based measurement, not an entity-specific measurement. When measuring fair value, management uses the assumptions that market participants would use when pricing the asset or liability under current market conditions, including assumptions about risk. The entity’s intention to hold an asset or to settle or otherwise fulfil a liability is not taken into account as relevant when measuring fair value. In making the fair value measurement, management determines the following: (a) the particular asset or liability being measured (these are identified and disclosed in the relevant notes below); (b) for a non-financial asset, the highest and best use of the asset and whether the asset is used in combination with other assets or on a stand-alone basis; (c) the market in which an orderly transaction would take place for the asset or liability; and (d) the appropriate valuation techniques to use when measuring fair value. The valuation techniques used maximise the use of relevant observable inputs and minimise unobservable inputs. These inputs are consistent with the inputs a market participant may use when pricing the asset or liability.
The fair value measurements and related disclosures categorise the inputs to valuation techniques used to measure fair value by using a fair value hierarchy of three levels. These are recurring fair value measurements unless stated otherwise in the relevant notes to the financial statements. Level 1 inputs are quoted prices (unadjusted) in active markets for identical assets or liabilities that the entity can access at the measurement date. Level 2 inputs are inputs other than quoted prices included within Level 1 that are observable for the asset or liability, either directly or indirectly. Level 3 inputs are unobservable inputs for the asset or liability. The level is measured on the basis of the lowest level input that is significant to the fair value measurement in its entirety. Transfers between levels of the fair value hierarchy are deemed to have occurred at the beginning of the reporting year. If a financial instrument measured at fair value has a bid price and an ask price, the price within the bid-ask spread or mid-market pricing that is most representative of fair value in the circumstances is used to measure fair value regardless of where the input is categorised within the fair value hierarchy. If there is no market, or the markets available are not active, the fair value is established by using an acceptable valuation technique.

90
Annual Report 2016 | JAPFA LTD
NOTES TO THE FINANCIAL STATEMENTS31 DECEMBER 2016
2. SIGNIFICANT ACCOUNTING POLICIES AND OTHER EXPLANATORY INFORMATION (CONTINUED)
2A. Significant accounting policies (continued)
Fair value measurement (continued)
The carrying values of current financial instruments approximate their fair values due to the short-term maturity of these instruments and the disclosures of fair value are not made when the carrying amount of current financial instruments is a reasonable approximation of the fair value. The fair values of non-current financial instruments may not be disclosed separately unless there are significant differences at the end of the reporting year and in the event the fair values are disclosed in the relevant notes to the financial statements.
Provisions
A liability or provision is recognised when there is a present obligation (legal or constructive) as a result of a past event, it is probable that an outflow of resources embodying economic benefits will be required to settle the obligation and a reliable estimate can be made of the amount of the obligation. A provision is made using best estimates of the amount required in settlement and where the effect of the time value of money is material, the amount recognised is the present value of the expenditures expected to be required to settle the obligation using a pre-tax rate that reflects current market assessments of the time value of money and the risks specific to the obligation. The increase in the provision due to passage of time is recognised as interest expense. Changes in estimates are reflected in profit or loss in the reporting year they occur.
2B. Critical judgements, assumptions and estimation uncertainties
The critical judgements made in the process of applying the accounting policies that have the most significant effect on the amounts recognised in the financial statements and the key assumptions concerning the future, and other key sources of estimation uncertainty at the end of the reporting year, that have a significant risk of causing a material adjustment to the carrying amounts of assets and liabilities currently or within the next reporting year are discussed below. These estimates and assumptions are periodically monitored to ensure they incorporate all relevant information available at the date when financial statements are prepared. However, this does not prevent actual figures differing from estimates.
Fair value of biological assets:Biological assets are measured at fair value less costs to sell. In measuring the fair value of the biological assets, such as dairy cows, breeding cattle and swine, the fair value is measured based on either the market determined prices as at the end of the reporting year adjusted with reference to the species, age, growing condition, costs incurred and expected yield to reflect differences in characteristics and/or stages of growth of the biological assets; or the present value of expected net cash flows from the biological assets discounted at a current market-determined rate, when market-determined prices are unavailable. Any change in the estimates may affect the fair value of the biological assets significantly. The professional valuers and management review the assumptions and estimates to identify any significant change in the fair value of the biological assets.
Valuation of AIH Put Option and AIH2 Put Option financial liabilities:As disclosed in Notes 17B and 27 to the financial statements, the financial liabilities in relation to AIH and AIH2 Put Options are measured at the present value of the redemption amounts, for which the value is subject to significant judgement and estimation uncertainty. Any change in the assumptions may affect the values of AIH and AIH2 Put Option financial liabilities significantly.

91
JAPFA LTD | Annual Report 2016
NOTES TO THE FINANCIAL STATEMENTS31 DECEMBER 2016
2. SIGNIFICANT ACCOUNTING POLICIES AND OTHER EXPLANATORY INFORMATION (CONTINUED)
2B. Critical judgements, assumptions and estimation uncertainties (continued)
Income taxes:The Group operates in a number of jurisdictions, including Indonesia, China, India, Vietnam, Myanmar and Singapore. Significant judgement is involved in determining the Group-wide provision for income taxes. There are certain transactions and computations for which the ultimate determination is uncertain during the ordinary course of business. The administration and enforcement of tax laws and regulations may be subject to uncertainty and a certain degree of discretion by the tax authorities in these countries. Although the Group believes the amounts recognised for income and deferred taxes are adequate, these amounts may be insufficient based on the respective countries’ tax authorities interpretation and application of these laws and regulations and the Group may be required to pay more as a result. It is impracticable to determine the extent of the possible effects of the above, if any, on the consolidated financial statements of the Group. The Group recognises liabilities for expected tax issues based on estimates of whether additional taxes will be due. Where the final tax outcome of these matters is different from the amounts that were initially recognised, such differences will have an impact on the income tax and deferred tax provisions in the period in which such determination is made.
Measurement of impairment of subsidiaries:Where an investee is in net equity deficit and or has suffered losses a test is made whether the investment in the investee has suffered any impairment. This measurement requires significant judgement. An estimate is made of the future profitability of the investee, and the financial health of and near-term business outlook for the investee, including factors such as industry and sector performance, and operational and financing cash flow. It is impracticable to disclose the extent of the possible effects. It is reasonably possible, based on existing knowledge, that outcomes within the next reporting year that are different from assumptions could require a material adjustment to the carrying amount of the asset or liability affected. The carrying amount of the specific asset or liability (or class of assets or liabilities) at the end of the reporting year affected by the assumption is US$9,151,000 (2015: US$82,305,000).
3. RELATED PARTY RELATIONSHIPS AND TRANSACTIONS
FRS 24 on related party disclosures requires the reporting entity to disclose: (a) transactions with its related parties; and (b) relationships between parents and subsidiaries irrespective of whether there have been transactions between those related parties. A party is related to a party if the party controls, or is controlled by, or can significantly influence or is significantly influenced by the other party.
The ultimate controlling party is Mr Handojo Santosa @ Kang Kiem Han, a director and controlling shareholder of the Company.
3A. Members of a group
Name Relationship Country of incorporation
Rangi Management Limited Immediate parent company British Virgin Islands
Fusion Investment Holdings Limited Ultimate parent company British Virgin Islands
Related parties in these financial statements include the members of the ultimate parent company’s group of companies.

92
Annual Report 2016 | JAPFA LTD
NOTES TO THE FINANCIAL STATEMENTS31 DECEMBER 2016
3. RELATED PARTY RELATIONSHIPS AND TRANSACTIONS (CONTINUED)
3B. Related party transactions
There are transactions and arrangements between the Group and its related parties and the effects of these on the basis determined between the parties are reflected in these financial statements. The related party balances and financial guarantee if any are unsecured, without fixed repayment terms and interest or charge unless stated otherwise.
Intragroup transactions and balances that have been eliminated in these consolidated financial statements are not disclosed as related party transactions and balances below. Significant related party transactions:
In addition to the transactions and balances disclosed elsewhere in the notes to the financial statements, this item includes the following:
2016US$’000
2015US$’000
Revenue (619) (542)
Purchases of goods 10,916 5,637
Rendering of services expense 957 10,169
Insurance expense 1,351 –
Rental of premises 1,543 1,758
Rental of boat 677 381
Purchase of property, plant and equipment 72 1,337
Construction of property, plant and equipment 1,557 6,551
Others 182 541
The related parties are either the joint ventures entities or companies associated with the Executive Deputy Chairman, Mr Handojo Santosa @ Kang Kiem Han and the Non-Executive Director, Mr Hendrick Kolonas.
3C. Key management compensation
Group
2016US$’000
2015US$’000
Salaries and other short-term employee benefits 9,607 9,551Post-employment benefits 72 58Share-based payments: Performance share plan 3,033 –Share-based payments: Employee share option plan 153 –
The above amounts are included under employee benefits expense. Included in the above amounts are the following items:
Group
2016US$’000
2015US$’000
Remuneration of directors and commissioners of the Group 8,831 5,523
Fees to directors of the Company 365 428
Key management personnel of the Group are the directors and those persons having authority and responsibility for planning, directing and controlling the activities of the Group, directly or indirectly. The above amounts for key management compensation are for all directors and commissioners of the Indonesian subsidiaries.

93
JAPFA LTD | Annual Report 2016
NOTES TO THE FINANCIAL STATEMENTS31 DECEMBER 2016
4. FINANCIAL INFORMATION BY OPERATING SEGMENTS
4A. Information about reportable segment profit or loss, assets and liabilities
Disclosure of information about operating segments, products and services, the geographical areas, and the major customers are made as required by FRS 108 Operating Segments. This disclosure standard has no impact on the reported performance or financial position of the reporting entity.
For management purposes the reporting entity is organised into the following major strategic operating segments that offer different products and services: (1) animal protein, (2) dairy, (3) consumer food and (4) others. Such a structural organisation is determined by the nature of risks and returns associated with each business segment and it defines the management structure as well as the internal reporting system. It represents the basis on which the management reports the primary segment information that is available and that is evaluated regularly by the chief operating decision maker in deciding how to allocate resources and in assessing the performance. They are managed separately because each business requires different strategies.
Two or more operating segments may be aggregated into a single operating segment if in the judgement of management the segments have similar economic characteristics, and the segments are similar in some aspects such as the nature of the products and services; production processes; type or class of customer; distribution methods.
The segments and the types of products and services are as follows:
The animal protein segment includes production of multiple high-quality animal proteins, including poultry, swine, beef and aquaculture, as well as high-quality animal feed, across the Group’s target markets as follows:
(a) “Animal Protein Indonesia” refers to the animal protein operations of its public listed subsidiary, PT Japfa Comfeed Indonesia Tbk; and
(b) “Animal Protein Other” refers to the animal protein operations in Vietnam, India, Myanmar and China.
The dairy segment includes production of premium raw milk in China and Indonesia and premium downstream milk products such as premium fresh milk, premium UHT milk and premium cheeses to consumers in Indonesia and other countries in Asia.
The consumer food segment uses the animal protein products that are produced in-house as raw materials for downstream consumer food segment.
Others include corporate office, central purchasing office and consolidation adjustments which are not directly attributable to a particular business segment above.
Inter-segment sales are measured on the basis that the entity actually used to price the transfers. Internal transfer pricing policies of the reporting entity are as far as practicable based on market prices. The accounting policies of the operating segments are the same as those described in the significant accounting policies.
The management reporting system evaluates performances based on operating profit or loss and is measured in the same way as operating profit or loss in the consolidated financial statements.
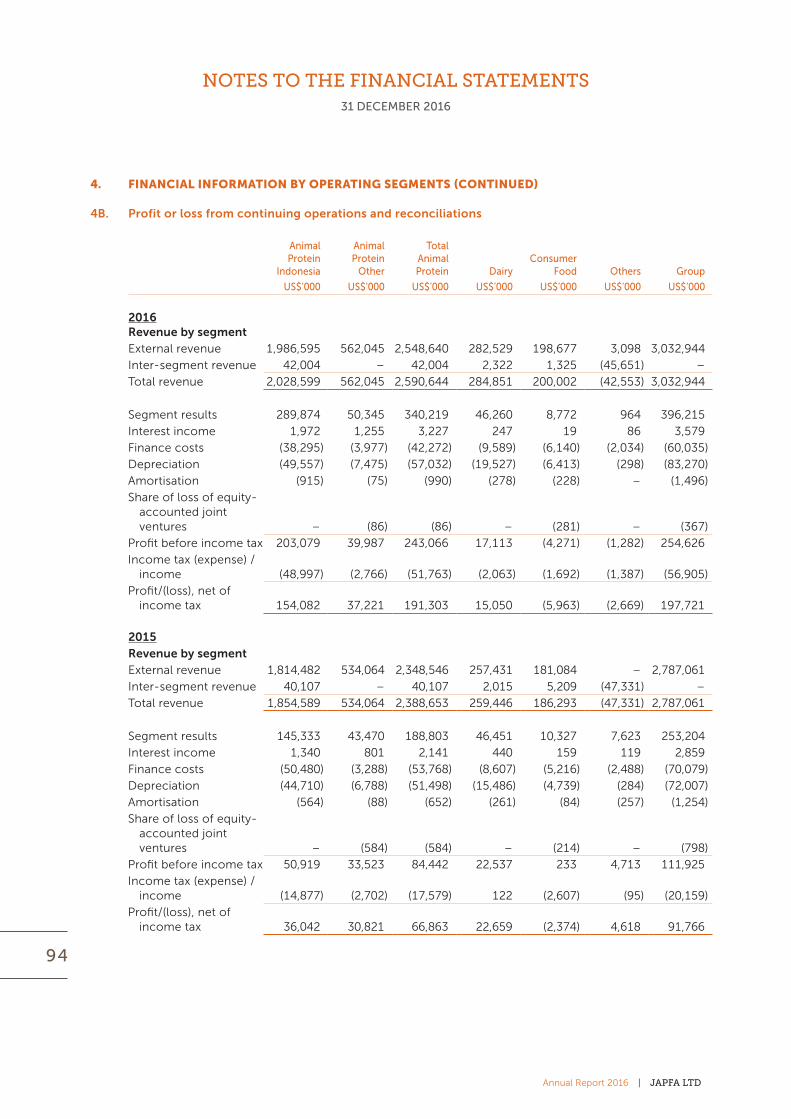
94
Annual Report 2016 | JAPFA LTD
NOTES TO THE FINANCIAL STATEMENTS31 DECEMBER 2016
4. FINANCIAL INFORMATION BY OPERATING SEGMENTS (CONTINUED)
4B. Profit or loss from continuing operations and reconciliations
Animal Protein
Indonesia
AnimalProtein
Other
TotalAnimal Protein Dairy
Consumer Food Others Group
US$’000 US$’000 US$’000 US$’000 US$’000 US$’000 US$’000
2016Revenue by segmentExternal revenue 1,986,595 562,045 2,548,640 282,529 198,677 3,098 3,032,944
Inter-segment revenue 42,004 – 42,004 2,322 1,325 (45,651) –
Total revenue 2,028,599 562,045 2,590,644 284,851 200,002 (42,553) 3,032,944
Segment results 289,874 50,345 340,219 46,260 8,772 964 396,215
Interest income 1,972 1,255 3,227 247 19 86 3,579
Finance costs (38,295) (3,977) (42,272) (9,589) (6,140) (2,034) (60,035)
Depreciation (49,557) (7,475) (57,032) (19,527) (6,413) (298) (83,270)
Amortisation (915) (75) (990) (278) (228) – (1,496)
Share of loss of equity-accounted joint ventures – (86) (86) – (281) – (367)
Profit before income tax 203,079 39,987 243,066 17,113 (4,271) (1,282) 254,626
Income tax (expense) / income (48,997) (2,766) (51,763) (2,063) (1,692) (1,387) (56,905)
Profit/(loss), net of income tax 154,082 37,221 191,303 15,050 (5,963) (2,669) 197,721
2015
Revenue by segmentExternal revenue 1,814,482 534,064 2,348,546 257,431 181,084 – 2,787,061
Inter-segment revenue 40,107 – 40,107 2,015 5,209 (47,331) –
Total revenue 1,854,589 534,064 2,388,653 259,446 186,293 (47,331) 2,787,061
Segment results 145,333 43,470 188,803 46,451 10,327 7,623 253,204
Interest income 1,340 801 2,141 440 159 119 2,859
Finance costs (50,480) (3,288) (53,768) (8,607) (5,216) (2,488) (70,079)
Depreciation (44,710) (6,788) (51,498) (15,486) (4,739) (284) (72,007)
Amortisation (564) (88) (652) (261) (84) (257) (1,254)
Share of loss of equity-accounted joint ventures – (584) (584) – (214) – (798)
Profit before income tax 50,919 33,523 84,442 22,537 233 4,713 111,925
Income tax (expense) / income (14,877) (2,702) (17,579) 122 (2,607) (95) (20,159)
Profit/(loss), net of income tax 36,042 30,821 66,863 22,659 (2,374) 4,618 91,766

95
JAPFA LTD | Annual Report 2016
NOTES TO THE FINANCIAL STATEMENTS31 DECEMBER 2016
4. FINANCIAL INFORMATION BY OPERATING SEGMENTS (CONTINUED)
4C. Assets and reconciliations
Animal Protein
Indonesia
AnimalProtein
Other
TotalAnimal Protein Dairy
Consumer Food Others Group
US$’000 US$’000 US$’000 US$’000 US$’000 US$’000 US$’000
2016Segment assets 1,287,458 300,574 1,588,032 727,803 124,275 39,482 2,479,592
Unallocated assets 37,729 3,109 40,838 2,922 1,820 12 45,592
Total Group assets 1,325,187 303,683 1,628,870 730,725 126,095 39,494 2,525,184
2015Segment assets 1,145,999 284,565 1,430,564 598,454 107,295 19,974 2,156,287
Unallocated assets 48,213 3,362 51,575 2,964 1,732 29 56,300
Total Group assets 1,194,212 287,927 1,482,139 601,418 109,027 20,003 2,212,587
Unallocated assets comprise mainly goodwill, deferred tax assets and prepaid tax.
4D. Liabilities and reconciliations
Animal Protein
Indonesia
AnimalProtein
Other
TotalAnimal Protein Dairy
Consumer Food Others Group
US$’000 US$’000 US$’000 US$’000 US$’000 US$’000 US$’000
2016Segment liabilities 722,272 143,165 865,437 330,366 90,569 128,993 1,415,365
Unallocated liabilities 13,562 2,189 15,751 1,989 963 1,927 20,630
Total Group liabilities 735,834 145,354 881,188 332,355 91,532 130,920 1,435,995
2015Segment liabilities 786,681 210,800 997,481 216,103 152,088 1,688 1,367,360
Unallocated liabilities 11,863 1,874 13,737 1,893 803 1,124 17,557
Total Group liabilities 798,544 212,674 1,011,218 217,996 152,891 2,812 1,384,917
Unallocated liabilities comprise mainly tax payable and deferred tax liabilities.
4E. Other material items and reconciliations
Animal Protein
Indonesia
AnimalProtein
Other
TotalAnimal Protein Dairy
Consumer Food Others Group
US$’000 US$’000 US$’000 US$’000 US$’000 US$’000 US$’000
Capital expenditure
2016 59,531 24,303 83,834 84,696 13,212 402 182,144
2015 53,769 21,289 75,058 70,788 3,483 198 149,527
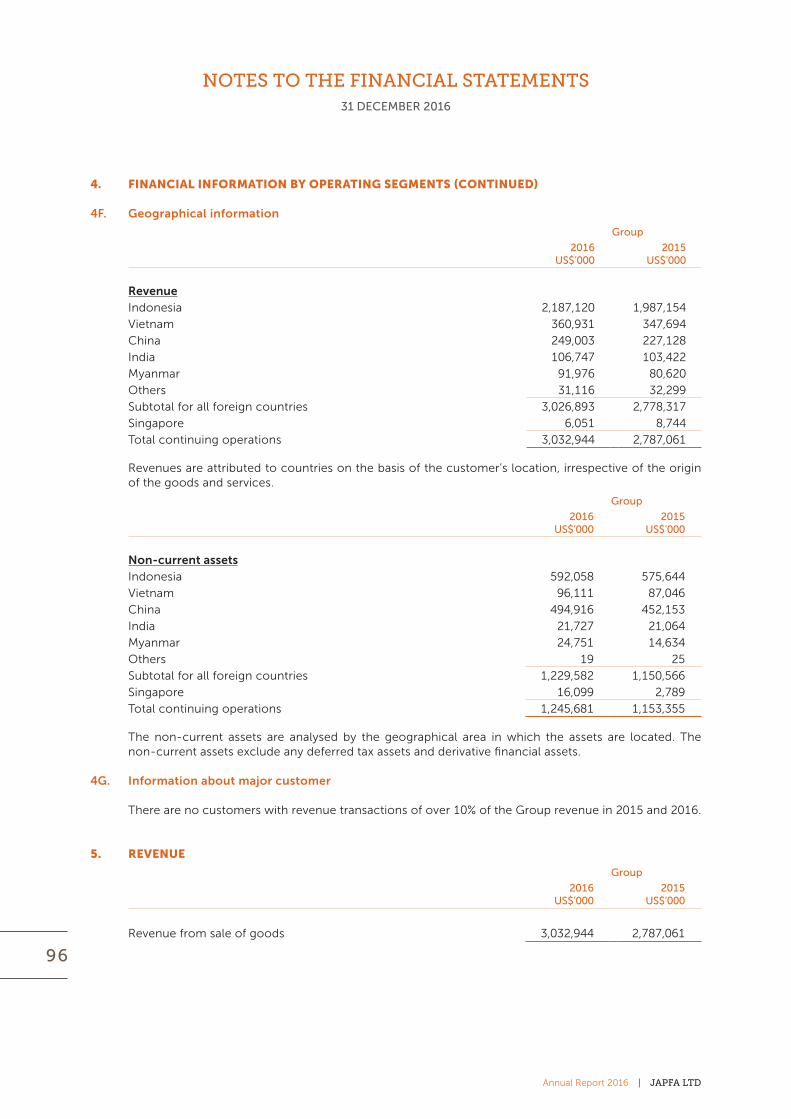
96
Annual Report 2016 | JAPFA LTD
NOTES TO THE FINANCIAL STATEMENTS31 DECEMBER 2016
4. FINANCIAL INFORMATION BY OPERATING SEGMENTS (CONTINUED)
4F. Geographical information
Group
2016US$’000
2015US$’000
RevenueIndonesia 2,187,120 1,987,154
Vietnam 360,931 347,694
China 249,003 227,128
India 106,747 103,422
Myanmar 91,976 80,620
Others 31,116 32,299
Subtotal for all foreign countries 3,026,893 2,778,317
Singapore 6,051 8,744
Total continuing operations 3,032,944 2,787,061
Revenues are attributed to countries on the basis of the customer’s location, irrespective of the origin of the goods and services.
Group
2016US$’000
2015US$’000
Non-current assetsIndonesia 592,058 575,644
Vietnam 96,111 87,046
China 494,916 452,153
India 21,727 21,064
Myanmar 24,751 14,634
Others 19 25
Subtotal for all foreign countries 1,229,582 1,150,566
Singapore 16,099 2,789
Total continuing operations 1,245,681 1,153,355
The non-current assets are analysed by the geographical area in which the assets are located. The non-current assets exclude any deferred tax assets and derivative financial assets.
4G. Information about major customer
There are no customers with revenue transactions of over 10% of the Group revenue in 2015 and 2016.
5. REVENUE
Group
2016US$’000
2015US$’000
Revenue from sale of goods 3,032,944 2,787,061

97
JAPFA LTD | Annual Report 2016
NOTES TO THE FINANCIAL STATEMENTS31 DECEMBER 2016
6. INTEREST INCOME
Group
2016US$’000
2015US$’000
Interest income 3,580 2,859
7. OTHER GAINS AND (OTHER LOSSES)
Group
2016US$’000
2015US$’000
Gain on disposal of property, plant and equipment 2,915 317
Gain on fair value of call option assets 2,948 –
Gain on buyback of bonds payable (Note 30D) 589 6,400
Gain/(loss) on disposal of other financial assets 3,793 (63)
(Loss)/gain on fair value of financial assets (473) 2,497
(Loss)/gain on fair value of derivative financial instruments (278) 544
Rental income from investment properties 11 77
Other rental income 290 9
Write-off of property, plant and equipment (699) (119)
Payables written back 68 24
Bad debts written-off against trade receivables 1,553 –
Insurance compensation 963 901
Sales of scrap 1,022 1,574
Sale of cattle on disposal of farm 13,744 –
Government grant income 478 467
Provision for out-of-stock penalty – (557)
Others 93 (1,186)
Net 27,017 10,885
Presented in profit or loss as:
Other gains 28,467 12,810
Other losses (1,450) (1,925)
27,017 10,885
8. MARKETING AND DISTRIBUTION COSTS
The major components include the following:
Group
2016US$’000
2015US$’000
Advertising and promotion expense 32,221 26,210
Employee benefits expense 28,565 24,347
Freight charges 27,425 28,272

98
Annual Report 2016 | JAPFA LTD
NOTES TO THE FINANCIAL STATEMENTS31 DECEMBER 2016
9. ADMINISTRATIVE EXPENSES
The major components include the following:
Group
2016US$’000
2015US$’000
Employee benefits expense and related payroll costs 128,905 115,016
Depreciation 12,229 11,373
In addition, the following profit and loss items are included in administrative expenses:
Group
2016US$’000
2015US$’000
Audit fees to the independent auditor of the Company 190 172
Audit fees to the other independent auditors 1,188 910
Other fees to the independent auditor of the Company – 1
Other fees to the other independent auditors 87 91
10. FINANCE COSTS
Group
2016US$’000
2015US$’000
Interest expense on borrowings 60,035 70,079
11. EMPLOYEE BENEFITS EXPENSE
Group
2016US$’000
2015US$’000
Employee benefits expense 240,644 196,351
Contributions to defined contribution plans 13,751 10,486
Defined benefits post employment expenses (Note 28) 10,500 12,836
Share-based payments: Performance share plan 3,138 –
Share-based payments: Employee share option plan 536 302
Total employee benefits expense 268,569 219,975

99
JAPFA LTD | Annual Report 2016
NOTES TO THE FINANCIAL STATEMENTS31 DECEMBER 2016
12. INCOME TAX
12A. Components of tax expense (income) recognised in profit or loss
Group
2016US$’000
2015US$’000
Current tax expense:Current tax expense 57,556 20,502
Under adjustments in respect of prior years – 648
Subtotal 57,556 21,150
Deferred tax income:Deferred tax income (651) (991)
Total income tax expense 56,905 20,159
The reconciliation or income tax below is determined by applying the Singapore corporate tax rate. The income tax in profit or loss varied from the amount determined by applying the Singapore corporate tax rate of 17% (2015: 17%) to profit or loss before income tax as a result of the following differences:
Group
2016US$’000
2015US$’000
Profit before income tax 254,626 111,925
Share of loss of equity accounted joint ventures 367 798
254,993 112,723
Income tax expense at the above rate 43,349 19,163
Effect of different tax rates in different countries 9,486 6,183
Expenses not deductible for tax purposes 12,495 9,612
Income not subject to tax (15) (984)
Deferred tax assets not recognised 3,508 2,501
Under adjustments in respect of prior years – 648
Withholding tax 120 1,030
Tax incentives (10,618) (17,201)
Others (1,420) (793)
Total income tax expense 56,905 20,159
Effective tax rate 22.3% 18.0%
There are no income tax consequences of dividends to owners of the Company.
Expenses not deductible for tax purposes comprise mainly facilities expenses and depreciation of certain subsidiaries.
The amount of income tax payable outstanding as at end of the reporting year was US$16,812,000 (2015: US$13,045,000). Such an amount is net of tax advances, which, according to the tax rules, was paid before the end of the reporting year.
Certain subsidiaries within the Group are exempted them from corporate income tax in the respective tax jurisdiction. In addition, a subsidiary in the Group enjoys a concessionary corporate income tax rate of 10%, subject to meeting certain terms and conditions imposed by the authorities.

100
Annual Report 2016 | JAPFA LTD
NOTES TO THE FINANCIAL STATEMENTS31 DECEMBER 2016
12. INCOME TAX (CONTINUED)
12B. Deferred tax expense/(income) recognised in profit or loss
Group
2016US$’000
2015US$’000
Excess of net book value over tax value of plant and equipment 1,428 465
Fair value of biological assets (568) (500)
Tax losses of subsidiaries (153) (1,851)
Provision for employee obligations 887 711
Others (2,245) 184
Net deferred tax income recognised in profit or loss (651) (991)
12C. Deferred tax (income)/expense recognised in other comprehensive income
Group
2016US$’000
2015US$’000
Re-measurement of the net defined benefits plan (1,555) 800
12D. Deferred tax balance in the statement of financial position
Group
2016US$’000
2015US$’000
Deferred tax assets (liabilities) are as follows:Excess of net book value over tax value of plant and equipment (4,543) (3,115)
Fair value of biological assets (2,289) (2,857)
Losses of subsidiaries 2,004 1,851
Provision for employee obligations 12,158 11,490
Others 4,567 848
Total 11,897 8,217
Presented in the statement of financial position as follows:Deferred tax assets 15,714 12,729
Deferred tax liabilities (3,817) (4,512)
11,897 8,217
It is impracticable to estimate the amount expected to be settled or used within one year.

101
JAPFA LTD | Annual Report 2016
NOTES TO THE FINANCIAL STATEMENTS31 DECEMBER 2016
12. INCOME TAX (CONTINUED)
12E. Unrecognised deferred tax
Unrecognised deferred tax assets:
At the end of the reporting year, the Group and the Company have unutilised tax losses of approximately US$56,458,000 (2015: US$39,636,000) and US$14,859,000 (2015: US$7,073,000) respectively that are available for offset against future taxable profits of the companies in which the losses arose, for which no deferred tax asset is recognised due to uncertainty of its recoverability. The use of these tax losses is subject to the agreement of the tax authorities and compliance with certain provisions of the tax legislation of the respective countries in which the companies operate.
The expiry dates of the abovementioned unutilised tax losses are as follows:
Group
Tax losses expiring in year2016$’000
2015$’000
2016 – 399
2017 3,768 3,822
2018 4,146 4,206
2019 4,994 5,065
2020 4,314 4,376
2021 5,920 –
23,142 17,868
Unrecognised deferred tax disabilities:
A deferred tax liability of approximately US$32,532,000 (2015: US$23,014,000) has not been recognised in these financial statements for withholding taxes that would be payable on the undistributed earnings of the Group’s foreign subsidiaries as the Group is able to control the timing of dividend distributions of the subsidiaries and has determined that these undistributed earnings will not be distributed in the foreseeable future.
13. EARNINGS PER SHARE
The following table illustrates the numerators and denominators used to calculate basic and diluted amount per share of no par value:
Group
2016US$’000
2015US$’000
Numerator:
Earnings attributable to equity holders 118,784 64,696
2016’000
2015‘000
Denominator:
Weighted average number of equity shares 1,764,670 1,764,670
The weighted average number of equity shares refers to shares in circulation during the reporting year.
There is no dilution of earnings per share as there are presently no dilutive shares outstanding as at the end of the reporting year. The denominators used are the same as those detailed above for both basic and diluted earnings per share.

102
Annual Report 2016 | JAPFA LTD
NOTES TO THE FINANCIAL STATEMENTS31 DECEMBER 2016
14. PROPERTY, PLANT AND EQUIPMENT
Leasehold land
Freehold land
Buildings & site
facilities
Machinery &
equipment
Office furniture
& fixturesConstruction
in progressMotor
vehiclesAssets
not in use Total
Group US$’000 US$’000 US$’000 US$’000 US$’000 US$’000 US$’000 US$’000 US$’000
Cost:
At 1 January 2015 151,806 1,067 386,143 384,088 67,827 97,351 64,741 1,770 1,154,793
Additions 7,451 – 6,566 10,797 6,977 111,222 2,881 1,464 147,358
Additions through business combination – – – – 1 – 16 – 17
Disposals / write-off (333) – (852) (2,084) (784) (37) (760) (576) (5,426)
Reclassifications * (3,681) – 82,626 58,314 1,789 (142,964) 305 7,866 4,255
Foreign exchange adjustments (15,786) (51) (34,581) (36,108) (6,814) (9,638) (5,932) (186) (109,096)
At 31 December 2015 139,457 1,016 439,902 415,007 68,996 55,934 61,251 10,338 1,191,901
Additions 19,172 – 8,443 12,401 7,125 119,634 9,111 237 176,123
Disposals / write-off (14,610) – (3,492) (2,809) (979) (363) (2,128) – (24,381)
Reclassifications * 2,713 – 82,360 40,574 4,063 (129,203) 831 (10,900) (9,562)
Foreign exchange adjustments 4,308 (23) (4,758) 1,025 1,797 532 1,458 325 4,664
At 31 December 2016 151,040 993 522,455 466,198 81,002 46,534 70,523 – 1,338,745
Accumulated
depreciation:
At 1 January 2015 24,271 – 79,308 142,347 38,454 – 36,589 66 321,035
Depreciation for the year 3,608 – 19,742 32,184 9,170 – 7,188 – 71,892
Additions through business combination – – – – – – 1 – 1
Disposals / write-off (1,352) – (462) (1,637) (597) – (618) – (4,666)
Reclassifications * 946 – 1,881 (641) 3 – (214) – 1,975
Foreign exchange adjustments (2,601) – (8,118) (14,628) (4,127) – (3,807) (7) (33,288)
At 31 December 2015 24,872 – 92,351 157,625 42,903 – 39,139 59 356,949
Depreciation for the year 3,477 23,888 38,182 10,203 – 7,052 – 82,802
Disposals / write-off – – (685) (1,057) (782) – (1,549) – (4,073)
Reclassifications * – – (32) 185 (105) – (121) (62) (135)
Foreign exchange adjustments 723 – 670 1,889 1,111 – 997 3 5,393
At 31 December 2016 29,072 – 116,192 196,824 53,330 – 45,518 – 440,936
Net book value:
At 1 January 2015 127,535 1,067 306,835 241,741 29,373 97,351 28,152 1,704 833,758
At 31 December 2015 114,585 1,016 347,551 257,382 26,093 55,934 22,112 10,279 834,952
At 31 December 2016 121,968 993 406,263 269,374 27,672 46,534 25,005 – 897,809
* Included in the reclassifications are certain assets reclassified from / to investment properties (Note 15) and other assets (Note 22).
Depreciation is included in cost of sales, marketing and distribution costs and administrative expenses.
Certain items of property, plant and equipment are pledged as security for banking facilities (Note 30A).

103
JAPFA LTD | Annual Report 2016
NOTES TO THE FINANCIAL STATEMENTS31 DECEMBER 2016
14. PROPERTY, PLANT AND EQUIPMENT (CONTINUED)
Certain land is held in trust by employees of the Group.
Certain assets are under finance lease agreements (see Note 30B).
The movement of property, plant and equipment of the Company has not been disclosed as it is not material.
15. INVESTMENT PROPERTIES
Group
2016US$’000
2015US$’000
At cost:At beginning of the year 2,639 7,712
Additions – 3
Disposals (562) (5)
Reclassifications from / (to) property, plant and equipment 10,677 (4,265)
Foreign exchange adjustments 83 (806)
At end of the year 12,837 2,639
Accumulated depreciation and impairment:At beginning of the year 1,715 5,042
Depreciation for the year 468 115
Disposals (52) (1)
Reclassifications from / (to) property, plant and equipment 88 (2,911)
Foreign exchange adjustments 50 (530)
At end of the year 2,269 1,715
Net book value:At beginning of the year 924 2,670
At end of the year 10,568 924
Rental income 11 77
Direct operating expenses (including repair and maintenance) of investment properties that generated rental income during the year 35 35
Direct operating expenses (including repair and maintenance) of investment properties that do not generated rental income during the year 433 80
The investment properties are leased out as operating leases. The management has not entered into contractual obligations for the maintenance or enhancement of the investment properties.
There are no restrictions on the realisability of investment properties or the remittance of income and proceeds of disposal.
Investment properties are carried at cost less accumulated depreciation at the statement of financial position date. The fair value of investment properties was not determined as it is not expected to be significantly different from the carrying value.

104
Annual Report 2016 | JAPFA LTD
NOTES TO THE FINANCIAL STATEMENTS31 DECEMBER 2016
16. INTANGIBLE ASSETS
Group
2016US$’000
2015US$’000
Goodwill (Note 16A) 5,220 5,061
Other intangible assets (Note 16B) 3,164 3,464
8,384 8,525
16A. Goodwill
Group
2016US$’000
2015US$’000
Balance at beginning of the year 5,061 5,652
Foreign exchange adjustments 159 (591)
Balance at end of the year 5,220 5,061
Goodwill is allocated to cash-generating units for the purpose of impairment testing. Each of those cash-generating units represents the Group’s investment in a subsidiary as follows:
Group
Animal Protein Segment
2016US$’000
2015US$’000
Name of subsidiary:PT Ciomas Adisatwa 5,220 5,061
The goodwill was tested for impairment at the end of the reporting year. An impairment loss is the amount by which the carrying amount of an asset or a cash-generating unit exceeds its recoverable amount. The recoverable amount of an asset or a cash-generating unit (“CGU”) is the higher of its fair value less costs of disposal or its value in use. The recoverable amounts of CGUs have been measured based on the value in use method as appropriate. The value in use is measured by management. The value in use is a recurring fair value measurement (Level 3). The quantitative information and key assumptions about the value in use measurement using significant unobservable inputs for cash generating unit are consistent with those used for the measurement last performed and is analysed as follows:
Group
Animal Protein Segment
2016 2015
Valuation technique: Discounted cash flow method
Unobservable inputs:Estimated discount rates using pre-tax rates that reflect current market
assessments at the risks specific to the CGUs: 11% 12%
Cash flow forecasts derived from the most recent financial budgets and plans approved by management: 5 years 5 years

105
JAPFA LTD | Annual Report 2016
NOTES TO THE FINANCIAL STATEMENTS31 DECEMBER 2016
16. INTANGIBLE ASSETS (CONTINUED)
16A. Goodwill (continued)
Relationship of unobservable inputs to value in use:Discount rate – the higher the discount rate, the lower the value in use.
Based on impairment testing performed as of 31 December 2016 and 2015, no impairment in goodwill is required.
16B. Other intangible assets
Customer relation-
ships
Formulaand
technology
Non-compete
feesComputer
software Total
Group US$’000 US$’000 US$’000 US$’000 US$’000
At cost:At 1 January 2015 2,853 5 209 5,283 8,350
Reclassification – 20 – 80 100
Additions – – – 1,150 1,150
Disposals – – – (1) (1)
Foreign exchange adjustments – – (10) (492) (502)
At 31 December 2015 2,853 25 199 6,020 9,097
Additions – – – 1,121 1,121
Foreign exchange adjustments – – (4) 85 81
At 31 December 2016 2,853 25 195 7,226 10,299
Accumulated amortisation:At 1 January 2015 2,595 2 209 1,756 4,562
Reclassification – 1 – – 1
Amortisation for the year 257 1 – 996 1,254
Disposals – – – (1) (1)
Foreign exchange adjustments – – (10) (173) (183)
At 31 December 2015 2,852 4 199 2,578 5,633
Amortisation for the year – 5 – 1,491 1,496
Foreign exchange adjustments – – (4) 10 6
At 31 December 2016 2,852 9 195 4,079 7,135
Net book value:At 1 January 2015 258 3 – 3,527 3,788
At 31 December 2015 1 21 – 3,442 3,464
At 31 December 2016 1 16 – 3,147 3,164
The amortisation expense is charged as administrative expenses.

106
Annual Report 2016 | JAPFA LTD
NOTES TO THE FINANCIAL STATEMENTS31 DECEMBER 2016
17. INVESTMENTS IN SUBSIDIARIES
Company
2016 2015
US$’000 US$’000
Quoted equity shares at cost 93,252 95,934
Unquoted equity shares at cost 857,354 697,541
Subtotal 950,606 793,475
Less: Allowance for impairment (3,400) (3,400)
Net carrying amount 947,206 790,075
Fair value of quoted equity shares 630,186 283,089
Analysis of above amount denominated in non-functional currency:Indonesian Rupiah 93,252 95,934
Indian Rupee 4,230 4,230
Movements in cost during the year:Balance at the beginning of the year 793,475 774,726
Additions 16,383 18,749
Capitalisation of loan to subsidiaries 147,825 –
Disposals (7,077) –
Balance at the end of the year 950,606 793,475
Movements in allowance for impairment:Balance at the beginning of the year 3,400 –
Impairment loss charge to profit or loss – 3,400
Balance at the end of the year 3,400 3,400
17A. Major subsidiaries held by the Group
Name of subsidiaries and principal activities(and independent auditor)
Country of incorporation
Effective equity held by the Group
2016 2015
% %
Held by the Company:
PT Japfa Comfeed Indonesia Tbk (“JCI”) (b) (e) Indonesia 51.0 58.0
Processing of materials for the manufacture / production of animal feed, engaging in breeding, poultry and other farms and engaging in domestic and international trading
(Mulyamin Sensi Suryanto & Lianny)
Annona Pte Ltd (a) Singapore 100 100
Import and export of raw materials
Jupiter Foods Pte Ltd (“JFS”) (a) Singapore 100 100
Investment holding
Japfa India Investments Pte Ltd (“JII”) (a) Singapore 100 100
Investment holding

107
JAPFA LTD | Annual Report 2016
NOTES TO THE FINANCIAL STATEMENTS31 DECEMBER 2016
17. INVESTMENTS IN SUBSIDIARIES (CONTINUED)
17A. Major subsidiaries held by the Group (continued)
Name of subsidiaries and principal activities(and independent auditor)
Country of incorporation
Effective equity held by the Group
2016 2015
% %
Japfa Vietnam Investments Pte Ltd (“JVI”) (a) Singapore 100 100
Investment holding
Japfa China Investments Pte Ltd (“JC”) (a) Singapore 100 100
Investment holding
Japfa Myanmar JV Pte Ltd (“JMJV”) (a) Singapore 100 100
Investment holding
AustAsia Investment Holdings Pte Ltd (“AIH”) (b) Singapore 61.9 61.9
Investment holding
(Ernst and Young LLP)
AIH2 Pte Ltd (“AIH2”) (b) Singapore 64.5 64.5
Providing business and management consultancy services
(Ernst and Young LLP)
Major subsidiaries held through JCI:
PT Suri Tani Pemuka (b) Indonesia 51.0 58.0
Production of shrimp feed, shrimp farming, cold storage and shrimp hatchery
(Mulyamin Sensi Suryanto & Lianny)
Comfeed Finance B.V. (c) Netherlands 51.0 58.0
Provision of treasury services
(RSM Netherlands B.V.)
PT Ciomas Adisatwa (b) Indonesia 51.0 58.0
Trading, commercial farm and chicken slaughter house
(Mulyamin Sensi Suryanto & Lianny)
PT Indojaya Agrinusa (b) (d) Indonesia 25.5 29.0
Animal feeds manufacturing and chicken breeding
(Mulyamin Sensi Suryanto & Lianny)
PT Santosa Agrindo (b) Indonesia 51.0 58.0
Trading, beef processing unit and cattle slaughter house
(Mulyamin Sensi Suryanto & Lianny)

108
Annual Report 2016 | JAPFA LTD
NOTES TO THE FINANCIAL STATEMENTS31 DECEMBER 2016
17. INVESTMENTS IN SUBSIDIARIES (CONTINUED)
17A. Major subsidiaries held by the Group (continued)
Name of subsidiaries and principal activities(and independent auditor)
Country of incorporation
Effective equity held by the Group
2016 2015
% %
Major subsidiary held through JII:
Japfa Comfeed India Private Ltd (“JCIPL”) (c) India 100 100
Poultry
(Suresh Surana & Associates LLP)
Major subsidiary held through JFS:
PT So Good Food (b) Indonesia 100 100
Trading
(Mulyamin Sensi Suryanto & Lianny)
Major subsidiary held through JVI:
Japfa Comfeed Vietnam Limited Company (c) Vietnam 100 100
Breeding farm and poultry
(RSM Vietnam)
Major subsidiary held through Japfa China Investments Pte Ltd:
Dongying Japfa Beef Co., Ltd. (b) China 100 100
Beef cattle breeding, grass forage production, import and export of beef cattle and related products
(Hui Xin Certified Public Accountants)
Major subsidiary held through JMJV:
Japfa Comfeed Myanmar Pte Ltd (“JCM”) (b) Myanmar 99.0 100
Poultry and feedmill business
(EY UTW (Myanmar) Ltd)
Major subsidiaries held through AIH:
PT Greenfields Indonesia (b) Indonesia 61.9 61.9
Production and sales of milk
(Purwantono, Suherman & Surja)
Dongying AustAsia Modern Dairy Farm Co., Ltd (b) China 61.9 61.9
Production and sales of milk
(Ernst & Young Hua Ming LLP)

109
JAPFA LTD | Annual Report 2016
NOTES TO THE FINANCIAL STATEMENTS31 DECEMBER 2016
17. INVESTMENTS IN SUBSIDIARIES (CONTINUED)
17A. Major subsidiaries held by the Group (continued)
Name of subsidiaries and principal activities(and independent auditor)
Country of incorporation
Effective equity held by the Group
2016 2015
% %
Taian AustAsia Modern Dairy Farm Co., Ltd (b) China 61.9 61.9
Production and sales of milk
(Ernst & Young Hua Ming LLP)
Dongying Xianhe AustAsia Modern Dairy Farm Co., Ltd (b) China 61.9 61.9
Production and sales of milk
(Ernst & Young Hua Ming LLP)
Dongying Shenzhou AustAsia Modern Dairy Farm Co., Ltd (b) China 61.9 61.9
Production and sales of milk
(Ernst & Young Hua Ming LLP)
Major subsidiaries held through AIH2:
Chifeng Austasia Modern Dairy Farm Co., Ltd (b) China 64.5 64.5
Production and sales of milk
(Ernst & Young Hua Ming LLP)
(a) Audited by RSM Chio Lim LLP, Singapore.
(b) Other independent auditors. Audited by firms of accountants other than member firms of RSM International of which RSM Chio Lim LLP in Singapore is a member. Their names are indicated above.
(c) Audited by member firms of RSM International of which RSM Chio Lim LLP in Singapore is a member. Their names are indicated above.
(d) The entity is regarded as a subsidiary as the Group owns, directly or indirectly through subsidiaries, more than half of the voting power of the entity, and it is able to obtain control through potential voting rights.
(e) Listed on a stock exchange. Also see Note 17E.
As is required by Rule 716 of the Listing Manual of The Singapore Exchange Securities Trading Limited, the audit committee and the board of directors of the Company have satisfied themselves that the appointment of different auditors for certain subsidiaries would not compromise the standard and effectiveness of the audit of the Group.

110
Annual Report 2016 | JAPFA LTD
NOTES TO THE FINANCIAL STATEMENTS31 DECEMBER 2016
17. INVESTMENTS IN SUBSIDIARIES (CONTINUED)
17B. Investments in AIH and AIH2
AIH Undertaking:
As part of the Company’s pre-IPO restructuring, on 2 April 2014, the Company entered into a sale and purchase agreement with Progressive Investment Inc. (“PII”), Foxbar Investments Ltd. (“Foxbar”) and Viva Sino Investments Limited (“Viva”) (collectively, the “Progressive Group”) for the purchase by the Company of an aggregate of 134,953,572 fully paid ordinary shares and 6,343,571 partially paid ordinary shares (in total comprising 61.9% of the issued shares in the capital of AIH) and the undertakings defined below, for a consideration of US$554,456,870, comprising US$50,000,000 in cash and 168,256,634 new shares in the capital of the Company.
US$36,189,108 of the aggregate consideration of US$554,456,870 was for the assignment of the rights of the Progressive Group in respect of (i) the Deed of Undertaking dated 19 July 2012 entered into between BR Fund 1 (non-controlling interest in AIH), Foxbar, and AIH (“Foxbar Undertaking”), under which BR Fund 1 had undertaken to Foxbar to pay 30.0% of its realisation value in cash/kind/AIH shares upon a realisation event (including AIH IPO or sale of its shares) less its cost of investment, and (ii) the Deed of Undertaking dated 13 August 2010 entered between BR Fund 1, PII and AIH (as amended on 10 August 2011) (“PII Undertaking”), under which BR Fund 1 had undertaken to PII to pay 20.0% of its realisation value in cash/kind/AIH shares upon any realisation event (including, AIH IPO or sale of its shares) less its cost of investment. Alternatively, Foxbar and PII have the option to purchase 14,014,286 AIH shares from BR Fund 1 for an aggregate consideration of US$15,214,000 being BR Fund 1’s cost of investment. The consideration paid for the assignment of the undertaking and call option was recognised as investment in equity instrument as the Company intend to elect the settlement via AIH shares when it exercised its rights under the call option in future. The investment in equity instrument was adjusted against the capital reserve in the consolidated financial statements. On 28 November 2016, the Company served notice to the BR Fund 1 to irrevocable elect to purchase AIH shares in future when it exercised its right under the call option.
AIH2 Undertaking:
On 2 April 2014, the Company and the Group entered into an agreement with BR Fund 2 (“AIH2 Shareholder’s Agreement”) to establish AIH2. Under the agreement, BR Fund 2 granted an undertaking to the Company in respect of its shareholding from time to time in AIH2 on substantially the same terms as those set out in the AIH Undertakings above, except for the operative percentage, which will be 10% of all shares held by BR Fund 2.
The Company recognised the fair value of AIH2 Call Option amounting to US$2,948,000 as at 31 December 2016 (Note 21). The fair value of AIH2 Call Option as at 31 December 2015 was not material.
AIH and AIH2 Put Options:
The Company has written put options with the non-controlling shareholders of AIH and AIH2 (the “AIH and AIH2 Put Options”), details of which are as follows:

111
JAPFA LTD | Annual Report 2016
NOTES TO THE FINANCIAL STATEMENTS31 DECEMBER 2016
17. INVESTMENTS IN SUBSIDIARIES (CONTINUED)
17B. Investments in AIH and AIH2 (continued)
AIH and AIH2 Put Options (continued):
Under the AIH Shareholder’s Agreement (including amendments thereof), BR Fund I and the Company (the “AIH Shareholders”) have agreed that they shall each, subject to profitability, viability and satisfactory reviews and recommendations by competent financial advisers and prevailing market conditions at the time, use all reasonable endeavors to procure that application be made by AIH for the admission of AIH to an internationally recognised securities exchange on or before 12 August 2018 (“AIH IPO Target Date”). In the event an initial public offering of shares in, or assets and businesses of, AIH (“AIH IPO”) does not take place on or before the AIH IPO Target Date, BR Fund I shall be entitled at any time between 12 August 2018 and 12 September 2018 to require the Company to purchase from the BR Fund I, its shares in AIH as at the date of the notice (“AIH Put Option”). Further, the BR Fund I shall have the option to elect to receive payment of the price at which the AIH Put Option is exercised by way of a combination of cash and/or shares in the capital of Company, subject to a maximum of 14.9% of the issued and paid-up share capital of the Company held by BR Fund I and by BR Fund 2 (in relation to AIH2 Put Option) on AIH and AIH2 IPO Target Date.
Under the AIH2 Shareholder’s Agreement (including amendments thereof), BR Fund 2 has the option to require the Company to purchase the shares in AIH2 owned by the BR Fund 2 (“AIH2 Option Shares”) in the event an initial public offering of shares in AIH2 (“AIH2 IPO”) does not take place by 12 August 2018 (“AIH2 IPO Target Date”). The terms of AIH2 Put Option are substantially the same as those set out in AIH Put Option including the IPO target date of 12 August 2018.
The price at which the AIH/AIH2 Put Options is exercisable (“Put Option Purchase Price”) shall be determined by multiplying the Group’s Average Price Earnings Ratio (“PER”) by AIH’s or AIH2’s Net Profit After Tax (“NPAT”).
Average PER is defined as: volume weighted average price of the shares for the six months prior to the exercise of the AIH/AIH2 Put Option multiplied by the total number of issued shares in the Company as at the date of such exercise, divided by Group’s NPAT.
NPAT is defined as: net profits after tax, excluding (i) any biological assets valuation gain or loss; (ii) minority interests; (iii) foreign exchange gain or loss; (iv) any fair value gain or loss on derivative or from the call and put options; and (v) any provision or reversal of impairment loss of assets, for the last 4 completed quarters prior to the exercise of the put option, determined by reference to the latest available audited and unaudited financial statements.
The Group recognised the present value of the redemption amount of AIH and AIH2 Put Options of US$169,979,000 (2015: US$180,946,000) as at the end of the reporting year (Note 27).
17C. Impairment of certain subsidiaries
Certain investments in subsidiaries with carrying amounts of US$9,151,000 (2015: US$82,305,000) were tested for impairment at the end of the reporting year where the cost of investments exceeded the net asset values of these subsidiaries. An impairment loss is the amount by which the carrying amount of an asset or a cash-generating unit exceeds its recoverable amount. The recoverable amount of an asset or a cash-generating unit (“CGU”) is the higher of its fair value less costs of disposal or its value in use. The recoverable amounts of CGUs have been measured based on the value in use method as appropriate. The value in use is measured by management. The value in use is a recurring measurement (Level 3).

112
Annual Report 2016 | JAPFA LTD
NOTES TO THE FINANCIAL STATEMENTS31 DECEMBER 2016
17. INVESTMENTS IN SUBSIDIARIES (CONTINUED)
17D. Financial information of subsidiaries with material NCI
There are subsidiaries that have non-controlling interests (“NCI”) that are considered material to the Group and additional disclosures on them (amounts before inter-company eliminations) are presented below.
Group
2016US$’000
2015US$’000
Name of the subsidiary: PT Japfa Comfeed Indonesia Tbk
Profit for the year allocated to NCI of the subsidiary 64,968 13,461
Accumulated NCI of the subsidiary at the end of the reporting year 258,715 141,016
The summarised financial information of the subsidiary (not adjusted for the percentage ownership held by the Group and amounts before inter-company eliminations) is as follows:
Current assets 823,237 693,038
Non-current assets 502,151 545,193
Current liabilities 386,540 386,250
Non-current liabilities 349,294 411,104
Revenue 2,030,281 1,854,690
Profit for the reporting year 154,084 38,875
Total comprehensive income 158,907 68,594
Operating cash flows, increase 206,574 107,690
Net cash flows, increase 135,745 7,742
Name of the subsidiary: AustAsia Investment Holdings Pte Ltd
Profit for the year allocated to NCI of the subsidiary 3,318 10,175
Accumulated NCI of the subsidiary at the end of the reporting year 115,516 117,132
The summarised financial information of the subsidiary (not adjusted for the percentage ownership held by the Group and amounts before inter-company eliminations) is as follows:
Current assets 129,266 102,107
Non-current assets 404,264 417,873
Current liabilities 94,834 90,273
Non-current liabilities 135,724 122,496
Revenue 287,883 275,648
Profit for the reporting year 8,703 26,687
Total comprehensive (loss) / income (4,730) 7,037
Operating cash flows, increase 68,330 33,867
Net cash flows, increase / (decrease) 13,949 (47,233)

113
JAPFA LTD | Annual Report 2016
NOTES TO THE FINANCIAL STATEMENTS31 DECEMBER 2016
17. INVESTMENTS IN SUBSIDIARIES (CONTINUED)
17D. Financial information of subsidiaries with material NCI (continued)
Group
2016US$’000
2015US$’000
Name of the subsidiary: AIH2 Pte Ltd
Loss for the year allocated to NCI of the subsidiary 2,256 (1,432)
Accumulated NCI of the subsidiary at the end of the reporting year 33,914 27,093
The summarised financial information of the subsidiary (not adjusted for the percentage ownership held by the Group and amounts before inter-company eliminations) is as follows:
Current assets 72,700 19,355
Non-current assets 141,372 66,947
Current liabilities 44,930 10,091
Non-current liabilities 73,744 –
Revenues 13,883 –
Profit / (loss) for the reporting year 6,347 (4,028)
Total comprehensive income / (loss) 587 (5,997)
Operating cash flows, (decrease) / increase (889) 34,454
Net cash flows, increase / (decrease) 35,765 (22,351)
17E. Changes in equity interests in subsidiaries in 2016
PT Japfa Comfeed Indonesia Tbk
An interest of 0.78% in subsidiary, JCI, was acquired in January 2016 for US$4,396,000 in cash. This increased the equity interest from 57.95% to 58.73%. Changes in the ownership interest in a subsidiary that do not result in change in control are accounted for as transactions with owners in their capacity as owners (as equity transactions). The carrying amounts of the controlling and non-controlling interests are adjusted to reflect the changes in their relative interests in the subsidiary. Any difference between the amount by which the non-controlling interests are adjusted and the fair value of the consideration paid or received is recognised directly in equity and attributed to the owners of the parent. The schedule below shows the effects of the changes.
2016
US$’000
Proportionate share of the carrying amount of the net assets of JCI has been transferred from non-controlling interests 2,626
Loss included in capital reserve (1,770)

114
Annual Report 2016 | JAPFA LTD
NOTES TO THE FINANCIAL STATEMENTS31 DECEMBER 2016
17. INVESTMENTS IN SUBSIDIARIES (CONTINUED)
17E. Changes in equity interests in subsidiaries in 2016 (continued)
PT Japfa Comfeed Indonesia Tbk (continued)
On 4 August 2016, global investment firm KKR’s US$81,942,000 investment in JCI was completed through a private placement in JCI for US$53,410,000 and purchase of shares in JCI from the Company for US$28,532,000. Following this transaction, the Group recorded a capital reserve of US$18,429,000 as a result of a reduction in its ownership in JCI from 58.73% to 51%. Changes in the ownership interest in a subsidiary that do not result in change in control are accounted for as transactions with owners in their capacity as owners (as equity transactions). Any difference between the amount by which the non-controlling interests are adjusted and the fair value of the consideration paid or received is recognised directly in equity and attributed to the owners of the parents. The schedule below shows the effects of the changes at the Group level:
2016
US$’000
Proportionate share of the carrying amount of the net assets of JCI
has been transferred to non-controlling interests 63,513
Gain included in capital reserve 18,429
Japfa Comfeed Myanmar Pte Ltd
On 2 May 2016, the Group disposed of a 1% interest out of its 100% shareholding in Japfa Comfeed Myanmar Pte Ltd (“JCM”) at a consideration of US$462,000. Changes in the ownership interest in a subsidiary that do not result in change in control are accounted for as transactions with owners in their capacity as owners (as equity transactions). Any difference between the amount by which the non-controlling interests are adjusted and the fair value of the consideration paid or received is recognised directly in equity and attributed to the owners of the parents. The schedule below shows the effects of the changes at the Group level.
2016
US$’000
Proportionate share of the carrying amount of the net assets of JCM
has been transferred to non-controlling interests 355
Gain included in capital reserve 107
PT Multi Makanan Permai
An interest of 30% in JCI’s subsidiary, PT Multi Makanan Permai was acquired on 30 December 2016 for US$238,000 (Rp 3,195,000,000) in cash. This increased the equity interest from 70% to 100%. Changes in the ownership interest in a subsidiary that do not result in change in control are accounted for as transactions with owners in their capacity as owners (as equity transactions). The carrying amounts of the controlling and non-controlling interests are adjusted to reflect the changes in their relative interests in the subsidiary. Any difference between the amount by which the non-controlling interests are adjusted and the fair value of the consideration paid or received is recognised directly in equity and attributed to the owners of the parent. The schedule below shows the effects of the changes.
2016
US$’000
Proportionate share of the carrying amount of the net assets of PT Multi Makanan Permai has been transferred from non-controlling interests 263
Gain included in capital reserve 25

115
JAPFA LTD | Annual Report 2016
NOTES TO THE FINANCIAL STATEMENTS31 DECEMBER 2016
17. INVESTMENTS IN SUBSIDIARIES (CONTINUED)
17F. Changes in equity interests in subsidiaries in 2015
PT Japfa Comfeed Indonesia Tbk
An interest of 0.44% in subsidiary, JCI, was acquired during December 2015 for US$1,992,000 in cash. This increased the equity interest from 57.51% to 57.95%. Changes in the ownership interest in a subsidiary that do not result in change in control are accounted for as transactions with owners in their capacity as owners (as equity transactions). The carrying amounts of the controlling and non-controlling interests are adjusted to reflect the changes in their relative interests in the subsidiary. Any difference between the amount by which the non-controlling interests are adjusted and the fair value of the consideration paid or received is recognised directly in equity and attributed to the owners of the parent. The schedule below shows the effects of the changes at the Group level:
2015US$’000
Proportionate share of the carrying amount of the net assets of JCI has been transferred from non-controlling interests 1,414
Loss included in capital reserve (578) Japfa Comfeed Myanmar Pte Ltd
An interest of 15% in subsidiary, JCM, was acquired by JMJV on 1 June 2015 for US$5,700,000 in cash. This increased the equity interest from 85% to 100%. Changes in the ownership interest in a subsidiary that do not result in change in control are accounted for as transactions with owners in their capacity as owners (as equity transactions). The carrying amounts of the controlling and non-controlling interests are adjusted to reflect the changes in their relative interests in the subsidiary. Any difference between the amount by which the non-controlling interests are adjusted and the fair value of the consideration paid or received is recognised directly in equity and attributed to the owners of the parent. The schedule below shows the effects of the changes at the Group level:
2015US$’000
Proportionate share of the carrying amount of the net assets of JCM has been transferred from non-controlling interests 4,553
Loss included in capital reserve (1,147)

116
Annual Report 2016 | JAPFA LTD
NOTES TO THE FINANCIAL STATEMENTS31 DECEMBER 2016
17. INVESTMENTS IN SUBSIDIARIES (CONTINUED)
17G. Acquisition of a subsidiary in 2015
PT Multi Makanan Permai
On 1 April 2015, the Group acquired 70% of the share capital in PT Multi Makanan Permai (“MMP”) for a purchase consideration of US$37,000. From that date, the Group gained control and MMP became a subsidiary. The principal activities of MMP are trading of animal feed and raw materials. The transaction was accounted for by the acquisition method of accounting.
The net assets acquired and the related fair values are as follows:
2015
Acquiree’s carrying amount
GroupBefore
combination At fair values
US$’000 US$’000
Property, plant and equipment 15 15
Other assets 11 11
Cash and cash equivalents 43 43
Trade and other payables (16) (16)
Other liabilities (1) (1)
Net assets 52 52
Less: Non-controlling interests (15)
Purchase consideration paid 37
Less: Cash taken over (43)
Net cash inflow on acquisition (6)
Revenue 7,688
Loss for the reporting year (138)
Total comprehensive loss (139)

117
JAPFA LTD | Annual Report 2016
NOTES TO THE FINANCIAL STATEMENTS31 DECEMBER 2016
18. INVESTMENTS IN JOINT VENTURES
Group
2016US$’000
2015US$’000
Unquoted equity shares, at cost 5,643 4,977
Share of post-acquisition losses, net of dividends (1,635) (1,268)
Share of post-acquisition other comprehensive income (4) –
Foreign exchange adjustments (179) (233)
Carrying amount 3,825 3,476
Movements in carrying amount:Balance at beginning of the year 3,476 3,054
Additions 666 1,460
Share of loss for the year (367) (798)
Share of other comprehensive income for the year (4) –
Foreign exchange adjustments 54 (240)
Balance at end of the year 3,825 3,476
The listing of and information on the joint ventures is given below:
Name of joint ventures and principal activities(and independent auditor)
Country of incorporation
Effective equity held by the Group
2016 2015
% %
Held through JCIPL:Central India Poultry Breeders Private Limited (a) India 50 50
Animal feed production and poultry
(Ashok Patil & Associates, Chartered Accountants)
Held through PT So Good Food:PT Intan Kenkomayo Indonesia (“IKI”) (b) Indonesia 51 51
Production and sales of mayonnaise and dressing sauce products
(Mulyamin Sensi Suryanto & Lianny)
(a) Audited by member firms of RSM International of which RSM Chio Lim LLP in Singapore is a member. Their names are indicated above.
(b) Other independent auditors. Audited by firms of accountants other than member firms of RSM International of which RSM Chio Lim LLP in Singapore is a member. Their names are indicated above.
The joint ventures are not considered material to the Group.

118
Annual Report 2016 | JAPFA LTD
NOTES TO THE FINANCIAL STATEMENTS31 DECEMBER 2016
18. INVESTMENTS IN JOINT VENTURES (CONTINUED)
The summarised financial information of the joint ventures (and not the Group’s share of those amounts) based on the financial statements of the joint ventures are as follows:
Group
2016US$’000
2015US$’000
Revenue 3,415 1,575
Loss for the reporting year (723) (1,585)
Total comprehensive loss (731) (1,585)
Depreciation and amortisation (118) (33)
Interest income 52 60
Interest expense (42) (250)
Income tax income 252 18
Current assets 3,913 3,661
Cash and cash equivalents 1,826 1,682
Non-current assets 2,990 2,800
Current liabilities (355) (648)
Non-current liabilities (376) (17)
Non-current financial liabilities (330) (8)
Reconciliation:Net assets of the joint ventures 6,172 5,796
Proportion of the Group’s interest in the joint ventures 50% and 51% 50% and 51%
Group’s share of net assets of the joint ventures 3,122 2,939
Goodwill 703 537
Carrying amount of the interest in the joint ventures 3,825 3,476
19. BIOLOGICAL ASSETS
Group
2016US$’000
2015US$’000
Breeding chickens (Note 19A) 63,597 51,917
Breeding cattle (Note 19B) 15,181 26,147
Breeding swine (Note 19C) 21,347 16,569
Dairy cows (Note 19D) 262,842 247,172
Others 182 176
363,149 341,981
Presented as:Biological assets, current 63,597 51,917
Biological assets, non-current 299,552 290,064
363,149 341,981

119
JAPFA LTD | Annual Report 2016
NOTES TO THE FINANCIAL STATEMENTS31 DECEMBER 2016
19. BIOLOGICAL ASSETS (CONTINUED)
The increases / (decreases) in fair values less estimated point of sale costs for biological assets during the reporting year are as follows:
Group
2016US$’000
2015US$’000
Productive breeding cattle 866 904
Productive breeding swine 1,577 1,703
Heifers and calves 5,934 8,185
Milkable cows (25,437) (13,477)
Forage plants (Note 19E) (1,643) (2,948)
Net loss (18,703) (5,633)
19A. Breeding chickens
Group
2016US$’000
2015US$’000
Productive breeding chickens:Balance at beginning of the year 29,205 32,141
Reclassification from unproductive breeding chickens 72,572 72,875
Sales / mortality of chickens (1,708) (1,360)
Reclassification to inventories (67,097) (71,125)
Foreign exchange adjustments 725 (3,326)
Balance at end of the year 33,697 29,205
Unproductive breeding chickens:Balance at beginning of the year 22,712 30,252
Growing costs for the year 76,509 65,970
Purchase of growing chickens 2,653 2,478
Sales / mortality of chickens (10) (68)
Reclassification to productive breeding chickens (72,572) (72,875)
Foreign exchange adjustments 608 (3,045)
Balance at end of the year 29,900 22,712
Total value of breeding chickens 63,597 51,917
In general, the productive lives of the breeding chickens are approximately a year. Therefore, the fair value of the biological assets is regarded to approximate the carrying amount of biological assets stated at cost less accumulated amortisation and impairment losses.
The quantity of breeding chickens owned by the Group at end of the reporting year is shown below:
2016 2015
Head’000 Head’000
Breeding chickens
Productive chickens 4,064 3,613
Unproductive chickens 3,199 2,584
7,263 6,197

120
Annual Report 2016 | JAPFA LTD
NOTES TO THE FINANCIAL STATEMENTS31 DECEMBER 2016
19. BIOLOGICAL ASSETS (CONTINUED)
19B. Breeding cattle
Group
2016US$’000
2015US$’000
Productive breeding cattle:Balance at beginning of the year 19,025 23,144
Growing costs for the year 5,379 3,984
Purchase of breeding cattle 7,174 1,352
Reclassification from unproductive breeding cattle 3,384 2,656
Reclassification from parent to calves (2,379) (2,661)
Reclassification to inventories (269) (304)
Sales / mortality of cattle (21,772) (7,925)
Increase in fair value less estimated point of sale costs 866 904
Foreign exchange adjustments 1,216 (2,125)
Balance at end of the year 12,624 19,025
Unproductive breeding cattle:Balance at beginning of the year 7,122 7,008
Growing costs for the year 1,818 2,008
Purchase of breeding cattle 22 –
Reclassification to productive breeding cattle (3,384) (2,656)
Reclassification from parent to calves 2,379 2,661
Sales / mortality of cattle (5,027) (1,264)
Foreign exchange adjustments (373) (635)
Balance at end of the year 2,557 7,122
Total value of breeding cattle 15,181 26,147
The quantity of breeding cattle owned by the Group at end of the reporting year is shown below:
2016Head
2015Head
Productive breeding cattle 7,798 26,196
Unproductive breeding cattle 3,829 22,475
11,627 48,671
Breeding cattle are pledged as security for general banking facilities granted to the Group (Note 30A).

121
JAPFA LTD | Annual Report 2016
NOTES TO THE FINANCIAL STATEMENTS31 DECEMBER 2016
19. BIOLOGICAL ASSETS (CONTINUED)
19C. Breeding swine
Group
2016US$’000
2015US$’000
Productive breeding swine:Balance at beginning of the year 12,972 13,987
Growing costs for the year 31,032 26,671
Purchase of swine 115 216
Reclassification from unproductive breeding swine 4,607 4,758
Sales / mortality of swine (4,324) (6,796)
Reclassification to inventories – (20,652)
Reclassification to unproductive breeding swine (30,049) (6,228)
Increase in fair value less estimated point of sale costs 1,577 1,703
Foreign exchange adjustments (226) (687)
Balance at end of the year 15,704 12,972
Unproductive breeding swine:Balance at beginning of the year 3,597 6,696
Growing costs for the year 11,626 7,818
Purchase of swine 203 –
Reclassification to productive breeding swine (4,607) (4,758)
Sales / mortality of swine (8,898) (8,936)
Reclassification from productive breeding swine 30,049 6,228
Transfer to inventories (26,511) (3,341)
Foreign exchange adjustments 184 (110)
Balance at end of the year 5,643 3,597
Total value of breeding swine 21,347 16,569
The quantity of breeding swine owned by the Group at end of the reporting year is shown below:
2016Head
2015Head
Productive breeding swine 45,807 36,209
Unproductive breeding swine 51,717 41,286
97,524 77,495
Breeding swine are pledged as security for general banking facilities granted to the Group (Note 30A).

122
Annual Report 2016 | JAPFA LTD
NOTES TO THE FINANCIAL STATEMENTS31 DECEMBER 2016
19. BIOLOGICAL ASSETS (CONTINUED)
19D. Dairy cows
Dairy cows
Group
2016US$’000
2015US$’000
Milkable cows:Balance at beginning of the year 154,165 125,635
Purchase of cows 652 –
Sales / mortality of cows (12,184) (10,487)
Reclassification from unproductive heifers and calves 70,299 61,628
Decrease in fair value less estimated point of sale costs (25,437) (13,477)
Foreign exchange adjustments (10,321) (9,134)
Balance at end of the year 177,174 154,165
Heifers and calves:Balance at beginning of the year 93,007 83,626
Purchase of heifers and calves 15,907 27,736
Growing costs for the year 67,327 61,832
Sales / mortality of cows (21,270) (21,018)
Reclassification to productive milkable cows (70,299) (61,628)
Increase in fair value less estimated point of sale costs 5,934 8,185
Foreign exchange adjustments (4,938) (5,726)
Balance at end of the year 85,668 93,007
Total value of dairy cows 262,842 247,172
The quantity of dairy cows owned by the Group at end of the reporting year is shown below:
Group
2016Head
2015Head
Milkable cows 42,973 34,459
Heifers and calves 39,289 37,041
82,262 71,500
Dairy cows are pledged as security for general banking facilities granted to the Group (Note 30A).

123
JAPFA LTD | Annual Report 2016
NOTES TO THE FINANCIAL STATEMENTS31 DECEMBER 2016
19. BIOLOGICAL ASSETS (CONTINUED)
19D. Dairy cows (continued)
The principal valuation assumptions adopted in applying the discounted cash flow approach are as follows:
2016 2015
Culling rate: Determined based on the estimated culling rate of the biological assets in the forecasted years due to natural or unnatural factors.
10%, 15%, 20%, 30%, 40%, 50%, 60% and 100%
10%, 15%, 20%, 30%, 40%, 50%, 60% and 100%
Natural birth rate: Determined based on the estimated natural birth rate of the biological assets in the forecasted years.
Not applicable Not applicable
Discount rate: Represents the pre-tax discount rate related to the specific risks of the relevant assets group.
PRC: 12.90%Indonesia: 18.65%
PRC: 13.32%Indonesia: 19.20%
Expected average prices of milk:
Determined after taking into account certain percentage growth, future demand and inflation.
Per LitrePRC: US$0.58
Indonesia: US$0.46
Per LitrePRC: US$0.66
Indonesia: US$0.51
Inflation rate of the raw materials:
Determined based on the estimated inflation index in the raw materials sourcing locations in the forecasted years.
Not applicable Not applicable
The amounts of the culling rates, natural birth rates, discount rates and inflation rates of the raw materials are in line with the public information.
The Group is exposed to fair value risks arising from changes in price of the dairy products. The Group does not anticipate that the price of the dairy products will decline significantly in the foreseeable future and management is of the view that there is no available cost effective derivative or other contracts which the Group can enter into to manage the risk of a decline in the price of the dairy products.

124
Annual Report 2016 | JAPFA LTD
NOTES TO THE FINANCIAL STATEMENTS31 DECEMBER 2016
19. BIOLOGICAL ASSETS (CONTINUED)
19E. Forage plants
Forage plants are usually sown in spring and harvested in autumn of the same year for feeding dairy cows. Loss in the reporting year arising from changes in fair value of forage plants amounted to US$1,643,000 (2015: US$2,948,000).
19F. Fair value measurement recognised in the statement of financial position
#A Fair value hierarchy
Biological assets measured at fair value and their categorisation in the fair value hierarchy is as follows:
Group
Level2016
US$’0002015
US$’000
Productive breeding cattle 3 12,624 19,025
Productive breeding swine 3 15,704 12,972
Heifers and calves 2 85,668 93,007
Milkable cows 3 177,175 154,165
Forage plants 2 1,643 2,948
292,814 282,117
The Group’s biological assets above were independently valued by Jones Lang LaSalle Sallmanns Limited (“JLL”), a firm of independent qualified professional valuers, who have appropriate qualifications and recent experiences in valuation of biological assets.
Productive breeding cattle, productive breeding swine, and heifers and calves:The fair value less costs to sell the productive breeding swine and cattle and heifers and calves are determined with reference to the market-determined prices (either derived from sales invoices or from comparable market transactions) of items with similar age, breed and genetic merit, if the market-determined prices are available.
Milkable cows:Due to the fact that the market-determined prices of milkable cows are not available, JLL has applied the discounted cash flow approach to calculate the fair value less costs to sell of these items.
#B Level 2 fair value measurements
For fair value measurements categorised within Level 2 of the fair value hierarchy, a description of the valuation techniques and the significant other observable inputs used in the fair value measurement are as follows:
Description Valuation techniques Observable inputs
Heifers and calves Market comparable approach Market-transacted prices
Forage plants Market comparable approach Market-transacted prices

125
JAPFA LTD | Annual Report 2016
NOTES TO THE FINANCIAL STATEMENTS31 DECEMBER 2016
19. BIOLOGICAL ASSETS (CONTINUED)
19F. Fair value measurement recognised in the statement of financial position (continued)
#C Level 3 fair value measurements
For fair value measurements categorised within Level 3 of the fair value hierarchy, a description of the valuation techniques and information about the significant unobservable inputs used in the fair value measurement are as follows:
Description Fair valueValuation techniques
Significant unobservable inputs Range
2016 2015 2016 2015
US$’000 US$’000
Productive breeding cattle
12,624 19,025 Market comparable approach
Market-transacted prices determined based on price per head and their weight
US$1,205 to US$2,962 per head
US$422 to US$2,885 per head
Productive breeding swine
15,704 12,972 Market comparable approach
Market-transacted prices determined based on price per head and their weight
US$287 to US$1,530 per head
US$277 to US$3,012 per head
Milkable cows
177,175 154,165 Income approach
Culling rate 10% to 100%
depending on lactation
period
10% to 100%
depending on lactation
period
Relationship of significant unobservable inputs to fair value:
Market-transacted prices – A significant increase or decrease in the market-transacted prices would result in a significant lower or higher fair value measurement.
Culling rate – A significant increase or decrease in the culling rate based on management’s assumptions would result in a significantly lower or higher fair value measurement.

126
Annual Report 2016 | JAPFA LTD
NOTES TO THE FINANCIAL STATEMENTS31 DECEMBER 2016
19. BIOLOGICAL ASSETS (CONTINUED)
19F. Fair value measurement recognised in the statement of financial position (continued)
The sensitivity analysis below has been determined based on reasonably possible changes of each significant assumption on the biological assets as of the end of the reporting year, assuming if all other assumptions were held constant:
Group
2016 2015
Increase/(decrease)
Change in present value of biological assets
Increase/(decrease)
Change in present value of biological assets
US$’000 US$’000
Discount rate +1% (2,648) +1% (2,589)
–1% 2,722 –1% 2,656
Price of productive swine +1% 157 +1% 130
–1% (157) –1% (130)
Price of productive cattle +1% 126 +1% 190
–1% (126) –1% (190)
Milk price +1% 3,772 +1% 3,483
–1% (3,772) –1% (3,481)
Feed cost for mature animals +1% (2,082) +1% (1,878)
–1% 2,082 –1% 1,878
Price of female calve at about 14-month age +1% 649 +1% 599
–1% (649) –1% (599)

127
JAPFA LTD | Annual Report 2016
NOTES TO THE FINANCIAL STATEMENTS31 DECEMBER 2016
20. TRADE AND OTHER RECEIVABLES
Group Company
2016US$’000
2015US$’000
2016US$’000
2015US$’000
Non-current:Other receivables:Third parties 1,484 – – –
Joint venture 313 349 – –
Total 1,797 349 – –
Current:Trade receivables:Third parties 144,912 127,673 – –
Joint venture 90 82 – –
Less: Allowance for impairment (3,114) (3,905) – –
Sub-total 141,888 123,850 – –
Other receivables:Subsidiaries – – 41,298 177,027
Investee company 10,070 – – –
Outside parties 9,470 8,531 197 150
Sub-total 19,540 8,531 41,495 177,177
Total 161,428 132,381 41,495 177,177
Group
2016US$’000
2015US$’000
Movements in above allowance:Balance at beginning of the year 3,905 709
Charged for trade receivables to profit or loss included in administrative expenses 11,040 3,500
Bad debts written-off (11,848) (161)
Foreign exchange adjustments 17 (143)
Balance at end of the year 3,114 3,905
Other receivables due from joint venture is an unsecured loan, which has no fixed terms of repayment and bears interest at 13.50% (2015: 13.50%) per annum.
Other receivables due from an investee company is an unsecured loan, amounting to US$10,070,000 (2015: Nil), which bears interest ranging from 1.50% to 1.56% (2015: Nil) per annum and is repayable on demand.
All other receivables from subsidiaries are unsecured. Other receivables from subsidiaries of US$40,220,000 (2015: US$40,745,000) bear interest ranging from 2.55% to 6.83% (2015: 2.39% to 6.83%) per annum and is repayable on demand. The remaining other receivables from subsidiaries are interest free and have no fixed terms of repayment.
Certain trade receivables are pledged as security for general banking facilities granted to the Group (Note 30A).

128
Annual Report 2016 | JAPFA LTD
NOTES TO THE FINANCIAL STATEMENTS31 DECEMBER 2016
21. OTHER FINANCIAL ASSETS
Group Company
2016US$’000
2015US$’000
2016US$’000
2015US$’000
Investments at fair value through profit or loss (Note 21A) – 3,546 – 3,546
Unquoted investments at cost less allowance for impairment (Note 21B) 8,762 5,563 546 546
Derivative financial assets (Note 21C) 245 420 – –
Call option asset (Note 17B) 2,948 – 2,948 –
11,955 9,529 3,494 4,092
Presented as:Other financial assets, current 791 9,529 546 4,092
Other financial assets, non-current 11,164 – 2,948 –
11,955 9,529 3,494 4,092
21A. Investments at fair value through profit or loss
Group Company
2016US$’000
2015US$’000
2016US$’000
2015US$’000
Quoted equity shares – 3,546 – 3,546
Movement during the year:Fair value at beginning of the year 3,546 2,285 3,546 2,285
Disposals (3,073) (1,236) (3,073) (1,236)
Increase/(decrease) in fair value through profit or loss under other gains (Note 7) (473) 2,497 (473) 2,497
Fair value at end of the year (Level 1) – 3,546 – 3,546
The quoted investment relates to equity shares of a company in the commodity trading business in Sri Lanka.
21B. Unquoted investments at cost less allowance for impairment
Group Company
2016US$’000
2015US$’000
2016US$’000
2015US$’000
Unquoted equity shares, at cost 8,762 5,563 546 546
Movement during the year:At beginning of the year 5,563 564 546 546
Additions 3,200 5,000 – –
Foreign exchange adjustments (1) (1) – –
At end of the year 8,762 5,563 546 546

129
JAPFA LTD | Annual Report 2016
NOTES TO THE FINANCIAL STATEMENTS31 DECEMBER 2016
21. OTHER FINANCIAL ASSETS (CONTINUED)
21B. Unquoted investments at cost less allowance for impairment (continued)
The unquoted investments relate to equity shares of entities in Singapore and Indonesia.
The fair value of these unquoted investments are not deemed to be reliably measured as the probabilities of the various estimates within the range cannot be reasonably assessed in estimating fair values. Consequently, unquoted equity instruments are carried at cost less any accumulated allowance for impairment. Impairment losses recognised in profit or loss for equity investments are not reversed.
21C. Derivative financial instruments
Group
2016US$’000
2015US$’000
Interest rate swap 245 (166)
Foreign currency forward contracts (274) 420
(29) 254
Presented as:Derivative financial assets (Note 21) 245 420
Derivative financial liabilities (Note 31) (274) (166)
(29) 254
Group
2016 2015
Notionalamount
Assets/(liabilities)
Notionalamount
Assets/(liabilities)
US$’000 US$’000 US$’000 US$’000
Foreign currency forward contracts 153,333 (274) 90,095 420
Interest rate swap contracts 153,333 245 43,666 (166)
(29) 254
Foreign currency forward contracts
Forward currency contracts are used to hedge foreign currency risk arising from the Group’s bank loans denominated in USD for which firm commitments existed at the reporting year end.
Forward currency contracts are valued using a valuation technique with market observable inputs. The most frequently applied valuation technique includes forward pricing model, using present value calculations. The model incorporates various inputs including the credit quality of counterparties, foreign exchange spot and forward rates (Level 2).
Interest rate swaps
In 2016, the Group entered into interest rate swap contracts amounting to US$153,333,000 (2015: US$43,666,000) to hedge interest rate risk arising from floating rate USD long-term bank loans. The interest rate swap received floating interest rate equal to 3-month LIBOR (2015: LIBOR x 111%) per annum and pays a fixed rate of 1.69% (2015: 1.53%) per annum. The interest rate swap will mature on 14 September 2021 (2015: 20 December 2018).
Interest rate swap contracts are valued using a valuation technique with market observable inputs. The most frequently applied valuation technique includes swap model using present value calculations. The model incorporates various inputs including interest rate curves and forward rate curves (Level 2).

130
Annual Report 2016 | JAPFA LTD
NOTES TO THE FINANCIAL STATEMENTS31 DECEMBER 2016
22. OTHER ASSETS
Group Company
2016US$’000
2015US$’000
2016US$’000
2015US$’000
Non-current:Deposits to secure services 4,021 4,798 – –
Deferred charges 4,260 4,031 – –
Land use rights (Note 22A) 5,871 1,293 – –
Advances 268 351 – –
Tax recoverable 576 1,170 – –
Others 534 3,422 – –
15,530 15,065 – –
Current:Advances 48,856 45,815 – –
Prepayments 13,452 12,150 53 46
Prepaid taxes 24,657 37,339 6 12
86,965 95,304 59 58
22A. Land use rights
Group
2016US$’000
2015US$’000
Cost:At beginning of the year 1,439 470
Foreign exchange adjustments – (47)
Additions 4,900 1,016
At end of the year 6,339 1,439
Accumulated amortisation:At beginning of the year 146 135
Foreign exchange adjustments 84 (12)
Amortisation for the year 238 23
At end of the year 468 146
Net carrying amount:At beginning of the year 1,293 335
At end of the year 5,871 1,293
Balance to be amortised:Not later than one year 251 56
Later than one year but not later than five years 906 210
Later than five years 4,714 1,027
The land use rights refer to land owned by third parties rented by the Group for its business in China, Indonesia and Myanmar. The land use rights in China, Indonesia and Myanmar expire in 2031 to 2040, 2046, and 2085 respectively. The land use rights are not transferable.

131
JAPFA LTD | Annual Report 2016
NOTES TO THE FINANCIAL STATEMENTS31 DECEMBER 2016
23. INVENTORIES
Group
2016US$’000
2015US$’000
Finished goods 172,234 135,867
Work in process 50,509 45,480
Raw materials 348,884 391,573
Others 40,280 36,517
611,907 609,437
Inventories are stated after allowance as follows:Balance at beginning of the reporting year 635 350
Charge to profit or loss included in cost of sales 4,168 5,200
Amount written-off (3,320) (4,816)
Foreign exchange adjustments (38) (99)
Balance at end of the reporting year 1,445 635
The cost of inventories included in cost of sales was US$2,367,575,000 (2015:US$2,266,806,000).
Certain inventories are pledged as security for general banking facilities granted to the Group (Note 30A).
24. CASH AND CASH EQUIVALENTS
Group Company
2016US$’000
2015US$’000
2016US$’000
2015US$’000
Not restricted in use 331,086 140,769 10,166 14,258
Cash pledged for bank facilities 5,067 7,166 – –
336,153 147,935 10,166 14,258
Interest earning balances 19,742 29,567 – –
The interest rate for the cash on interest earning accounts is insignificant.
24A. Cash and cash equivalents in the consolidated statement of cash flows
Group
2016US$’000
2015US$’000
Amount as shown above 336,153 147,935
Cash pledged for bank facilities (Note 30A) (5,067) (7,166)
Cash and cash equivalents in consolidated statement of cash flows 331,086 140,769

132
Annual Report 2016 | JAPFA LTD
NOTES TO THE FINANCIAL STATEMENTS31 DECEMBER 2016
24. CASH AND CASH EQUIVALENTS (CONTINUED)
24B. Non-cash transactions
The net cash incurred for the purchase of property, plant and equipment is as follows:
Group
2016US$’000
2015US$’000
Additions of property, plant and equipment (Note 14) 176,123 147,358
Less: Net movements in liability for purchase of plant and equipment and construction cost payables (Note 29) (7,702) 5,508
Purchase of property, plant and equipment in consolidated statement of cash flows 168,421 152,866
25. SHARE CAPITAL
Group and Company
2016 2015
Number of shares
issuedShare
capital
Number of shares
issuedShare
capital
‘000 US$’000 ‘000 US$’000
Ordinary shares of no par value:At 1 January 2015, 31 December 2015
and 31 December 2016 1,764,670 937,614 1,764,670 937,614
Capital management:
In order to maintain its listing on the Singapore Stock Exchange, the Company has to have share capital with a free float of at least 10% of its shares. The Company met the capital requirement on its initial listing and the rules limiting treasury share purchases mean it will continue to satisfy that requirement, as it did throughout the reporting year. Management receives a report from the share registrars frequently on substantial share interests showing the non-free float to ensure continuing compliance with the 10% limit throughout the reporting year.
The objectives when managing capital are: to safeguard the reporting entity’s ability to continue as a going concern, so that it can continue to provide returns for owners and benefits for other stakeholders, and to provide an adequate return to owners by pricing the sales commensurately with the level of risk. The management sets the amount of capital to meet its requirements and the risk taken. There were no changes in the approach to capital management during the reporting year. The management manages the capital structure and makes adjustments to it where necessary or possible in the light of changes in conditions and the risk characteristics of the underlying assets. In order to maintain or adjust the capital structure, the management may adjust the amount of dividends paid to owners, return capital to owners, issue new shares, or sell assets to reduce debt. Adjusted capital comprises all components of equity.

133
JAPFA LTD | Annual Report 2016
NOTES TO THE FINANCIAL STATEMENTS31 DECEMBER 2016
25. SHARE CAPITAL (CONTINUED)
Capital management (continued):
The management monitors the capital on the basis of the debt-to-adjusted capital ratio. This ratio is calculated as net debt/adjusted capital (as shown below). Net debt is calculated as total borrowings less cash and cash equivalents.
Group
2016US$’000
2015US$’000
(Restated)
Net debt:All current and non-current borrowings including finance leases 839,808 840,341
Less: Cash and cash equivalents (336,153) (147,935)
Net debt 503,655 692,406
Total equity 1,089,189 827,670
Debt-to-adjusted capital ratio 0.46 times 0.84 times
26. OTHER RESERVES
Group Company
2016US$’000
2015US$’000
2016US$’000
2015US$’000
General reserve (Note 26A) 19,139 19,139 – –
Capital reserve (adverse balance) (Note 26B) (413,733) (430,524) – –
Statutory reserve (Note 26C) 15,243 13,852 – –
Share option reserve (Note 26D) 1,709 1,218 – –
Performance share reserve (Note 26E) 3,138 – 3,138 –
Sub-total (374,504) (396,315) 3,138 –
Translation reserve (Note 26F) (179,614) (171,776) – –
Total (554,118) (568,091) 3,138 –
26A. General reserve
The general reserve relates mainly to revaluation surplus attributed to the initial interest held in PT Japfa Comfeed Indonesia Tbk.

134
Annual Report 2016 | JAPFA LTD
NOTES TO THE FINANCIAL STATEMENTS31 DECEMBER 2016
26. OTHER RESERVES (CONTINUED)
26B. Capital reserve (adverse balance)
Group
2016US$’000
2015US$’000
At beginning of the year (430,524) (428,799)
Disposal of shares in subsidiary to non-controlling interests without change in control (Note 17E) 7,876 –
Deemed disposal of subsidiary without change in control (Note 17E) 10,660 –
Acquisition of non-controlling interests without change in control (Notes 17E and 17F) (1,745) (1,725)
At end of the year (413,733) (430,524)
The capital reserve arises from the acquisitions or disposals of non-controlling interests in subsidiaries without change in control and from the effects of business combination between entities under common control. The capital reserve relates mainly to the share capital of the following components which are assumed to be subsidiaries of the Company with effect from 1 January 2011:
(a) AustAsia Investment Holdings Pte Ltd(b) PT Greenfields Indonesia(c) PT AustAsia Food(d) AustAsia Food Pte Ltd(e) AustAsia Food (M) Sdn Bhd(f) AustAsia Food HK Limited
In applying merger accounting, financial statement items of the combining entities for the reporting period in which the common control combination occurs, and for the comparative periods disclosed, are included in the consolidated financial statements of the Group as if the combination had occurred from the date when the combining entities first came under the control of the controlling party or parties. The share capital of the combining entities have been reclassified to capital reserve in the consolidated financial statements of the Group.
Upon completion of the restructuring exercise on 1 May 2014, the cost of investment in AustAsia Investment Holdings Pte Ltd of US$555,566,000 has been adjusted against the capital reserve in the consolidated financial statements.
26C. Statutory reserve
Group
2016US$’000
2015US$’000
At beginning of the year 13,852 9,813
Transfer from retained earnings 1,391 4,039
At end of the year 15,243 13,852
In accordance with the Foreign Enterprise Law applicable to the subsidiaries in the People’s Republic of China (“PRC”), the subsidiaries are required to make appropriation to a statutory reserve. At least 10% of the statutory profits after tax as determined in accordance with the applicable PRC accounting standards and regulations must be allocated to a statutory reserve until the cumulative total of the statutory reserve reaches 50% of the subsidiaries’ registered capital. Subject to approval from the relevant PRC authorities, the statutory reserve may be used to offset any accumulated losses or increase the registered capital of the subsidiaries. The statutory reserve is not available for dividend distribution to shareholders.

135
JAPFA LTD | Annual Report 2016
NOTES TO THE FINANCIAL STATEMENTS31 DECEMBER 2016
26. OTHER RESERVES (CONTINUED)
26D. Share option reserve
Group
2016US$’000
2015US$’000
At beginning of the year 1,218 916
Grant of share options 491 302
At end of the year 1,709 1,218
Share Option Plan
The share option plan is of one of the subsidiaries, AustAsia Investment Holdings Pte Ltd (“AIH”). Under this plan, share options are granted to employees of the PRC and Singapore subsidiaries of AIH with four years’ service. The exercise price of the share options is equal to the market price of the underlying shares on the date of grant. The share options vest if and when AIH’s initial public offering is completed and the employees fulfil continuous employment of four years. The share options granted will not vest if the initial public offering is not completed.
The total number of share options granted under the plan should not exceed 2% of the total number of shares issued by AIH before the date of grant.
The fair value of the share options is estimated at the grant date using a binomial option pricing model, taking into account the terms and conditions upon which the share options were granted. There are no cash settlement alternatives.
The expenses recognised for employees services received during the year is shown below:
Group
2016US$’000
2015US$’000
Expense arising from equity-settled share-based payment
transactions 491 302
There were no cancellations or modifications to the awards in 2015 and 2016.
The following table illustrates the number and weighted average exercise prices (WAEP) of, and movements in, share options during the year:
2016 2015
Number WAEP Number WAEP
US$/share US$/share
Outstanding at 1 January 2,125,000 1.33 1,690,000 1.29
Granted during the year 2,459,230 1.50 575,000 1.45
Forfeited during the year (175,000) 1.38 (140,000) 1.40
Outstanding at 31 December 4,409,230 1.42 2,125,000 1.33

136
Annual Report 2016 | JAPFA LTD
NOTES TO THE FINANCIAL STATEMENTS31 DECEMBER 2016
26. OTHER RESERVES (CONTINUED)
26D. Share Option reserve (continued)
The following table list the inputs to the binomial option pricing model used for the plan for the years ended 31 December 2016 and 2015:
2016 2015
Dividend yield (%) – –
Expected volatility (%) 44.50 39.60
Risk-free interest rate (%) 1.17 1.39
Expected life of share options (years) 4.11 4.67
Weighted average share price (US$) 1.80 1.78
The expected life of the share option is based on historical data and current expectations and is not necessarily indicative of exercise patterns that may occur. The expected volatility reflects the assumption that the historical volatility over a period similar to the life of the options is indicative of future trends, which may not necessarily be the actual outcome.
26E. Performance share reserve
Group and Company
2016US$’000
2015US$’000
At beginning of the year – –
Value of employee service pursuant to performance share plan 3,138 –
At end of the year 3,138 –
Japfa Performance Share Plan
The Company has a share scheme known as the “Japfa Performance Share Plan” (the “Japfa PSP”). The Japfa PSP, which forms an integral component of its compensation plan, is designed to foster an ownership culture within the Group which aligns the interests of the participants with interests of the shareholders’ of the Company. It provides an opportunity to motivate participants to achieve the Group’s key financial and operational goals and makes total employee remuneration sufficiently competitive to recruit and retain staff having skills that are commensurate with the Group’s ambition.
Under the rules of the Japfa PSP, the directors and employees of the Group who have attained the age of 21 years and hold such rank as may be designated by the remuneration committee of the Company from time to time are eligible to participate in the Japfa PSP. Controlling shareholders or their associates are also eligible to participate in the Japfa PSP subject to the approval of independent shareholders in the form of separate resolutions for each participant and each awards granted.

137
JAPFA LTD | Annual Report 2016
NOTES TO THE FINANCIAL STATEMENTS31 DECEMBER 2016
26. OTHER RESERVES (CONTINUED)
26E. Performance share reserve (continued)
The remuneration committee administers the Japfa PSP in accordance with the rules of the Japfa PSP. The number of shares to be offered to a participant shall be determined at the discretion of the remuneration committee who shall take into account criteria such as the rank, performance, seniority, potential for future development and length of service of the participant provided that:
(a) the total number of shares which may be offered during the entire operation of the Japfa PSP (including adjustments under the rules) shall not exceed 15% of the shares of the total number of issued shares of the Company (excluding shares held by the Company as treasury shares);
(b) the aggregate number of shares which may be offered to participants who are controlling shareholders and their associates during the entire operation of the Japfa PSP (including adjustments under the rules) shall not exceed 25% of the shares in respect of which the Company may grant under the Japfa PSP; and
(c) the number of shares which may be offered to each participant who is a controlling shareholder
or his associate during the entire operation of the Japfa PSP shall not exceed 10% of the shares in respect of which the Company may grant under the Japfa PSP.
The Japfa PSP shall continue to be in force at the discretion of the remuneration committee, subject to a maximum period of 10 years commencing on 23 July 2014, provided always that the Japfa PSP may continue beyond the above stipulated period with the approval of the Company’s shareholders by ordinary resolution in general meeting and of any relevant authorities which may then be required.
Since the commencement of the Japfa PSP till the end of the reporting year, no shares have been granted pursuant to the Japfa PSP.
On 1 March 2017, pursuant to Japfa PSP, the Company granted and issued 4,855,200 shares to the executive directors and employees of the Group for their performance in 2016. Details of shares granted are as follows:
No. of shares granted
2016
Employees of the Company and subsidiaries 210,900
Directors of the Company:Tan Yong Nang 4,600,000
Kevin John Monteiro 44,300
Controlling shareholders (and their associates) of the Company –
4,855,200

138
Annual Report 2016 | JAPFA LTD
NOTES TO THE FINANCIAL STATEMENTS31 DECEMBER 2016
26. OTHER RESERVES (CONTINUED)
26E. Performance share reserve (continued)
The new shares issued rank pari passu in all respects with the existing shares of the Company. Following the issuance of the new shares, the total number of issued and fully-paid shares in the share capital of the Company has increased from 1,764,670,391 to 1,769,525,591 ordinary shares.
The estimated fair value of awards granted and recognised as employees services received during the reporting year is shown in the following table:
Group and Company
2016 2015
US$’000 US$’000
Expense arising from equity-settled share-based payment
transactions 3,138 –
26F. Translation reserve
Group and Company
2016US$’000
2015US$’000
At beginning of the year (171,776) (115,416)
Exchange differences on translating foreign operations (7,838) (56,360)
At end of the year (179,614) (171,776)
The translation reserve represents exchange differences arising from the translation of financial statements of foreign operations whose functional currencies are different from presentation currency of the Group.

139
JAPFA LTD | Annual Report 2016
NOTES TO THE FINANCIAL STATEMENTS31 DECEMBER 2016
27. PUT OPTION FINANCIAL LIABILITIES
The put option financial liabilities relate to the present values of redemption amount arose from the AIH and AIH2 Put Options disclosed in Note 17B above.
Group
Level 2016 2015
US$’000 US$’000
Present value of redemption amount:Balance at beginning of reporting year – –
Restatement (Note 39) 180,946 166,536
Balance at beginning of reporting year, restated 180,946 166,536
Changes in present value included in equity (10,967) 14,410
Balance at end of reporting year 2 169,979 180,946
The present values of the redemption amount and fair value measurement of financial instruments on a recurring basis are determined using Monte Carlo Simulation Model as well as the inputs stated in the shareholders’ agreement between the Company and non-controlling interests in AIH and AIH2.
At the end of reporting year, the carrying amounts of the financial instruments in relation to AIH and AIH2 Put Options approximate their fair value.
The sensitivity analysis below has been determined based on reasonably possible changes of each significant assumption on the put option financial liabilities as of the end of the reporting year, assuming if all other assumptions were held constant:
Group
2016 2015
Increase/(decrease)
Change in present value of put option
financial liabilities
Increase/(decrease)
Change in present value of put option
financial liabilities
US$’000 US$’000
Share price +10% 17,495 +10% 18,572
–10% (16,713) –10% (18,267)
Volatility +10% (3,311) +10% (6,101)
–10% (5,668) –10% (5,631)
28. PROVISIONS
Group
2016US$’000
2015US$’000
Present value of unfunded defined benefit 93,468 77,210
Fair value of plan assets (3,943) (2,409)
Retirement benefit obligations 89,525 74,801

140
Annual Report 2016 | JAPFA LTD
NOTES TO THE FINANCIAL STATEMENTS31 DECEMBER 2016
28. PROVISIONS (CONTINUED)
Defined benefit plan:
The Group operates a defined benefit plan for qualifying employees of its subsidiaries in Indonesia, in accordance with Indonesian Labour Laws. Amounts are determined based on years of service and salaries of the employees at the time of the pension.
The cost of providing post-employment benefits was calculated based on actuarial valuations performed by PT Dayamandiri Dharmakonsilindo, an independent actuary. The principal actuarial assumptions used for the purpose of the actuarial valuation at 31 December 2016 and 2015 were as follows:
2016 2015
Discount rate: 8.26% – 8.65%; 8.89% – 9.45%;
Withdrawal / resignation rate: 10% at age of 25 and decreasing linearly to 0% at age 45 and thereafter
10% at age of 25 and decreasing linearly to 0% at age 45 and thereafter
Expected rate of salary increases: 9% – 10% 9% – 12%
Expected rate of mortality rate: Based on Indonesian Mortality Table (TMI-III) – 2011
Based on Indonesian Mortality Table (TMI-III) – 2011
Movements of the defined benefit post-employment provision recognised in statement of financial position are as follows:
Group
2016US$’000
2015US$’000
Balance at beginning of the year 74,801 81,316
Net benefit expense recognised in profit or loss (Note 11) 10,500 12,836
Re-measurement loss / (income) included in other comprehensive income 7,144 (3,563)
Payments for the year (618) (2,493)
Foreign exchange adjustments 2,203 (8,678)
Contributions to plan made (4,505) (4,328)
Others – (289)
Balance at end of the year 89,525 74,801

141
JAPFA LTD | Annual Report 2016
NOTES TO THE FINANCIAL STATEMENTS31 DECEMBER 2016
28. PROVISIONS (CONTINUED)
Net benefit expense recognised in profit or loss under administrative expenses is as follows:
Group
2016US$’000
2015US$’000
Service costs 7,152 6,062
Past service costs and gain from settlements (3,139) 218
Net interest expense 6,445 6,107
Actuarial losses arising from changes in actuarial assumptions – 65
Excess benefit paid by Indo subsidiaries to employees 19 93
Immediate adjustment 77 291
Curtailment (54) –
10,500 12,836
Re-measurement loss / (income) included in other comprehensive income is as follows:
Group
2016US$’000
2015US$’000
Re-measurement loss / (income) as above 7,144 (3,563)
Income tax effect (1,555) 800
Re-measurement of the net defined benefits plan, net of tax 5,589 (2,763)
Movements in the fair value of the plan assets are as follows:
Group
2016US$’000
2015US$’000
Balance at beginning of the year 2,409 –
Interest income 299 99
Return on plan assets (excluding amounts included in net interest expense) (65) (14)
Contributions from the employer 4,486 4,534
Benefits paid (3,249) (2,145)
Foreign exchange adjustments 63 (65)
Balance at end of the year 3,943 2,409

142
Annual Report 2016 | JAPFA LTD
NOTES TO THE FINANCIAL STATEMENTS31 DECEMBER 2016
28. PROVISIONS (CONTINUED)
The sensitivity analysis below has been determined based on reasonably possible changes of each significant assumption on the employee benefit liabilities as of the end of the reporting period, assuming if all other assumptions were held constant:
Group
2016 2015
Increase/(decrease)
Change in present value of retirement
benefit obligations
Increase/(decrease)
Change in present value of retirement
benefit obligations
US$’000 US$’000
Discount rate +1% (2,443) +1% (2,628)
–1% 12,998 –1% 8,738
Salary increase rate +1% 13,164 +1% 8,992
–1% (3,101) –1% (3,165)
29. TRADE AND OTHER PAYABLES
Group Company
2016US$’000
2015US$’000
2016US$’000
2015US$’000
Trade payables:Outside parties and accrued liabilities 190,922 172,408 18 18
Joint venture 120 38 – –
Related parties 409 556 – –
Subtotal 191,451 173,002 18 18
Other payables:Outside parties and accrued liabilities 86,102 69,483 2,006 2,101
Construction cost payables 21,179 16,082 – –
Payable for purchase of plant and equipment 4,882 2,046 – –
Subtotal 112,163 87,611 2,006 2,101
Total 303,614 260,613 2,024 2,119
Presented as:Trade and other payables, current 301,507 259,971 2,204 2,119
Trade and other payables, non-current 2,107 642 – –
303,614 260,613 2,204 2,119
Construction cost payables pertain to progressive billings from suppliers for the construction of building offices, infrastructure and cowsheds.

143
JAPFA LTD | Annual Report 2016
NOTES TO THE FINANCIAL STATEMENTS31 DECEMBER 2016
30. LOANS AND BORROWINGS
Group Company
2016US$’000
2015US$’000
2016US$’000
2015US$’000
Non-current:Floating interest rate financial instruments:Bank loans (Note 30A) 195,808 195,801 – –
Fixed interest rate financial instruments:Bank loans (Note 30A) 55,551 7,232 – –
Finance leases (Note 30B) 147 975 – –
Bonds payable (Note 30C) 268,587 306,428 – –
Non-current, total 520,093 510,436 – –
Current:Floating interest rate financial instruments:Bank loans (Note 30A) 166,002 295,641 – 20,250
Fixed interest rate financial instruments:Bank loans (Note 30A) 41,273 33,159 – –
Finance leases (Note 30B) 800 1,105 – –
Bonds payable (Note 30C) 111,640 – – –
Current, total 319,715 329,905 – 20,250
Total 839,808 840,341 – 20,250
Non-current portion is repayable:Due within 2-5 years 520,093 491,458 – –
After 5 years – 18,978 – –
Group Company
2016%
2015%
2016%
2015%
Range of fixed interest rates per annum:Bank loans 4.0 – 7.13 4.1 – 10.25 – –
Bonds payable 6.0 – 9.9 6.0 – 9.9 – –
Finance leases 4.4 – 6.5 4.4 – 6.5 – –
Range of floating interest rates per annum:Bank loans 2.32 – 10.5 2.34 – 12.5 – 5.38
30A. Bank loans
The bank loans are secured by property, plant and equipment, share certificates of certain subsidiaries, cash and cash equivalents, receivables, inventories, biological assets, assessment of insurance policies and covered corporate guarantees of subsidiaries.
The loans are for working capital purposes and repayment of restructured debts. The loan agreements generally include covenants that require the maintenance of certain financial ratios. Any non-compliance with these covenants will result in these loans becoming repayable upon service of notice of default of the lenders.

144
Annual Report 2016 | JAPFA LTD
NOTES TO THE FINANCIAL STATEMENTS31 DECEMBER 2016
30. LOANS AND BORROWINGS (CONTINUED)
30A. Bank loans (continued)
The fair value (Level 2) of bank loans (secured) totaling US$361,810,000 (2015: US$491,442,000) that bear floating rates of interest is a reasonable approximation of the carrying amount due to their short term nature or that they are floating rate instruments that are frequently re-priced to market interest rates.
The fair value (Level 2) of bank loans (secured) totaling US$96,824,000 (2015: US$40,391,000) that bear fixed rates of interest is a reasonable approximation of the carrying amount due to their short term nature or that they are fixed rate instruments that are frequently re-priced to market interest rates.
30B. Finance Leases
GroupMinimumpayments
Financecharges Present value
US$’000 US$’000 US$’000
2016Minimum lease payments payable:Due within one year 820 (20) 800
Due within 2 to 5 years 149 (2) 147
Total 969 (22) 947
Net book value of plant and equipment under finance leases 4,234
2015Minimum lease payments payable:Due within one year 1,146 (41) 1,105
Due within 2 to 5 years 998 (23) 975
Total 2,144 (64) 2,080
Net book value of plant and equipment under finance leases 6,552
There are leases for certain of the Group’s plant and equipment. The average lease term is 3 to 5 years (2015: 3 to 5 years). All leases are on a fixed repayment basis and no arrangements have been entered into for contingent rental payments. The obligations under finance leases are secured by the lessors’ charge over the leased assets.
The carrying amount of the lease liabilities is not significantly different from the fair value.
30C. Bonds payable
Group
2016US$’000
2015US$’000
Bonds payable A 111,640 108,240
Bonds payable B 197,000 202,478
Bonds payable C 74,427 –
Less: Unamortised transaction costs (2,840) (4,290)
380,227 306,428

145
JAPFA LTD | Annual Report 2016
NOTES TO THE FINANCIAL STATEMENTS31 DECEMBER 2016
30. LOANS AND BORROWINGS (CONTINUED)
30C. Bonds payable (continued)
Effective interest rates per annum:
Group
2016%
2015%
Bonds payable A 10.12 10.12
Bonds payable B 6.98 6.98
Bonds payable C 9.71 –
The fair values of bonds payables are as follows:
Group
Level 2016US$’000
2015US$’000
Bonds payable A 1 111,711 106,972
Bonds payable B 1 198,970 164,187
Bonds payable C 1 75,117 –
Fair value at end of the year 385,798 271,159
Bonds payable A
In January and February 2012, PT Japfa Comfeed Indonesia Tbk, a subsidiary, issued bonds denominated in Indonesia Rupiah (“IDR”) with a nominal value of IDR1,250 billion and IDR250 billion respectively (total nominal value of IDR1,500 billion). These bonds are listed on the Indonesia Stock Exchange. The bonds are repayable in January 2017 with a fixed interest rate of 9.9% per annum payable quarterly. See Note 37 for events after the end of the reporting year.
Bonds payable B
In May 2013, the subsidiary, Comfeed Finance B.V., issued US$225,000,000, 6% senior notes which are traded on the Singapore Exchange. The senior notes are repayable in May 2018 and the interest will be repayable semi-annually. The senior notes are guaranteed by PT Japfa Comfeed Indonesia Tbk, the parent company of Comfeed Finance B.V. and certain subsidiaries of PT Japfa Comfeed Indonesia Tbk.
During the reporting year, PT Japfa Comfeed Indonesia Tbk, a subsidiary of the Company purchased from the market US$6,000,000 (2015: US$22,000,000) (nominal value) of Comfeed Finance B.V.’s outstanding bonds with net book value of US$5,912,000 (2015: US$21,785,000) for US$5,323,000 (2015: US$15,385,000). The purchases resulted in a gain amounting to US$589,000 (2015: US$6,400,000) which is included in other gains (Note 7).

146
Annual Report 2016 | JAPFA LTD
NOTES TO THE FINANCIAL STATEMENTS31 DECEMBER 2016
30. LOANS AND BORROWINGS (CONTINUED)
30C. Bonds payable (continued)
Bonds payable C
In December 2016, the subsidiary, PT Japfa Comfeed Indonesia Tbk issued bonds denominated in IDR with a nominal value of IDR850 billion and IDR150 billion bonds respectively (total nominal value of IDR1,000 billion) listed on the Indonesia Stock Exchange. The nominal value of IDR850 billion bond is repayable in December 2019 with a fixed interest rate of 9.25% per annum payable quarterly. The nominal value of IDR150 billion bond is repayable in December 2021 with a fixed interest rate of 9.75% per annum payable quarterly. PT Japfa Comfeed Indonesia Tbk has an option to redeem the bonds, partially or in full, after a year from the issuance date.
31. OTHER FINANCIAL LIABILITIES
Group
2016US$’000
2015US$’000
Derivative financial liabilities (Note 21C) 274 166
32. OTHER LIABILITIES
Group
2016US$’000
2015US$’000
Advances received 8,077 7,038
Deferred government grants (Note 32A) 3,754 3,315
Others 335 140
12,166 10,493
Presented as:Other liabilities, current 8,958 7,226
Other liabilities, non-current 3,208 3,267
12,166 10,493
32A. Deferred government grants
Group
2016US$’000
2015US$’000
Balance at beginning of the year 3,315 2,548
Received during the year 1,108 1,330
Released during the year (413) (387)
Foreign exchange adjustments (256) (176)
Balance at end of the year 3,754 3,315
Government grants have been received for the construction of certain items of property, plant and equipment. There are no unfulfilled conditions or contingencies attached to these grants.

147
JAPFA LTD | Annual Report 2016
NOTES TO THE FINANCIAL STATEMENTS31 DECEMBER 2016
33. DIVIDENDS ON EQUITY SHARES
Group
2016US$’000
2015US$’000
Final tax exempt (1-tier) dividend paid of 0.5 Singapore cent per share for reporting year ended 31 December 2015 6,464 –
On 1 March 2017, the directors of the Company recommended that a tax-exempt one-tier final dividend of 1.0 Singapore cent per ordinary share, amounting to a total of US$12,540,000 be paid for the reporting year ended 31 December 2016. The dividend is subject to approval by shareholders at the forthcoming Annual General Meeting and hence the proposed dividend has not been accrued as a liability in these financial statements.
34. FINANCIAL INSTRUMENTS: INFORMATION ON FINANCIAL RISKS
34A. Categories of financial assets and liabilities
The following table categorises the carrying amount of financial assets and liabilities recorded at the end of the reporting year:
Group Company
2016US$’000
2015US$’000
2016US$’000
2015US$’000
Financial assets:Cash and cash equivalents 336,153 147,935 10,166 14,258
Trade and other receivables 163,225 132,730 41,495 177,177
Financial instruments at fair value through profit or loss 3,193 3,966 2,948 3,546
Available-for-sale financial assets 8,762 5,563 546 546
511,333 290,194 55,155 195,527
Financial liabilities:Loan and borrowings at amortised cost 839,808 840,341 – 20,250
Trade and other payables at amortised cost 303,614 260,613 2,024 2,119
Derivative financial liabilities at fair value 274 166 – –
Put option financial liabilities at fair value 169,979 180,946 – –
1,313,675 1,282,066 2,024 22,369
Further quantitative disclosures are included throughout these financial statements.

148
Annual Report 2016 | JAPFA LTD
NOTES TO THE FINANCIAL STATEMENTS31 DECEMBER 2016
34. FINANCIAL INSTRUMENTS: INFORMATION ON FINANCIAL RISKS (CONTINUED)
34B. Financial risk management
The main purpose for holding or issuing financial instruments is to raise and manage the finances for the Group’s operating, investing and financing activities. There are exposures to the financial risks on the financial instruments such as credit risk, liquidity risk and market risk comprising interest rate, currency risk, commodity price risk and price risk exposures. Management has certain practices for the management of financial risks. The guidelines set up the short and long term objectives and action to be taken in order to manage the financial risks. The guidelines include the following:
(i) Minimise interest rate, currency, credit and market risk for all kinds of transactions.(ii) Maximise the use of “natural hedge”: favouring as much as possible the natural off-setting of sales
and costs and payables and receivables denominated in the same currency and therefore put in place hedging strategies only for the excess balance. The same strategy is pursued with regard to interest rate risk.
(iii) Enter into derivatives or any other similar instruments solely for hedging purposes.(iv) All financial risk management activities are carried out and monitored at central level.(v) All financial risk management activities are carried out following good market practices.(vi) May consider investing in shares or similar instruments.
There have been no changes to the exposures to risk; the objectives, policies and processes for managing the risk and the methods used to measure the risk.
The main risk arising from the Group’s biological assets is business risk. The Group has institutionalised a comprehensive health management and quarantine system for all its operations to ensure a consistently high standard of good healthcare management and hygiene for its breeding livestock and dairy cows.
34C. Fair values of financial instruments
The analyses of financial instruments that are measured subsequent to initial recognition at fair value, grouped into Levels 1 to 3 are disclosed in the relevant notes to the financial statements. These include the significant financial instruments stated at amortised cost and at fair value in the statement of financial position. The carrying values of current financial instruments approximate their fair values due to the short-term maturity of these instruments and the disclosures of fair value are not made when the carrying amount of current financial instruments is a reasonable approximation of the fair value.
34D. Credit risk on financial assets
Financial assets that are potentially subject to concentrations of credit risk and failures by counterparties to discharge their obligations in full or in a timely manner consist principally of cash balances with banks, cash equivalents, receivables and certain other financial assets. The maximum exposure to credit risk is: the total of the fair value of the financial assets; the maximum amount the entity could have to pay if the guarantee is called on; and the full amount of any payable commitments at the end of the reporting year. Credit risk on cash balances with banks and any other financial instruments is limited because the counter-parties are entities with acceptable credit ratings. Credit risk on other financial assets is limited because the other parties are entities with acceptable credit ratings. For credit risk on receivables an ongoing credit evaluation is performed on the financial condition of the debtors and a loss from impairment is recognised in profit or loss. The exposure to credit risk with customers is controlled by setting limits on the exposure to individual customers and these are disseminated to the relevant persons concerned and compliance is monitored by management.

149
JAPFA LTD | Annual Report 2016
NOTES TO THE FINANCIAL STATEMENTS31 DECEMBER 2016
34. FINANCIAL INSTRUMENTS: INFORMATION ON FINANCIAL RISKS (CONTINUED)
34D. Credit risk on financial assets (continued)
There is no significant concentration of credit risk on receivables, as the exposure is spread over a large number of counter-parties and customers unless otherwise disclosed in the notes to the financial statements below.
Cash and cash equivalents disclosed in Note 24 represents amounts with less than 90-days maturity.
As part of the process of setting customer credit limits, different credit terms are used. The average credit period generally granted to trade receivable customers is about 7 – 60 days (2015: 7 – 60 days). But some customers take a longer period to settle the amounts.
(a) Ageing analysis of the age of trade receivable amounts that are past due as at the end of reporting year but not impaired:
Group
2016US$’000
2015US$’000
Trade receivables:Less than 60 days 28,450 35,484
61 to 90 days 1,364 2,885
91 to 120 days 732 2,605
Over 120 days 4,382 7,854
Total 34,928 48,828 (b) Ageing analysis as at the end of reporting year of trade receivable amounts that are impaired:
Group
2016US$’000
2015US$’000
Trade receivables:Less than 60 days 8 –
61 to 90 days – 15
91 to 120 days – 4
Over 120 days 3,107 3,886
Total 3,115 3,905
The allowance which is disclosed in the note on trade receivables is based on individual accounts totalling US$3,115,000 (2015: US$3,905,000). These are not secured.
(c) Concentration of trade receivables customers as at the end of the reporting year:
Group
2016US$’000
2015US$’000
Top 1 customer 9,197 3,079
Top 2 customers 13,318 5,618
Top 3 customers 16,866 8,035

150
Annual Report 2016 | JAPFA LTD
NOTES TO THE FINANCIAL STATEMENTS31 DECEMBER 2016
34. FINANCIAL INSTRUMENTS: INFORMATION ON FINANCIAL RISKS (CONTINUED)
34D. Credit risk on financial assets (continued)
Other receivables are normally with no fixed terms and therefore there is no maturity.
Quoted and unquoted equity shares in corporations have no fixed maturity dates.
34E. Liquidity risk – financial liabilities maturity analysis
The liquidity risk refers to the difficulty in meeting obligations associated with financial liabilities that are settled by delivering cash or another financial asset. It is expected that all the liabilities will be settled at their contractual maturity. The average credit period taken to settle trade payables is about 30 – 60 days (2015: 30 – 60 days). The other payables are with short-term durations. The classification of the financial assets is shown in the statements of financial position as they may be available to meet liquidity needs and no further analysis is deemed necessary. In order to meet such cash commitments the operating activity is expected to generate sufficient cash inflows.
The following table analyses the non-derivative financial liabilities at the end of the reporting year by remaining contractual maturity (contractual and undiscounted cash flows):
GroupLess than
1 year2 – 5 years
Over 5 years Total
US$’000 US$’000 US$’000 US$’000
2016:Gross borrowing commitments 329,693 582,716 – 912,409
Gross finance lease commitments 820 149 – 969
Put option financial liabilities – 172,903 – 172,903
Trade and other payables 301,507 2,107 – 303,614
632,020 757,875 – 1,389,895
2015:Gross borrowing commitments 387,765 538,021 22,574 948,360
Gross finance lease commitments 1,146 998 – 2,144
Put option financial liabilities – 184,191 – 184,191
Trade and other payables 259,971 642 – 260,613
648,882 723,852 22,574 1,395,308
CompanyLess than
1 year
US$’000
2016:Gross borrowing commitments –
Trade and other payables 2,024
Financial guarantee contracts – in favour of subsidiaries 326,878
328,902
2015:Gross borrowing commitments 21,339
Trade and other payables 2,119
Financial guarantee contracts – in favour of subsidiaries 295,334
318,792

151
JAPFA LTD | Annual Report 2016
NOTES TO THE FINANCIAL STATEMENTS31 DECEMBER 2016
34. FINANCIAL INSTRUMENTS: INFORMATION ON FINANCIAL RISKS (CONTINUED)
34E. Liquidity risk – financial liabilities maturity analysis (continued)
The undiscounted amounts on the borrowings with fixed and floating interest rates are determined by reference to the conditions existing at the reporting date.
Financial guarantee contracts – For issued financial guarantee contracts the maximum amount of the guarantee is allocated to the earliest period in which the guarantee could be called. At the end of the reporting year no claims on the financial guarantees are expected to be payable.
The following table analyses the derivative financial liabilities at the end of the reporting year by remaining contractual maturity (contractual and undiscounted cash flows):
Less than 1 year
Group 2016 2015
US$’000 US$’000
Foreign currency forward contracts 274 –
Interest rate swaps – 166
274 166
The above amounts disclosed in the maturity analysis are the contractual undiscounted cash flows and such undiscounted cash flows differ from the amount included in the statements of financial position. When the counterparty has a choice of when an amount is paid, the liability is included on the basis of the earliest date on which it can be required to pay.
These are investments in equity shares or similar instruments. Such instruments are exposed to both currency risk and market price risk arising from uncertainties about future values of the investment securities. Sensitivity analysis: The effect on pre-tax profit is not expected to be significant.
34F. Interest rate risk
The interest rate risk exposure is mainly from changes in fixed interest rates and floating interest rates.
The following table analyses the breakdown of the significant financial instruments by type of interest rate:
Group Company
2016US$’000
2015US$’000
2016US$’000
2015US$’000
Financial liabilities:Fixed rates 477,998 348,899 – –
Floating rates 361,810 491,442 – 20,250
839,808 840,341 – 20,250
Financial assets:Fixed rates 18,542 26,203 3,775 3,775
Floating rates 11,583 3,713 36,445 36,970
30,125 29,916 40,220 40,745

152
Annual Report 2016 | JAPFA LTD
NOTES TO THE FINANCIAL STATEMENTS31 DECEMBER 2016
34. FINANCIAL INSTRUMENTS: INFORMATION ON FINANCIAL RISKS (CONTINUED)
34F. Interest rate risk (continued)
The floating rate debt obligations are with interest rates that are re-set at regular intervals. The interest rates are disclosed in the respective notes. When considered appropriate, in order to manage the interest rate risk, interest rate swaps are entered into to mitigate the fair value risk relating to fixed-interest assets or liabilities and the cash flow risk related to variable interest rate assets and liabilities. Note 21E disclosed the interest rate hedging activities in place at the end of the reporting year.
Sensitivity analysis:
Group Company
2016US$’000
2015US$’000
2016US$’000
2015US$’000
A hypothetical increase in interest rates by 100 basis points would have a (decrease) / increase effect on profit before tax of (3,502) (4,877) 364 167
The analysis has been performed separately for fixed interest rate and floating interest rate over a year for financial instruments. The impact of a change in interest rates on fixed interest rate financial instruments has been assessed in terms of changing of their fair value. The impact of a change in interest rates on floating interest rate financial instruments has been assessed in terms of changing of their cash flows and therefore in terms of the impact on profit or loss. The hypothetical changes in basis points are not based on observable market data (unobservable inputs).
34G. Foreign currency risk
Analysis of significant amounts of financial assets and financial liabilities denominated in non-functional currencies at the end of the reporting year is as follows:
GroupSingapore
DollarUS
DollarSri Lanka
RupeeAustralia
Dollar Total
US$’000 US$’000 US$’000 US$’000 US$’000
2016Financial assets:Cash and cash equivalents 1,421 113,277 – 4,592 119,290
Trade and other receivables 224 35,908 – – 36,132
Other financial assets 546 – – – 546
Total financial assets 2,191 149,185 – 4,592 155,968
Financial liabilities:Loans and borrowings – (385,837) – – (385,837)
Trade and other payables (575) (12,231) – (9) (12,815)
Total financial liabilities (575) (398,068) – (9) (398,652)
Net financial assets / (liabilities) 1,616 (248,883) – 4,583 (242,684)

153
JAPFA LTD | Annual Report 2016
NOTES TO THE FINANCIAL STATEMENTS31 DECEMBER 2016
34. FINANCIAL INSTRUMENTS: INFORMATION ON FINANCIAL RISKS (CONTINUED)
34G. Foreign currency risk (continued)
GroupSingapore
DollarUS
DollarSri Lanka
RupeeAustralia
Dollar Total
US$’000 US$’000 US$’000 US$’000 US$’000
2015Financial assets:Cash and cash equivalents 758 35,816 1,155 22 37,751
Trade and other receivables 179 1,008 – – 1,187
Other financial assets 546 – 3,547 – 4,093
Total financial assets 1,483 36,824 4,702 22 43,031
Financial liabilities:Loans and borrowings – (303,594) – (15,008) (318,602)
Trade and other payables (675) (57,392) – (149) (58,216)
Total financial liabilities (675) (360,986) – (15,157) (376,818)
Net financial assets / (liabilities) 808 (324,162) 4,702 (15,135) (333,787)
CompanySri Lanka
RupeeSingapore
Dollar Total
US$’000 US$’000 US$’000
2016Financial assets: Cash and cash equivalents – 859 859
Trade and other receivables – 197 197
Other financial assets – 546 546
Total financial assets – 1,602 1,602
Financial liabilities:Trade and other payables – (50) (50)
Net financial assets – 1,552 1,552
2015Financial assets: Cash and cash equivalents 1,155 117 1,272
Trade and other receivables – 1,572 1,572
Other financial assets 3,546 546 4,092
Total financial assets 4,701 2,235 6,936
Financial liabilities:Trade and other payables – (42) (42)
Net financial assets 4,701 2,193 6,894
There is exposure to foreign currency risk as part of the Group’s normal business.

154
Annual Report 2016 | JAPFA LTD
NOTES TO THE FINANCIAL STATEMENTS31 DECEMBER 2016
34. FINANCIAL INSTRUMENTS: INFORMATION ON FINANCIAL RISKS (CONTINUED)
34G. Foreign currency risks (continued)
The effect on pre-tax profits is not significant except as illustrated below:
Group
2016US$’000
2015US$’000
A hypothetical 10% strengthening in the exchange rate of the functional currency against US$ with all other variables held constant would have a favourable effect on pre-tax profit of 24,888 32,416
The above table shows sensitivity to the hypothetical percentage variations in the functional currency against US$. The sensitivity rate used is the reasonably possible change in foreign exchange rates. For similar rate weakening of the functional currency against US$, there would be comparable impacts in the opposite direction.
The hypothetical changes in exchange rates are not based on observable market data (unobservable inputs). The sensitivity analysis is disclosed for each non-functional currency to which the entity has significant exposure. The analysis above has been carried out on the basis that there are no hedged transactions.
In management’s opinion, the above sensitivity analysis is unrepresentative of the foreign currency risks as the historical exposure does not reflect the exposure in future.
34H. Commodity risks
Commodity price risk is the risk of fluctuations in the price of raw material used in feed production such as corn and soybean meal, which are commodities. The Group is generally able to pass through raw material cost increases into its feed selling prices, which mitigates the commodity price risk.
In addition, the Group continuously reviews the optimal inventory level and enters into purchase agreements with reference to cost prices, the production plan and materials requirements.
34I. Equity price risks
There are investments in equity shares or similar instruments. Such investments are exposed to both currency risk and market price risk arising from uncertainties about future values of the securities. The fair values of these assets are disclosed in Note 21.

155
JAPFA LTD | Annual Report 2016
NOTES TO THE FINANCIAL STATEMENTS31 DECEMBER 2016
35. CAPITAL COMMITMENTS
Estimated amounts committed at the end of the reporting year for future capital expenditure but not recognised in the financial statements are as follows:
Group
2016US$’000
2015US$’000
Construction costs 1,913 4,880
Investment in a joint venture entity # 2,400 –
Purchase of property, plant and equipment 5,270 8,256
# On 20 September 2016, the subsidiary, PT So Good Food, a subsidiary, entered into a joint venture agreement with PT Cargill Investment Indonesia and Cargill Meats (Thailand) Limited to establish a joint venture company to manufacture fully-cooked poultry products for human consumption. The initial capital required to establish the joint venture entity is US$6,000,000, of which PT So Good Food will subscribe for 40% equity interests amounting to US$2,400,000.
36. OPERATING LEASE PAYMENT COMMITMENTS – AS LESSEE
At the end of the reporting year the total of future minimum lease payment commitments under non-cancellable operating leases are as follows:
Group Company
2016US$’000
2015US$’000
2016US$’000
2015US$’000
Not later than one year 20,524 18,577 534 571
Later than one year but not later than five years 49,291 61,318 31 622
More than five years 108,531 97,938 – –
Rental expense for the year 19,140 18,415 561 560
Operating lease payments are for rentals payable mainly for several land leases in China and Vietnam, and office premises and storage in the countries which the subsidiaries operate in. These leases have tenures ranging from 1 to 40 years.
37. CONTINGENT LIABILITIES
37A. Corporate guarantees and claims
Group Company
2016US$’000
2015US$’000
2016US$’000
2015US$’000
Corporate guarantees in favour of subsidiaries – – 306,878 295,334
Claims against the Group 495 519 – –

156
Annual Report 2016 | JAPFA LTD
NOTES TO THE FINANCIAL STATEMENTS31 DECEMBER 2016
37. CONTINGENT LIABILITIES (CONTINUED)
37B. Other legal matters
On 1 April 2016, the subsidiaries, PT Austasia Stockfeed and PT Santosa Agrindo were alleged to have violated Indonesia laws in relation to the sale of imported cattle in Jakarta and were imposed administrative fines of IDR8,826,692,000 (equivalent to US$662,000) and IDR5,454,925,000 (equivalent to US$409,000) respectively by the Business Competition Supervisory Commission (“KPPU”). On 9 June 2016, both PT Austasia Stockfeed and PT Santosa Agrindo appealed against the KPPU’s decision. Considering that the appeal process is still ongoing, the KPPU’s decision is not legally binding. In August 2016, the Supreme Court had stipulated the Central Jakarta District Court to examine and render a decision of appeal against the KPPU’s decision. As at the date of these financial statements, this appeal against the KPPU’s decision is still on-going.
On 13 October 2016, the subsidiary, PT Japfa Comfeed Indonesia Tbk was alleged to have violated Indonesia laws in relation to the production arrangement/control of Day Old Chicken Final Stock in Indonesia and was imposed administrative fines of IDR25,000,000,000 (equivalent to US$1,875,000) by the KPPU. On 7 December 2016, PT Japfa Comfeed Indonesia Tbk appealed against the KPPU’s decision. Considering that the appeal process is still ongoing, the KPPU’s decision is not legally binding. In January 2017, the KPPU requested the Supreme Court to stipulate and appoint West Jakarta District Court to examine and render a decision on the appeal against KPPU. As at the date of these financial statements, this appeal against the KPPU’s decision is still on-going.
No accruals have been made in these financial statements as management is of the view that these subsidiaries have not violated the Indonesia law.
37C. Withholding tax assessment by overseas tax authorities
On 15 December 2016, the subsidiary, PT Japfa Comfeed Indonesia Tbk received tax assessment on the underpayment of withholding tax from October 2013 to October 2015, amounting to IDR134,471,000,000 (equivalent to US$10,088,000). Full payment for the tax assessment had been made in January 2017. PT Japfa Comfeed Indonesia Tbk has submitted an objection letter to the Indonesia tax authorities on 13 March 2017. Based on the advices from the Group’s external tax adviser, management is of the view that the withholding tax paid is recoverable and therefore, no provision for a tax charge has been made in the 2016 financial statements.
38. EVENTS AFTER THE END OF THE REPORTING YEAR
(a) In January 2017, PT Japfa Comfeed Indonesia Tbk, a subsidiary, repaid Bonds payable A (Note 30C) which have a nominal value of IDR1,250 billion and IDR250 billion (total nominal value of IDR1,500 billion) in full.
(b) On various dates in January 2017, PT Japfa Comfeed Indonesia Tbk, a subsidiary, purchased from the market, Comfeed Finance B.V.’s outstanding bonds with net book value of US$2,587,000 for US$2,530,000.

157
JAPFA LTD | Annual Report 2016
NOTES TO THE FINANCIAL STATEMENTS31 DECEMBER 2016
39. RECLASSIFICATION AND COMPARATIVE FIGURES
As disclosed in Note 17B, the Company has granted put options to the non-controlling shareholders of two subsidiaries that provide the non-controlling shareholders the rights to require the Company to purchase the remaining shares in the subsidiaries owned by them if AIH and AIH2 are not admitted to an internationally recognised securities exchange by 12 August 2018 (AIH and AIH2 Put Options). The put options are exercisable between 12 August 2018 and 11 September 2018.
At the year end, the Group has reclassified the value of the AIH and AIH2 Put Options as financial liabilities from equity of the Group. The reclassification entry is to recognise the “Put Option Financial Liabilities” with a corresponding entry of the same amount to a “Put Option Reserve” in equity of the Group. Restatements have been made to the prior year’s financial statements to enhance comparability with the current year’s classification as follows:
GroupAs previously
reported Reclassification As restated
US$’000 US$’000 US$’000
31 December 2015EquityPut options reserve – (180,946) (180,946)
Non-current liabilitiesPut option financial liabilities (Note 27) – 180,946 180,946
1 January 2015EquityPut options reserve – (166,536) (166,536)
Non-current liabilitiesPut option financial liabilities (Note 27) – 166,536 166,536
As is required by FRS 1, the statement of financial position at the end of the current reporting year and the beginning and end of the preceding reporting year is presented. However related notes relating to the above balances only (that were reclassified in the statement of financial position) are presented. Apart from these disclosures, other balances and notes are not impacted by the reclassifications.
40. CHANGES AND ADOPTION OF FINANCIAL REPORTING STANDARDS
For the current reporting year new or revised Financial Reporting Standards in Singapore and the related Interpretations to FRS (“INT FRS”) were issued by the Singapore Accounting Standards Council. Those applicable to the Group are listed below. These applicable new or revised standards did not require material modification of the measurement methods or the presentation in the financial statements.
FRS No. Title
FRS 16 & 38 Amendments to FRS 16 and FRS 38: Clarification of Acceptable Methods of Depreciation and Amortisation
FRS 27 Amendments to FRS 27: Equity Method in Separate Financial Statements
FRS 110 & 28 Amendments to FRS 110 and FRS 28: Sale or Contribution of Assets between an Investor and its Associate or Joint Venture
Various Improvements to FRSs (November 2014)FRS 19 Employee Benefits – Discount rate: regional market issue FRS 34 Interim Financial Reporting – Disclosure of information elsewhere in the interim financial report

158
Annual Report 2016 | JAPFA LTD
41. NEW OR AMENDED STANDARDS IN ISSUE BUT NOT YET EFFECTIVE
For the future reporting years new or revised Financial Reporting Standards in Singapore and the related Interpretations to FRS (“INT FRS”) were issued by the Singapore Accounting Standards Council and these will only be effective for future reporting years. Those applicable to the Group for future reporting years are listed below. The transfer to the applicable new or revised standards from the effective dates is not expected to result in material adjustments to the financial position, results of operations, or cash flows for the following year.
FRS No. Title
Effective date for periods
beginning on or after
FRS 7 Amendments to FRS 7: Disclosure Initiative 1 January 2017
FRS 12 Amendments to FRS 12: Recognition of Deferred Tax Assets for Unrealised Losses
1 January 2018
FRS 109 Financial Instruments 1 January 2018
FRS 115 Revenue from Contracts with Customers 1 January 2018
FRS 115 Amendments to FRS 115: Clarifications to FRS 115 Revenue from Contracts with Customers
1 January 2018
FRS 116 Leases 1 January 2019
FRS 116 Leases
FRS 116 Leases effective for annual periods beginning on or after 1 January 2019 replaces FRS 17 and its interpretations. Almost all leases will be brought onto lessees’ statements of financial position under a single model (except leases of less than 12 months and leases of low value assets). Lessor accounting, however, remains largely unchanged and the distinction between operating and finance leases is retained. The management anticipates that FRS 116 will be adopted in the financial statements when it becomes mandatory and that the application of the new standard will have a significant effect on amounts reported in respect of the leases. However, it is not practicable to provide a reasonable estimate of that effect until a detailed review has been completed.
Convergence with International Financial Reporting Standards
Singapore-incorporated companies listed on the Singapore Exchange will be required to comply with new financial reporting standards (to be issued by the Singapore Accounting Standards Council) as identical to the International Financial Reporting Standards for reporting year beginning on after 1 January 2018. Comparative figures are required. The management anticipates that new financial reporting standards will be adopted in the financial statements when they become mandatory. The application of IFRS 1 First-time adoption of IFRS might have a significant effect on amounts reported in the financial statements. However, it is not practicable to provide a reasonable estimate of that effect until a detailed review has been completed.
STATISTICS OF SHAREHOLDINGS AS AT 08 MARCH 2017

159
JAPFA LTD | Annual Report 2016
STATISTICS OF SHAREHOLDINGS AS AT 08 MARCH 2017
DISTRIBUTION OF SHAREHOLDINGS
NO. OF
SIZE OF SHAREHOLDINGS SHAREHOLDERS % NO. OF SHARES %
1 – 99 1 0.05 60 0.00
100 – 1,000 576 30.02 556,104 0.03
1,001 – 10,000 836 43.57 5,340,030 0.30
10,001 – 1,000,000 490 25.53 24,833,667 1.41
1,000,001 AND ABOVE 16 0.83 1,738,795,730 98.26
TOTAL 1,919 100.00 1,769,525,591 100.00
SHAREHOLDING HELD IN HANDS OF PUBLIC
Based on information available to the Company as at 8 March 2017, approximately 15.17% of the issued ordinary shares of the Company is held by the public and therefore, Rule 723 of the Listing Manual issued by the Singapore Exchange Securities Trading Limited is complied with.
TWENTY LARGEST SHAREHOLDERS
NO. NAME NO. OF SHARES %
1 RAFFLES NOMINEES (PTE) LIMITED 1,154,163,704 65.22
2 CITIBANK NOMINEES SINGAPORE PTE LTD 456,880,639 25.82
3 DBS NOMINEES (PRIVATE) LIMITED 43,888,670 2.48
4 MORGAN STANLEY ASIA (SINGAPORE) SECURITIES PTE LTD 17,924,286 1.01
5 DBS VICKERS SECURITIES (SINGAPORE) PTE LTD 14,043,000 0.79
6 HSBC (SINGAPORE) NOMINEES PTE LTD 10,814,000 0.61
7 DBSN SERVICES PTE LTD 10,698,589 0.60
8 DB NOMINEES (SINGAPORE) PTE LTD 6,142,944 0.35
9 BNP PARIBAS SECURITIES SERVICES SINGAPORE BRANCH 5,016,200 0.28
10 UNITED OVERSEAS BANK NOMINEES (PRIVATE) LIMITED 4,641,919 0.26
11 ABN AMRO NOMINEES SINGAPORE PTE LTD 4,389,300 0.25
12 UOB KAY HIAN PRIVATE LIMITED 3,933,000 0.22
13 MAYBANK KIM ENG SECURITIES PTE. LTD. 2,379,529 0.13
14 GOH GEOK KHIM 1,500,000 0.08
15 ONG MIN KHIM 1,280,000 0.07
16 OCBC SECURITIES PRIVATE LIMITED 1,099,950 0.06
17 PHILLIP SECURITIES PTE LTD 780,000 0.04
18 BAMBANG WIDJAJA 759,500 0.04
19 CIMB SECURITIES (SINGAPORE) PTE. LTD. 748,067 0.04
20 ABN AMRO CLEARING BANK N.V. 693,500 0.04
TOTAL 1,741,776,797 98.43

160
Annual Report 2016 | JAPFA LTD
STATISTICS OF SHAREHOLDINGS AS AT 08 MARCH 2017
SUBSTANTIAL SHAREHOLDERSSubstantial shareholders as recorded in the Register of Substantial Shareholders as at 8 March 2017
NO OF SHARES
SUBSTANTIAL SHAREHOLDERSDIRECT
INTERESTINDIRECT INTEREST TOTAL INTEREST %
Mr Handojo Santosa @ Kang Kiem Han(1) – 1,136,818,915 1,136,818,915 64.24
Rangi Management Limited(1)(2)(4) 928,368,240 – 928,368,240 52.46
Fusion Investment Holdings Limited(2)(4) – 928,368,240 928,368,240 52.46
Tasburgh Limited(1)(3)(4) 126,714,375 – 126,714,375 7.16
Morze International Limited(5) 282,527,085 – 282,527,085 15.97
Highvern Trustees Limited (formerly known as Coutts & Co Trustees (Jersey) Limited) (3)(4)(5)(6) – 1,337,609,700 1,337,609,700 75.59
MNM Holdings Limited(6) – 1,337,609,700 1,337,609,700 75.59
Mr Martin John Hall(7) – 445,869,900 445,869,900 25.20
Ms Naomi Julia Rive(7) – 445,869,900 445,869,900 25.20
Mr Miles Aidan Le Cornu(7) – 445,869,900 445,869,900 25.20
Scuderia Trust(4) – 1,055,082,615 1,055,082,615 59.63
Capital Two Trust(5) – 282,527,085 282,527,085 15.97
Ms Rachel Anastasia Kolonas(5)(8) – 282,527,085 282,527,085 15.97
Mdm Farida Gustimego Santosa (1)(4)(9) – 1,055,818,915 1,055,818,915 59.67
Mr Renaldo Santosa(4)(10) – 1,055,942,615 1,055,942,615 59.67
(1) Mr Handojo Santosa is the settlor of the Scuderia Trust. Under the terms of the Scuderia Trust, he is entitled, as an investment power holder, to direct the trustee of the Scuderia Trust to procure to the best of its ability that the directors of Fusion Investment Holdings Limited and Tasburgh Limited act in accordance with his instructions in relation to the investments of the Scuderia Trust. See Note (4) below. As the sole shareholder of Rangi Management Limited, Fusion Investment Holdings Limited is entitled to determine the composition of the board of directors of Rangi Management Limited. Accordingly, Mr. Handojo Santosa can control the exercise of the rights of the shares held by Fusion Investment Holdings Limited in Rangi Management Limited and through the board of directors appointed by Fusion Investment Holdings Limited, control the exercise of the rights of the Shares held by Rangi Management Limited under the Scuderia Trust. By virtue of Section 4 of the SFA, Mr. Handojo Santosa is deemed to have an interest in the Shares held by Rangi Management Limited and Tasburgh Limited. Tallowe Services Inc holds 81,000,000 Shares. The Shares of Tallowe Services Inc are held by Magnus Nominees Limited and Fidelis Nominees Limited as bare trustees for Mr. Handojo Santosa. By virtue of Section 4 of the SFA, Mr Handojo Santosa is also deemed to have an interest in the Shares held by Tallowe Services Inc. In addition, Mr Handojo Santosa is also deemed to have an interest in 736,300 Shares held in a joint account with his wife (through their client account with a financial institution).
(2) Fusion Investment Holdings Limited holds the entire issued and paid-up capital of Rangi Management Limited. By virtue of Section 4 of the SFA, Fusion Investment Holdings Limited is deemed to have an interest in the Shares held by Rangi Management Limited.
(3) The shares in each of Fusion Investment Holdings Limited, Tasburgh Limited and Morze International Limited are collectively held by Magnus Nominees Limited and Fidelis Nominees Limited as bare trustees on trust for their sole shareholder, Highvern Trustees Limited, as trustee of the Scuderia Trust and the Capital Two Trust. By virtue of Section 4 of the SFA, Highvern Trustees Limited is deemed to have an interest in the Shares held by Rangi Management Limited, Tasburgh Limited and Morze International Limited. Highvern Trustees Limited is a professional trustee and is wholly-owned by MNM Holdings Limited.
(4) Highvern Trustees Limited is the trustee of the Scuderia Trust which is a reserved power discretionary trust. The Shares held by Rangi Management Limited and Tasburgh Limited are assets of the Scuderia Trust. The settlor of Scuderia Trust is Mr. Handojo Santosa. The beneficiaries of the Scuderia Trust are Mr. Handojo Santosa’s spouse (Farida Gustimego Santosa), children (Renaldo Santosa, Gabriella Santosa, Mikael Santosa and Raffaela Santosa) and remoter issue. Pursuant to Section 4 of the SFA, the beneficiaries of the Scuderia Trust are deemed to have an interest in the Shares held by Rangi Management Limited and Tasburgh Limited.
(5) Highvern Trustees Limited is the trustee of the Capital Two Trust which is a reserved power discretionary trust. The Shares held by Morze International Limited are assets of the Capital Two Trust. The settlor of Capital Two Trust is Ms. Rachel Anastasia Kolonas. The beneficiaries of the Capital Two Trust are Rachel Anastasia Kolonas, her issue and remoter issue and Tati Santosa. Pursuant to Section 4 of the SFA, the beneficiaries of the Capital Two Trust are deemed to have an interest in the Shares held by Morze International Limited.
(6) MNM Holdings Limited is the direct holding company of Highvern Trustees Limited. By virtue of Section 4 of the SFA, MNM Holdings Limited is deemed to be indirectly interested in the Shares that Highvern Trustees Limited is interested in.
(7) Mr Martin John Hall, Ms Naomi Julia Rive and Mr Miles Aidan Le Cornu each has a direct interest in 33.33% of MNM Holdings Limited, which is the direct holding company of Highvern Trustees Limited. By virtue of Section 4 of the SFA, each of Mr Martin John Hall, Ms Naomi Julia Rive and Mr Miles Aidan Le Cornu is deemed to be indirectly interested in the Shares that Highvern Trustees Limited is interested in.
(8) Ms. Rachel Anastasia Kolonas is the settlor of the Capital Two Trust. Under the terms of the Capital Two Trust, she is entitled, as an investment power holder, to direct the trustee of the Capital Two Trust to procure to the best of its ability that the directors of Morze International Limited act in accordance with her instructions in relation to the investments of the Capital Two Trust. Accordingly she can control the exercise of the rights of the Shares held under the Capital Two Trust. By virtue of Section 4 of the SFA, Ms. Rachel Anastasia Kolonas is deemed to have an interest in the Shares held by Morze International Limited.
(9) Mdm Farida Gustimego Santosa is a beneficiary under the Scuderia Trust. See Note (4) above. Mdm Farida Gustimego Santosa is also deemed to have an interest in 736,300 Shares held in a joint account with her husband (through their client account with a financial institution).
(10) Mr Renaldo Santosa is a beneficiary under the Scuderia Trust. See Note (4) above. Mr Renaldo Santosa additionally holds 860,000 Shares through his client account with a financial institution.

161
JAPFA LTD | Annual Report 2016
JAPFA LTD(Incorporated in the Republic of Singapore)
Company Registration No. 200819599W
NOTICE IS HEREBY GIVEN that the Third Annual General Meeting (“AGM”) of Japfa Ltd (the “Company”) will be held at York Hotel Singapore, Carlton Hall, Level 2, 21 Mount Elizabeth, Singapore 228516 on Wednesday, 12 April 2017 at 2.00 p.m. to transact the following businesses:
A) ORDINARY BUSINESS
1. To receive and adopt the Directors' Report and Audited Financial Statements of the Company for the financial year ended 31 December 2016 (FY2016), together with the Auditor’s Report.
Resolution 1
2. To declare a first and final one-tier tax exempt dividend of S$0.01 per ordinary share for the financial year ended 31 December 2016.
Resolution 2
3. To re-elect the following Directors, retiring pursuant to Article 114 of the Company’s Articles of Association and who, being eligible, offer themselves for re-election:
Goh Geok Khim (see Note 4) Resolution 3
Handojo Santosa @ Kang Kiem Han (see Note 5) Resolution 4
Hendrick Kolonas (see Note 6) Resolution 5
Ng Quek Peng (see Note 7) Resolution 6
Lien Siaou-Sze (see Note 8) Resolution 7
Kevin John Monteiro (see Note 9) Resolution 8
Tan Yong Nang (see Note 10) Resolution 9
4. To note typographical error stated in ordinary resolution 10 on FY2016 Directors’ fees passed at last AGM (S$510,000) and ratify the payment of FY2016 Directors’ fees amounting to S$530,000. (see Note 11)
Resolution 10
5. To approve prorated Directors’ fees of S$127,500 for the financial period 1 January 2017 to 31 March 2017.
Resolution 11
6. To approve Directors’ fees of S$552,000 for the financial period 1 April 2017 to 31 March 2018. (see Note 12)
Resolution 12
7. To appoint Ernst & Young LLP as Auditors of the Company for FY2017 and to authorise the Directors to fix their remuneration.
Resolution 13
8. To note the cessation of RSM Chio Lim LLP as Auditors of the Company.
NOTICE OF ANNUAL GENERAL MEETING

162
Annual Report 2016 | JAPFA LTD
B) SPECIAL BUSINESS
9. That pursuant to Section 161 of the Companies Act Cap 50, the Directors of the Company be authorised and empowered to:
(i) (a) issue Shares whether by way of rights, bonus or otherwise; and/or
(b) make or grant offers, agreements or options (collectively, the “Instruments”) that might or would require Shares to be issued, including but not limited to the creation and issue of (as well as adjustments to) warrants, debentures or other instruments convertible into Shares,
at any time and upon such terms and conditions and for such purposes and to such persons as the Directors may in their absolute discretion deem fit; and
(ii) (notwithstanding that the authority conferred by this resolution may have ceased to be in force) issue Shares in pursuance of any Instrument made or granted by the Directors while this resolution is in force.
PROVIDED THAT:
(1) the aggregate number of Shares issued pursuant to this resolution (including Shares issued in pursuance to any Instruments made or granted pursuant to this resolution), does not exceed 50 per cent. of the total number of issued Shares excluding treasury Shares (as calculated in accordance with sub-paragraph (2) below), of which the aggregate number of shares to be issued other than on a pro rata basis to shareholders of the Company (including Shares to be issued in pursuant of Instruments made or granted pursuant to this resolution) does not exceed 20 per cent. of the total number of issued Shares excluding treasury Shares (as calculated in accordance with sub-paragraph (2) below);
(2) (subject to such manner of calculation as may be prescribed by the SGX-ST) for the purpose of determining the aggregate number of Shares that may be issued under sub-paragraph (1) above, the percentage of issued shares shall be based on the total number of issued shares in the capital of the Company at the time this resolution is passed (excluding treasury shares), after adjusting for:-
(i) new Shares arising from the conversion or exercise of any convertible securities or share options or vesting of share awards which are outstanding or subsisting at the time this resolution is passed; and
(ii) any subsequent bonus issue or consolidation or subdivision of Shares;
(3) in exercising the authority conferred by this resolution, the Company shall comply with the provisions of the Companies Act, the Listing Manual of the SGX-ST (including supplemental measures thereto) for the time being in force (unless such compliance has been waived by the SGX-ST) and the Articles of Association for the time being of the Company; and
(4) (unless revoked or varied by the Company in general meeting) the authority conferred by this resolution shall continue in force until the conclusion of the next AGM of the Company or the date by which the next AGM of the Company is required by law to be held, whichever is the earlier.
Resolution 14
NOTICE OF ANNUAL GENERAL MEETING

163
JAPFA LTD | Annual Report 2016
10. That approval be and is hereby given to the Directors to:
(i) offer and grant Awards in accordance with the provisions of Japfa Performance Share Plan (“Share Plan”) and pursuant to Section 161 of the Companies Act (Cap. 50):
(a) to allot and issue from time to time such number of fully-paid new Shares as may be required to be delivered pursuant to the vesting of the Awards under the Share Plan; and
(b) (notwithstanding the authority conferred by this resolution may have ceased to be in force) to allot and issue from time to time such number of fully-paid new Shares as may be required to be delivered pursuant to any Awards granted by the Directors in accordance with the Share Plan awarded while the authority conferred by this resolution was in force, and
(ii) subject to the same being allowed by law, apply any Shares purchased under any share purchase mandate and to deliver such existing Shares (including treasury shares) towards the satisfaction of Awards granted under the Share Plan,
PROVIDED THAT the aggregate number of Shares to be issued or transferred pursuant to the Awards under the Share Plan on any date, when aggregated with the number of Shares over which options or awards are granted under any other share option schemes or share schemes of the Company, shall not exceed fifteen per cent. (15%) of the total issued share capital of the Company (excluding treasury Shares) the day preceding that date.
Resolution 15
11. To transact any other business of an Annual General Meeting.
By Order of the Board of Directors
Tan Yong NangExecutive Director and Chief Executive Officer 28 March 2017
NOTICE OF ANNUAL GENERAL MEETING

164
Annual Report 2016 | JAPFA LTD
Notes:
1. (a) A member of the Company who is not a relevant intermediary is entitled to appoint not more than two proxies to attend, speak and vote at the Annual general meeting (the "Meeting"). Where such member's form of proxy appoints more than one proxy, the proportion of the shareholding concerned to be represented by each proxy shall be specified in the form of proxy. If no such proportion of shareholding is specified, the first named proxy may be treated as representing 100% of the shareholding and any subsequent named proxy as an alternate to the earlier named. A proxy need not be a member of the Company.
(b) A member of the Company who is a relevant intermediary is entitled to appoint more than two proxies to attend, speak and vote at the Meeting, but each proxy must be appointed to exercise the rights attached to a different share or shares held by such member. Where such member's form of proxy appoints more than two proxies, the number and class of shares in relation to which each proxy has been appointed shall be specified in the form of proxy. If no such number or class of shares is specified, the first named proxy may be treated as representing 100% of the shares and any subsequent named proxy as an alternate to the earlier named.
"Relevant Intermediary" has the meaning ascribed to it in Section 181 of the Companies Act (Chapter 50 of Singapore).
2. A member of the Company which is a corporation is entitled to appoint its authorised representative or proxy to vote on its behalf.
3. The instrument appointing a proxy or proxies must be deposited with the Company’s Share Registrar, Boardroom Corporate & Advisory Services Pte. Ltd., 50 Raffles Place, #32-01 Singapore Land Tower, Singapore 048623, not less than 48 hours before the time appointed for the AGM. The sending of a Proxy Form by a member does not preclude him from attending and voting in person at the AGM if he so wishes. Any appointment of a proxy or proxies shall be deemed to be revoked if a member attends the AGM in person and, in such event, the Company reserves the right to refuse to admit any person or persons appointed under the Proxy Form to the AGM.
4. Mr Goh Geok Khim, will, upon re-election, continue to serve as the Chairman of the Board of Directors. Mr Goh is an independent Director.
5. Mr Handojo Santosa @ Kang Kiem Han will, upon re-election, continue to serve as Deputy Chairman and a Member of the Nominating Committee.
6. Mr Hendrick Kolonas will, upon re-election, continue to serve as a Member of the Audit Committee and the Remuneration Committee.
7. Mr Ng Quek Peng will, upon re-election, continue to serve as the Chairman of Audit Committee and a member of the Remuneration Committee and the Nominating Committee. Mr Ng is an independent Director.
8. Ms Lien Siaou-Sze will, upon re-election, continue to serve as the Chairwoman of the Nominating and Remuneration Committees and a member of the Audit Committee. Ms Lien is an independent Director.
9. Mr Kevin John Monteiro will, upon re-election, continue to serve as an Executive Director and the Chief Financial Officer of the Company.
10. Mr Tan Yong Nang will, upon re-election, continue to serve as an Executive Director and Chief Executive Officer of the Company.
NOTICE OF ANNUAL GENERAL MEETING

165
JAPFA LTD | Annual Report 2016
11. Breakdown of the Directors’ fees paid for FY2016
Directors’ Fees*
Name BOARD AC RC NC TOTAL
Goh Geok Khim 150,000 – – – 150,000
Hendrick Kolonas 80,000 10,000 10,000 – 100,000
Ng Quek Peng 80,000 30,000 10,000 7,500^ 127,500^
Lien Siaou-Sze 80,000 7,500^ 20,000 20,000 127,500^
Liu Chee Meng 20,000^ 2,500^ – 2,500^ 25,000^
SUB TOTAL 410,000 50,000 40,000 30,000 530,000
* Executive Directors do not receive Directors’ fees. ^ Prorated fees paid based on period of appointment
12 The amount of S$552,000 represents an increase in Directors’ fees of S$42,000 (from S$510,000 to S$552,000) for Non-Executive Directors derived from:
AppointmentExisting Fees
(S$ Per annum)
New Fees commencing 1 April 2017
(S$ per annum)
Board Chairman 150,000 165,000
Board Member 80,000 85,000
Audit Committee Chairman 30,000 33,000
Other Committee Chairman 20,000 22,000
Committee Member 10,000 11,000
13. Ordinary Resolution 14 is to empower the Directors from the date of the Annual General Meeting until the date of the next Annual General Meeting to issue Shares and Instruments in the Company, up to a number not exceeding 50% of the total number of Shares (excluding treasury Shares) (with a sub-limit of 20% of the total number of Shares (excluding treasury Shares) in respect of Shares to be issued other than on a pro rata basis to shareholders).
14. Ordinary Resolution 15 is to empower the Directors to offer and grant awards pursuant to the Japfa Performance Share Plan (“Share Plan”) and to issue shares in the capital of the Company pursuant to the vesting of awards granted pursuant to Share Plan provided that: (a) the aggregate number of new shares which may be issued under the Share Plan does not exceed 15% of the total number of issued shares (excluding treasury shares) in the capital of the Company from time to time, (b) The aggregate number of Shares which may be issued or transferred pursuant to Awards under the Share Plan to Participants who are Controlling Shareholders and their Associates shall not exceed 25% of the Shares available under the Share Plan, and (c) The number of Shares which may be issued or transferred pursuant to Awards under the Plan to each Participant who is a Controlling Shareholder or his Associate shall not exceed 10% of the Shares available under the Share Plan.
Personal data privacy:
By submitting an instrument appointing a proxy(ies) and/or representative(s) to attend, speak and vote at the AGM and/or any adjournment thereof, a member of the Company (i) consents to the collection, use and disclosure of the member’s personal data by the Company (or its agents) for the purpose of the processing and administration by the Company (or its agents) of proxies and representatives appointed for the AGM (including any adjournment thereof) and the preparation and compilation of the attendance lists, minutes and other documents relating to the AGM (including any adjournment thereof), and in order for the Company (or its agents) to comply with any applicable laws, listing rules, regulations and/or guidelines (collectively, the "Purposes"), and (ii) warrants that where the member discloses the personal data of the member’s proxy(ies) and/or representative(s) to the Company (or its agents), the member has obtained the prior consent of such proxy(ies) and/or representative(s) for the collection, use and disclosure by the Company (or its agents) of the personal data of such proxy(ies) and/or representative(s) for the Purposes.
NOTICE OF ANNUAL GENERAL MEETING

This page has been intentionally left blank.

JAPFA LTD(Incorporated in the Republic of Singapore)
(Company Registration No. 200819599W)
PROXY FORMANNUAL GENERAL MEETING
*I/We ________________________________________ (Name) ______________________________________ (NRIC/Passport Number)
of __________________________________________________________________________________________________________ (Address)
being a *member/ members of Japfa Ltd ("the Company") hereby appoint:
Name AddressNRIC/Passport
Number
Proportion of Shareholdings
No. of Shares %
*and/or (delete as appropriate)
Name AddressNRIC/Passport
Number
Proportion of Shareholdings
No. of Shares %
or failing him/them, the Chairman of the Annual General Meeting ("AGM"), as my/our proxy/proxies to attend and vote for me/us on my/our behalf and if necessary, to demand a poll at the AGM to be held at York Hotel Singapore, Carlton Hall, Level 2, 21 Mount Elizabeth, Singapore 228516 on Wednesday, 12 April 2017 at 2.00 p.m. and at any adjournment thereof.
I/We direct my/our proxy/proxies to vote for or against the Resolution to be proposed at the AGM as indicated hereunder. If no specified direction as to voting is given, the proxy/proxies may vote or abstain from voting at his/their discretion, as he/they will on any other matter arising at the AGM.
NOTE: The Chairman of the AGM will be exercising his right under Regulation 85(a) of the Constitution of the Company to demand a poll in respect of the Ordinary Resolution and Special Resolution to be put to the vote at the AGM and at any adjournment thereof. Accordingly, the Ordinary Resolution and Special Resolution at the AGM will be voted on by way of a poll.
For * Against *
Ordinary Business
Ordinary Resolution 1Adoption of the Directors’ Report, the Audited Financial Statements and the Auditor’s Report
Ordinary Resolution 2Declaration of a first and final one-tier tax exempt dividend of S$0.01 per ordinary share
Ordinary Resolution 3Re-election of Goh Geok Khim as a Director
Ordinary Resolution 4Re-election of Handojo Santosa @ Kang Kiem Han as a Director
Ordinary Resolution 5Re-election of Hendrick Kolonas as a Director
Ordinary Resolution 6Re-election of Ng Quek Peng as a Director
Ordinary Resolution 7Re-election of Lien Siaou-Sze as a Director
Ordinary Resolution 8Re-election of Kevin John Monteiro as a Director
Ordinary Resolution 9Re-election of Tan Yong Nang as a Director
Ordinary Resolution 10To note typographical error stated in ordinary resolution 10 on FY2016 Directors’ fees passed at last AGM (S$510,000) and ratify the payment of FY2016 Directors’ fees amounting to S$530,000
Ordinary Resolution 11To approve prorated Directors’ fees of S$127,500 for the financial period 1 January 2017 to 31 March 2017
Ordinary Resolution 12To approve Directors’ fees of S$552,000 for the financial period 1 April 2017 to 31 March 2018
Ordinary Resolution 13To appoint Ernst & Young LLP as Auditors of the Company for FY2017 and to authorise the Directors to fix their remuneration
IMPORTANT:
1. A relevant intermediary may appoint more than two proxies to attend the Annual General Meeting and vote (please see note 1 for the definition of "relevant intermediary").
2. For investors who have used their CPF monies to buy the Company's shares, this Circular is forwarded to them at the request of their CPF Approved Nominees and is sent solely FOR INFORMATION ONLY.
3. This Proxy Form is not valid for use by CPF investors and shall be ineffective for all intents and purposes if used or purported to be used by them.
Personal Data Privacy
By submitting an instrument appointing a proxy(ies) and/or representative(s), the member accepts and agrees to the personal data privacy terms set out in the Notice of Annual General Meeting dated 28 March 2017.

For * Against *
Special Business
Ordinary Resolution 14Authority for Directors to issue shares and/or convertible instruments pursuant to Section 161 of the Companies Act, Cap 50
Ordinary Resolution 15Authority for Directors to offer and grant awards and issue shares in accordance with the provision of Japfa Performance Share Plan
* If you wish to exercise all your votes "For" or "Against" the Ordinary Resolution, please indicate with a "ü" within the box provided. Otherwise, please indicate the number of votes “For” or “Against” the Ordinary Resolution.
Total Number of Shares Held
Dated this ________________ day of ________________ 2017
_______________________________________Signature of member(s) or Common Seal


JAPFA LTD391B Orchard Road, #18-08Ngee Ann City, Tower BSingapore 238874Tel: (65) 6735 0031Fax: (65) 6735 4465(Company Registration Number: 200819599W)
www.japfa.com


