328 Indian Geotechnical Journal, 3 9(3), July 2009 -...
27
Indian Geotechnical Journal, 39(3), July 2009 - Abstracts 328 Estimation of Ground Response Parameters and Comparison with Field Measurements P. Anbazhagan, and T.G. Sitharam (Indian Geotechnical Journal, Vol. 39, No. 3, July 2009, pp 245-270) Design of seismic resistant structures requires an estimation of the site amplification during expected earthquakes and also the response spectrum at the ground surface. This paper summarizes the results of site specific ground response analysis for Bangalore and comparison of predominant frequency of the soil column with experimentally measured predominant frequency by ambient noise survey. The subsurface soil profile was assessed from carefully selected 170 borelogs out of the available 850 bore logs in the study area of 220 km 2 . The response spectrum and amplification have been evaluated for each soil layer at corresponding borehole locations based on one-dimensional ground response analysis. The estimated peak acceleration at ground surface varies from 0.088g to 0.66g. The natural period of the soil column, peak spectral acceleration (PSA) and frequency at peak spectral acceleration at each borehole location have been evaluated and through interpolation they are presented in the form of maps. The period of the soil column varies from 0.01s to 0.45s, PSA varies from 0.2 to 2.5g and frequency at PSA varies from 3.2Hz to 20Hz. The northern and eastern parts of the city are in the low SA zone for all the frequencies. Period of soil column calculated using site response study and the predominant frequency estimated from field experimental studies are comparable. KEY WORDS: Site amplification, Peak acceleration, Response spectra, Spectral acceleration and fundamental period
Transcript of 328 Indian Geotechnical Journal, 3 9(3), July 2009 -...

Indian Geotechnical Journal, 39(3), July 2009 - Abstracts 328
Estimation of Ground Response Parameters and Comparison with Field Measurements
P. Anbazhagan, and T.G. Sitharam
(Indian Geotechnical Journal, Vol. 39, No. 3, July 2009, pp 245-270)
Design of seismic resistant structures requires an estimation of the site amplification during expected earthquakes and also the response spectrum at the ground surface. This paper summarizes the results of site specific ground response analysis for Bangalore and comparison of predominant frequency of the soil column with experimentally measured predominant frequency by ambient noise survey. The subsurface soil profile was assessed from carefully selected 170 borelogs out of the available 850 bore logs in the study area of 220 km2. The response spectrum and amplification have been evaluated for each soil layer at corresponding borehole locations based on one-dimensional ground response analysis. The estimated peak acceleration at ground surface varies from 0.088g to 0.66g. The natural period of the soil column, peak spectral acceleration (PSA) and frequency at peak spectral acceleration at each borehole location have been evaluated and through interpolation they are presented in the form of maps. The period of the soil column varies from 0.01s to 0.45s, PSA varies from 0.2 to 2.5g and frequency at PSA varies from 3.2Hz to 20Hz. The northern and eastern parts of the city are in the low SA zone for all the frequencies. Period of soil column calculated using site response study and the predominant frequency estimated from field experimental studies are comparable.
KEY WORDS: Site amplification, Peak acceleration, Response spectra, Spectral
acceleration and fundamental period

Indian Geotechnical Journal, 39(3), July 2009, 245-270
Estimation of Ground Response Parameters and Comparison with Field Measurements
P. Anbazhagan* and T.G. Sitharam**
Introduction
ffect of site amplification due to soil conditions and its damage to built environment was amply demonstrated by many earthquakes during the last century. The wide spread destruction caused by Guerrero earthquake (1985)
in Mexico city, Spitak earthquake (1988) in Leninakan, Loma Prieta earthquake (1989) in San Francisco Bay area, Kobe earthquake (1995), Kocaeli earthquake (1999) in Adapazari and Bhuj earthquakes (2001) in India are important examples of site specific amplification of ground motion, even at location far away (100-300km) from the epicenter (Ansal, 2004). The recent 2001 Gujarat-Bhuj earthquake in India is another example with notable damages at a distance of 250km from the epicenter (Sitharam et. al 2001 and Govinda Raju et. al 2004). These failures result due to the effects of soil condition on the ground motion that translates to higher amplitude; and they also modify the spectral content and duration of ground motion. As seismic waves travel from bedrock to the surface, the soil deposits that they pass through change certain characteristics of the waves, such as amplitude and frequency content. This process can transfer large accelerations to structures causing large destruction, particularly when the resulting seismic wave frequency matches with natural / fundamental frequencies of the structures. Site specific ground response analysis aims at determining this effect of local soil conditions on amplification of seismic waves and estimating the ground response spectra for design purposes. The response of a soil deposit is dependent upon the frequency of the base motion and geometry, and material properties of the soil layer above the bedrock (Anbazhagan and Sitharam, 2008b; Sitharam and Anbazhagan 2008). Bangalore, a fast growing urban center with low to moderate earthquake history (Sitharam and Anbazhagan, 2007) and highly altered soil formation (due to large reclamation of land from tank/lake beds) has been the focus of our study. In the present study, data from about 170 bore holes have been selected out of available 850 bore holes in the study area of 220km2
* Department of Civil Engineering, Indian Institute of Science, Bangalore-560012, India Phone: 91-80-22932467, Fax:91-80-23600404, E-mail:
for which standard penetration test (SPT) “N” values are available. The synthetic ground motion for the each bore log has been generated using the synthetic ground motion model for Bangalore developed by the authors (Sitharam el al., 2006 and Sitharam and Anbazhagan, 2007). The soil properties and synthetic ground motion for each borehole location is further used to study the local site effects using 1-D ground response analysis
** Department of Civil Engineering, Indian Institute of Science, Bangalore-560012, India Phone: 91-80-22932919, E-mail: [email protected]
E

INDIAN GEOTECHNICAL JOURNAL 246
program, SHAKE2000. The results obtained from this study has been used to prepare the maps of peak acceleration at ground surface, amplification, period of the soil column, peak spectral accelerations (PSA), frequency corresponding PSA and spectral accelerations corresponding to 1.5, 3, 5, 8 and 10 Hz frequency and also natural period of the soil column. Further, period of soil column estimated in this study is compared with micro tremor studies for the same area presented by Srinagesh et al. (2007).
Study Area
The area being studied here is 220km2
Thus Bangalore’s rapid growth has put pressure on its infrastructure and a dilution in standards of building/ infrastructure construction resulted. Present constructions include mud buildings to steel construction and RCC framed
area of the Bangalore city, (12° 58" N and 77° 37" E) situated at 920m above Mean Sea Level (MSL), which is the principal administrative, industrial, commercial, educational and cultural capital of Karnataka state, in the South-Western part of India (see Figure1).
7
2 3
121
60 88
103
47
90
82 122
118
109
Scale 1:20000
L15 105km Length
Bangalore Mahanagar Palike Boundary (220km2)
Boreholes
77
Fig.1 Location of the Selected Boreholes in Bangalore City
Anirudhan
Polygonal Line
Anirudhan
Polygonal Line
Anirudhan
Polygonal Line
Anirudhan
Polygonal Line
Anirudhan
Polygonal Line
Anirudhan
Polygonal Line

ESTIMATED AND MEASURED GROUND RESPONSE PARAMETERS 247
structures ranging from one storied to high rise buildings of more than 20 floors. The unprecedented level of construction activities of single to multi stories have generated large amount of subsurface data which are very useful in geotechnical and site specific studies. Most part of Bangalore region falls in the “older gneissic complex" formed due to several tectonic-thermal events between 3400 to 3000 years ago; these gneisses act as a basement. Weathering of these rocks have generated thick overburden comprising of red laterite, red fine loamy to clayey soils of varying thickness.
Need for the Amplification Study of Bangalore
Bangalore and its vicinity have experienced slight to moderate earthquakes during historic to recent times. However, these were not considered to be of serious consequence and these cities, located in relatively stable region were considered free of earthquake effects. However, the fast pace of development the unscientific approach of land use, including the reclamation of land (silted tanks and lakes) has increased the vulnerability of this city, even against a moderate earthquake. The high density of population, mushrooming of buildings of all kinds, improper and low quality construction practices unscientific land use and heavy traffic conditions only add to the damage scenario. This city that once had 150 tanks has reclaimed much of these silted water bodies for construction activities, leaving only 64 today (Sitharam et al., 2006). The tanks have now been encroached due to rapid urbanization are listed in Table 1. These tanks were once distributing better water supply facilities and they are presently in a dried up condition with the residual silt and silty sand forming thick deposits over which buildings/structures have been built. This calls for a study of the amplification of ground motion in Bangalore city.
Table 1 Details of the Lakes that Once Existed in Bangalore and have now been Encroached due to Urbanization
Sl No Old Lakes Now encroached to form a Residential /Industrial layouts
1 Vidyaranyapura Lake Vidyaranyapura(Jalahalli East) 2 Gokula Tank Mattikere 3 Geddalahalli Lake RMV 2nd Stage, 1st Block 4 Nagashettihalli Lake RMV 2nd Stage, 2nd Block 5 Tumkur Lake Mysore Lamps 6 Ramshetty Palya kere Milk Colony (Playground) 7 Oddarapalaya Lake Rajajinagar (Industrial Area) 8 Ketamaranahalli Lake Rajajinagar (Mahalakshmipuram) 9 Kurubarahalli Lake Basaveshwaranagar (Chord Road) 10 Agasana Lake Gayathri Devi Park 11 Jakkarayana kere Krishna Floor Mills 12 Dharmambudhi Lake Kempegowda Bus Terminal 13 Vijayanagar Chord Rd Lake Vijayanagar 14 Marenahallli Lake Marenahalli 15 Sampangi Lake Kanteerva Stadium 16 Kalasipalya Lake Kalasipalya

INDIAN GEOTECHNICAL JOURNAL 248
Sl No Old Lakes Now encroached to form a Residential /Industrial layouts
17 Siddapura Lake Siddapura/Jayanagar 1 stBlock 18 Tyagarajanagar Lake Tyagarajanagar 19 Kadirenahalli Lake Banashankari 2nd Stage 20 Sarakki AgraharaLake JP Nagar 4th Phase 21 Koramangala Lake National Dairy Research Institute 22 Chinnagara Lake Ellpura 23 Domlur Lake Domlur Second Stage 24 Kodihalli Lake New Thippasandra /Government Buildings 25 Banaswadi Lake Subbayapalya Extension 26 Shule Tank Ashok Nagar, Football Stadium 27 Hennur Lake Nagavara (HBR Layout)
Geotechnical Data
The geotechnical data used in this study is from archives of Torsteel Research Foundation (TRFI) and Indian Institute of Science (IISc) during 1990-2006. Out of the available 850 borelogs, 170 bore logs were carefully selected for the evaluation of the bed rock depth in each borelog from the rock characterization tests, selected for the site response study (bore logs locations are marked in Figure 1). For the 170 boreholes selected in this study the overburden thickness vary from 1m to about 40m, and with their wide distribution in the study area, these bore holes are considered to represent the typical features of soil profiles. These soil types and rock depth are comparable with the shear wave velocity profiles using seismic refraction survey (Anbazhagan and Sitharam, 2008a; 2009) Subsurface profile information like unit weight, ground water level, SPT values are thus obtained and compiled for the above selected bore holes and used for the site response analysis using SHAKE2000 program, which is shown in Table 2.
Table 2 Typical Input Parameter for Shake Analysis
Layer No: Soil type Depth
(m) Thickness
(m) Unit Weight
(kN/m2N
Corrected ) 1 silty sand with clay 1.5 1.5 20.6 26 2 silty sand with clay 2.5 1.0 20.6 32 3 silty sand 3.0 0.5 20.6 32 4 silty sand 4.0 1.0 20.4 37 5 silty sand 4.5 0.5 20.4 37 6 silty sand 6.0 1.5 20.4 41 7 silty sand 6.5 0.5 20.4 41 8 silty sand 7.5 1.0 19.0 45 9 silty sand 9.0 1.5 19.0 86
10 silty sand 10.5 1.5 19.0 74 11 silty sand 12.0 1.5 19.0 41 12 silty sand 13.5 1.5 19.0 54 13 silty sand 15.0 1.5 19.0 62 14 hard rock >15 19.0 100

ESTIMATED AND MEASURED GROUND RESPONSE PARAMETERS 249
The ‘N’ values measured in the field using Standard penetration test procedure have been corrected for various corrections. The detailed N correction and geotechnical borelogs is presented in Sitharam et al (2007).
Seismicity and Synthetic Ground Motion
Indian peninsular shield, which was once considered to be seismically stable, has experienced a few earthquakes in the recent past. Large number of earthquakes with different magnitudes has occurred in this region. Authors have carried out the seismic hazard analysis for Bangalore city by considering possible earthquake sources and have developed synthetic ground motion model for Bangalore (Sitharam and Anbazhagan, 2007). Using the available data on faults, lineaments and earthquake occurrences, the authors have attempted to identify potential seismic source in a distance of 350km radius around Bangalore. Authors have identified a vulnerable source as Mandya-Chennapatana- Bangalore lineaments (L15, see Figure 1) and evaluated the maximum credible earthquake (MCE) 5.1 in moment magnitude (Sitharam and Anbazhagan, 2007). Due to lack of strong motion data in this region, authors have developed synthetic ground motion using Boore’s model (1983, 2003) program (Sitharam and Anbazhagan, 2007). Boore (1983, 2003) gives the details of estimating ground motion based on the Fourier amplitude spectrum of acceleration at bedrock and this is expressed as:
( ) ( ) ( ) ( )A f C S f D f P f = (1)
where, ( )S f is the source spectral function, ( )D f is the diminution function characterizing the attenuation, and ( )P f is a filter to shape acceleration amplitudes beyond a high cut-off frequency fm,
Site Response
and C is a scaling factor. The same model has been used to generate the synthetic ground motion at 170 borehole locations and used as input ground motion to the site response study. A typical synthetic ground motion is shown in Figure 2. The minimum PHA value of 0.07g is obtained corresponding to a borehole in southeast corner of Bangalore and maximum PHA value of 0.212g is obtained for the Bore hole location 47 (See Figure 1). The duration of all the synthetic strong motion is about 3.5 to 5 seconds; spectral acceleration at rock level is generated for all locations; typical one is shown in Figure 3.
Ground response analyses are used to predict ground surface motions by evaluating the amplification potential that are used to develop the design response spectrum. In the present study, equivalent linear one-dimensional ground response analysis has been carried out using SHAKE 2000 software in which motion of the object can be given in any one layer in the system and motions can be computed in any other layer. In equivalent linear approach, the non-linearity of the shear modulus and damping is accounted by using equivalent linear soil properties by an iterative procedure to obtain values for modulus and damping compatible with the effective strains in each layer. In this approach, first, a known time history of bedrock motion is represented as a Fourier series, usually using the Fast Fourier Transform (FFT). Second, the Transfer Functions for the different layers are determined using the current properties of the soil profile.

INDIAN GEOTECHNICAL JOURNAL 250
Fig. 2 Typical Input Ground Motion used for Analysis
-90
-60
-30
0
30
60
90
29 30 31 32 33 34 35
A
ccel
erat
ion,
cm
/sec
2
Time, sec
-3
-2
-1
0
1
2
3
29 30 31 32 33 34 35
Vel
ocity
, cm
/sec
Time, sec
-0.3
-0.2
-0.1
0.0
0.1
0.2
0.3
29 30 31 32 33 34 35
D
ispl
acem
ent,
cm
Time, sec

ESTIMATED AND MEASURED GROUND RESPONSE PARAMETERS 251
The transfer functions give the amplification factor in terms of frequency for a given profile. In the third step, the Fourier spectrum is multiplied by the soil profile transfer function to obtain an amplification spectrum transferred to the specified layer. Then, the acceleration time history is determined for that layer by the Inverse Fourier Transformation in step four. With the peak acceleration from the acceleration time history obtained and with the properties of the soil layer, the shear stress and strain time histories are determined in step five. In step six, new values of soil damping and shear modulus are obtained from the damping ratio and shear modulus degradation curves corresponding to the effective strain from the strain time history. With these new soil properties, new transfer functions are obtained and the process is repeated until the difference between the old and new properties fit in a specified range. The basic approach of one dimensional site response study is the vertical propagation of shear waves through soil layers lying on an elastic layer of the rock which extends to infinite depth. The horizontal displacement due to the vertically propagating harmonic s-waves in each material is given by:
( ) ( ) ( )* *
, s s s si t k z i t k zs s s su z t A e B eω ω+ −
= + (2)
( ) ( ) ( )* "
, r s r si t k z i t k zr r r su z t A e B eω ω+ −
= + (3)
In the equations subscripts s and r refers to soil and rock respectively.
where u is the displacement, ω is the circular frequency of the harmonic wave and k* is the complex wave number. No shear stress can exist at the ground surface (zs
* * (0, )(0, ) (0, ) 0,ss s
s
u tt G t Gz
τ γ∂
= = =∂
=0), so
(4)
Fig. 3 Typical Spectral Acceleration at Rock Level
0.00
0.05
0.10
0.15
0.20
0.25
0.30
0 0.25 0.5 0.75 1 1.25 1.5 1.75 2
Spe
ctra
l Acc
eler
atio
n, g
Periods, sec

INDIAN GEOTECHNICAL JOURNAL 252
where * (1 2 )sG G iβ= − is the complex shear modulus of the soil, z is the depth,
shear modulus (G), equivalent linear damping ratio (β ) and γ is shear strain.
The soil surface amplitude can be obtained as the product of rock outcrop amplitude and the transfer function, which is defined as the ratio of the soil surface amplitude to the rock outcrop amplitude. Therefore, the response of soil layer to a periodic input motion can be obtained by the following steps (Idriss and Sun 1992).
Schnabel et al. (1972) explained that within a given layer (layer j), the horizontal displacements for the two motions (motions A and B) are given by:
( )* *
( , ) j j j jik z ik z i tr j j ju z t A e B e e ω−= + (5)
Thus, at boundary between layer j and layer j+1, compatibility of displacements requires that
" "
1 1j j j jik z ik z
j j j jA B A e B e−+ ++ = + (6)
Continuity of shear stresses requires that
( )" "* *
1 1 * *1 1
j j j jik z ik zj jj j j j
j j
G KA B A e B e
G K−
+ ++ +
+ = + (7)
The effective shear stress of equivalent linear analysis is calculated as
maxeff Rγγ γ= (8)
Where maxγ is the maximum shear strain in the layer and γR is a strain
reduction factor often taken as
110
MRγ−
= (9)
which in, M is the magnitude of the earthquake.
Corresponding soil properties of each layer is modeled by using modulus reduction (G/Gmax
Input (Object) Motions
) and damping (β) versus shear strain curves. The degradation curves proposed by Seed and Idriss (1970) and Schnabel (1973) for sand and rock are used for the present work.
Since the strong motion accelerographs are recently installed in the study area by the authors and also no record of any earthquake is available, for site response studies, hence it is necessary to use synthetic ground motion. The synthetic ground motion developed using Boore’s model for the study area by the authors have been used for site response analysis (Sitharam and Anbazhagan, 2007). Authors have identified some potential sources around Bangalore, and

ESTIMATED AND MEASURED GROUND RESPONSE PARAMETERS 253
have estimated the magnitude of maximum credible earthquake and PGA at rock level and further simulated synthetic strong motion data by considering regional seismological factors (Sitharam and Anbazhagan, 2007). In this study the input rock motions at bed rock have been generated for each borehole location considering the hypocentral distance from each bore log to the Mandya -Channapatna - Bangalore lineament and used as input for the corresponding borehole for site response study. The peak horizontal acceleration (PHA) obtained for each bore hole locations are used to generate the rock level PHA map, which is shown in Figure 4. The Mandya-Channapatna-Bangalore lineament passes through the zone showing PHA greater than 0.2g and as the distance from this lineament increases the PHA decreases, which is due to the variation of the hypocentral distance with respect to borehole locations. These results are also comparable with peak ground acceleration map based on probabilistic approach presented by Anbazhagan et al. (2009b).
Ground Response Analysis
The rock motion obtained from synthetic ground motion model assigned at the bedrock level as input in SHAKE to evaluate peak acceleration values and acceleration time histories at the top of each sub layer. Response spectra at the top of the bedrock and at ground surface and amplification spectrum between the first and last layer at a frequency step of 0.125 are obtained. Typical results obtained for borehole location 103 (see Figure 1) are illustrated in Figures 5 a-c. The variation of peak acceleration with depth is shown in Figure 5a. At this borehole, the basement
Fig. 4 Peak Acceleration Map at Rock Level
77.54E 77.56E 77.58E 77.6E 77.62E 77.64E 77.66E 77.68E
12.92N
12.94N
12.96N
12.98N
13N
13.02N
13.04N
0.07g
0.1g
0.12g
0.14g
0.16g
0.18g
0.2g
Latit
ude,
Deg
ree
Nor
th
Longitude, Degree East

INDIAN GEOTECHNICAL JOURNAL 254
is 15m deep, the top 3.5m is composed of silty sand with clay and the layers below (3.5m -15m) are made of dense silty sand. The top layer of silty sand with clay shows highest amplification values, the peak occurring at 0.36s. In the response spectrum of soil shown in Figure 5b, the first peak of 0.9g occurs at 5Hz and second peak of 1.1 g at 14 Hz, similar peaks are identified in amplitude spectrum which is shown in Figure 5c. In the amplification spectrum the maximum amplification ratio occurs at 5 Hz frequency, which is the predominate frequency of the soil column in that location.
Fig. 5a Variation of Peak Acceleration with Depth
0.0 0.1 0.3 0.4 0
-5
-10
-15
Dep
th, m
Peak Acceleration, g
Fig. 5b Response Spectrum for 5% Damping at Ground Surface
1.0 1 10 100
1.5
1.0
0.5
0.0
Spe
cial
Acc
eler
atio
n, g
Frequency, Hz
Anirudhan
Polygonal Line

ESTIMATED AND MEASURED GROUND RESPONSE PARAMETERS 255
Results and Discussions
This study based on the borehole data has analyzed the ground response and its variations in the study area. The parameters obtained from the analysis are presented as maps, which are developed by interpolating the finite point values using the natural neighborhood interpolation technique to depict the variation of various parameters in the study area. The maps represent different parameters of the site response study and amplification potential of Bangalore. The map shows the peak acceleration at the ground surface, amplification factor, period of the soil column, peak spectral acceleration, frequency corresponding to the speck spectral acceleration and the response spectrum at the ground surface of frequency of 1.5Hz, 3Hz, 5Hz, 8Hz and 10Hz for a 5% damping ratio. The details of parameters and results are discussed in the following sub sections.
Peak Ground Acceleration
The peak horizontal acceleration (PHA) values at bedrock level are amplified based on the soil profile at various locations. The peak acceleration values at the ground surface is obtained from SHAKE and are used to prepare the peak horizontal acceleration (PHA) map of Bangalore, which is shown in Figure 6. This PGA value ranges from 0.088g to 0.658g and it is not evenly distributed due to variation in the soil profile at various locations. The ground acceleration is considerably large in the areas of tank beds, resulting from the thick layers of silty sand. These results are comparable with site response using shear wave velocity and probabilistic approach presented by Anbazhagan and Sitharam (2008c) and Anbazhagan et al., (2009a).
Fig. 5c Amplification Spectrum between the Bedrock and Ground Surface
0 5 10 15 20 25
15
10
5
0
Am
plifi
catio
n R
atio
Frequency

INDIAN GEOTECHNICAL JOURNAL 256
Amplification Factor
Ground motions with high peak accelerations are usually more destructive than motions with lower peak accelerations thus indicating that regions in this zone have PGA greater than 0.4g and are seismically more unstable than the other regions. However, very high PHA values that last only for a very short period of time and have very high frequencies may cause little damage to many types of structures. Hence a better estimate of the regions of high seismic vulnerability can be made by identifying regions susceptible to higher amplification of the bedrock motion. The term “Amplification Factor” is hence used here to refer to the ratio of the peak horizontal acceleration at the ground surface to the peak horizontal acceleration at the bedrock. This factor is evaluated for all the borehole locations using the PHA at bedrock obtained from the synthetic acceleration time history for each borehole and the peak ground acceleration obtained as a result of ground response analysis using SHAKE 2000. The amplification factor thus calculated ranged from 1 to 4.9. These results were interpolated as described earlier to prepare the amplification map.
Bangalore city can be divided into four zones based on the range of amplification factors assigned to each zone as shown in Table 3. The amplification factor map for Bangalore city is shown in Figure 7. Lower amplification values indicate lesser amplification potential and hence lesser seismic hazard. It can be observed that the amplification factor for most of Bangalore region is in the range of
Fig. 6 Peak Acceleration Map at Ground Surface
77.54E 77.56E 77.58E 77.6E 77.62E 77.64E 77.66E 77.68E
12.92N
12.94N
12.96N
12.98N
13N
13.02N
13.04N
0.08g
0.2g
0.3g
0.4g
0.5g
0.6g
Latit
ude,
Deg
ree
Nor
th
Longitude, Degree East

ESTIMATED AND MEASURED GROUND RESPONSE PARAMETERS 257
2 to 3. From this it can be concluded that most of Bangalore region has a moderate amplification potential.
Table 3 Zones and Amplification Factor Range
Zone Amplification Factor
I 1.00-1.99
II 2.00-2.99
III 3.00-3.99
IV > 4.00
Zone IV
This is a zone of high amplification potential with the amplification factor ranging from 4 to 5. A very small part of the city comes under this zone. Comparison of the variation of overburden thickness in the city map and the amplification factor map shows that the regions under this zone have an overburden thickness in the range of 5m to 10m. The high amplification potential in these regions can be attributed to factors other than the overburden thickness. Boreholes located in the North Eastern side of the city lies in zone IV. The amplification factor for these soil profiles is evaluated to be very high due to presence of clay soil overburden from 2m to 15.5m thickness. This can be attributed to the fact that this region has a filled up soil of about 4m depth and a
Fig. 7 Amplification Factor Map for Bangalore City
77.54E 77.56E 77.58E 77.6E 77.62E 77.64E 77.66E 77.68E
12.92N
12.94N
12.96N
12.98N
13N
13.02N
13.04N
1
2
3
4
Longitude, Degree East
Latit
ude,
Deg
ree
Nor
th

INDIAN GEOTECHNICAL JOURNAL 258
shallow water table depth of 0.3m which considerably increases the amplification potential. The soil profile in the North-West part of the city (Borehole 121) also shows a filled up soil depth of about 1.5m causing high amplification factor of 4.3. Soil profiles at boreholes 118 and 122 also reveal a shallow water table depth of 1m to 2m and a filled up soil of 1.5m causing the small region of high amplification in the South-East part of the city. The borehole 1-4 which is located in the north-central region has a high amplification factor of 4.2 which can be attributed to the presence of 6m overburden of silty sand with mica.
Zone III
The area under this zone also has a considerably large amplification potential. The bore logs located in zone III have low average shear wave velocities as calculated from the SPT values when compared to the boreholes in the other zones. Borehole number 109 which is located in the southern tip of the city has an overburden of 9m but has a considerably high amplification factor of 3.5. This may be due to the presence of a shallow water table depth of 2.7m. Hence the amplification factor map shows a region of zone III in the southern part of the city. This is clearly illustrated in the amplification factor map as a patch of zone III in the northern- central part due to shallow water table. The high amplification in the Eastern stretch of the city may be due to the presence of dried and encroached lake beds.
Zone II
Most of the area in Bangalore comes under this zone with an amplification factor of 2 to 3. The borehole 82 has an overburden of 11m with the water table at the ground surface. It has an amplification factor of 2.5 both due to high overburden and shallow water table depth. The borehole 60 which is located in the north-eastern part of the city has an overburden of 21m with the water table at a depth of 2m from the ground surface. The upper 13m consists of clayey sand which is followed by weathered rock and the soil profile having an average shear wave velocity of 278m/s. Variation of peak acceleration with depth plots shows that much of the amplification occurs in the upper 13m as compared to that occurring in the weathered rock layer. The other parts of the city in the south-eastern and north-western region which are in this zone have an amplification factor of 2.5 to 2.9. Most of the boreholes located in this region have a shallow water table depth ranging from 0.15m to 5.4m. The soil profile at the borehole location of 90 shows an amplification factor of 2.7. At this location, the overburden consisted of a 16m thick silty sand layer with a high average shear wave velocity followed by soft rock. There was also no trace of ground water till 16m.
Zone I
The regions under this zone exhibit a relatively low amplification potential of 1 to 2. This zone extends predominantly in the central region of the city and also includes the northern tip of the city. The northern tip of the city has a very low overburden of 1m to 2m and hence has a low amplification potential. A cluster of boreholes (2, 3 and 7) were analyzed in this region. The water table was not encountered here and the rock depth varied from 1m to 2m. The average shear wave velocity obtained at these borehole locations are relatively higher than that obtained for other boreholes. All the above factors result in a low amplification potential in this region. The phenomena of soil amplification results in transfer of

ESTIMATED AND MEASURED GROUND RESPONSE PARAMETERS 259
larger accelerations than rock level acceleration to structures and causes destruction particularly when the resulting seismic wave frequency matches with the resonant frequencies of the structures. Hence, considering the amplification factor, the regions in zones I and II can be classified as seismically more stable when compared to the zones III and IV.
Amplification with Overburden Thickness
Map of overburden thickness of soil column at these borehole locations has been prepared and compared with the amplification potential. Figure 8 shows the variation of rock depth in the city. This map has been prepared based on the geotechnical information obtained from selected 170 boreholes in the study area of 220 km2
. This plot corresponds very well with the data of overburden thickness from 850 boreholes. The northern tip of the city which has a low overburden of 1m to 5m also has a low amplification factor and lies in zone I (see Figure 8). However, most of the regions in zone IV and zone III have an overburden thickness in the range of 5m to 10m. Also, the regions of high overburden (>20m) lie in zone I or zone II thus not depicting risk of high amplification. Hence, it can be concluded that amplification of seismic waves depends not only on overburden thickness but also on various other factors like the frequency of the input motion, average shear wave velocity of the soil profile and water table depth similar to the observation of Destegul (2004) in Lalitpur, Nepal. It was also observed that the PGA value was decreasing for greater thickness of soil overburden.
Fig. 8 Map Showing Variation of Rock Depth in Bangalore City
77.54E 77.56E 77.58E 77.6E 77.62E 77.64E 77.66E 77.68E
12.92N
12.94N
12.96N
12.98N
13N
13.02N
13.04N
1m
5m
10m
15m
20m
25m
30m
33m
Longitude, Degree East
Latit
ude,
Deg
ree
Nor
th

INDIAN GEOTECHNICAL JOURNAL 260
Period of Soil Column
Results obtained from the site specific ground response analysis show that the natural periods are in between 0.01s and 0.45s with about 85% of the locations having a period below 0.2s. Figure 9 shows the variation of the period of soil column at various locations. The major part of the study area has the soil column period less than 0.3s. Lower period of soil column correspond to lower amplification factor. The lower period of the soil column may be as a result of higher damping of the soil. However, the surface accelerations are high in many locations (see Figure 6). This result is attributed to the characteristics of the frequency content of the ground motion generated. The frequency content of a real event can be different from the frequency content of the synthetic ground motion used in this study.
Peak Spectral Parameters
The earthquake amplitudes are represented usually by the peak ground acceleration; however for the structural designs in the building codes the most widely used parameter is spectral acceleration and corresponding period/frequency. Peak spectral acceleration (PSA) and frequency corresponding to PSA of each borelog from site response study has been computed. Peak spectral acceleration varies from 0.2g to 2.5g which is shown Figure 10. North western part of the study area has higher spectral acceleration when compared to the south eastern part of the study area. Figure 11 shows that the frequency corresponding to the PSA varies from 3.2Hz to 20Hz. Major part of the study area
Fig. 9 Variation of Period of the Soil Column at Various Locations
77.54E 77.56E 77.58E 77.6E 77.62E 77.64E 77.66E 77.68E
12.92N
12.94N
12.96N
12.98N
13N
13.02N
13.04N
0.01s
0.1s
0.2s
0.3s
0.4s
Latit
ude,
Deg
ree
Nor
th
Longitude, Degree East

ESTIMATED AND MEASURED GROUND RESPONSE PARAMETERS 261
have the frequency content of 5Hz to 15Hz. The period of the soil column distribution map (Figure 9) matches with frequency distribution map at PSA.
Fig. 10 Peak Spectral Acceleration for the Study Area
77.54E 77.56E 77.58E 77.6E 77.62E 77.64E 77.66E 77.68E
12.92N
12.94N
12.96N
12.98N
13N
13.02N
13.04N
0.2g
0.5g
1g
1.5g
2g
Longitude, Degree East
Latit
ude,
Deg
ree
Nor
th
77.54E 77.56E 77.58E 77.6E 77.62E 77.64E 77.66E 77.68E
12.92N
12.94N
12.96N
12.98N
13N
13.02N
13.04N
2Hz
5Hz
10Hz
14Hz
18Hz
20Hz
Longitude, Degree East
Latit
ude,
Deg
ree
Nor
th
Fig. 11 Frequency Corresponding to Peak Spectral Acceleration

INDIAN GEOTECHNICAL JOURNAL 262
Response Spectra at Ground Surface
The frequency content of an earthquake motion will strongly influence the effects of that motion and hence the PGA value by itself cannot characterize the ground surface motion. A response spectrum is used extensively in earthquake engineering practice to indicate the frequency content of an earthquake motion. A Response Spectrum describes the maximum response of a single-degree-of-freedom (SDOF) system to a particular input motion as a function of the natural frequency/period and damping ratio of the SDOF system. It represents in a single graph the combined influences of acceleration amplitudes and frequency components of the movement. Since the time history of the seismic excitation in a certain site is characterized by the corresponding response spectrum, the differences among the time histories of the movements at different places can be analyzed by the comparison of their response spectra. The acceleration-time histories at various depths are obtained as a result of ground response analysis and these motions can be characterized by the corresponding response spectra. The ground surface response spectra for all the 170 borehole locations were plotted with 5% critical damping value. The spectral acceleration (SA) values for all the locations at 1.5 Hz, 3 Hz, 5Hz, 8 Hz and 10 Hz are computed and presented in Figures 12-16. The above frequencies were selected as they represent the range of natural frequencies of tall buildings to single storey buildings (Day, 2001; Govinda Raju et.al, 2004) and are hence suitable for all kinds of construction in the city.
At 1.5 Hz frequency, the SA values are very low and varies from 0.01g to 0.07g for all the locations which is shown in Figure 12. The SA map at 1.5 Hz frequency shows that there is not much variation of SA values and most of the area
77.54E 77.56E 77.58E 77.6E 77.62E 77.64E 77.66E 77.68E
12.92N
12.94N
12.96N
12.98N
13N
13.02N
13.04N
0.013g
0.02g
0.04g
0.055g
0.07g
Latit
ude
Deg
ree
Nor
th
Longitude, Degree East
Fig. 12 Spectral Acceleration Map of Bangalore at 1.5 Hz Frequency

ESTIMATED AND MEASURED GROUND RESPONSE PARAMETERS 263
in the city has a SA value between 0.02g to 0.04g at this frequency. The SA values vary over a wide range from 0.03g to 0.54g at 3 Hz frequency. Figure 13 shows the variation of these values at different locations.
A major part of the city lies in the range of 0.1g to 0.2g. Zones of high SA of above 0.3g are observed in the northern and south-west part of the city. The central part of the city also has a SA greater than 0.2g at this frequency. The entire region can be divided into 5 groups based on the SA values at 5 Hz frequency as shown in Figure 14. The SA at this frequency varies from 0.08g to 1.14g and is unevenly distributed around the city with a major region having a SA in the range of 0.3g to 0.5g. Maximum SA for this frequency was 1.14g at borehole 88 located in the northern part of the city. Figures 15 and 16 show the variation of SA corresponding to the frequency of 8Hz and 10Hz respectively. A comparison of these figures shows that the distribution of SA at 8 Hz and 10 Hz is considerably similar in the city. The SA varies over a wide range between 0.17g to 2.17g at 8 Hz frequency and between 0.18g to 1.88g at 10 Hz frequency.
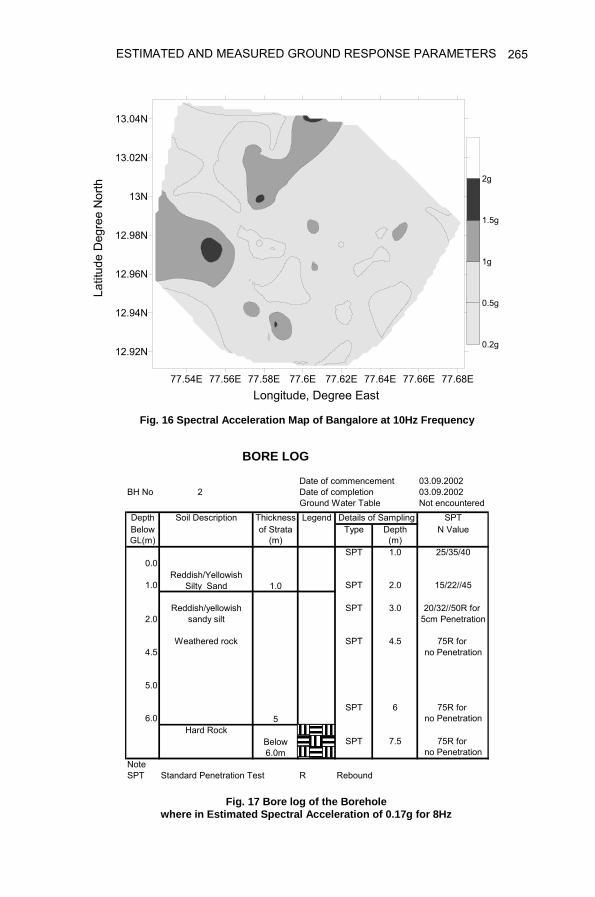
The lower spectral acceleration results from very low amplification. The borelog wherein SA of 0.17g is obtained is shown in Figure 17. Soil layer is very thin silty sand resulting in the lower amplification as well as lower SA. Figure 18 shows the borelog where in, the estimated SA is more than 2.1g. The soil overburden is considerably large in this region (10m to 15m) and also the borelog shows that thick layer of clayey sand is present. The soil found in this region has the liquid limit of more than 30 representing cohesive nature which might have caused the higher SA values at higher frequencies. The northern central region lies in the range SA above 0.8g at both the frequencies. The northern and the
77.54E 77.56E 77.58E 77.6E 77.62E 77.64E 77.66E 77.68E
12.92N
12.94N
12.96N
12.98N
13N
13.02N
13.04N
0.02g
0.1g
0.2g
0.3g
0.4g
0.5g
Longitude, Degree East
Latit
ude
Deg
ree
Nor
th
Fig. 13 Spectral Acceleration Map of Bangalore at 3 Hz Frequency

INDIAN GEOTECHNICAL JOURNAL 264
77.54E 77.56E 77.58E 77.6E 77.62E 77.64E 77.66E 77.68E
12.92N
12.94N
12.96N
12.98N
13N
13.02N
13.04N
0.05g
0.2g
0.3g
0.5g
0.7g
0.8g
Longitude, Degree East
Latit
ude
Deg
ree
Nor
th
Fig. 14 Spectral Acceleration Map of Bangalore at 5 Hz Frequency
77.54E 77.56E 77.58E 77.6E 77.62E 77.64E 77.66E 77.68E
12.92N
12.94N
12.96N
12.98N
13N
13.02N
13.04N
0.2g
0.5g
1g
1.5g
1.8g
Longitude, Degree East
Latit
ude
Deg
ree
Nor
th
Fig. 15 Spectral Acceleration Map of Bangalore at 8 Hz Frequency
ESTIMATED AND MEASURED GROUND RESPONSE PARAMETERS 265
BORE LOG
Date of commencement 03.09.2002BH No 2 Date of completion 03.09.2002
Ground Water Table Not encounteredDepth Thickness Legend SPTBelow of Strata Type Depth N ValueGL(m) (m) (m)
SPT 1.0 25/35/400.0
1.0 SPT 2.0 15/22//45
SPT 3.0 20/32//50R for 2.0 5cm Penetration
SPT 4.5 75R for 4.5 no Penetration
5.0
SPT 6 75R for 6.0 no Penetration
SPT 7.5 75R for no Penetration
NoteSPT Standard Penetration Test R Rebound
Details of Sampling
5
1.0
Soil Description
Reddish/Yellowish Silty Sand
Reddish/yellowish sandy silt
Below 6.0m
Hard Rock
Weathered rock
Latit
ude
Deg
ree
Nor
th
Longitude, Degree East
77.54E 77.56E 77.58E 77.6E 77.62E 77.64E 77.66E 77.68E
12.92N
12.94N
12.96N
12.98N
13N
13.02N
13.04N
0.2g
0.5g
1g
1.5g
2g
Fig. 16 Spectral Acceleration Map of Bangalore at 10Hz Frequency
Fig. 17 Bore log of the Borehole where in Estimated Spectral Acceleration of 0.17g for 8Hz

INDIAN GEOTECHNICAL JOURNAL 266
BORE LOG
Date of commencement 28.8.2003BH No 77 Date of completion 29.8.2003
Ground Water Table 1.5m
Depth Thickness Legend SPTBelow of Strata Type Depth N ValueGL(m) (m) (m)
0.0 SPT 1.5 3/4//6UDS 2.0
1.5SPT 3.0 7/10//12
3.0
4.0 SPT 4.5 12/2//24
6.0
7.0SPT 6.0 14/13/27
8.0SPT 6 20/30/33
9.0SPT 7.5 75R for 3cm
Penetration10.0
SPT 9 75R for no Penetration
NoteSPT Standard Penetration Test R ReboundUDS Undisturbed Sample
Brownish Silty sand
Soil Description Details of Sampling
Brownish/greyishClayey sand
1.5
4.5
4
Greyish silty sand/Sandy silt with mica
Weathered Rock
1.5Starts
eastern parts of the city lie in the lower SA zone for both the frequencies. The south-west part of the city lies in a lower range of 0.1g to 0.4g at 8 Hz frequency but lies in the higher range of 0.5g to 0.8g at 10 Hz frequency. From the SA maps, the northern and eastern parts of the city are in the low SA zone at all frequencies. These results are complied with other parameters and integrated for preparation of final microzonation map to the study area (Sitharam and Anbazhagan, 2008; Anbazhagan et al., 2009c). The above analysis is based on the synthetic ground motion generated at each location and may vary if the soil column is subjected to different input motions.
Fig. 18 Borelog of the Borehole where in Estimated Spectral Acceleration of More than 2.1g for 8Hz

ESTIMATED AND MEASURED GROUND RESPONSE PARAMETERS 267
Comparison with Experimental Studies
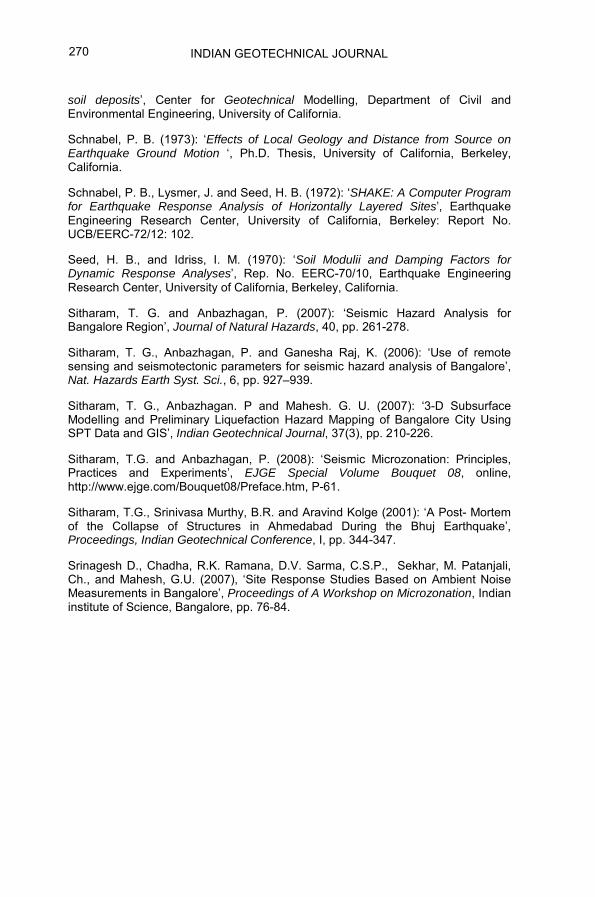
To validate the findings from this study, an attempt has been made to compare the estimated period of soil column using SHAKE with experimentally measured dominant frequency in Bangalore. The period of soil column is inversely related to the frequency of the soil column. Srinagesh et al (2007) carried out the ambient noise survey for a selected period of duration at 64 different locations in Bangalore. Most of the locations are also close to the borehole locations. They have measured ambient noise at 100 samples/sec using instruments having L4-3D short period sensors equipped with Reftek 24 bit digital acquisition systems. The ambient noise recorded was analyzed using the JSESAME software. The H/V processing module of the JSESAME software was applied on the ambient noise data with necessary initial offset correction and Fourier spectra was computed using the algorithm by Konno-Omachi (Srinagesh et al 2007). They have used the average spectral ratio, H/V of the horizontal components for obtaining the fundamental frequency. The fundamental/predominant frequencies observed in Bangalore range between 1.2 Hz -10 Hz and are shown in Figure 19. Based on the analysis (Figure 19), authors have divided the study area into three different regions with the western part being characterized higher dominant frequencies 6 Hz to 8 Hz. In contrast, the region to the east of 77.56º E longitude is characterized by lower dominant frequencies. Most of the dominant frequencies range between 3 to 4 Hz though they range between 1.2 Hz to 6 Hz. However, there are areas within the regions of lower frequency which are characterized by higher dominant frequencies which range between 8 to 10 Hz.
Natural frequency of soil is inversely proportional to the natural period of soil column. Here the fundamental frequency from the experimental studies shown in Figure 19 is compared with the natural period of the soil shown in Figure 11. South
Fig. 19 Dominant Frequencies with Measured Locations using Noise Survey (after Srinagesh et al., 2007)
77.52E 77.54E 77.56E 77.58 77.60E 77.62E 77.64E 77.66E 77.68 E
13.04N
13.02N
13.00N
12.98N
12.96N
12.94N
4.42.76.48.2
6.63.9
2.6
7.5
5.7
6.9
8.7
6.3
1.6
6.1
2.8
3
5.7
3.8
5.4
3.8
5.7
3.8
8.2
7.7
6.3
9
3.8
3.2
103
6.23.7
4.2
6.3
34.2
3.8
4.14.7
2.8
4.6
3.2 3.6
2.8
4.4
3.195.33.5
2.76.2
2.7
5.9
5.9
1
2.5
4
5.5
7
8.5
10
12.92N

INDIAN GEOTECHNICAL JOURNAL 268
western side and northern side have the higher frequency which matches well with the lower period. Central part of study area has fundamental frequency of 3.5 Hz to 7.5 Hz, which matches well with the period of soil column corresponding to 0.2s to 0.3s. Major part of study area covered has fundamental frequency of 5Hz to 10Hz, which matches well with the period of 0.1s and above. This clearly shows that the fundamental frequency of soil column measured using ambient noise survey matches well with the fundamental period mapped using site response analysis.
Conclusions
An attempt has been made to estimate the amplification potential at various locations in Bangalore. The ground response parameters are evaluated considering the local site conditions in combination with the rock level motion. The synthetic bedrock motion generated for the selected 170 boreholes locations and the soil profile details from borehole information were considered as input and site specific ground response analysis was done for 170 locations in Bangalore using SHAKE 2000. The acceleration time history at the ground surface is obtained as output and was characterized by the PHA and the response spectra. The PHA at ground surface varies from 0.088g to 0.658g. The high value of surface accelerations at some locations may be due to the frequency of the base motions coinciding with that of the fundamental frequency of the soil column. The amplification factor which is a measure of amplification potential of the soil column was computed using this PHA and the peak acceleration at rock level. The range of amplification factor was 1 and 4.9. The high amplification factor at some locations is due to the presence of filled up soils and silty sand deposit in the silted tank beds, shallow water table depths and low SPT values which results in low average shear wave velocities. Thus, amplification of seismic waves depends not only on overburden thickness but also on various other factors like the frequency of the input motion, average shear wave velocity of the soil profile and water table depth. The results are reported as amplification factor map indicating zones of high vulnerability. The regions in zones I and II are seismically more stable than the regions in zones III and IV. Most of the area in Bangalore lies in zone II. Results obtained from the ground response analysis show that the natural periods of the analyzed deposits are in between 0.01s and 0.45s with about 85% of the locations having a period below 0.2s. The response spectra for 5% damping at the ground surface obtained for all the borehole locations clearly indicate that the range of spectral acceleration at different frequencies varied over a wide range. The peak spectral acceleration varies from 0.2g to 2.1g and frequency corresponding PSA varies from 3Hz to 20Hz. At 5% damping, the range of SA at 1.5 Hz frequency was 0.01 g to 0.07 g, at 3 Hz frequency it was in the range of 0.03 g to 0.65 g, while at 5 Hz frequency it was in the range of 0.08 g to 1.14g. The natural period of the soil column mapped in this study can be well compared with the experimental studies using ambient noise survey.
Acknowledgement Authors thank Seismology division, Department of Science and Technology,
Government of India for funding the project titled “Geotechnical site characterization of greater Bangalore region” (Ref no. DST/23(315)/SU/2002 dated October 2003). Also thanks to Torsteel Research Foundation India for sharing their

ESTIMATED AND MEASURED GROUND RESPONSE PARAMETERS 269
data for such a study. Acknowledgement is due to Ms. Divya.C for the analytical work carried out for this paper.
References
Anbazhagan, P. and Sitharam, T. G. (2008c): ‘Site Characterization and Site Response Studies Using Shear Wave Velocity’, Journal of Seismology and Earthquake Engineering, 10( 2), pp. 53-67.
Anbazhagan, P. and Sitharam, T. G. (2009): ‘Spatial Variability of the Weathered and Engineering Bed rock using Multichannel Analysis of Surface Wave Survey’, Pure and Applied Geophysics, 166(3), pp. 409-428.
Anbazhagan P., Sitharam, T.G. and Vipin, K.S. (2009a): ‘Site classification and estimation of surface level seismic hazard using geophysical data and probabilistic approach’, Journal of Applied Geophysics, 68 (2), pp. 219-230.
Anbazhagan, P., Vinod, J. S. and Sitharam, T. G. (2009b): ‘Probabilistic seismic hazard Analysis for Bangalore’, Journal of Natural Hazards, 48, pp145–166.
Anbazhagan, P. and Sitharam, T. G. (2008b): ‘Seismic Microzonation of Bangalore’, Journal of Earth System Science, 117(S2), pp. 833–852.
Anbazhagan, P. and Sitharam, T. G. (2008a): ‘Mapping of Average Shear Wave Velocity for Bangalore Region: A Case Study’, Journal of Environmental & Engineering Geophysics, 13 (2), pp. 69-84.
Anbazhagan, P., Thingbaijam, K.K.S., Nath, S.K., Narendara Kumar, J.N., and Sitharam, T.G. (2009c): ‘Multi-Criteria Seismic Hazard Evaluation for Bangalore City, India’, Journal of Asian Earth Sciences (Accepted after revision).
Ansal, A. (2004): ‘Recent Advances in Earthquake Geotechnical Engineering and Microzonation’, Published by Kluwer Academic Publishers.
Boore, D. M (1983); ‘Stochastic simulation of high-frequency ground motions based on seismological models of the radiated spectra’, Bull. Seism. Soc. Am., 73, pp. 1865-1894.
Boore, D. M (2003); ‘Simulation of ground motion using the stochastic method’, Pure and Applied Geophysics, 160, pp. 635-675.
Day, R. W. (2001): ‘Geotechnical Earthquake Engineering Handbook’, McGraw-Hill.
Destegul Umut, (2004): ‘Sensitivity Analysis of Soil Site Response Modelling in Seismic Microzonation for Lalitpur, Nepal ‘, M.Sc Thesis, International Institute of Geo-Information Science and Earth Observations, Enschede, Netherlands.
Govinda Raju, L., Ramana, G. V., Hanumantha Rao, C. and Sitharam, T. G. (2004): ‘Site-specific Ground Response Analysis’, Current Science, 87(10), pp.1354-1362.
Idriss I. M., and Sun J. I. (1992): ‘User’s manual for SHAKE91: a computer program for conducting equivalent linear seismic response analyses of horizontally layered
INDIAN GEOTECHNICAL JOURNAL 270
soil deposits’, Center for Geotechnical Modelling, Department of Civil and Environmental Engineering, University of California.
Schnabel, P. B. (1973): ‘Effects of Local Geology and Distance from Source on Earthquake Ground Motion ‘, Ph.D. Thesis, University of California, Berkeley, California.
Schnabel, P. B., Lysmer, J. and Seed, H. B. (1972): ‘SHAKE: A Computer Program for Earthquake Response Analysis of Horizontally Layered Sites’, Earthquake Engineering Research Center, University of California, Berkeley: Report No. UCB/EERC-72/12: 102.
Seed, H. B., and Idriss, I. M. (1970): ‘Soil Modulii and Damping Factors for Dynamic Response Analyses’, Rep. No. EERC-70/10, Earthquake Engineering Research Center, University of California, Berkeley, California.
Sitharam, T. G. and Anbazhagan, P. (2007): ‘Seismic Hazard Analysis for Bangalore Region’, Journal of Natural Hazards, 40, pp. 261-278.
Sitharam, T. G., Anbazhagan, P. and Ganesha Raj, K. (2006): ‘Use of remote sensing and seismotectonic parameters for seismic hazard analysis of Bangalore’, Nat. Hazards Earth Syst. Sci., 6, pp. 927–939.
Sitharam, T. G., Anbazhagan. P and Mahesh. G. U. (2007): ‘3-D Subsurface Modelling and Preliminary Liquefaction Hazard Mapping of Bangalore City Using SPT Data and GIS’, Indian Geotechnical Journal, 37(3), pp. 210-226.
Sitharam, T.G. and Anbazhagan, P. (2008): ‘Seismic Microzonation: Principles, Practices and Experiments’, EJGE Special Volume Bouquet 08, online, http://www.ejge.com/Bouquet08/Preface.htm, P-61.
Sitharam, T.G., Srinivasa Murthy, B.R. and Aravind Kolge (2001): ‘A Post- Mortem of the Collapse of Structures in Ahmedabad During the Bhuj Earthquake’, Proceedings, Indian Geotechnical Conference, I, pp. 344-347.
Srinagesh D., Chadha, R.K. Ramana, D.V. Sarma, C.S.P., Sekhar, M. Patanjali, Ch., and Mahesh, G.U. (2007), ‘Site Response Studies Based on Ambient Noise Measurements in Bangalore’, Proceedings of A Workshop on Microzonation, Indian institute of Science, Bangalore, pp. 76-84.