
3.10 HYDROLOGY AND WATER QUALITY - SCAG...
67
3.10-1 3.10 HYDROLOGY AND WATER QUALITY This section of the Program Environmental Impact Report (PEIR) describes hydrology and water quality in the Southern California Association of Government (SCAG) region, discusses the potential impacts of the proposed 2016 Regional Transportation Plan/Sustainable Communities Strategies (“2016 RTP/SCS,” “Plan” or “Project”) on hydrology and water quality, identifies mitigation measures for the impacts, and evaluates the residual impacts. Hydrology and water quality were evaluated in accordance with Appendix G of the 2015 State California Environmental Quality Act (CEQA) Guidelines. Hydrology and water quality, within the SCAG region, were evaluated at a programmatic level of detail, in relation to basin plans published by the six Regional Water Quality Control Boards (RWQCBs) that have jurisdiction in the SCAG region; National Wetland Inventory Maps; USGS topographic data; the General Plans of the six counties and 191 cities within the six-county SCAG region; a review of related literature germane to the SCAG region; as well as a review of SCAG’s 2012 RTP/SCS PEIR. 1 Many of the surface water bodies are concentrated in the Central Valley and northern part of California, while the southern third of the state, including the SCAG region which is home to approximately half of the State’s population, is lacking in surface water. The southern third of California is, in fact, rather dry, and a desert in most locations. The most notable of the state’s surface features are the San Francisco Bay, located on the western side of California, about in the middle, Lake Tahoe, on the eastern border, where California “bends,” and the Salton Sea, the large water body near California's southern border. While the Salton Sea is located in the SCAG region, it is 50 percent saltier than the Pacific Ocean. 2 The hydrology and water quality of the SCAG region are a function of the geology, geomorphology, weather, climate, and plant communities. The SCAG region is characterized by a dramatic physical environment, ringed by two mountain ranges, the peninsular and transverse ranges; two deserts, the Mojave and Colorado; and bordered by the Pacific Ocean along an approximately 150-mile western margin, and the offshore Channel Islands. The majority of the precipitation occurs between November and March, with less than a third of the State-wide precipitation in Southern California, with an average of 10 inches per year in the coastal and inland valleys, and less than 2 inches per year on average in the deserts. Approximately 40 million acre-feet of the state’s natural water resources have been re-routed to support agricultural and urban land uses. 3 Definitions Definitions of terms used in the regulatory framework, characterization of baseline conditions, and impact analysis for hydrology and water quality are provided. 1 Southern California Association of Governments. April 2012. Final Program Environmental Report: 2012-2035 Regional Transportation Plan/Sustainable Communities Strategy. Available at: http://rtpscs.scag.ca.gov/Pages/Final-2012-PEIR.aspx 2 Frackel, Todd. C. Accessed 14 September 2015. California’s Largest Lake is Slipping Away Among an Epic Drought. The Washington Post. Available at: http://www.washingtonpost.com/business/economy/californias-largest-lake-is-slipping- away-amid-an-epic-drought/2015/05/28/e83dd136-fe51-11e4-833c-a2de05b6b2a4_story.html 3 Water Resources and Hydrology of California. Chapter 6, Rediscovering the Golden State. Downloaded 14 September 2015. Website. Available at: http://www.slideshare.net/lschmidt1170/water-resources-and-hydrology-of-california
Transcript of 3.10 HYDROLOGY AND WATER QUALITY - SCAG...

3.10-1
3.10 HYDROLOGY AND WATER QUALITY
This section of the Program Environmental Impact Report (PEIR) describes hydrology and water quality in the Southern California Association of Government (SCAG) region, discusses the potential impacts of the proposed 2016 Regional Transportation Plan/Sustainable Communities Strategies (“2016 RTP/SCS,” “Plan” or “Project”) on hydrology and water quality, identifies mitigation measures for the impacts, and evaluates the residual impacts. Hydrology and water quality were evaluated in accordance with Appendix G of the 2015 State California Environmental Quality Act (CEQA) Guidelines. Hydrology and water quality, within the SCAG region, were evaluated at a programmatic level of detail, in relation to basin plans published by the six Regional Water Quality Control Boards (RWQCBs) that have jurisdiction in the SCAG region; National Wetland Inventory Maps; USGS topographic data; the General Plans of the six counties and 191 cities within the six-county SCAG region; a review of related literature germane to the SCAG region; as well as a review of SCAG’s 2012 RTP/SCS PEIR.1 Many of the surface water bodies are concentrated in the Central Valley and northern part of California, while the southern third of the state, including the SCAG region which is home to approximately half of the State’s population, is lacking in surface water. The southern third of California is, in fact, rather dry, and a desert in most locations. The most notable of the state’s surface features are the San Francisco Bay, located on the western side of California, about in the middle, Lake Tahoe, on the eastern border, where California “bends,” and the Salton Sea, the large water body near California's southern border. While the Salton Sea is located in the SCAG region, it is 50 percent saltier than the Pacific Ocean.2 The hydrology and water quality of the SCAG region are a function of the geology, geomorphology, weather, climate, and plant communities. The SCAG region is characterized by a dramatic physical environment, ringed by two mountain ranges, the peninsular and transverse ranges; two deserts, the Mojave and Colorado; and bordered by the Pacific Ocean along an approximately 150-mile western margin, and the offshore Channel Islands. The majority of the precipitation occurs between November and March, with less than a third of the State-wide precipitation in Southern California, with an average of 10 inches per year in the coastal and inland valleys, and less than 2 inches per year on average in the deserts. Approximately 40 million acre-feet of the state’s natural water resources have been re-routed to support agricultural and urban land uses.3 Definitions Definitions of terms used in the regulatory framework, characterization of baseline conditions, and impact analysis for hydrology and water quality are provided.
1 Southern California Association of Governments. April 2012. Final Program Environmental Report: 2012-2035 Regional
Transportation Plan/Sustainable Communities Strategy. Available at: http://rtpscs.scag.ca.gov/Pages/Final-2012-PEIR.aspx
2 Frackel, Todd. C. Accessed 14 September 2015. California’s Largest Lake is Slipping Away Among an Epic Drought. The Washington Post. Available at: http://www.washingtonpost.com/business/economy/californias-largest-lake-is-slipping-away-amid-an-epic-drought/2015/05/28/e83dd136-fe51-11e4-833c-a2de05b6b2a4_story.html
3 Water Resources and Hydrology of California. Chapter 6, Rediscovering the Golden State. Downloaded 14 September 2015. Website. Available at: http://www.slideshare.net/lschmidt1170/water-resources-and-hydrology-of-california

2016 RTP/SCS 3.10 Hydrology and Water Quality Draft PEIR
3.10-2
Best Management Practices (BMPs): A BMP is defined by the Stormwater Quality Task Force as any program, technology, process, siting criteria, operating method, measure, or device that controls, prevents, removes, or reduces storm water pollution. Generally BMPs focus on water quality problems caused by increased impervious surfaces from land development. BMPs are designed to reduce stormwater volume, peak flows, and/or nonpoint source pollution through evapotranspiration, infiltration, detention, and filtration or biological and chemical actions. Ephemeral Drainages: An ephemeral stream has flowing water only during, and for a short duration after, precipitation events in a typical year. Ephemeral stream beds are located above the water table year-round. Groundwater is not a source of water for the stream. Runoff from rainfall is the primary source of water for stream flow. Hydrologic Unit Code (HUC): The United States is divided and sub-divided into successively smaller hydrologic units which are classified into four levels: regions, sub-regions, accounting units, and cataloging units. The hydrologic units are arranged or nested within each other, from the largest geographic area (regions) to the smallest geographic area (cataloging units). Each hydrologic unit is identified by a unique hydrologic unit code (HUC) consisting of two to eight digits based on the four levels of classification in the hydrologic unit system.
1. The first level of classification divides the Nation into 21 major geographic areas, or regions. These geographic areas contain either the drainage area of a major river, such as the Missouri region, or the combined drainage areas of a series of rivers, such as the Texas-Gulf region.
2. The second level of classification divides the 21 regions into 221 subregions. A subregion includes the area drained by a river system, a reach of a river and its tributaries in that reach, a closed basin(s), or a group of streams forming a coastal drainage area.
3. The third level of classification subdivides many of the subregions into accounting units. These 378 hydrologic accounting units are nested within, or can be equivalent to the subregions.
4. The fourth level of classification is the cataloging unit, the smallest element in the
hierarchy of hydrologic units. A cataloging unit is a geographic area representing part of all of a surface drainage basin, a combination of drainage basins, or a distinct hydrologic feature. There are 2264 Cataloging Units in the Nation.
Impaired Waters: Under section 303(d) of the Clean Water Act, states, territories, and authorized tribes are required to develop lists of impaired waters. These are waters that are too polluted or otherwise degraded to meet the water quality standards set by states, territories, or authorized tribes. The law requires that these jurisdictions establish priority rankings for waters on the lists and develop Total Maximum Daily Loads for these waters. Mudflow: Mudflows result from the downslope movement of soil and/or rock under the influence of gravity.

2016 RTP/SCS 3.10 Hydrology and Water Quality Draft PEIR
3.10-3
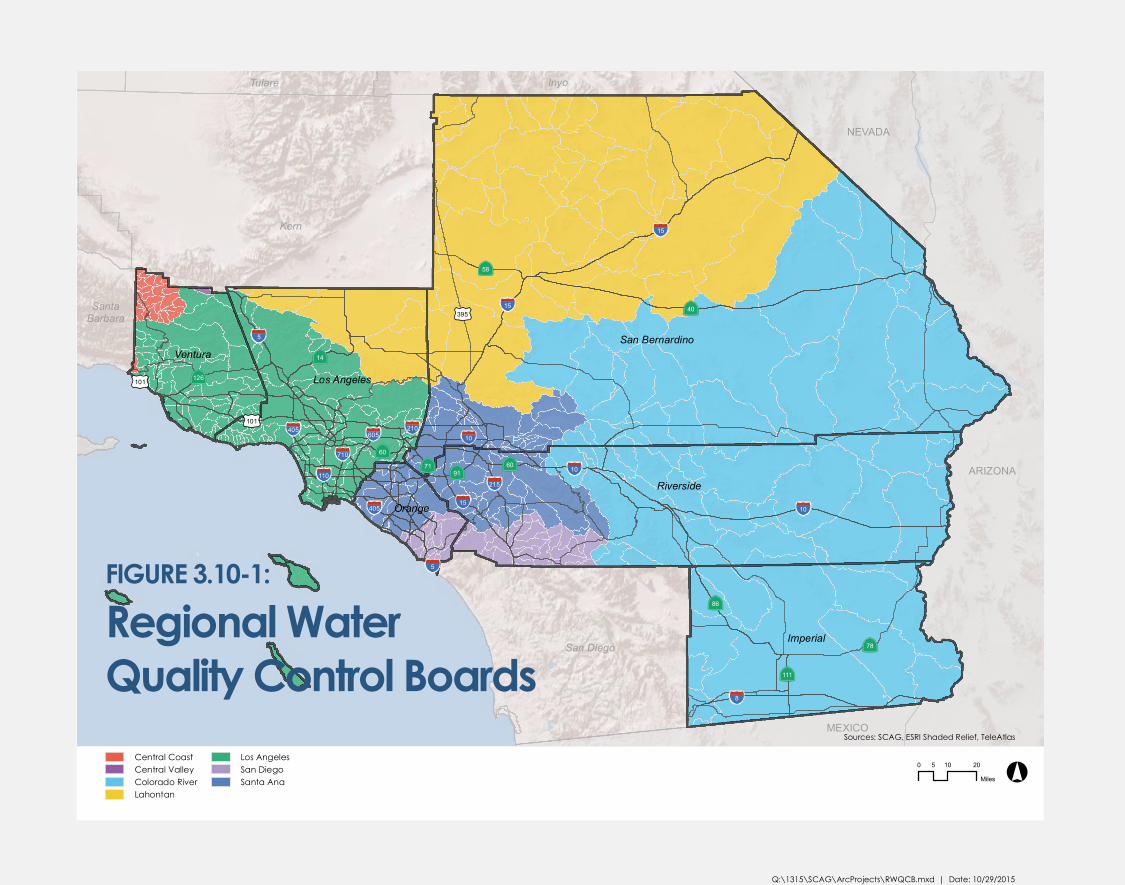
Non-Point Source Runoff: Runoff that occurs on surfaces before reaching a channel is also called a nonpoint source. If a nonpoint source contains man-made contaminants, the runoff is called nonpoint source pollution. A land area which produces runoff that drains to a common point is called a drainage basin. When runoff flows along the ground, it can pick up soil contaminants including, but not limited to, petroleum, pesticides, or fertilizers that become discharge or nonpoint source pollution. Perennial Stream: A perennial stream has flowing water year-round during a typical year. The water table is located above the stream bed for most of the year. Groundwater is the primary source of water for stream flow. Runoff from rainfall is a supplemental source of water for stream flow. Runoff: Runoff is the water flow that occurs when the soil is infiltrated to full capacity and excess water from rain, meltwater, or other sources flows over the land. This is a major component of the water cycle, and the primary agent in water erosion. In addition to causing water erosion and pollution, surface runoff in urban areas is a primary cause of urban flooding, which can result in property damage, damp and mold in basements, and street flooding. Regional Water Quality Control Board: As a result of the Porter-Cologne Act, nine RWQCBs were established that exercise rulemaking and regulatory activities by basin. Each RWQCB conducts a broad range of activities to protect ground and surface water resources within their respective jurisdictions. Six of the nine RWQCBs have jurisdiction that includes portions of the SCAG region as shown in Figure 3.10-1, Regional Water Quality Control Boards: Region 3—Central Coast RWQCB. The Central Coast RWQCB jurisdiction includes Santa Clara (south of Morgan Hill), San Mateo (southern portion), Santa Cruz, San Benito, Monterey, Kern (small portions), San Luis Obispo, Santa Barbara, Ventura (northern portion) counties. Region 4—Los Angeles RWQCB. The Los Angeles RWQCB jurisdiction includes the coastal watersheds of Los Angeles and Ventura Counties, along with very small portions of Kern and Santa Barbara Counties. Region 6—Lahontan RWQCB. The jurisdiction of the Lahontan RWQCB extends from the Oregon border to the northern Mojave Desert and includes all of California east of the Sierra Nevada crest, including San Bernardino County and northeastern Los Angeles County. Region 7—Colorado River RWQCB. The Colorado River RWQCB jurisdiction includes Imperial, San Bernardino, Riverside, and San Diego counties. Region 8—Santa Ana RWQCB. The Santa Ana RWQCB jurisdiction includes Orange, Riverside, and San Bernardino counties. Region 9—San Diego RWQCB. The San Diego RWQCB includes San Diego, Imperial, and Riverside counties. Seiche: A seiche is an oscillation of a body of water in an enclosed or semienclosed basin, such as a reservoir, harbor, lake, or storage tank. Storm Water Pollution Prevention Plan (SWPPP): A plan created by constructors to show their plans for sediment and erosion control. Typically these plans are part of an overall design that details procedures to be followed during various phases of construction. This is required by a federal regulation of the
Q:\1315\SCAG\ArcProjects\RWQCB.mxd | Date: 10/29/2015
Kern
San Diego
SantaBarbara
NEVADA
ARIZONA
MEXICO
InyoTulare
§̈15
§̈8
Los AngelesVentura
San Bernardino
Riverside
Imperial
Orange
ÄÆ40£¤395
£¤101
£¤101
§̈15
ÄÆ58
§̈10
ÄÆ78
ÄÆ111
ÄÆ86
ÄÆ60ÄÆ91 §̈10
§̈215
§̈15
§̈5
§̈405
ÄÆ71ÄÆ60
§̈10§̈210§̈605
§̈710
§̈110
§̈405
§̈5
ÄÆ14
ÄÆ126
°0 10 205
Miles
Central CoastCentral ValleyColorado RiverLahontan
Los AngelesSan DiegoSanta Ana
FIGURE 3.10-1:Regional WaterQuality Control Boards
Sources: SCAG, ESRI Shaded Relief, TeleAtlas

2016 RTP/SCS 3.10 Hydrology and Water Quality Draft PEIR
3.10-4
United States of America governing stormwater runoff from active construction sites that are more than one acre in area. Total Maximum Daily Loads (TMDL): A TMDL is a calculation of the maximum amount of a pollutant that a water body can receive and still safely meet water quality standards. Tsunami: A tsunami is a great sea wave produced by a significant undersea disturbance. Waters of the United States: Waters of the United States are defined as surface waters such as navigable waters and their tributaries, all interstate waters and their tributaries, natural lakes, all wetlands adjacent to other waters, and all impoundments of these waters. 3.10.1 REGULATORY FRAMEWORK Federal Rivers and Harbors Appropriation Act of 1899, Section 10 Authorization from the USACOE must be obtained for construction of a structure in or over any navigable water of the U.S., pursuant to Section 10 of the Rivers and Harbors Appropriation Act of 1899 (33 U.S. Code [USC] 403). Authorization is also needed for structures built near navigable water if they would affect the course, location, condition, or capacity of the water body, as through re-channelization, disposal of fill, and so forth. Wild and Scenic Rivers Act of 1968 (WSRA) The objective of the WSRA (Public Law 90–542), dated October 2, 1968, is the preservation of certain rivers with outstanding natural, cultural, and recreational values in a free-flowing condition. The WSRA provides permanent protection for some of the country’s most outstanding free flowing rivers and prohibits federal support for actions such as the construction of dams or other harmful instream activities. Clean Water Act of 1972, as amended (CWA) The law was originally enacted as the Federal Water Pollution Control Act (FWPCA; Public Law 92–500) in 1948, but took on its modern form when completely rewritten in 1972 in an act entitled the Federal Water Pollution Control Act Amendments of 1972, now commonly known as the Clean Water Act. Major changes have subsequently been introduced via amendatory legislation including the Clean Water Act of 1977 and the Water Quality Act of 1987. The Clean Water Act (CWA) is the primary federal law in the United States governing water pollution. Its objective is to restore and maintain the chemical, physical, and biological integrity of the nation's waters by preventing point and nonpoint pollution sources, providing assistance to publicly owned treatment works for the improvement of wastewater treatment, and maintaining the integrity of wetlands. It is one of the United States' first and most influential modern environmental laws. As with many other major U.S. federal environmental statutes, it is administered by the U.S. Environmental Protection

2016 RTP/SCS 3.10 Hydrology and Water Quality Draft PEIR
3.10-5
Agency (EPA), in coordination with state governments. Its implementing regulations are codified at 40 C.F.R. Subchapters D, N, and O (Parts 100-140, 401-471, and 501-503). Section 303(d) Section 303(d) of the Federal CWA requires the SWRCB to list impaired water bodies and determine TMDLs of pollutants or other stressors that are contributing excessively to these impaired waters. Section 401 – Water Quality Certification Section 401 establishes the basic structure for regulating discharges of pollutants into the waters of the U.S. and regulating quality standards for surface waters. Under the CWA, the U.S. Environmental Protection Agency (U.S. EPA) has implemented pollution control programs such as setting wastewater standards for industries and surface waters. Section 402 Section 402 establishes the National Pollutant Discharge Elimination System (NPDES) permit process. In California, NPDES permitting authority is delegated to, and administered by the nine RWQCBs. Pursuant to Section 402, a discharge of any pollutant from a point source into navigable waters, are prohibited unless an NPDES permit is obtained. Point sources are discrete conveyances such as pipes or manmade ditches. Individual homes that are connected to a municipal system, use a septic system, or do not have a surface discharge do not need an NPDES permit; however, industrial, municipal, and other facilities must obtain permits if their discharges go directly to surface waters. Section 402(p) establishes that, storm water permits are required for discharges from a municipal separate storm sewer system (MS4) serving a population of 100,000 or more. U.S. EPA defines an MS4 as a conveyance or system of conveyances (including roads with drainage systems, municipal streets, catch basins, curbs, gutters, ditches, man-made channels, or storm drains) owned or operated by a State (40 CFR 122.26(b)(8)). The California Department of Transportation (Caltrans) is responsible for the design, construction, management, and maintenance of the State highway system, including freeways, bridges, tunnels, Caltrans’ facilities, and related properties, and is subject to the permitting requirements of CWA Section 402(p). Caltrans’ discharges consist of storm water and non-storm water discharges from state-owned rights-of-way. Before July 1999, discharges from Caltrans’ MS4 were regulated by individual NPDES permits issued by the RWQCBs. On July 15, 1999, the SWRCB issued a statewide permit (Order No. 99-06-DWQ) that regulated all discharges from Caltrans MS4s, maintenance facilities, and construction activities. On September 19, 2012, Caltrans’ permit was reissued (Order No. 2012-0011-DWQ), and it became effective on July 1, 2013. Caltrans’ Storm Water Management Plan (SWMP) describes the procedures and practices used to reduce or eliminate the discharge of pollutants to storm drainage systems and receiving waters. A revised SWMP must be submitted to the State Water Board for approval by July 1, 2014.

2016 RTP/SCS 3.10 Hydrology and Water Quality Draft PEIR
3.10-6
Section 404 – Discharge of Dredge or Fill Material Section 404 of the federal CWA is administered and enforced by the U.S. Army Corps of Engineers (USACOE). Section 404 of the CWA establishes a program to regulate the discharge of dredged and fill material into waters of the United States, including wetlands. USACOE administers the day-to-day program, including the determination of eligibility of project for use of Categorical Exclusions and Nationwide Permits, and review and consideration of individual permit decisions and jurisdictional determinations. USACOE also develops policy and guidance; and enforces Section 404 provisions. Pollution Prevention Act of 1990 The Pollution Prevention Act (42 USC §13101 et seq.) focused on reducing the amount of pollution through cost-effective changes in production, operation, and raw materials. The Act focuses on source reduction which reduces the release of hazardous substances through practices that increase efficiency in energy, water, or other natural resources. Antidegradation Policy The Antidegradation Policy under U.S. EPA's Water Quality Standards Regulations (48 F.R. 51400, 40 CFR 131.12, November 8, 1983), requires states and tribes to establish a three-tiered antidegradation program to prevent a decrease in water quality standards.
Tier 1—Maintains and protects existing uses and water quality conditions that support such uses. Tier 1 is applicable to all surface waters.
Tier 2—Maintains and protects “high quality” waters where existing conditions are better than necessary to support “fishable/swimmable” waters. Water quality can be lowered in such waters but not to the point at which it would interfere with existing or designed uses.
Tier 3—Maintains and protects water quality in outstanding national resource waters (ONRWs). Water quality cannot be lowered in such waters except for certain temporary changes.
Antidegradation was explicitly incorporated into the federal CWA through 1987 amendments, codified in section 303(d)(4)(B), requiring satisfaction of antidegradation requirements before making certain changes in NPDES permits. Clean Water Rule: Definition of Waters of the United States (WOTUS Rule) On June 29, 2015, the U.S. EPA and USACOE jointly published the final WOTUS Rule (40 CFR Parts 110, 112, 116, et al. and 33 CFR Part 328) for determining the extent to which wetlands and other water features are protected under the CWA. The final rule:

2016 RTP/SCS 3.10 Hydrology and Water Quality Draft PEIR
3.10-7
Clearly defines and protects tributaries that impact the health of downstream waters. The CWA protects navigable waterways and their tributaries. The rule says that a tributary must show physical features of flowing water—a bed, bank, and ordinary high water mark—to warrant protection. The rule provides protection for headwaters that have these features and science shows can have a significant connection to downstream waters.
Provides certainty in how far safeguards extend to nearby waters. The rule protects waters that are next to rivers and lakes and their tributaries because science shows that they impact downstream waters. The rule sets boundaries on covering nearby waters for the first time that are physical and measurable.
Protects the nation’s regional water treasures. Science shows that specific water features can function as part of a system and impact the health of downstream waters. The rule protects prairie potholes, Carolina and Delmarva bays, pocosins, western vernal pools in California, and Texas coastal prairie wetlands when they impact downstream waters.
Focuses on streams, not ditches. The rule limits protection to ditches that are constructed out of streams or function like streams and can carry pollution downstream. So ditches that are not constructed in streams and that flow only when it rains are not covered.
Maintains the status of waters within Municipal Separate Storm Sewer Systems. The rule does not change how those waters are treated and encourages the use of green infrastructure.
Reduces the use of case-specific analysis of waters. Previously, almost any water could be put through a lengthy case-specific analysis, even if it would not be subject to the Clean Water Act. The rule significantly limits the use of case-specific analysis by creating clarity and certainty on protected waters and limiting the number of similarly situated water features.
A CWA permit is only needed if a “water of the United States” is going to be polluted or destroyed. The Clean Water Rule only protects the types of waters that have historically been covered under the CWA. It does not regulate most ditches and does not regulate groundwater, shallow subsurface flows, or tile drains. It does not make changes to current policies on irrigation or water transfers or apply to erosion in a field. The Clean Water Rule addresses the pollution and destruction of waterways—not land use or private property rights. The WOTUS rule protects clean water necessary for farming, ranching, and forestry and provides greater clarity and certainty to farmers about coverage of the CWA. Farms across America depend on clean and reliable water for livestock, crops, and irrigation. The final rule specifically recognizes the vital role that U.S. agriculture serves in providing food, fuel, and fiber at home and around the world. The rule does not create any new permitting requirements for America’s farmers. Activities like planting, harvesting, and moving livestock have long been exempt from CWA regulation, and the Clean Water Rule preserves those exemptions. States opposing the far-reaching impacts of the WOTUS rule have challenged the validity of the rule in 13 states, and the fight has expanded nationwide. Attorney generals from 18 states filed a motion with the 6th Circuit Court of Appeals in Ohio in early September asking the court to place a stay on WOTUS, barring EPA from enforcing it for 50 days. The move came after U.S. District Court-District of North

2016 RTP/SCS 3.10 Hydrology and Water Quality Draft PEIR
3.10-8
Dakota placed a stay on the WOTUS rule in the 13 states under its jurisdiction but, in a separate ruling, refused to expand the injunction nationwide.4 This ruling was appealed and on October 9, 2015, the Sixth Circuit Court of Appeals stayed the WOTUS rule nationwide. It is unclear how long this stay will be in place because as pointed out in the dissenting opinion to this order, if the Sixth Circuit finds it does not have jurisdiction to hear the case, then it also lacks jurisdiction to grant a stay. Executive Order 11988, Flood Plain Management The objective of Presidential Executive Order 11988, dated May 24, 1977, is the avoidance of, to the extent possible, long- and short-term adverse impacts associated with the occupancy and modification of the base floodplain (100-year floodplain) and the avoidance of direct and indirect support of development in the base floodplain wherever there is a practicable alternative. Under the Executive Order, the USACOE must provide leadership and take action to:
Avoid development in the base floodplain unless it is the only practicable alternative Reduce the hazard and risk associated with floods Minimize the impact of floods to human safety, health, and welfare Restore and preserve the natural and beneficial values of the base floodplain
State Porter Cologne Water Quality Control Act The Porter Cologne Water Quality Control Act of 1967 (Cal. Water Code Section 13000 et seq.), requires the SWRCB and the nine RWQCBs to adopt water quality criteria to protect State waters. These criteria include the identification of beneficial uses, narrative to the applicable and numerical water quality standards, and implementation procedures. The Porter-Cologne Water Quality Control Act also authorizes the State Boards to adopt, review, and revise policies for all waters of the state (including both surface and ground waters) and directs the regional boards to develop Basin Plans. The act also authorizes State Boards to adopt Water Quality Control Plans. In the event of inconsistencies among state and regional board plans, the more stringent provisions apply. Lake or Streambed Alteration The California Department of Fish and Wildlife (CDFW) is responsible for conserving, protecting, and managing California's fish, wildlife, and native plant resources. To meet this responsibility, Section 1600 of the California Fish and Game Code requires an entity to notify CDFW of any proposed activity that may substantially modify a river, stream, or lake. Notification is required by any person, business, state, or local government agency or public utility that proposes an activity that will:
4 Cohen, Bonner R. 13 October 2015. Judicial Wrangling Over WOTUS Rule Continues. Available at:
http://news.heartland.org/newspaper-article/2015/10/13/judicial-wrangling-over-wotus-rule-continues.

2016 RTP/SCS 3.10 Hydrology and Water Quality Draft PEIR
3.10-9
Substantially divert or obstruct the natural flow of any river, stream or lake; Substantially change or use any material from the bed, channel, or bank of, any river,
stream, or lake; or Deposit or dispose of debris, waste, or other material containing crumbled, flaked, or
ground pavement where it may pass into any river, stream, or lake. The notification requirement applies to any work undertaken in or near a river, stream, or lake that flows at least intermittently through a bed or channel. This includes ephemeral streams, desert washes, and watercourses with a subsurface flow. It may also apply to work undertaken within the flood plain of a body of water. If CDFW determines that the activity may substantially adversely affect fish and wildlife resources, a Lake or Streambed Alteration Agreement will be prepared. In August 2005, the California Fish and Game Commission policy regarding wetlands resources stated that “it is the policy of the Fish and Game Commission to seek to provide for the protection, preservation, restoration, enhancement and expansion of wetland habitat in California” and to “strongly discourage development in or conversion of wetlands.”5 As a result, although the Commission has no independent statutory permitting authority related to wetlands, the policy underscores that the Commission does not support wetland development proposals unless “project mitigation assures there will be ‘no net loss’ of either wetland habitat values or acreage” and “prefers mitigation which would achieve expansion of wetland acreage and enhancement of wetland habitat values.” The Agreement includes reasonable conditions necessary to protect those resources and must comply with CEQA. The entity may proceed with the activity in accordance with the final Agreement. Sustainable Groundwater Management Act (SGMA) On September 16, 2014 Governor Edmund G. Brown Jr. signed a three-bill package known as the Sustainable Groundwater Management Act. The legislation allows local agencies to customize groundwater sustainability plans to their regional economic and environmental needs. SGMA creates a framework for sustainable, local groundwater management for the first time in California history. The three bills that make up SGMA are Assembly Bill (AB) 1739 by Assembly Member Roger Dickinson, Senate Bill (SB) 1319, and SB 1168 by Senator Fran Pavley. In September 2015, Governor Brown signed SB 13, by Senator Fran Pavley. The Bill makes various technical, clarifying changes to SGMA including requirements for groundwater sustainability agency formation, the process for State Water Board intervention if no responsible agency is specified for a basin, guidelines for high- and medium-priority basins, and participation of mutual water companies in a groundwater sustainability agency. California Ocean Plan The California Ocean Plan establishes water quality objectives for California’s ocean waters and provides the basis for regulation of wastes discharged into the state’s coastal waters. The plan applies to point and nonpoint source discharges. Both the SWRCB and the six coastal RWQCBs implement and interpret the California Ocean Plan. The California Ocean Plan identifies the applicable beneficial uses of marine
5 California Fish and Game Commission. Accessed 14 September 2015. Miscellaneous Policies: Wetlands Resources. Available
at: http://www.fgc.ca.gov/policy/p4misc.aspx#WETLANDS

2016 RTP/SCS 3.10 Hydrology and Water Quality Draft PEIR
3.10-10
waters. These beneficial uses include preservation and enhancement of designated Areas of Special Biological Significance (ASBS), rare and endangered species, marine habitat, fish migration, fish spawning, shellfish harvesting, recreation, commercial and sport fishing, mariculture, industrial water supply, aesthetic enjoyment, and navigation. The California Ocean Plan establishes a set of narrative and numerical water quality objectives to protect beneficial uses. These objectives are based on bacterial, physical, chemical, and biological characteristics as well as radioactivity. The water quality objectives in Table 1 (formerly Table B) of the California Ocean Plan apply to all receiving waters under the jurisdiction of the plan and are established for the protection of aquatic life and for the protection of human health from both carcinogens and noncarcinogens. Within Table 1 there are 21 objectives for protecting aquatic life, 20 for protecting human health from noncarcinogens, and 42 for protecting human health from exposure to carcinogens. The Ocean Plan also includes an implementation program for achieving water quality objectives. Effluent limitations are established for the protection of marine waters.
Regional Water Quality Control Plan for the Central Coastal Basin The Water Quality Control Plan for the Central Coastal Basin, or Basin Plan, identifies how the quality of the surface and ground waters in the Central Coast Region should be managed to provide the highest water quality reasonably possible. This Basin Plan lists the various water uses (Beneficial Uses, Chapter Two). Second, it describes the water quality which must be maintained to allow those uses (Water Quality Objectives, Chapter Three). Chapter Four, the Implementation Plan, then describes the programs, projects, and other actions which are necessary to achieve the standards established in this plan. Chapter Five, Plans and Policies, summarizes SWRCB and RWQCB plans and policies to protect water quality. Chapter Six describes statewide surveillance and monitoring programs as well as regional surveillance and monitoring programs. The Regional Board implements the Basin Plan by issuing and enforcing waste discharge requirements to individuals, communities, or businesses whose waste discharges can affect water quality. These requirements can be either State Waste Discharge Requirements for discharges to land, or federally delegated NPDES permits for discharges to surface water. Methods of treatment are not specified. When such discharges are managed so that: (1) they meet these requirements, (2) water quality objectives are met, and (3) beneficial uses are protected and water quality is controlled. The Basin Plan is also implemented by encouraging water users to improve the quality of their water supplies, particularly where the wastewater they discharge is likely to be reused. Public works or other projects which can affect water quality are reviewed and their impacts identified. Proposals which implement or help achieve the goals of the Basin Plan are supported; the Regional Board makes water quality control recommendations for other projects. Water Quality Control Plan for the Los Angeles Region The RWQCB has prepared a Water Quality Control Plan for the Los Angeles Region (Basin Plan), which encompasses all coastal drainages flowing to the Pacific Ocean between Rincon Point (on the coast of western Ventura County) and the eastern Los Angeles County line, as well as the drainages of five coastal islands (Anacapa, San Nicolas, Santa Barbara, Santa Catalina, and San Clemente). In addition, the Los Angeles region includes all coastal waters within three miles of the continental and island coastlines. As the eastern boundary, formed by the Los Angeles County line, departs somewhat from the hydrologic

2016 RTP/SCS 3.10 Hydrology and Water Quality Draft PEIR
3.10-11
divide, the Los Angeles and Santa Ana regions share jurisdiction over watersheds along their common border. The first essentially complete Basin Plan, which was established under the requirements of California’s 1969 Porter-Cologne Water Quality Control Act (Section 13000 [Water Quality] et seq. of the California Water Code), was adopted in 1975 and revised in 1984. The latest version was adopted in 1994. The Basin Plan assigned beneficial uses to surface and groundwater such as municipal water supply and water-contact recreation to all waters in the basin. It also set water quality objectives, subject to approval by the EPA, intended to protect designated beneficial uses. These objectives apply to specific parameters (numeric objectives) and general characteristics of the water body (narrative objectives). An example of a narrative objective is the requirement that all waters must remain free of toxic substances in concentrations producing detrimental effects upon aquatic organisms. Numeric objectives specify concentrations of pollutants that are not to be exceeded in ambient waters of the basin. The Los Angeles RWQCB is involved is the regulation of a number of activities that are relevant to the consideration of the Project:
Prepares, monitors compliance with, and enforces Waste Discharge Requirements, including NPDES permits;
Implements and enforces local stormwater control efforts; Enforces water quality laws, regulations, and waste discharge requirements; and General Construction Activity Stormwater Discharges
Stormwater discharges that are composed entirely of runoff from qualifying construction activities may require regulation under the General Construction Activity Storm Water Permit issued by the SWRCB. Construction activities that qualify include clearing, grading, excavation, reconstruction, and dredge-and-fill activities that result in the disturbance of at least one acre and less than five acres of total land area. The evaluation of the Project does not generate the need for compliance with the Construction General Permit. The development of single family residences would require to obtain permits coverage if the development disturbs greater than one acre of land. Additionally the Project would requires the consideration of a Standard Urban Stormwater Management Plan (SUSMP) as part of compliance with the NPDES General Construction Activity Storm Water Permit to reduce water quality impacts to the maximum extent practicable. A SUSMP is a report that includes one or more site maps, an identification of construction activities that could cause pollutants to enter the stormwater, and a description of measures or best management practices (BMPs) to control these pollutants to the maximum extent practicable. Water Control Plan for the Lahontan Region This Basin Plan for the Lahontan Region is the basis for the Regional Board's regulatory program. It sets forth water quality standards for the surface and ground waters of the Region, which include both designated beneficial uses of water and the narrative and numerical objectives which must be maintained or attained to protect those uses. It identifies general types of water quality problems, which can threaten beneficial uses in the Region. It then identifies required or recommended control measures for these problems. The Plan also summarizes past and present water quality monitoring programs, and identifies monitoring activities, which should be carried out to provide the basis for future Basin Plan updates and for waste discharge requirements or conditional waivers.

2016 RTP/SCS 3.10 Hydrology and Water Quality Draft PEIR
3.10-12
Additionally the Lahontan Region Basin Plan implements a number of state and federal laws, the most important of which are the federal CWA and the State Porter-Cologne Water Quality Control Act. Other pertinent federal laws include the Safe Drinking Water Act, Toxic Substances Control Act, Resource Conservation and Recovery Act, and Endangered Species Act, and the Comprehensive Response, Compensation, and Liability Act (CERCLA or “Superfund”) and Superfund Amendment and Reauthorization Act (SARA). Other applicable California laws include the Health and Safety, Fish and Game, and Food and Agriculture Codes. Water Control Plan for the Colorado River Basin The intent of the Basin Plan is to provide definitive guidelines and give direction to the full scope of Regional Board activities that serve to optimize the beneficial uses of the state waters within the Colorado River Basin Region of California by preserving and protecting the quality of these waters. Water uses and water benefits vary. Water quality is an important factor in determining use and benefit. For example, drinking water has to be of higher quality than the water used to irrigate pastures. Both of these are beneficial water uses, but the quality requirements for irrigation water are different from those for drinking water. The Basin Plan recognizes the variations of water quality and water uses. The Basin Plan lists and defines the various beneficial water uses (Chapter 2). It describes the water quality which must be maintained to support such uses (Water Quality Objectives, Chapter 3). The section on implementation (Chapter 4) describes the programs, projects and other actions that are necessary to achieve the standards established in this Plan. Plans, Policies and Issues (Chapter 5), summarize the various plans and policies which protect water quality. This chapter also describes water quality issues which require special attention. Surveillance and Monitoring (Chapter 6), describes activities within the Colorado River Basin Region related to surveillance, monitoring, assessment, lab support, and quality assurance and quality control. Water Quality Control Plan (Basin Plan) for the Santa Ana River Basin The Basin Plan establishes water quality standards for the ground and surface waters of the region. The term “water quality standards,” as used in the federal CWA, includes both the beneficial uses of specific waterbodies and the levels of quality that must be met and maintained to protect those uses. The Basin Plan includes an implementation plan describing the actions by the Regional Board and others that are necessary to achieve and maintain the water quality standards. The Regional Board regulates waste discharges to minimize and control their effects on the quality of the region’s ground and surface water. Permits are issued under a number of programs and authorities. The terms and conditions of these discharge permits are enforced through a variety of technical, administrative, and legal means. Water quality problems in the region are listed in the Basin Plan, along with the causes, where they are known. For waterbodies with quality below the levels necessary to allow all the beneficial uses of the water to be met, plans for improving water quality are included. The Water Quality Control Plan for the San Diego Basin The San Diego Regional Board's Basin Plan is designed to preserve and enhance water quality and protect the beneficial uses of all regional waters. Specifically, the Basin Plan: (1) designates beneficial uses for surface and ground waters, (2) sets narrative and numerical objectives that must be attained or maintained to protect the designated beneficial uses and conform to the state’s antidegradation policy, (3) describes implementation programs to protect the beneficial uses of all waters in the Region, and (4)

2016 RTP/SCS 3.10 Hydrology and Water Quality Draft PEIR
3.10-13
describes surveillance and monitoring activities to evaluate the effectiveness of the Basin Plan (California Water Code sections 13240–13244, section 13050(j)). Additionally, the Basin Plan incorporates by reference all applicable State and Regional Board plans and policies. Local County of Los Angeles General Plan As part of the Conservation and Natural Resources Element of the 2040 General Plan Update, the Board of Supervisors of the County of Los Angeles has adopted three goals for water quality initiatives related to hydrology and water quality and two goals related to watershed and river master plans: Water Quality Initiatives
Support multi-benefit outcomes, such as water quality benefits arising from ecosystem restoration efforts, and identify, attract, and create funds and resources to implement this initiative.
Participate in Enhanced Watershed Management Programs and Watershed Management Programs in coordination with other agencies throughout Los Angeles County.
Participate in Coordinated Integrated Watershed Monitoring Plans in coordination with other agencies throughout Los Angeles County.
Watershed and Rivers Master Plans
Participate with stakeholders in the preparation of Watershed Management Plans in response to the NPDES Municipal Separate Storm Sewer Systems (MS4) Permit by promoting multi-benefit outcomes, including, but not limited to new public access to natural resources, new recreational opportunities, enhanced aquatic habitats, and restored natural features, where appropriate, while maintaining necessary levels of flood protection.
Identify, attract, and create funds and resources to implement these plans. County of Riverside General Plan The County of Riverside General Plan specifically addresses hydrology and water quality in relate to four categories: water resources, water quality (including groundwater quality), floodplain management, and wetlands. Water Resources The General Plan acknowledges that contamination from natural or manufactured sources has reduced groundwater quality such that its use requires treatment. Management of the amount of water available (local and imported) and its quality, is identified as an important response to the gap between supply and demand in Riverside County. The General plan provides policies that seek to protect and

2016 RTP/SCS 3.10 Hydrology and Water Quality Draft PEIR
3.10-14
enhance the water resources in the county. These policies address broad water planning issues, and the relationship of land use decisions to water issues. Water Quality The General Plan recognizes the BMPs established by the three applicable RWQCBs, Regions 7, 8, and 9 to provide state-level water quality policy and the NPDES as effective means of managing water quality problems that have occurred in Riverside County. Such problems have related to inadequate subsurface sewage disposal, waste disposal management of the Santa Ana River, agriculturally related problems such as citricultural runoff in the western county and increasing salinity of the desert groundwater basins, sediment buildup of water bodies from construction-related erosion, lake water quality problems, and pollution due to urban stormwater system runoff. Floodplain and Riparian Area Management The intent of the county is to sustain living riparian habitats to the maximum extent possible. Wetlands The General Plan provides specific policies for the protection of wetlands including the requirement to ensure compliance with the Section 404 of the federal CWA in terms of wetlands mitigation policies and policies concerning fill material in jurisdictional wetlands during development review and approval process; preservation of buffer zones around wetlands where feasible and biologically appropriate; and consideration of wetlands for use as natural water treatment areas that will result in improvement of water quality. San Bernardino County General Plan San Bernardino County has established goal and policies to ensure coordination and cooperation with governmental agencies at all levels to ensure safe, reliable, and high-quality water supply for all residents and ensure prevention of surface and ground water pollution. The County General Plan provides specific policies for adherence to federal and state water quality standards for surface and groundwater and wastewater discharge requirements in the review of development proposals that relate to type, location and size of the Project to safeguard public health. Similarly, the County General Plan specifies the need to work with the RWQCBs to establish uniform criteria for appropriate sewering options for new development. The County General Plan further directs cooperation with State, regional, and responsible authorities to expand water sampling programs to determine ambient groundwater quality conditions affecting public, agricultural, and private wells. Identify the sources, extent, and types of organic and inorganic groundwater contaminants, and evaluation of their impacts on groundwater resources. The County General Plan calls for the prevention of surface and groundwater pollution through continued cleanup of contaminated waters and watersheds.

2016 RTP/SCS 3.10 Hydrology and Water Quality Draft PEIR
3.10-15
Imperial County General Plan Protection of Surface Waters The Imperial County General Plan provides specific goals and policies related to maintaining the viability of the Salton Sea and other surface water resources in the county.
Goal 2: Long-term viability of the Salton Sea, Colorado River, and other surface waters in the County will be protected for sustaining wildlife and a broad range of ecological communities. o Objective 2.1: The continued viability of the agricultural sector as an important
source of surface water for the maintenance of valuable wildlife and recreational resources in the County.
o Objective 2.2: A balanced ecology associated with the riparian and ruderal biological communities important as breeding and foraging habitats for native and migratory birds and animals occurring within the County.
o Objective 2.3: Preservation of riparian and ruderal habitats as important biological filters as breeding and foraging habitats for native and migratory birds and animals.
Orange County General Plan In the Orange County region, the protection of water quality is a major concern. The need to maintain safe water quality may constrain the development of energy resources, from methane (landfills) and geothermal sources. At a minimum, water quality concerns will need to be considered during the process of developing these resources and water intensive resources such as agriculture. Development of land and the increase in population density has also created new sources of non-stormwater discharges and pollutants in stormwater discharges. The San Diego and Santa Ana RWQCBs require that water quality and watershed protection principles are considered as part of land use planning and development review. Ventura County General Plan The Ventura County General Plan provides specific goals and policies related to the inventory and monitoring of water quantity and quality to facilitate effective management of the resources. The Ventura County General Plan has identified 10 specific programs to support achievement of the goals and policies. The programs includes support of the Seawater Intrusion Abatement Project, enforcement of Chapter 70 (Excavation and Grading) of the Uniform Building Code, as incorporated by reference in and amended by the Ventura County Building Code, to ensure that any proposed grading in a waterway or wetland is adequately investigated and that any development incorporates appropriate design provisions to protect waterways or wetlands; support the Fox Canyon Groundwater Management Agency Plan for both the Upper and Lower Aquifer Systems; continued coordination with water districts and other appropriate agencies to establish a data base on actual available supply, projected use factors for types of land use and development, and threshold limits for development within available water resources; Planning Division will continue to promotion of the efficient use of water through the Landscape Design Criteria Program; cooperation between the Public Works Agency and the

2016 RTP/SCS 3.10 Hydrology and Water Quality Draft PEIR
3.10-16
Environmental Health Division, to pursue the use of reclaimed water for agricultural irrigation; continued monitoring, inspection and regulation of underground storage tanks; identification of waste disposal sites and seek to mitigate impacts to water resources; and consideration of the Board of Supervisors of a Countywide water conservation retrofit program to fund the installation of water conservation fixtures) for businesses and residents located within Ventura County. City General Plan and Ordinances In accordance with Sections 653(c) of the California Government Code, all cities are required to have a conservation element as part of their General Plans. The conservation element provides goals and polices related to conservation, development, and utilization of natural resources including water and its hydraulic force, forests, soils, rivers and other waters, harbors, fisheries, wildlife, minerals, and other natural resources. One of the six required aspects of the open space element is for planning, conservation and management of open space for the preservation of natural resources, including habitat for fish and wildlife species; areas required for ecologic and other scientific study purposes; rivers, streams, bays and estuaries; and coastal beaches, lakeshores, banks of rivers and streams, and watershed lands. In addition, many of the cities have ordinances related to protection, conservation and management of natural water resources consistent with the applicable beneficial uses stipulated in the applicable RWQCB Water Basin Plan. 3.10.2 EXISTING CONDITIONS Hydrology This section describes the general water resources of the region, including surface hydrology, watersheds and hydrological characteristics, flood hazards and control, seiche, tsunami, and mudflow. Groundwater and stormwater qualities are discussed in the utilities section. The SCAG region is divided into four hydrologic regions regulated by five RWQCBs that provide oversight of the hydrologic and water quality conditions. The five RWQCBs with jurisdictions on the SCAG region are Los Angeles, Lahontan, Colorado River Basin, San Diego, and Santa Ana. Each major river basin within the SCAG region has a Water Quality Control Plan that designates the beneficial uses for water bodies in the region. Surface Hydrology In addition to the Pacific Ocean that borders the western margin, the SCAG region includes a diverse array of surface water resources including rivers, lakes and reservoirs, and coastal waters (Table 3.10.2-1, Major Surface Water Resources in the SCAG Region).

2016 RTP/SCS 3.10 Hydrology and Water Quality Draft PEIR
3.10-17
TABLE 3.10.2-1
MAJOR SURFACE WATER RESOURCES IN THE SCAG REGION
LOS ANGELES BASIN (REGION 4)Ventura River Estuary Sespe Creek Lake CasitasSanta Clara River Estuary Piru Creek Lake PiruMcGrath Lake Ventura River Pyramid LakeOrmond Beach Wetlands Santa Clara River Castaic LakeMugu Lagoon Los Angeles River Bouquet ReservoirTrancas Lagoon Big Tahunga Canyon Los Angeles ReservoirTopanga Lagoon San Gabriel River Chatsworth ReservoirLos Cerritos Wetlands Sepulveda Reservoir Ballona Lagoon Hansen ReservoirLos Angeles River San Gabriel ReservoirBallona Wetlands Morris ReservoirWhittier Narrows Reservoir Santa Fe Reservoir LAHONTAN BASIN (REGION 6)Mojave River Silver Lake Amargosa River Silverwood LakeMojave River Reservoir Lake Arrowhead Soda Lake COLORADO RIVER BASIN (REGION 7)Colorado River Lake Havasu Whitewater River Gene Wash ReservoirAlamo River Copper Basin ReservoirNew River Salton Sea Lake Cahulla SANTA ANA (REGION 8) Hellman Ranch Wetlands Santa Ana River Prado ReservoirAnaheim Bay San Jacino River Big Bear LakEBolsa Chica Wetlands Lake Perris Huntington Wetlands Lake MatthewsSanta Ana River Lake ElsinoreLaguna Lakes Vail Lake San Juan Creek Lake Skinner Upper Newport Bay Lake HemetSan Joaquin Marsh Prado Wetlands SAN DIEGO BASIN (REGION 9)Santa Margarita River Vail LakeAliso Creek Skinner Reservoir SOURCE: U.S. Department of the Interior and U.S. Geological Survey. September 15, 2015. Water Resources of the United States. Available at: http://www.usgs.gov/water/index.html

2016 RTP/SCS 3.10 Hydrology and Water Quality Draft PEIR
3.10-18
Rivers Because the climate of Southern California is predominantly arid, many of the natural rivers and creeks are intermittent or ephemeral, drying up in the summer or flowing only after periods of precipitation. For example, annual rainfall amounts vary depending on elevation and proximity to the coast. Some waterways such as Ballona Creek and the Los Angeles River, maintain a perennial flow due to agricultural irrigation and urban landscape watering. Major natural streams and rivers in the SCAG region include the Ventura River, Santa Clara River, Los Angeles River, San Gabriel River, Santa Ana River, San Jacinto River, and upstream portions of the Santa Margarita River. The Ventura River is fed by Lake Casitas on the western border of Ventura County and empties out into the ocean. It is the northernmost river system in Southern California, supporting a large number of sensitive aquatic species. Water quality decreases in the lower reaches due to urban and industrial impacts. The Santa Clara River flows through the center of Ventura County and remains in a relatively natural state. Threats to water quality include increasing development in floodplain areas, flood control measures such as channeling, erosion, and loss of habitat. The Los Angeles River is a highly disturbed system due to the flood control features along much of its length. Due to the high urbanization in the area around the Los Angeles River, runoff from industrial and commercial sources as well as illegal dumping contribute to reduce the channel’s water quality. The San Gabriel River is similarly altered with concrete flood control embankments and impacted by urban runoff. The Santa Ana River drains the San Bernardino Mountains, cuts through the Santa Ana Mountains, and flows onto the Orange County coastal plain. Recent flood control projects along the river have established reinforced embankments for much of the river’s path through urbanized Orange County. The Santa Margarita River begins in Riverside County, draining portions of the San Jacinto Mountains and flowing to the ocean through northern San Diego County. Complete lists of surface water resources within the SCAG region, along with the beneficial uses associated with them, are contained in each of the five Basin Plans. Lakes and Reservoirs Since Southern California is a semiarid region, many of its lakes are drinking water reservoirs, created either through damming of rivers, or manually dug and constructed. Reservoirs also serve as flood control for downstream communities. Some of the most significant lakes, including reservoirs, in the SCAG region are Big Bear Lake, Lake Arrowhead, Lake Casitas, Castaic Lake, Pyramid Lake, Lake Elsinore, Diamond Valley Lake, and the Salton Sea. Big Bear Lake is a reservoir in San Bernardino County, in the San Bernardino Mountains. It was created by a granite dam in 1884, which was expanded in 1912, and holds back approximately 73,000 acre-feet of water. The lake has no tributary inflow, and is replenished entirely by snowmelt. It provides water for the community of Big Bear, as well as nearby communities. Lake Arrowhead is also in San Bernardino County, at the center of an unincorporated community also called Lake Arrowhead. The lake is a man-made reservoir, with a capacity of approximately 48,000 acre-feet. In 1922, the dam at Lake Arrowhead was completed, with the intention of turning the area into a resort for wealthy Angelinos. It is now used for recreation and as a potable water source for the surrounding community. Lake Casitas is in Ventura County, and was formed by the Casitas Dam on the Coyote Creek just before it joins the Ventura River. The dam, completed in 1959, holds back nearly 255,000 acre-feet of water. The water is used for recreation, as well as drinking water and irrigation. Castaic Lake is on the Castaic Creek, and was formed by the completion of the Castaic Dam. The lake is in northwestern Los Angeles County. It is the terminus of the West Branch of the California Aqueduct, and holds over 323,000 acre-feet of water. Much of the water is distributed throughout northern Los
2016 RTP/SCS 3.10 Hydrology and Water Quality Draft PEIR
3.10-19
Angeles County, though some is released into Castaic Lagoon, which feeds Castaic Creek. The creek is a tributary of the Santa Clara River. Pyramid Lake is just above Castaic Lake, and water flows from Pyramid into Castaic through a pipeline, generating electricity during the day. At night, when electricity demand and prices are low, water is pumped back up into Pyramid Lake. Pyramid Lake is on Piru Creek, and holds 180,000 acre-feet of water. Lake Elsinore is in the City of Lake Elsinore, in Riverside County. The lake has dried and up and been replenished throughout the last century, it is now managed to maintain a consistent water level, with outflow piped into the Temescal Canyon Wash. Diamond Valley Lake is Southern California’s newest and largest reservoir. Located in Riverside County, it was a project of the Metropolitan Water District (MWD) to expand surface storage capacity in the region. A total of three dams were required to create the lake. Completed in 1999, it was full by 2002, holding 800,000 acre-feet of water, effectively doubling MWD’s surface water stores in the region. The lake is connected to the existing water infrastructure of the SWP. The lake is situated at approximately 1,500 feet above sea level, well above most of the users of the lake’s water; this enables the lake to also provide hydroelectric power, as water flows through the lowest dam. The Salton Sea is California’s largest lake, nearly 400 square miles in size. The basin is over 200 feet below sea level, and has flooded and evaporated many times over, when the Colorado overtops its banks during extreme flood years. This cycle of flooding and evaporation has re-created the Sea several times over at least the last thousand years. Its most recent formation occurred in 1905 after an irrigation canal was breached and the Colorado River flowed into the basin for 18 months, creating the current lake. The principal inflow to the Sea is from agricultural drainage, which is high in dissolved salts; approximately 4 million tons of dissolved salts flow into the Sea every year. The evaporation of the Sea’s water, plus the addition of highly saline water from agriculture, has created one of the saltiest bodies of water in the world. The Sea has been a highly successful fishery and is a habitat and migratory stopping and breeding area for 380 different bird species; however, the high, and ever-increasing, salinity of the Sea is a continual challenge for the fish and birds that inhabit it. The 2001 agriculture-to-urban water transfer agreement between the Imperial Valley Irrigation District and San Diego will have significant implications for the Salton Sea, and the watershed. The reduction in agricultural water flowing into the Sea will significantly lower water levels, shrinking the overall size of the Sea. Coastal Waters Coastal waters in the SCAG region include bays, harbors, estuaries, beaches, and open ocean. Santa Monica Bay dominates a large portion of the Region's open coastal waters. Deep-draft commercial harbors include the Los Angeles/Long Beach Harbor complex and Port Hueneme. Shallower, small-craft harbors, such as Marina del Rey, King Harbor and Ventura Marina, occur at a number of locations. Important estuaries are represented by coastal lagoons such as Mugu Lagoon and numerous small coastal wetlands such as Ballona Wetlands and Los Cerritos Wetlands. Recreational beaches occur along large stretches of the coastal waters. These coastal waters are impacted by a variety of activities, including:
Municipal and industrial wastewater discharges Cooling water discharges Non-point source runoff (urban and agricultural runoff in particular), including leaking
septic systems, construction, and recreational activities Oil spills Aqueduct vessel wastes

2016 RTP/SCS 3.10 Hydrology and Water Quality Draft PEIR
3.10-20
Dredging, increased development, and loss of habitat Offshore operations, illegal dumping Natural oil seeps
Hydrologic Regions The Department of Water Resources (DWR) has divided the state into 10 hydrologic regions, corresponding to the State’s major water drainage basins. Four of these are, in whole or in part, within the SCAG region: Central Coast (part of Ventura County), South Lahontan (parts of Los Angeles and San Bernardino counties), South Coast (Orange County, along with parts of Los Angeles, Ventura, San Bernardino, and Riverside counties), and Colorado River (parts of Imperial, Riverside, and San Bernardino counties). These four regions are described below. Central Coast Hydrologic Region The Central Coast Hydrologic Region is located, as its name implies, along the central coast of California, extending from Southern San Mateo County in the north to Santa Barbara in the south and from the Pacific Ocean in the west to the edge of the Central Valley in the east. It includes all of Santa Cruz, Monterey, San Luis Obispo, and Santa Barbara Counties and parts of San Benito, San Mateo, Santa Clara, and Ventura Counties. The most significant geological features are the Coast Range and the Santa Barbara Coastal Plain. The Coastal Branch California Aqueduct—part of the State Water Project (SWP)—brings approximately 32,000 acre-feet of water annually into Southern California through the Central Coast Region. This hydrologic region currently uses more water resources than it gains throughout the year. Groundwater is the major source of water in the region, which experiences annual reductions in its groundwater storage. The region, therefore, battles the threat of saltwater intrusion into its aquifers, a problem documented as far back as the 1930s. South Lahontan Hydrologic Region The South Lahontan Hydrologic Region is located in the southeast portion of California and is characterized by desert, sand dunes, and dry lakes. The northern half of the region includes Mono Lake, Owens Valley, Panamint Valley, Death Valley, and the Amargosa River Valley. The Mojave Desert occupies the southern half of the hydrologic region, and is characterized by many small mountain ranges and valleys with playas, or dry lakes. The southern half falls within the SCAG region in San Bernardino and Los Angeles Counties. The Los Angeles Aqueduct is the region’s major water development feature. The initial 223-mile-long aqueduct was completed by the Los Angeles Department of Water and Power (LADWP) and began diverting water from Owens Valley into the City of Los Angeles. The aqueduct was extended 115 miles in 1940 and 137-miles in 1970. The Los Angeles Aqueduct system passes through 12 hydropower plants on its way to Los Angeles. The annual energy generated is more than 1 billion kilowatt-hours (enough to supply the energy demand of approximately 220,000 homes). Five water agencies in the southwest portion of this region have contracts with the SWP for a total of about 220,000 acre-feet of surface water annually. The East Branch of the SWP is used to recharge groundwater in the Mojave River Valley. Mojave Water Agency (MWA) relies predominantly from groundwater. It also receives water as one of the 29 SWP contractors, per their integrated Regional Water Management Plan update (IRWMP). The Antelope Valley East Kern Water Agency (AVEK) provides water to five major municipal agencies and 16 smaller water service agencies. Palmdale Water District (PWD) and Little Rock Irrigation District (LRID) Littlerock Reservoir has 2,700 acre-feet capacity

2016 RTP/SCS 3.10 Hydrology and Water Quality Draft PEIR
3.10-21
and provides water to LRID. Water from Littlerock Reservoir is released into PWD's Lake Palmdale (a 42,000 acre-foot lake reservoir). Arrowhead Lake Association Lake Arrowhead, owned by Arrowhead Lake Association is a 48,000 acre-foot reservoir providing recreational opportunities and water to Arrowhead Woods property owners. South Coast Hydrologic Region The South Coast Hydrologic Region comprises the southwest portion of the State and is California’s most urbanized and populous region. The topography includes a series of nearly flat coastal plains and valleys, broad interior valleys, and several mountains of low and moderate elevation. The region extends from the Santa Barbara–Ventura County line south to San Diego and the U.S. international border with Mexico. Most of this area is within the SCAG region, including portions of Ventura, Orange, Los Angeles, San Bernardino, and Riverside Counties. Several prominent rivers exist within the region including Ventura River, Santa Clara River, Los Angeles River, San Gabriel River, Santa Ana River, San Jacinto Rivers, and Santa Margarita River. Colorado River Hydrologic Region The Colorado River Hydrologic Region covers the southeast portion of California and contains 12 percent of the state’s land area. The Colorado River, the main tributary of this hydrologic region, forms most of the region’s eastern boundary and international boundary with Mexico. The region includes all of Imperial County, the eastern two-thirds of Riverside County, the southeastern one-third of San Bernardino County, and about one-fourth of San Diego County. It has a variety of arid desert terrain that includes many bowl-shaped valleys, broad alluvial fans, sandy washes, and hills and mountains. Watersheds The SCAG region is bounded peripherally by a drainage divide and features leading to bodies of water. The boundary that separates neighboring drainage basins from another is called a watershed boundary. The area that separates one boundary from another is a watershed, an area with land or basin in which all waterways drain to one specific outlet, or body of water, such as a river, lake, ocean, or wetland. Watersheds have topographical divisions such as ridges, hills, or mountains. All precipitation that falls in a given watershed, or basin, eventually drains into the same body of water. The SCAG region has over 30 watersheds as shown on Figure 3.10.2-1, Watersheds in the SCAG Region. Over 20 of these watersheds are major watersheds within the SCAG region, all of which are outlined and shaped by the various topographic features of the region. Given the physiographic characteristics of the SCAG region, most of the watersheds are located along the Transverse and Peninsular Ranges, and only a small number are in the desert areas (Mojave and Colorado Desert). Antelope-Fremont Valleys Watershed (HUC 18090206) The Antelope-Fremont Valley Watershed straddles Kern and Los Angeles County, and is bordered on the southwest by the San Gabriel Mountains, on the northwest by the Tehachapi Mountains, and on the east by a series of hills and buttes that follow the San Bernardino County line. Numerous streams originate in the mountains and foothills surrounding the valley and flow across the valley floor before eventually pooling in the dry lakes adjacent to the county line. It is located in the South Lahontan

Q:\1315\SCAG\ArcProjects\2Watersheds.mxd | Date: 10/29/2015
Mojave
SouthernMojave
DeathValley-Lower
Amargosa
Antelope-FremontValleys
Coyote-CuddebackLakes
UpperAmargosa
IndianWells-Searles
Valleys PanamintValley
PiuteWash
Havasu-MohaveLakes
Ivanpah-PahrumpValleys
SantaMargarita
Aliso-SanOnofre
SealBeachSan Pedro
ChannelIslands
SanJacinto
ImperialReservoir
LowerColorado
CarrizoCreek
SanFelipeCreek
SaltonSea
WhitewaterRiver
Cuyama
SantaMonica Bay
Santa BarbaraChannel Islands
Los Angeles
SanGabriel
SanGabriel
SantaAna
SantaAna
VenturaSantaClara
Santa Clara
Kern
San Diego
SantaBarbara
NEVADA
ARIZONA
MEXICO
InyoTulare
§̈15
§̈8
Los AngelesVentura
San Bernardino
Riverside
Imperial
Orange
ÄÆ40£¤395
£¤101
£¤101
§̈15
ÄÆ58
§̈10
ÄÆ78
ÄÆ111
ÄÆ86
ÄÆ60ÄÆ91 §̈10
§̈215
§̈15
§̈5
§̈405
ÄÆ71ÄÆ60
§̈10§̈210§̈605
§̈710
§̈110
§̈405
§̈5
ÄÆ14
ÄÆ126
°0 10 205
Miles
Watershed
FIGURE 3.10.2-1:Watersheds in theSCAG Region
Sources: SCAG, ESRI Shaded Relief, TeleAtlas, USGS
2016 RTP/SCS 3.10 Hydrology and Water Quality Draft PEIR
3.10-22
Hydrologic region. The watershed drains a total of 12,000 square miles within Los Angeles County. Three of the major tributaries are Big Rock Creek and Little Rock Creek that run from the San Gabriel Mountains and Oak Creek that runs from the Tehachapi Mountains. The Los Angeles Aqueduct also runs 180 miles through the watershed. Reservoirs include the California Aqueduct, Fairmont Reservoir, and Littlerock Reservoir. Major cities within the Los Angeles County portion of the watershed include Lancaster and Palmdale. Los Angeles River Watershed (HUC 18070105) The Los Angeles River watershed is bounded by the Santa Susanna Mountains to the west, the San Gabriel Mountains to the north and east, and the Santa Monica Mountains and Los Angeles coastal plain to the south. The Los Angeles River is born at the confluence of Bell Creek and Calabasas Creek in the San Fernando Valley. It drains eastward from its headwaters to the northern corner of Griffith Park where the channel then turns southward through the rocky bottleneck of Glendale Narrows. After crossing the coastal plain, the river finally drains into San Pedro Bay near Long Beach. The drainage area of Los Angeles Watershed is 834 square miles and the entire watershed falls within the South Coast Hydrologic Region. Major tributaries of the watershed are Burbank Western Channel, Pacoima Wash, Tujunga Wash, and Verdugo Wash in the San Fernando Valley and the Arroyo Seco, Compton Creek, and Rio Hondo south of the Glendale Narrows. There are numerous lakes and reservoirs in the watershed, including Big Tujunga Reservoir, Chatsworth Reservoir, Encino Reservoir, Echo Park Lake, Los Angeles Reservoir, and Silverlake Reservoir. The upper 57 percent of the watershed is covered by forest and open space, while the remaining 43 percent is highly developed with residential and urban use. Major cities within the watershed include Long Beach and Los Angeles. San Gabriel River Watershed (HUC 18070106) The San Gabriel Watershed lies mostly in Los Angeles County. It is bounded by the San Gabriel Mountains to the north, Puente-Chino Hills to the southeast, the division of the Los Angeles River from the San Gabriel River to the west, and the Pacific Ocean to the south. From the mouth of San Gabriel Canyon in the city of Azusa, the San Gabriel River flows south across the San Gabriel Valley and passes through Whittier Narrows, a natural gap in the hills that form the southern boundary of the San Gabriel Valley. It continues across the Pacific Coastal Plain, through the cities of Pico Rivera, Downey, Bellflower, and Lakewood to eventually meet the Pacific Ocean. Geology of the San Gabriel Valley creates an unusual flow pattern that keeps the San Gabriel River along the western edge of the watershed for most of its length. Major tributaries are San Jose Creek, San Dimas Creek, and Walnut Creek. The watershed falls within the South Coast Hydrologic Region. The watershed drains 640 square miles. Twenty-six percent of the watershed is developed, leaving the rest as open space. The river system runs through lands in the Angeles National forest, as well as highly urbanized lands in the San Gabriel, Walnut, and Pomona Valleys. Major cities include Covina, Pomona, Whittier, Los Angeles, and Long Beach. Santa Monica Bay Watershed (HUC 18070104) The majority of Santa Monica Bay Watershed is in Los Angeles County and contained within the South Coast Hydrologic Region. In the north, the watershed reaches eastward from the Santa Monica Mountains to downtown Los Angeles. From there, it extends south and west across the Los Angeles plain to include the area east of Ballona Creek and north of the Baldwin Hills. South of Ballona Creek the

2016 RTP/SCS 3.10 Hydrology and Water Quality Draft PEIR
3.10-23
natural drainage area is a narrow strip of wetlands between Playa del Rey and Palos Verdes. The watershed is comprised of many sub-watersheds that cover broad alluvial valleys, coastal dunes, coastal mountains, and a number of deep and narrow canyons that flow to the Pacific Ocean. The major sub-watersheds include Ballona Creek, Malibu Creek, Topanga Canyon Creek, and Solstice Creek Watersheds. The total drainage area is 414 square miles. Santa Monica Bay Watershed is one of the nation’s most highly urbanized watersheds. Major cities within the watershed include Agoura Hills, Calabasas, Malibu, Los Angeles, Culver City, Beverly Hills, Inglewood, Santa Monica, and West Hollywood. Newport Bay Watershed (HUC 18070204) The Newport Bay Watershed is sandwiched between the San Joaquin Hills to the north and the Santiago Hills to the south, which force surface flow onto the central, flat Tustin plain. The Pacific Ocean comprises 13.5 miles of the watershed’s western border. Coastal foothills accent the alluvial and coastal plains between the two mountain ranges. In total, the watershed drains 150 square miles, which encompasses all water draining to Newport Bay. Peters Canyon Wash, San Diego Creek, and Santa Ana Delhi Channel are the watershed’s major tributaries. Newport Bay Watershed falls within the South Coast Hydrologic Region. Land in the Newport Bay Watershed is highly developed. Forty-seven percent of the landscape is urban, 4 percent agriculture, and 49 percent open space. Major cities include Santa Ana, Tustin, Irvine, Costa Mesa, and Newport Beach. Seal Beach-Westminster Watershed (HUC 1807020) The Westminster Watershed lies on a flat coastal plain in the northwestern corner of Orange County. Three main tributaries drain a total of 74 square miles in the watershed. The Los Alamitos Channel drains into the San Gabriel River, the Bolsa Chica Channel empties into the Anaheim Bay-Huntington Harbor complex, and the East Garden Grove-Wintersburg Channel drains through Bolsa Bay into Huntington Harbor. The Seal Beach-Westminster Watershed is located in the South Coast Hydrologic Region. The Westminster Watershed is almost entirely urbanized with residential and commercial development. The watershed comprises portions of the cities of Anaheim, Cypress, Fountain Valley, Garden Grove, Huntington Beach, Los Alamitos, Santa Ana, Seal Beach, Stanton, and Westminster. Aliso-San Onofre Watershed (HUC 18070301) The Aliso-San Onofre Watershed lies within Orange County, in the South Coast Hydrologic Region. The major waterway is Aliso Creek, which drains to the Pacific Ocean. Aliso Creek is one of three significant waterbodies in the watershed, in addition to Lake Mission Viejo and San Juan Creek. This watershed is highly urbanized, with over 50 percent of the land area classified as urban. Mojave Watershed (HUC 18090208) The Mojave Watershed, comprised of high desert, mountains, and valleys, is located entirely within San Bernardino County and within the South Lahontan Hydrologic Region. It drains a total of 1,600 square miles. The San Bernardino, Granite, and Barstol Mountains form the southwestern borders of the watershed. Mountains in this region are the highest and include Butler Peak, which is the highest point with an elevation of 8,500 feet. The San Bernardino Mountains are the headwaters for the Mojave River system which is born of Deep Creek and West Fork, the two perennial tributaries to the Mojave River.

2016 RTP/SCS 3.10 Hydrology and Water Quality Draft PEIR
3.10-24
The Mojave River traverses the watershed for 120 miles until its terminus at Soda Lake and Silver Dry Lake. Flow is from the southwest to the northeast across the watershed. Land in the Mojave Watershed is largely recreational areas and rangeland. A small amount of the land is irrigated agricultural land and “rural urban” areas. Major population centers in the watershed include Victorville, Hesperia, Apple Valley, and Adelanto. Southern Mojave Watershed (HUC 18100100) The Southern Mojave Watershed lies in San Bernardino and Riverside Counties and within the Colorado River Hydrologic Region. It is bordered by a mountainous region of the Mojave Watershed to the north. The watershed is comprised of mountains, valleys, and dry lakes. A significant geographical feature of the region is the Salton Trough, which contains the Salton Sea and Imperial and Coachella Valleys. The two valleys are separated by the Salton Sea, which covers the lowest area of the depression. Major tributaries include Antelope Creek, Arrastre Creek, Homer Wash, and Pipes Canyon Creek. Santa Ana River Watershed (HUC 18070203) The Santa Ana River Watershed includes much of Orange County, the northwestern corner of Riverside County, the southwestern corner of San Bernardino County, and a small portion of Los Angeles County, draining a total of 2,065 square miles. The watershed is located within the South Coast Hydrologic Region. The watershed is bounded on the south by the San Jacinto Watershed, on the east by the Salton Sea and Southern Mojave watersheds, and on the north and west by the Mojave and San Gabriel watersheds. The highest elevations in the watershed occur in the San Bernardino Mountains at San Gorgonio Peak at 11,485 feet and the eastern San Gabriel Mountains at Mt. Baldy at 10,080 feet. Surface waters start in this mountainous zone and flow northeast to southwest. Further downstream, the Santa Ana Mountains and the Chino Hills form a topographic high before the river flows onto the Coastal Plain in Orange County and outlets into the Pacific Ocean in Huntington Beach. Major tributaries to the Santa Ana River include San Timoteo Creek and Santiago Creek. The Santa Ana Watershed is home to the most developed portion of Orange County and much of the built-up portions of Riverside and San Bernardino Counties. Major cities include Santa Ana, Rancho Cucamonga, Corona, and San Bernardino. San Jacinto Watershed (HUC 18070202) The San Jacinto River Watershed covers approximately 770 square miles and is located approximately 80 miles southeast of Los Angeles. It extends from the San Jacinto Mountains in the north and east to Lake Elsinore in the west. Most of the watershed (99.75 percent) falls within Riverside County, while the remaining portion extends into an undeveloped portion of Orange County. Calleguas Creek Watershed (HUC 18070103) Calleguas Creek and its tributaries are located in southeast Ventura County and a small portion of western Los Angeles County. The watershed falls within the South Coast Hydrologic Region. Calleguas Creek drains an area of approximately 343 square miles from the Santa Susana Pass in the east to Mugu Lagoon in the southwest. The watershed drains from the mountains in the northeast part of the watershed toward the southwest where it flows through the Oxnard Plain before emptying into the Pacific Ocean through Mugu Lagoon. The Santa Susana Mountains, South Mountain, and Oak Ridge

2016 RTP/SCS 3.10 Hydrology and Water Quality Draft PEIR
3.10-25
form the northern boundary of the watershed; the southern boundary is formed by the Simi Hills and Santa Monica Mountains. The watershed is characterized by three major sub-watersheds: the Arroyo Simi/Las Posas in the north, Conejo Creek in the south, and Revolon Slough in the west. Major tributaries of Callegua Creek include Arroyo Simi, Arroyo Conejo, and Arroyo Santa Rosa. The watershed includes the cities of Simi Valley, Moorpark, Thousand Oaks, and Camarillo. Most of the agriculture is located in the middle and lower watershed with the major urban areas (Thousand Oaks and Simi Valley) located in the upper watershed. The current land use in the watershed is approximately 26 percent agriculture, 24 percent urban, and 50 percent open space. Santa Clara River Watershed (HUC 18070102) Santa Clara River and its tributaries run through Ventura County and the northwestern part of Los Angeles County, and are located in the South Coast Hydrologic Region. The portion of the watershed within Los Angeles County is referred to as Upper Santa Clara and the portion within Ventura County is referred to as Lower Santa Clara. Santa Clara River drains an area of 1,634 square miles from the mountains in northern Los Angeles County to the Pacific Ocean. The watershed drains from Pacifico Mountain in the San Gabriel Mountains westward through the Angeles National Forest System before emptying into the Pacific Ocean near the City of Ventura. Ninety percent of the watershed consists of rugged mountains. The remainder of the watershed consists of valley floor and coastal plains. Land use in the Santa Clara Watershed is 62 percent open space, 29 percent agriculture, and 9 percent urban. Major cities include Acton, Santa Clarita, Fillmore, Santa Paula, Ventura, and Oxnard. Ventura River Watershed (HUC 18070101) Ventura River Watershed lies entirely in Ventura County. Rugged mountains comprise the upper basin and give way to flat valleys in the lower downstream areas. Nearly half of the watershed is in Los Padres National Forest. Ventura Watershed drains 223 square miles, from its headwaters in the mountains to its outlet in the Pacific Ocean. The Ventura River bisects the watershed, flowing from north to south. Major tributaries are Matilija Creek, North Fork Matilija Creek, San Antonio Creek, Coyote Creek, and Cañada Larga. Lake Casitas and Matijila Reservoir are two major reservoirs within the watershed. The Ventura River watershed falls within the South Coast Hydrologic Region. Land in Ventura Watershed is largely open space with little urbanization. Eighty-seven percent is open space, 10 percent agriculture, and 3 percent urban. Major communities are Ojai, Oak View, and the western portion of the City of San Buenaventura. Lower Colorado Watershed (HUC 15030107) The Lower Colorado Watershed straddles the border between Imperial County in California and Yuma County in Arizona, and extends into the State of Sonora in northern Mexico. The lower Colorado River is heavily dammed for agricultural, municipal, and industrial uses, including the Imperial, Laguna, and Morelos Dams. The Imperial Dam provides water for the All American Canal, which carries over 5 million acre-feet of water into California every year, mostly for agricultural uses. Salton Sea Watershed (HUC 18100200) Immediately west of the Lower Colorado Watershed, Salton Sea Watershed extends from just north of the Salton Sea, in Riverside County, to the Mexicali Valley, near the U.S.-Mexico border, in Imperial

2016 RTP/SCS 3.10 Hydrology and Water Quality Draft PEIR
3.10-26
County. This watershed makes up the lower part of the Coachella Valley, bordered by mountains to the east and west, and extending south to the Colorado Delta in the Sea of Cortez. The main geographic feature in this watershed is California’s largest lake, the Salton Sea, an inland saltwater lake approximately 380 square miles in size. In 2001, the Imperial Valley Irrigation District, the largest recipient of Colorado River water in California, agreed to a plan to transfer up to 200,000 acre-feet of water per year to San Diego for municipal water uses. Imperial Reservoir Watershed (HUC 15030104) North of the Lower Colorado Watershed is Imperial Reservoir Watershed, which lies on both sides of the California-Arizona border along the Colorado River. It extends north to Lake Havasu, created by the construction of Parker Dam, which was completed in 1938. Malibu Creek Watershed This watershed has changed rapidly in the last 20 years from a predominantly rural area to a steadily developing area that has doubled in population to nearly 80,000 residents. Increased flows (from imported waters needed to support the growing population base) and channelization of several tributaries to Malibu Creek have caused an imbalance in the natural flow regime in the watershed. Pollutants of concern, many of which are discharged from nonpoint sources, include excess nutrients, sediment, and bacteria. Ballona Creek Watershed Pollutants from industrial and municipal effluent as well as urban runoff degrade the quality of Ballona Creek. Specific pollutants include high levels of dissolved solids (chlorides, sulfates, heavy metals) and bacteria. Untreated sewage discharged into Ballona Creek during the rainy season causes beach closures along Santa Monica Bay. In addition, high concentrations of DDT in sediments at the mouth of the creek and in Marina Del Rey provide evidence of past discharges that have resulted in long-term water quality problems. Los Angeles River Watershed The Los Angeles River is highly modified, having been lined with concrete along most of its length by the USACOE from the 1930s to the 1960s. One seven-mile reach in the narrows area (in the middle portion of the river system), where groundwater rises into the streambed, is mostly unlined along the stream bottom and provides natural habitat for fish and other wildlife in an otherwise concrete conveyance. The upper reaches of the river carry urban runoff and flood flows from the San Fernando Valley. Below the Sepulveda Basin, flows are dominated by tertiary-treated effluent from several municipal wastewater treatment plants. Because the watershed is highly urbanized, urban runoff and illegal dumping are major contributors to impaired water quality in the Los Angeles River and tributaries. San Gabriel River Watershed While the upper San Gabriel River and its tributaries remain in a relatively pristine state, intensive recreational use of this area for picnicking, off-road vehicle use, fishing, and hiking threaten water quality and aquatic and riparian habitats. Further problems in the upper San Gabriel River occur as vast

2016 RTP/SCS 3.10 Hydrology and Water Quality Draft PEIR
3.10-27
amounts of naturally eroding sediment from the rugged San Gabriel Mountains settle into reservoirs behind flood control dams. Improper sediment sluicing operations from these reservoirs can impact aquatic habitats and groundwater recharge areas. In the San Gabriel Valley, the middle reaches of the river have been extensively modified in order to control flood and debris flows and to recharge ground water. Extensive sand and gravel operations are found along these stretches of the river. The lower San Gabriel River (i.e., those stretches flowing through the Los Angeles Coastal Plain) also has been extensively modified and is lined with concrete from approximately Firestone Boulevard to the estuary. Flow in these lower reaches is dominated by effluent from several municipal wastewater treatment facilities and urban runoff. Beneficial uses have been impaired in these lower reaches of the San Gabriel River, as evidenced by ambient toxicity and bioaccumulation of metals in fish tissue. Other, more generalized surface water problems in the region include poor mineral quality in some areas due to a variety of reasons including geology, agricultural runoff, discharge of highly mineralized ground water, and poor quality of some imported waters. Other problems include:
Bioaccumulation of toxic compounds in fish and other aquatic life lmpacts from increased development and recreational uses In-stream toxicity from point and nonpoint sources Diversion of flows necessary for the propagation of fish and wildlife populations Channelization, dredging, and other losses of habitat lmpacts from transient camps located along creeks and lagoons Illegal dumping Introduction of non-native plants, which are of little value to the biota and clog the
streams lmpacts from sand and gravel mining operations Natural oil seeps Eutrophication and the accumulation of toxic pollutants in lakes
Drainages Surface water resources in the SCAG region include creeks and rivers, lakes and reservoirs, and the inland Salton Sea. Reservoirs serving flood control and water storage functions exist throughout the region. Because the climate of Southern California is predominantly arid, many of the natural rivers and creeks are intermittent or ephemeral, drying up in the summer or flowing only in reaction to precipitation. For example, annual rainfall amounts vary depending on elevation and proximity to the coast. Some waterways such as Ballona Creek and the Los Angeles River maintain a perennial flow due to agricultural irrigation and urban landscape watering. The Colorado River watershed includes seven states on the western slope of the Rocky Mountains, traversing the arid southwest to the Gulf of California in Mexico. The river supplies water to 25 million people in both the U.S. and Mexico and forms the eastern border of the SCAG region. The Salton Sea, the largest inland body of water in California, was formed around 1905 when the Colorado River was diverted from its natural course. At present, the Salton Sea serves as a drainage reservoir for agricultural runoff in the Imperial Valley and Mexico. The Salton Sea is fed by the New River and Alamo River and would dry up entirely without agricultural runoff. Other major natural surface waters in the SCAG region include the Ventura River, Santa Clara River, Los Angeles River, San Gabriel River, Santa Ana River, San Jacinto River, and upstream portions of the Santa Margarita River. The Ventura River is fed by Lake Casitas on the western border of Ventura County and

2016 RTP/SCS 3.10 Hydrology and Water Quality Draft PEIR
3.10-28
empties out into the ocean. It is the northern-most river system in Southern California, supporting a large number of sensitive aquatic species. Water quality decreases in the lower reaches due to urban and industrial impacts. The Santa Clara River flows through the center of Ventura County and remains in a relatively natural state. Threats to water quality include increasing development in floodplain areas, flood control measures such as channeling, erosion, and loss of habitat. The Los Angeles River is a highly disturbed system due to the flood control features along much of its length. Due to the high urbanization in the area around the Los Angeles River, runoff from industrial and commercial sources as well as illegal dumping contribute to reduce the channel’s water quality. The San Gabriel River is similarly altered with concrete flood control embankments and impacted by urban runoff. The Santa Ana River drains the San Bernardino Mountains, cuts through the Santa Ana Mountains, and flows onto the Orange County coastal plain. Recent flood control projects along the river have established reinforced embankments for much of the river’s path through urbanized Orange County. The Santa Margarita River begins in Riverside County, draining portions of the San Jacinto Mountains and flowing to the ocean through northern San Diego County. Complete lists of surface water resources within the SCAG region along with the beneficial uses associated with them are contained in each of the five Basin Plans prepared by the RWQCBs. Federally Protected Wetlands and Waterways Current National Wetlands Inventory maps and USGS blue-line drainage data for the six-county SCAG region were reviewed for potential wetlands and waterways subject to protection under Section 404 of the CWA and coastal areas subject to Section 10 of the Rivers and Harbors Act. Wetlands and waterways potentially subject to the jurisdiction of the USACOE were determined to be present within each of the six counties in the SCAG Region (Table 3.10.2-2, Federally Protected Wetlands and Waterways Reported in the SCAG Region). The characterization of “waters of the United States” is at a programmatic level of detail. The ability to discern precise area subject to the jurisdiction of the USACOE pursuant to Section 10 of the Rivers and Harbors Act or Section 404 of the Clean Water Act normally requires to preparation of a jurisdictional delineation, in accordance with the most recent Wetland Delineation Manual.
TABLE 3.10.2-2 FEDERALLY PROTECTED WETLANDS AND WATERWAYS REPORTED IN THE SCAG REGION
Major River or Lake Acres Linear Miles
Imperial County Salton Sea 190,391.60 — Los Angeles County Castaic Lake 2,230.82 — Morris Reservoir 283.42 — Puddingstone Reservoir 243.77 — Pyramid Lake 1,177.31 — San Gabriel Reservoir 524.85 — Los Angeles River — 50.73 San Gabriel River — 59.19 Santa Clara River — 43.86 Orange County Irvine Lake 445.54 — San Gabriel River — 0.35

2016 RTP/SCS 3.10 Hydrology and Water Quality Draft PEIR
3.10-29
TABLE 3.10.2-2 FEDERALLY PROTECTED WETLANDS AND WATERWAYS REPORTED IN THE SCAG REGION
Major River or Lake Acres Linear Miles
Santa Ana River — 27.18 Riverside County Diamond Valley Lake 4,057.69 — Lake Elsinore 3,308.69 — Lake Matthews 2,666.79 — Perris Reservoir 1,920.63 — Salton Sea 42,537.27 — Skinner Reservoir 790.46 — Vail Lake 257.23 — Santa Ana River — 24.43 Santa Margarita River — 5.14 San Bernardino County Big Bear Lake 2,692.69 — Lake Arrowhead 735.62 — Silverwood Lake 905.09 — Santa Ana River — 43.86 Ventura County Lake Casitas 2,446.81 — Lake Piru 1,220.91 — Santa Clara River — 39.27 TOTAL 258,837.19 294.00 SOURCE: U.S. Geological Survey, National Hydrology Dataset. Accessed 11 September 2015. Website. Available at: http://nhd.usgs.gov/data.html
Floodplains and Flood Hazards The two major mountain ranges and outlying deserts define over 20 watershed in the SCAG region. Each of these watersheds has associated 100-year floodplains. Of the six counties in the SCAG region, Imperial County has the largest land area designated as being in the 100-year floodplain by the Federal Emergency Management Agency (FEMA) (Table 3.10.2-3, 100-Year Floodplains). Since the region is so mountainous, development often occurs in the valleys, and newer development extends into the foothills of those mountains (Figure 3.10.2-2, Federally Designated Flood Hazard Zones). Floodplains in Southern California are a unique hazard area; although flooding from rain-swollen rivers can occur in valley bottoms, a more common floodplain hazard is debris flow. Debris flows are common in mountain foothill areas, especially after fire and heavy rain events, when wet, heavy soils and rock slide down steep slopes and into valleys below. Areas with a history of such slides can often be identified by sloping, fan-shaped landforms at the base of mountains and hillsides.

Q:\1315\SCAG\ArcProjects\Floodplains.mxd | Date: 10/29/2015
Kern
San Diego
SantaBarbara
NEVADA
ARIZONA
MEXICO
InyoTulare
§̈15
§̈8
Los AngelesVentura
San Bernardino
Riverside
Imperial
Orange
ÄÆ40£¤395
£¤101
£¤101
§̈15
ÄÆ58
§̈10
ÄÆ78
ÄÆ111
ÄÆ86
ÄÆ60ÄÆ91 §̈10
§̈215
§̈15
§̈5
§̈405
ÄÆ71ÄÆ60
§̈10§̈210§̈605
§̈710
§̈110
§̈405
§̈5
ÄÆ14
ÄÆ126
°0 10 205
Miles
100-year Floodplains500-year Floodplains
FIGURE 3.10.2-2:Federally DesignatedFlood Hazard Zones
Sources: SCAG, ESRI Shaded Relief, TeleAtlas, FEMA

2016 RTP/SCS 3.10 Hydrology and Water Quality Draft PEIR
3.10-30
TABLE 3.10.2-3
100-YEAR FLOODPLAINS
County AcresImperial 303,787.51Los Angeles 138,985.77Orange 49,262.42Riverside 110,900.26San Bernardino 108,597.36Ventura 52,845.38 Total 764,378.69SOURCE: SCAG GIS analysis and data, 2015.
Flood control channels are typically designed to move large volumes of water from one place to another rapidly, without property damage. A fully improved channel is usually concrete, severely limiting the aquatic habitat beneficial uses. Partially improved channels may only have levees on either side, but other flood control activities (such as channel straightening, vegetation clearing, and weed control using copper or other toxic materials) can reduce or eliminate the aquatic habitat. Storm flows themselves, not necessarily part of flood events, can and do eliminate streamside habitat in parts of the river through sheer scouring force every few years. Seiche A seiche is an oscillation of a body of water in an enclosed or semi enclosed basin, such as a reservoir, harbor, lake, or storage tank. Southern California is a semi-arid region, and many of its lakes are drinking water reservoirs, created either through damming of rivers, or manually dug and constructed. Reservoirs also serve as flood control for downstream communities. Some of the most significant lakes, including reservoirs, in the SCAG region are Big Bear Lake, Lake Arrowhead, Lake Casitas, Castaic Lake, Pyramid Lake, Lake Elsinore, Diamond Valley Lake, and the Salton Sea. The entire SCAG region is susceptible to impacts from seismic activity including the occurrence of seiches in the fore mentioned lakes and reservoirs. Tsunami Tsunamis are ocean waves caused by large earthquakes and landslides that occur near or under the ocean. Tsunami waves are unlike typical ocean waves generated by wind and storms. When tsunamis approach shore, they behave like a very fast moving tide that extends far inland. Inundation by tsunamis can occur along the California coast in the event of a significant earthquake. Relatively local earthquakes and landslides off the California coast pose the greatest threat. Approximately 25,000 acres within the three coastal counties within the SCAG region are susceptible to inundation risk from tsunami (Table 3.10.2-4, Tsunami Inundation by County and Figure 3.7.2-6, Areas Susceptible to Tsunamis, in Section 3.7, Geology and Soils).

2016 RTP/SCS 3.10 Hydrology and Water Quality Draft PEIR
3.10-31
TABLE 3.10.2-4 TSUNAMI INUNDATION BY COUNTY
County Sum of Acres Los Angeles 11,047.33 Orange 9,716.56 Ventura 4,289.76 Total 25,053.64 SOURCE: California Department of Conservation. Accessed 11 September 2015. Website. Available at: http://www.conservation.ca.gov/cgs/geologic_hazards/Tsunami/Inundation_Maps/Pages/Index.aspx
Mudflow Strong ground shaking during earthquake events can generate landslides or mudflow and slumps in uplands or coastal regions near the causative fault. Seismically-induced mudflow has typically been found to occur within 75 miles of the epicenter of a magnitude 6.5 earthquake. Seismically-induced mudflow would be most likely to occur in areas that have previously experienced mudflow or slumps, in areas of steep slopes, or in saturated hillside areas. Areas of the SCAG region are susceptible to seismically-induced mudflow because of the abundance of active faults in the region and the existing mudflow hazards. Areas of potential landslides in the SCAG region are shown in Figure 3.7.2-5 Areas Susceptible to Landslides, in Section 3.7, Geology and Soils. Water Quality Major surface waters of the SCAG region flow from head waters in pristine mountain areas (largely in two national forests and the Santa Monica Mountains), through urbanized foothill and valley areas, high density residential and industrial coastal areas, and terminate at highly utilized recreational beaches and harbors. Uncontrolled pollutants from nonpoint sources are believed to be the greatest threats to rivers and streams within the SCAG region. Impaired Water Bodies There are 230 impaired water bodies in the SCAG region (Table 3.10.2-5, Impaired Surface Water Bodies in the SCAG Region and Figure 3.10.2-3, Section 303(d) Impaired Water Bodies).

Q:\1315\SCAG\ArcProjects\ImpairedWaterBodies.mxd | Date: 10/29/2015
Kern
San Diego
SantaBarbara
ÄÆ79
ÄÆ60
§̈10
§̈10
§̈210§̈605
ÄÆ91
§̈5
§̈405
§̈110§̈710
§̈10
§̈405
§̈5
ÄÆ71
ÄÆ60
ÄÆ14 ÄÆ138
ÄÆ58
§̈15
ÄÆ126
ÄÆ118
£¤101
£¤101
£¤101
Ventura
Los Angeles
San Bernardino
RiversideOrange
ÄÆ78
ÄÆ111
ÄÆ86
§̈10Riverside
Imperial
0 6 123Miles °
FIGURE 3.10.2-3:Section 303 (d) Impaired Waterbodies
Sources: SCAG, ESRI, Tele Atlas, SWRCB
Impaired Water Bodies

2016 RTP/SCS 3.10 Hydrology and Water Quality Draft PEIR
3.10-32
TABLE 3.10.2-5
IMPAIRED SURFACE WATER BODIES IN THE SCAG REGION
Pollutant Impaired Water Body Central Coast
Boron Cuyama River (above Twitchell Reservoir)Rincon Creek
Colorado River Basin
Chlordane Alamo River Imperial Valley Drains
DDT (Dichlorodiphenyltrichloroethane)
Coachella Valley Storm Water Channel Palo Verde Outfall Drain and Lagoon
Selenium Colorado River (Imperial Reservoir to California-Mexico Border) Toxaphene New River (Imperial County)Lahontan Arsenic Amargosa River (Upper Canyon to Willow Creek confluence)
Fluoride Mojave River (Mojave Forks Reservoir outlet to Upper Narrows) Mojave River (Upper Narrows to Lower Narrows)
Nitrate Sheep Creek
Total Dissolved Solids Crab Creek Holcomb Creek
Los Angeles
Algae
Lindero Creek Reach 1 Lindero Creek Reach 2 (Above Lake) Medea Creek Reach 1 (Lake to Confl. with Lindero) Medea Creek Reach 2 (Abv Confl. with Lindero) Ventura River Estuary Ventura River Reach 1 and 2 (Estuary to Weldon Canyon)
Ammonia
Calleguas Creek Reach 2 (estuary to Potrero Rd- was Calleguas Creek Reaches 1 and 2 on 1998 303d list) Calleguas Creek Reach 3 (Potrero Road upstream to confluence with Conejo Creek on 1998 303d list) Calleguas Creek Reach 6 ( was Arroyo Las Posas Reaches 1 and 2 on 1998 303d list) Calleguas Creek Reach 7 (was Arroyo Simi Reaches 1 and 2 on 1998 303d list) Calleguas Creek Reach 9B (was part of Conejo Creek Reaches 1 and 2 on 1998 303d list) Calleguas Creek Reach 10 (Conejo Creek (Hill Canyon)-was part of Conejo Crk Reaches 2 & 3, and lower Conejo Crk/Arroyo Conejo N Fk on 1998 303d list) Calleguas Creek Reach 11 (Arroyo Santa Rosa, was part of Conejo Creek Reach 3 on 1998 303d list) Calleguas Creek Reach 12 (was Conejo Creek/Arroyo Conejo North Fork on 1998 303d list) Calleguas Creek Reach 13 (Conejo Creek South Fork, was Conejo Cr Reach 4 and part of Reach 3 on 1998 303d list)

2016 RTP/SCS 3.10 Hydrology and Water Quality Draft PEIR
3.10-33
TABLE 3.10.2-5 IMPAIRED SURFACE WATER BODIES IN THE SCAG REGION
Pollutant Impaired Water Body
Coyote Creek Dominguez Channel (lined portion above Vermont Ave) Los Angeles River Reach 1 (Estuary to Carson Street) Los Angeles River Reach 2 (Carson to Figueroa Street) Los Angeles River Reach 3 (Figueroa St. to Riverside Dr.) Los Angeles River Reach 4 (Sepulveda Dr. to Sepulveda Dam) Los Angeles River Reach 5 ( within Sepulveda Basin) San Jose Creek Reach 1 (SG Confluence to Temple St.) Santa Clara River Reach 3 (Freeman Diversion to A Street) Sepulveda Canyon Tujunga Wash (LA River to Hansen Dam)
Beach Closures Robert H. Meyer Memorial Beach
Benthic-Macroinvertebrate Bioassessments
Arroyo Seco Reach 1 (LA River to West Holly Ave.) Compton Creek Las Virgenes Creek Malibu Creek Triunfo Canyon Creek Reach 2 Walnut Creek Wash (Drains from Puddingstone Res)
Bis(2ethylhexyl)phthalate (DEHP) Sawpit Creek
Boron
Calleguas Creek Reach 8 (was Tapo Canyon Reach 1) Fox Barranca (tributary to Calleguas Creek Reach 6) Santa Clara River Reach 11 (Piru Creek, from confluence with Santa Clara River Reach 4 to gaging station below Santa Felicia Dam)
Cadmium Ballona Creek Estuary Cadmium (sediment) Ballona Creek
ChemA (tissue)
Calleguas Creek Reach 5 (was Beardsley Channel on 1998 303d list) Calleguas Creek Reach 9A (was lower part of Conejo Creek Reach 1 on 1998 303d list) Duck Pond Agricultural Drains/Mugu Drain/Oxnard Drain No 2 Rio De Santa Clara/Oxnard Drain No. 3
Chloride
Piru Creek (from gaging station below Santa Felicia Dam to headwaters) Santa Clara River Reach 5 (Blue Cut gaging station to West Pier Hwy 99 Bridge) (was named Santa Clara River Reach 7 on 2002 303(d) list) Santa Clara River Reach 6 (W Pier Hwy 99 to Bouquet Cyn Rd) (was named Santa Clara River Reach 8 on 2002 303(d) list) Sespe Creek (from 500 ft below confluence with Little Sespe Cr to headwaters)
Chlorpyrifos (tissue) Calleguas Creek Reach 4 (was Revolon Slough Main Branch: Mugu Lagoon to Central Avenue on 1998 303d list)
Coliform Bacteria Arroyo Seco Reach 2 (West Holly Ave to Devils Gate Dam) Bell Creek

2016 RTP/SCS 3.10 Hydrology and Water Quality Draft PEIR
3.10-34
TABLE 3.10.2-5 IMPAIRED SURFACE WATER BODIES IN THE SCAG REGION
Pollutant Impaired Water Body
Big Rock Beach Dan Blocker Memorial (Coral) Beach Las Flores Beach Leo Carillo Beach (South of County Line) Long Point Beach Los Angeles River Reach 6 (Above Sepulveda Flood Control Basin) Malibu Lagoon Beach (Surfrider) Palo Comado Creek Redondo Beach Rio Hondo Reach 1 (Confl. LA River to Snt Ana Fwy) Rio Hondo Reach 2 (At Spreading Grounds) San Gabriel River Reach 1 (Estuary to Firestone) San Gabriel River Reach 2 (Firestone to Whittier Narrows Dam San Jose Creek Reach 2 (Temple to I-10 at White Ave.) Santa Clara River Reach 7 ( Bouquet Canyon Rd to above Lang Gaging Station) (was named Santa Clara River Reach 9 on 2002 303(d) list) Stokes Creek Topanga Beach Torrance Beach Torrance Carson Channel Verdugo Wash Reach 1 (LA River to Verdugo Rd.) Wilmington Drain
Copper Aliso Canyon Wash Burbank Western Channel San Gabriel River Estuary
DDT (Dichlorodiphenyltrichloroethane)
Amarillo Beach Bluff Cove Beach Cabrillo Beach (Outer) Carbon Beach Castlerock Beach Escondido Beach Flat Rock Point Beach Area Inspiration Point Beach La Costa Beach Las Tunas Beach Malaga Cove Beach Malibu Beach Nicholas Canyon Beach Paradise Cove Beach

2016 RTP/SCS 3.10 Hydrology and Water Quality Draft PEIR
3.10-35
TABLE 3.10.2-5 IMPAIRED SURFACE WATER BODIES IN THE SCAG REGION
Pollutant Impaired Water Body
Point Dume Beach Point Fermin Park Beach Portuguese Bend Beach Puerco Beach Royal Palms Beach Sea Level Beach Trancas Beach (Broad Beach) Ventura Marina Jetties Whites Point Beach Zuma Beach (Westward Beach)
DDT (sediment) Abalone Cove Beach
Fecal Coliform Canada Larga (Ventura River Watershed) Dry Canyon Creek McCoy Canyon Creek
Fish Barriers (Fish Passage) Matilija Creek Reach 1 (Jct. With N. Fork to Reservoir) Matilija Creek Reach 2 (Above Reservoir)
Indicator Bacteria
Artesia-Norwalk Drain Avalon Beach Bull Creek Channel Islands Harbor Beach Coyote Creek, North Fork Dockweiler Beach Hermosa Beach Hobie Beach (Channel Islands Harbor) Long Beach City Beach Lunada Bay Beach Manhattan Beach Marina del Rey Harbor Beach Ormond Beach Peninsula Beach Point Vicente Beach Promenade Park Beach Puente Creek Resort Point Beach Rincon Beach San Antonio Creek (Tributary to Ventura River Reach 4) San Buenaventura Beach San Gabriel River Reach 3 (Whittier Narrows to Ramona) Santa Monica Beach

2016 RTP/SCS 3.10 Hydrology and Water Quality Draft PEIR
3.10-36
TABLE 3.10.2-5 IMPAIRED SURFACE WATER BODIES IN THE SCAG REGION
Pollutant Impaired Water Body
Santa Monica Canyon Surfers Point at Seaside Venice Beach Ventura River Reach 3 (Weldon Canyon to Confl. w/ Coyote Cr) Will Rogers Beach
Invasive Species Solstice Canyon Creek
Lead Monrovia Canyon Creek Topanga Canyon Creek Triunfo Canyon Creek Reach 1
Nitrate and Nitrite
Brown Barranca/Long Canyon Mint Canyon Creek Reach 1 (Confl to Rowler Cyn) Torrey Canyon Creek Wheeler Canyon/Todd Barranca
Pathogens Palo Verde Shoreline Park Beach Pumping Ventura River Reach 4 (Coyote Creek to Camino Cielo Rd)
Sulfates Hopper Creek Pole Creek (trib to Santa Clara River Reach 3 )
Toxicity Santa Clara River Reach 1 (Estuary to Hwy 101 Bridge)
Trash San Gabriel River, East Fork
Verdugo Wash Reach 2 (Above Verdugo Road)
San Diego Benzo[b]fluoranthene English Canyon Cadmium Prima Deshecha Creek Chloride Oso Creek (at Mission Viejo Golf Course)
Chlorpyrifos
Long Canyon Creek (tributary to Murrieta Creek) Murrieta Creek Redhawk Channel Santa Gertrudis CreekTemecula Creek Warm Springs Creek (Riverside County)Long Canyon Creek (tributary to Murrieta Creek) Murrieta Creek
DDE (Dichlorodiphenyldichloroethylene) San Juan Creek
Diazinon Arroyo Trabuco Creek
Enterococcus
Pacific Ocean Shoreline, Aliso HSA, at Aliso Beach - middle Pacific Ocean Shoreline, Aliso HSA, at Aliso Creek mouth Pacific Ocean Shoreline, Lower San Juan HSA, at North Beach Creek Pacific Ocean Shoreline, Lower San Juan HSA, at South Doheny State Park

2016 RTP/SCS 3.10 Hydrology and Water Quality Draft PEIR
3.10-37
TABLE 3.10.2-5 IMPAIRED SURFACE WATER BODIES IN THE SCAG REGION
Pollutant Impaired Water Body
CampgroundPacific Ocean Shoreline, San Clemente HA, at San Clemente City Beach at Pier Pacific Ocean Shoreline, San Clemente HA, at South Capistrano County Beach
Indicator Bacteria Aliso Creek
Pacific Ocean Shoreline, Dana Point HSA, at Aliso Beach at West Street
Iron De Luz Creek
Phosphorus Santa Margarita River (Upper) Segunda Deshecha Creek
Sediment Toxicity Laguna Canyon Channel
Selenium Moro Canyon Creek Oso Creek (lower)
Total Coliform Pacific Ocean Shoreline, Dana Point HSA, at Salt Creek outlet at Monarch Beach Pacific Ocean Shoreline, Laguna Beach HSA, at Main Beach
Santa Ana
Ammonia (Unionized)
Bolsa Chica Channel Borrego Creek (from Irvine Blvd to San Diego Creek Reach 2) East Garden Grove Wintersburg Channel Serrano Creek
Cadmium Cucamonga Creek Reach 1 (Valley Reach) Rathbone (Rathbun) Creek Santa Ana River Reach 6 Chemical oxygen demand (COD) Chino Creek Reach 1B (Mill Creek confl to start of concrete lined channel)
Coliform Bacteria Chino Creek Reach 2 (Beginning of concrete channel to confl w San Antonio Creek)
Copper Bolsa Chica State Beach Santa Ana River, Reach 3
DDT (Dichlorodiphenyltrichloroethane)
Balboa Beach Peters Canyon Channel
Enterococcus Newport Slough Seal Beach
Fecal Coliform Buck Gully Creek Los Trancos Creek (Crystal Cove Creek) San Diego Creek Reach 1
Indicator Bacteria Goldenstar Creek Morning Canyon Creek San Diego Creek Reach 2

2016 RTP/SCS 3.10 Hydrology and Water Quality Draft PEIR
3.10-38
TABLE 3.10.2-5 IMPAIRED SURFACE WATER BODIES IN THE SCAG REGION
Pollutant Impaired Water Body
Santa Ana Delhi Channel Santa Ana River, Reach 2 Temescal Creek, Reach 6 (Elsinore Groundwater sub basin boundary to Lake Elsinore Outlet)
Nutrients
Chino Creek Reach 1A (Santa Ana River R5 confl to just downstream of confl with Mill Creek) Grout Creek Mill Creek (Prado Area) Summit Creek
Pathogens
Knickerbocker Creek Lytle Creek Mill Creek Reach 1 Mill Creek Reach 2 Mountain Home Creek Mountain Home Creek, East Fork Santa Ana River, Reach 4 Silverado Creek
PCBs (Polychlorinated biphenyls) Huntington Beach State Park
pH Cucamonga Creek Reach 2 (Mountain Reach) San Antonio Creek Temescal Creek, Reach 1
Salinity/TDS/Chlorides Santiago Creek, Reach 4 SOURCE: State Water Resources Control Board. Accessed 11 September 2015. 2010 303(d) List of Impaired Waterbodies. Available at: http://www.waterboards.ca.gov/water_issues/programs/tmdl/integrated2010.shtml Special Pollutant Concerns Point and Non-Point Source Pollution Portions of the Los Angeles River in Los Angeles County and the Santa Ana River in Orange County have been lined with concrete for flood control purposes. One of the effects of these projects has been to reduce the natural recharge of groundwater basins. A second has been to make these rivers conveyance systems that concentrate and transfer urban pollutants and waste to the ocean. With regard to the rivers themselves, the State’s Water Quality Assessment Report estimated in 1992 that approximately two-thirds of California’s water bodies were threatened or impaired by non-point sources of pollution. Point source pollution refers to contaminants that enter a watershed, usually through a pipe. The location of the end of the pipe is documented and the flow out of that pipe is subject to a discharge permits issued by an RWQCB. Examples of point source pollution are discharges from sewage treatment plants and industrial facilities. Because point sources are much easier to regulate than non-point sources, they were the initial focus of the 1972 CWA. Regulation of point sources since then has dramatically improved the water quality of many rivers and streams throughout the country. In contrast

2016 RTP/SCS 3.10 Hydrology and Water Quality Draft PEIR
3.10-39
to point source pollution, non-point source pollution, also known as “pollution runoff,” is diffuse. Non-point pollution comes from everywhere in a community and is significantly influenced by land uses. A driveway or the road in front of a house may be a source of pollution if spilled oil, leaves, pet waste or other contaminants leave the site and runoff into a storm drain. Non-point source pollution is now considered one of the major water quality problems in the United States. Runoff Pollutants The problem of non-point source pollution is especially acute in urbanized areas where a combination of impermeable surfaces, landscape irrigation, highway runoff and illicit dumping increase the pollutant loads in stormwater. The SWRCB has identified the following pollutants found in urban runoff as being a particular concern.
Sediment: Excessive sediment loads in streams can interfere with photosynthesis, aquatic life respiration, growth, and reproduction.
Nutrients: Nitrogen and phosphorus can result in eutrophication of receiving waters (excessive or accelerated growth of vegetation or algae), reducing oxygen levels available for other species.
Bacteria and viruses: Pathogens introduced to receiving waters from animal excrement in the watershed and by septic systems can restrict water contact activities.
Oxygen demanding substances: Substances such as lawn clippings, animal excrement and litter can reduce dissolved oxygen levels as they decompose.
Oil and grease: Hydrocarbons from automobiles are toxic to some aquatic life. Metals: Lead, zinc, cadmium and copper are heavy metals commonly found in
stormwater. Other metals introduced by automobiles include chromium, iron, nickel and manganese. These metals can enter waterways through storm drains along with sediment, or as atmospheric deposition.
Toxic pollutants: Pesticides, phenols and polynuclear aromatic hydrocarbons (PAHs) are toxic organic chemicals found in stormwater.
Floatables: Trash in waterways increases metals and toxic pollutant loads in addition to undesirable aesthetic impacts.
Salinity The general quality of groundwater in the SCAG region tends to be degraded as a result of land uses and water management practices. Fertilizers and pesticides typically used on agricultural lands infiltrate and degrade groundwater. Septic systems and leaking underground storage tanks can also impact groundwater. Overpumping can result in saltwater intrusion from the ocean, further degrading groundwater quality. In addition, wastewater discharges in inland regions can result in salt buildup from fertilizer and dairy waste. To address the salinity problem, an increasing number of water agencies are working with other water, groundwater and wastewater agencies, state and local government agencies, and interested associations on researching and developing salinity management goals and action plans. Examples include the recently adopted Malibu Valley Groundwater Basin Salt and Nutrient Management Plan and the Central and West Coast Groundwater Basin Salt and Nutrient Management Plan. Strategies

2016 RTP/SCS 3.10 Hydrology and Water Quality Draft PEIR
3.10-40
currently in use include blending low and high salinity water and the desalination of brackish water based on guidance from the Regional and SWRCBH’s Recycled Water Policy. Perchlorate Ammonium perchlorate is a primary ingredient of solid rocket propellant and is used in the manufacture of some types of munitions and fireworks. Ammonium perchlorate and other perchlorate salts are readily soluble in water, dissociating into the perchlorate ion that is highly mobile in groundwater. Small amounts of perchlorate have been found in the Colorado River with higher concentrations in a number of groundwater basins in Southern California. The primary human health concern related to perchlorate is its effects on the thyroid. While perchlorate cannot be removed using conventional water treatment, nanofiltration and reverse osmosis do work effectively, but at very high cost. Irvine Ranch Water District is using a fluidized bed biological treatment and is reinjecting the treated water back into the ground. A number of companies have developed an ion exchange process that removes perchlorate but creates hazardous waste brine. Nonetheless, a number of sites in Southern California have successfully installed ion exchange systems. Thus, while effective treatment options are available, the overriding consideration in decisions about whether to recover perchlorate contaminated groundwater is the cost-effective of available technologies. Total Organic Carbon (TOC) and Bromide When source water containing high levels of TOC and bromide is treated with disinfectants such as chlorine or ozone, disinfection byproducts (DBPs) form. Studies have shown a link between certain cancers and DBP exposure. In addition, some studies have shown an association between reproductive and developmental effects and chlorinated water. In December 1998, the U.S. EPA adopted more stringent regulations for DPBs, especially in old industrial sites and Gateway Cities Corridor where historic use of disinfectants is having residual effects. Existing levels of TOCs and bromide in water supplies present challenges to agencies receiving water from the SWP to monitor and maintain safe drinking water supplies. A primary objective of the CALFED Bay-Delta process is protection and improvement of the water quality of the SWP to ensure future drinking water regulations. Although exact future drinking water standards are unknown, significant source water protection of SWP water supplies will almost certainly be a necessary component of meeting these requirements cost-effectively. Methyl Tertiary Butyl Ether and Tertiary Butanol (MTBE) The use of MTBE (and other oxygenates) in gasoline was mandated to achieve reductions in air pollution, including emissions of benzene, a known human carcinogen. However, this reduction in air pollution has been achieved at the expense of creating a serious groundwater and surface water problem. MTBE is very soluble in water and moves quickly into the groundwater. It is introduced into surface water bodies from the motor exhausts of recreational watercraft. MTBE is also resistant to chemical and microbial degradation in water, making treatment more difficult than the treatment of other gasoline components. As stated in the 2010 Regional Urban Water Management Plan (RUWMP) developed by the Southern California Municipal Water District, “Perchlorate interferes with the thyroid gland’s ability to produce hormones required for normal growth and development.” MTBE presents a significant problem for local groundwater basins. Leaking underground storage tanks and poor fuel-handling practices at local gas stations may provide a large source for MTBE. One gallon of MTBE alone (11 percent MTBE by volume) is enough to contaminate about 16.5 million gallons of water at 5 μg/L.36.

2016 RTP/SCS 3.10 Hydrology and Water Quality Draft PEIR
3.10-41
Such contamination has caused some water agencies to close wells. The City of Santa Monica, for example, lost about 50 percent of its production wells as a result of MTBE contamination during the 1990s. A combination of advanced oxidation processes followed by granular activated carbon has been found to be effective in reducing the levels of MTBE contaminants by 80 to 90 percent. This may make it possible for local water agencies to treat their groundwater sources to comply with water quality standards. The cost of such treatment, however, could cause some agencies to increase imports as a means of avoiding this cost. Arsenic Arsenic, a naturally occurring substance in drinking water, has been identified as a risk factor for lung and urinary bladder cancer. A number of Southern California water sources have been identified as containing arsenic concentrations exceeding the current federal standard of 10 μg/L. Monitoring results submitted to the California Department of Health Services in 2001–2003 showed that the affected areas included the counties of San Bernardino (61 sources), Los Angeles (50 sources), Riverside (24 sources) and Orange (four sources). It appears likely that current treatment standards will increase cost but not necessarily decrease local water supplies. However, if treatment cost increases are sufficient, some water agencies in Southern California may choose to increase their use of imported water to avoid this additional cost. Radon Radon, a naturally occurring substance in groundwater, has not been a significant problem for most water agencies with the SCAG region. Where radon is a problem, air-stripping through aeration is the cost effective treatment option. However, stripping results in outgassing of radon into the air. Currently, the U.S. EPA has determined that the risk posed by this outgassing is less than that posed by radon in the water. Uranium A 10.5-million-ton pile of uranium mine tailings at Moab, Utah, lies 600 feet from the Colorado River. Rainwater has been seeping through the pile and contaminating the local groundwater, causing a flow of contaminants into the river. It also has the potential to wash millions of tons of material containing uranium into the Colorado River as a result of a flood or other natural disaster. Operations and maintenance activities at the site include intercepting some of the contaminated groundwater before it discharges into the river. The interim action became fully active in September 2003 and is currently being evaluated. As of 2010, 1,408,000 gallons of contaminated water had been collected and evaporated. At the recommendation of the National Research Council, the Department of Energy (DOE) conducted a study to evaluate remediation actions and released an environmental impact statement in July 2005. The DOE has agreed to move the tailings, but remediating the site will require Congressional appropriations, and maintaining support for a cleanup will require close coordination and cooperation with other Colorado River users. Land Use and Water Quality Buildings, roads, sidewalks, parking lots, and other impervious surfaces define the urban landscape. But impervious surfaces also alter the natural hydrology and prevent the infiltration of water into the

2016 RTP/SCS 3.10 Hydrology and Water Quality Draft PEIR
3.10-42
ground. Impervious surfaces change the flow of stormwater over the landscape. In underdeveloped areas, vegetation holds down soil, slows the flow of stormwater over land, and filters out some pollutants by both slowing the flow of the water and trapping some pollutants in the root system. Additionally, some stormwater filters through the soil, replenishing underground aquifers. 36μg/L is a unit of weight equal to one-millionth (10-6) of a gram. As land is converted to other uses such as commercial developments, many of these natural processes are eliminated as vegetation is cleared and soil is paved over. As more impervious surface coverage is added to the landscape, more stormwater flows faster off the land. The greater volume of stormwater increases the possibility of flooding, and the high flow rates of stormwater do not allow for pollutants to settle out, meaning that more pollution gets concentrated in the stormwater runoff. Research on urban stream protection has found that stream degradation occurs at relatively low levels of imperviousness—in the range of 10 to 20 percent. Wetlands suffer impairment when impervious surface coverage surpasses 10 percent. Fish habitat, spawning, and diversity suffer when imperviousness is greater than 10 to 12 percent. Wetland plants and amphibian populations diminish when impervious surfaces are greater than 10 percent. Generally, the higher the percentage of impervious surface, the greater the degradation in stream water quality. Based on this research, streams can be considered stressed in watersheds when the impervious coverage exceeds 10 to 15 percent. The link between impervious surfaces and degraded water quality points to the need for careful comparisons between dispersed and compact development strategies. On a regional or watershed level, greater overall water quality protection is achieved through more concentrated or clustered development. Concentrated development protects the watershed by leaving a larger percentage of it in its natural condition. Waste Discharge Requirements If the operation or discharges from a property or business affects California’s surface, coastal, or groundwater, it would normally be required to obtain a permit to discharge waste from the appropriate RWQCB. Discharges of pollutants into surface waters require a federal NPDES permit application with the appropriate Regional Board. For other types of discharges, such as those affecting groundwater or in a diffused manner (e.g., erosion from soil disturbance or waste discharges to land) a Report of Waste Discharge must be filed with the appropriate RWQCB in order to obtain Waste Discharge Requirements (WDRs). For specific situations, the RWQCB may waive the requirement to obtain a WDR for discharges to land or may determine that a proposed discharge can be permitted more effectively through enrollment in a general NPDES permit or general WDR. The RWQCBs in the SCAG region have identified a typical list of activities that affect water, but the list is by no means inclusive of all situations:
Discharge of process wastewater not discharging to a sewer (factories, cooling water, etc.)
Confined Animal facilities (dairies, feedlots, etc.) Waste containments (landfills, waste ponds, etc.) Construction sites Boatyards and shipyards Discharges of pumped groundwater and cleanups (underground tank cleanups,
dewatering, spills)

2016 RTP/SCS 3.10 Hydrology and Water Quality Draft PEIR
3.10-43
Material handling areas draining to storm drains Sewage treatment facilities Filling of wetlands Dredging, filling, and disposal of dredge wastes Commercial activities not discharging to a sewer (e.g., factory waste water, storm drain) Waste discharges to land
3.10.3 THRESHOLDS OF SIGNIFICANCE Based on CEQA Appendix G and as appropriate for the 2016 RTP/SCS, the Plan would have a significant impact related to water resources if it would:
Violate any water quality standards or waste discharge requirements. Substantially deplete groundwater supplies or interfere substantially with groundwater
recharge such that there would be a net deficit in aquifer volume or a lowering of the local groundwater table level (e.g., the production rate of pre-existing nearby wells would drop to a level that would not support existing land uses or planned uses for which permits have been granted).
Substantially alter the existing drainage pattern of the site or area, including through the alteration of the course of a stream or river, in a manner that would result in substantial erosion or siltation on or off site.
Substantially alter the existing drainage pattern of the site or area, including through the alteration of the course of a stream or river, or substantially increase the rate or amount of surface runoff in a manner that would result in flooding on site or off site.
Substantially create or contribute runoff water that would exceed the capacity of existing or planned stormwater drainage systems or providing substantial additional sources of polluted runoff.
Otherwise substantially degrade water quality. Place housing within a 100-year flood hazard area as mapped on a federal flood hazard
boundary or flood insurance rate map or other flood hazard delineation map. Place within a 100-year flood hazard area structures that would impede or redirect flood
flows. Expose people or structures to a significant risk of loss, injury, or death involving
flooding, including flooding as a result of the failure of a levee or dam. Have potential for inundation by seiche, tsunami, or mudflow.
Methodology This section identifies the potential impacts of the Plan on hydrology and water quality. The water quality analysis evaluates the regional-scale and cumulative impacts of the transportation projects and land use strategies included in the 2016 RTP/SCS and the associated growth on water quality. The analysis includes a programmatic-level assessment of the expected urbanized land use and the associated impervious surfaces. Subsequent, project-specific water quality assessments will be conducted by implementing agencies to determine site-specific water quality impacts for individual transportation projects, as projects in the 2016 RTP/SCS are implemented.

2016 RTP/SCS 3.10 Hydrology and Water Quality Draft PEIR
3.10-44
The methodology for determining the significance of the impacts on water quality, water supply, and wastewater compares the future Plan conditions to the existing setting, as required in CEQA Guidelines § 15126.2(a). Long-term, regional-scale, cumulative impacts of the 2016 RTP/SCS on water quality were evaluated based on relative estimates of vacant land consumption based on the long-term regional growth forecast for 2040. Impacts to water supply were assessed by comparing the existing water supplies to the expected water demand in 2040 with the Plan. Likewise, the PEIR analyzes impacts to wastewater services by comparing existing capacity of wastewater systems to the expected demand in future Plan conditions. The 2016 RTP/SCS includes coordinated regional strategies for transportation investments and land use strategies that are aimed to increase mobility, promote sustainability and improve economy. The Regional Travel Demand Model (RTDM) used for this analysis captures pass-through traffic that does not have an origin or destination in the region, but does impact the region, so that too is included in the project analysis. Although development is anticipated to occur within the region even without the 2016 RTP/SCS, this Plan includes regional land use strategies that could influence growth, including distribution patterns, throughout the region. To assess potential impacts to water resources, Geographic Information Systems (GIS) were used to assess transportation projects in the 2016 RTP/SCS as well as anticipated development patterns in relation to existing water resources. Additional data relating to water resources compiled within the GIS format included surface hydrology, 100-year flood plains, impaired water bodies identified by the SWRCB, and regional groundwater basins. The assessment of impacts also includes relative estimates of vacant land consumption based on the long-term regional growth forecast for 2040. Impacts to water supply were assessed by comparing the existing water supplies to the expected water demand in 2040 with the Plan. 3.10.4 IMPACT ANALYSIS IMPACT HYD-1: Potential to violate any water quality standards or waste discharge requirements. Significant Impact The 2016 RTP/SCS would result in significant impacts to water quality standards and waste discharge requirements. Construction and operation of the transportation projects and land use strategies included in the 2016 RTP/SCS have the potential to violate water quality requirement pursuant to Sections 401 and 404 of the Federal CWA and specific TMDLs adopted by the RWQCBs in the SCAG region, constituting a significant impact. The Plan has the potential to increase impervious surface areas which in turn will increase urban runoff, resulting in the transport of greater quantities of contaminants to receiving waters that may currently be impaired (Table 3.10.2-5). Construction activities related to transportation projects included in the Plan could increase pollutant loads carried by storm water runoff (See Table 3.10.4-1, Pollutants Associated with Transportation). In addition, many of the pollutants in urban runoff are attributable to landscape irrigation, highway runoff, and illicit dumping. Highway runoff is a component of urban runoff contributing oil and grease, sediment, nutrients, heavy metals, and toxic substances.

2016 RTP/SCS 3.10 Hydrology and Water Quality Draft PEIR
3.10-45
TABLE 3.10.4-1
POLLUTANTS ASSOCIATED WITH TRANSPORTATION
Pollutant SourceAsbestos Clutch plates, brake linings Cadmium Tire wear and insecticides Copper Thrust-bearing, bushing, brake linings, and fungicides and insecticides Chromium Pavement materials, metal plating, rocker arms, crankshafts, rings, and brake liningsCyanide Anti-caking compound in de-icing saltLead Leaded gasoline, motor oil, transmission babbit metal bearings, tire wearIron Auto-body rust, steel highway structures, moving engine parts Manganese Moving engine partsNickel Diesel fuel and gasoline, pavement material, lubricating oil, metal plating, bushing
wear, and brake linings Nitrogen and Phosphorus Motor oil additives, fertilizers Sulphates Roadway beds, fuel, and de-icing saltZinc Motor oil and tiresGrease and Hydrocarbons Spills and leaks of oil and n-parafin lubricants, antifreeze, hydraulic fluidsRubber Tire wear Sediment Pavement wear, construction and maintenance activities SOURCE: U.S. Environmental Protection Agency, Office of Water. 1995. Controlling Nonpoint Source Runoff Pollution from Roads, Highways, and Bridges. EPA-841-F-95-008a.
The SWRCB has developed trash, metal, and bacteria TMDLs for many of the watersheds in the region, including Dominguez Channel, Santa Monica Bay, Los Angeles River, Santa Clara River, Ventura River, Malibu Creek, Calleguas Creek, and Ballona Creek. The TMDLs provide a numerical threshold for each pollutant within each watershed to be used for regulating both point and non-point source discharges and is implemented through the NPDES permit process. Future methods for quantifying highway runoff will assist regulators with applying appropriate management practices in areas where highway runoff impacts impaired water bodies. The inclusion of runoff control measures in the design of future roadway projects will improve water quality and result in impacts to the environment. Transportation projects and urban development encouraged by land use strategies included in the proposed 2016 RTP/SCS would result in increased impervious surfaces. Much of the development that’s being envisioned by the 2016 RTP/SCS would be located in urban areas where few pervious surfaces exist and pollution of urban waterways is a serious problem. The growth projection associated with the proposed Plan would substantially increase the amount of urbanized land or densify existing urbanized areas in the SCAG region. Pollutant loading in surface and groundwater correlates closely with land use patterns. Suspended sediments, oxygen demanding substances, and oil and grease would constitute a substantial part of these pollutant loads. Total nitrogen and total phosphorous would increase less than these other pollutants, but would have the potential for influencing algal growth, reducing dissolved oxygen, and affecting aquatic species abundance and composition. Increased impervious surfaces would add storm water runoff volumes and peak flow rates.

2016 RTP/SCS 3.10 Hydrology and Water Quality Draft PEIR
3.10-46
Anticipated population growth reflected in the Plan’s growth projections would substantially increase urbanization in some areas such as the high quality transit areas (HQTAs) of the SCAG region. With the proposed 2016 RTP/SCS, pollutant loading in surface and groundwater correlates closely with land use patterns. Suspended sediments, oxygen demanding substances, and oil and grease would constitute a substantial part of these pollutant loads. Total nitrogen and total phosphorous would increase less than these other pollutants, but would have the potential for influencing algal growth, reducing dissolved oxygen, and affecting aquatic species abundance and composition. Additional impervious surfaces would increase the potential for pollutants to enter impaired receiving waters. Therefore, there is a significant impact to water quality standards and waste discharge requirements, requiring the consideration of mitigation measures. IMPACT HYD-2: Potential to substantially deplete groundwater supplies or interfere substantially with groundwater recharge such that there would be a net deficit in aquifer volume or a lowering of the local groundwater table level (e.g., the production rate of pre-existing nearby wells would drop to a level that would not support existing land uses or planned uses for which permits have been granted). Significant Impact The 2016 RTP/SCS would result in significant impacts in regards to groundwater supplies or interfere substantially with groundwater recharge such that there would be a net deficit in aquifer volume or a lowering of the local groundwater table level (e.g., the production rate of preexisting nearby wells would drop to a level that would not support existing land uses or planned uses for which permits have been granted). The anticipated regional population growth of 3.8 million people by 2040 reflected in the 2016 RTP/SCS, would result in net increase in water demand in the SCAG region that would have the potential to substantially deplete groundwater supplies. Additionally, higher-density, infill development patterns to accommodate such growth as encouraged by the Plan, would potentially interfere with groundwater recharge due to an increase in impervious surfaces, such that there would be a net deficit in aquifer volume or a lowering of local groundwater level. Groundwater represents most of the SCAG region’s fresh water supply, making up approximately 34 percent of total water use, depending on precipitation levels. The hydrologic regions vary in their dependence on groundwater for urban and agricultural uses. The DWR estimates that the State has a groundwater overdraft of approximately 1 to 2 maf in average years. The transportation projects included in the 2016 RTP/SCS would likely include projects that involve installation of additional impervious surfaces. With the implementation of transportation projects included in the 2016 RTP/SCS, approximately 8,000 new lane miles resulting in a total of approximately 78,802 lane miles (PM peak network) in 2040 would be added to the region.6 These additions would include new facilities, additional right-of-way on existing transportation facilities and/or extending roads to accommodate bike lanes on existing transportation facilities. Rail projects involving construction of new rail lines, new stations, and upgrades to existing stations are not included in this calculation. Where
6 Southern California Association of Governments. December 2015. 2016-2040 Regional Transportation Plan/Sustainable
Communities Strategy: Highways & Arterials Appendix. Los Angeles, CA.

2016 RTP/SCS 3.10 Hydrology and Water Quality Draft PEIR
3.10-47
these transportation projects involve installation of additional impervious surfaces they would potentially have adverse impacts on groundwater infiltration. Under natural conditions, vegetation intercepts and retains rainfall before infiltration or runoff occurs. Without hard-surfaced land areas, this hydrology cycle favors groundwater recharge. With a roadway or other hard surface this infiltration dynamic is significantly impeded. The magnitude of this effect is reported by studies indicating that the volume of storm water washed off one-acre of roadway is about sixteen times greater than that of a comparably sized meadow.7 The increase in impervious surfaces due to additional lane miles, in addition to urban development associated with the population growth in 2040 would increase runoff and potentially affect groundwater recharge rates. Therefore, there is a significant impact to substantially deplete groundwater supplies and interfere substantially with groundwater recharge such that there would be a net deficit in aquifer volume or a lowering of the local groundwater table level, requiring the consideration of mitigation measures. IMPACT HYD-3: Potential to substantially alter the existing drainage pattern of the site or area, including through the alteration of the course of a stream or river, in a manner that would result in substantial erosion or siltation on or off site. Significant Impact The 2016 RTP/SCS would result in significant impacts to existing drainage pattern of the site or area, including through the alteration of the course of a stream or river, in a manner that would result in substantial erosion or siltation on or off site. Transportation projects identified in the Plan would occur within watersheds that have impaired water bodies. Many of the impaired water bodies are located near a freeway, transit, or rail project included in the 2016 RTP/SCS. Several projects may impact water bodies by placing fill material within a stream channel. For example, several of the lane widening projects and new transportation facilities could cross existing creeks or be expanded into wetland areas. These potential intrusions would be subject to permitting by the USACOE and a RWQCB pursuant to Sections 404 and 401 of the CWA. Construction and earth-moving activities from transportation projects and property development projects can be a major source of sediment loading in local waterways. There is significant potential for unprotected soil to erode as a result of stormwater runoff construction activity associated with the proposed Plan. Prior to commencement of construction activities, a project applicant must submit a SWPPP to the SWRCB that identifies the best management practices (BMPs) that will be used in the planned project construction. The applicant must receive approval of the SWPPP and submit a Notice of Intent prior to initiating construction. Each individual transportation project in the 2016 RTP/SCS and development projects discussed in the Plan, is expected to adopt BMPs appropriate to local conditions and to the proposed construction techniques that will reduce stormwater runoff. There is still a potentially significant impact to substantially alter the existing drainage pattern of the site or area,
7 Scheuler, T.R. 1994. The Importance of Imperviousness. Watershed Protection Techniques 1(3): 100-111.

2016 RTP/SCS 3.10 Hydrology and Water Quality Draft PEIR
3.10-48
including through the alteration of the course of a stream or river, in a manner that would result in substantial erosion or siltation on or off site, requiring the consideration of mitigation measures. IMPACT HYD-4: Potential to substantially alter the existing drainage pattern of the site or area, including through the alteration of the course of a stream or river, or substantially increase the rate or amount of surface runoff in a manner that would result in flooding on site or off site. Significant Impact The 2016 RTP/SCS would have significant impact to existing drainage pattern of the site or area, including through the alteration of the course of a stream or river, or substantially increase the rate or amount of surface runoff in a manner that would result in flooding on site or off site. Several transportation projects included in the 2016 RTP/SCS may impact water bodies by placing fill material within a stream channel due to construction activities such as lane widening projects, bridge, tunnel, and new transportation facilities projects that could cross existing creeks, water crossings, rivers or be expanded into wetland areas. Additionally construction activities associated with transportation projects can be a major source of sediment loading and hydrocarbon contamination in local waterways. Unprotected soil easily erodes with rainwater. In addition, fueling procedures and maintenance of heavy equipment on construction sites can spill diesel and oil and grease As a result, there is a significant impact to substantially alter the existing drainage pattern of the site or area, including through the alteration of the course of a stream or river, and substantially increase the rate or amount of surface runoff in a manner that would result in flooding on site or off site, requiring the consideration of mitigation measures. IMPACT HYD-5: Potential to substantially create or contribute runoff water that would exceed the capacity of existing or planned stormwater drainage systems or providing substantial additional sources of polluted runoff. Significant Impact The 2016 RTP/SCS would result in significant impacts to runoff water that would exceed the capacity of existing or planned stormwater drainage systems or providing substantial additional sources of polluted runoff. The Plan also includes land use strategies that may increase impervious surfaces, which in turn will increase urban runoff, resulting in the transport of greater volumes of polluted water into existing or planned stormwater drainage systems. Storm water runoff is influenced by rainfall intensity, ground surface permeability, watershed size and shape, and physical barriers. The introduction of impermeable surfaces greatly reduces natural infiltration, allowing for a greater volume of runoff. As stated previously, paved surfaces and drainage conduits can accelerate the velocity of runoff, concentrating peak flows in downstream areas faster than under natural conditions. Significant increases to runoff and peak flow can overwhelm drainage systems and alter flood elevations in downstream locations. Increased runoff velocity can promote scouring of existing drainage facilities, reducing system reliability and safety (see Table 3.10.4-1).

2016 RTP/SCS 3.10 Hydrology and Water Quality Draft PEIR
3.10-49
In addition, this increase has the potential to create or contribute runoff flows that would exceed the capacity of existing or planned storm water drainage systems. In addition, placing new structures within an existing floodplain can impede flood waters, altering the flood risks both upstream and downstream. As a result, there is a significant impact to substantially create and contribute runoff water that would exceed the capacity of existing or planned stormwater drainage systems and providing substantial additional sources of polluted runoff, requiring mitigation measures. IMPACT HYD-6: Potential to otherwise substantially degrade water quality. Significant Impact See Impact HYD-1. The 2016 RTP/SCS would result in significant impacts to water quality. As described above, the Plan’s transportation projects and anticipated new growth in urbanized areas would increase impervious areas. The runoff from these new impervious areas would contribute to local water impairments by degrading the water quality of the receiving waters, both in the short-term (during project construction) and in the long-term (during the project’s operation). There is a significant impact to otherwise substantially degrade water quality, requiring the consideration of mitigation measures. IMPACT HYD-7: Potential to place housing within a 100-year flood hazard area as mapped on a federal flood hazard boundary or flood insurance rate map or other flood hazard delineation map. No Impact The 2016 RTP/SCS’s forecasted land use pattern encourages the trend of new higher-density housing and commercial development in the region’s HQTAs. The HQTAs are generally located in areas that are subject to Flood Management Plans and major flood control infrastructure has been constructed to constrain the 100-year flood in to flood control systems. Flood-prone areas in Imperial County are managed pursuant to a FMP that includes a future-oriented approach to planning in flood risk areas. It is a pre-disaster planning approach that is required by FEMA for the County to continue to participate in the National Flood Insurance Program (NFIP). When the community chooses to join the NFIP, it must adopt and enforce minimum floodplain management standards for participation. The floodplain management requirements within the Special Flood Hazard Area (SFHA) are designed to prevent new developments from increasing the flood threat and to protect new and existing buildings from anticipated flood events. When a community chooses to join the NFIP, it must require permits for all development in the SFHA and ensure that construction materials and methods used will minimize future flood damage.8 The Los Angeles Flood Control District includes the vast majority of drainage infrastructure within incorporated and unincorporated areas in every watershed in the County, including 500 miles of open channel, 2,800 miles of underground storm drain, and an estimated 120,000 catch basins.9 The County of Orange maintains 350 miles of concrete, rock
8 Imperial County. April 2007. Imperial County Flood Management Plan. 9 County of Los Angeles Department of Public Works. Accessed 18 November 2015. “100 Years 1915-2015.” Available at:
http://dpw.lacounty.gov/lacfcd/

2016 RTP/SCS 3.10 Hydrology and Water Quality Draft PEIR
3.10-50
lined and earthen flood control facilities.10 Flood control facilities are designed to handle water flow from storm drains and other runoff and "channel" the water into the bay or ocean The Riverside County Flood Control District owns and operates over 600 miles of channels storm drains and levees along with 74 dams and detention basin that reduce flood risk throughout the District.11 Similarly, the San Bernardino County Flood Control District has developed a very extensive system of facilities, including dams, conservation basins, channels, and storm drains to intercept and convey flood flows through and away from the major developed areas of the County.12 The Ventura County Flood Control District provides for the control and conservation of flood and storm waters and for the protection of watercourses, watersheds, public highways, life and property in the district from damage or destruction from these waters .13 The flood control districts in the SCAG Region participated in the NFIP which is based on a mutual agreement between the Federal Government and communities. Participating communities agree to regulate floodplain development according to specified criteria and standards. Specifically communities must adopt and enforce minimum floodplain management regulations so that development, including buildings, is undertaken in ways that reduce exposure to flooding. The RTP/SCS encourages development in HQTAs and other land use patterns of development in areas that are generally located in areas afforded flood protection by flood control facilities and are subject to specific land use planning regulations pursuant to the NFIP; therefore the Plan would not be expected to result in development of housing in a 100-year flood hazard; therefore, there would be no impact, and the consideration of mitigation measures is not required. Impact HYD-8: Potential to place within a 100-year flood hazard area structures that would impede or redirect flood flows. Significant Impact The 2016 RTP/SCS would have a potential to result in significant impact in regards to placing structures in a 100-year flood hazard area that would impede or redirect flood flows. Natural desert conditions promote runoff that can cause flash flooding. In those areas of the SCAG region where soils have naturally low permeability and are subject to quick saturation, high rain volumes remain on the surface as runoff. When impervious surfaces such as highways are placed within these areas of an existing flood plain the public is exposed to the hazards of flash flooding. Figure 3.10.2-2 identifies federally designated flood hazard zones in the SCAG region. Many of the transportation projects included in the 2016 RTP/SCS would pass through these floodplain areas as currently delineated. The highway and arterial projects included in the 2016 RTP/SCS generally include widening existing highways, constructing new interchanges, new highway segments, new rail lines and the High Speed Rail projects. 10 OC Public Works, Flood Control. Accessed 18 November 2015. “Channels” and “Dams and Basin Maintenance.” Available
at : http://occom.ocpublicworks.com/sections/flood 11 Riverside County Flood Control and Water Conservation District. Accessed 18 November 2015. Available at:
http://www.floodcontrol.co.riverside.ca.us/ 12 San Bernardino County Flood Control District. Accessed 18 November 2015. “Flood Control District.” Available at :
http://www.sbcounty.gov/dpw/floodcontrol/ 13 County of Ventura Public Works Agency, Watershed Protection District. Accessed 18 November 2015. “Protecting Life,
Property, Watercourses, and Watersheds.” Available at: http://pwa.ventura.org/watershed-protection-district/watershed-protection-distric
2016 RTP/SCS 3.10 Hydrology and Water Quality Draft PEIR
3.10-51
Placing new structures within an existing floodplain can impede flood waters, altering the flood risks both upstream and downstream. The flooding risks associated with transportation projects and development located in flood zones can be modified with appropriate design and alignment considerations. The additional urbanized acreage expected by 2040 could increase stormwater runoff, and could be located in areas with the potential for alluvial fan flooding or other flood hazards. Several HQTAs are included in areas that are also flood hazard zones, in particular these areas on located along the coasts of Orange, Los Angeles and Ventura Counties (see Figure 3.10.2-2). Although habitable structures would not be expected to be developed in the 100-year flood hazard area, there exist the potential for transportation project to cross such areas, constituting a significant impact due to the potential to impede or redirect flood flows, requiring the consideration of mitigation measures. IMPACT HYD-9: Potential to expose people or structures to a significant risk of loss, injury, or death involving flooding, including flooding as a result of the failure of a levee or dam. Significant Impact The 2016 RTP/SCS would result in significant impacts in regards to exposing people or structures to a significant risk of loss, injury, or death involving flooding, including flooding as a result of the failure of a levee or dam. The flooding risks associated with transportation projects and urban development included in the 2016 RTP/SCS are located downstream of dams and retention basins or afforded protection by levee system, that may be subject to failure as a result seismic ground-shaking or other natural or anthropogenic actions that compromise the stability of such structures. The additional urban and more compact development, as well as possible expansion of existing urban areas in areas that are potentially subject to flooding as a result of failure of a levee or dam could create a potential to expose people or structures to a significant risk of loss, injury, or death involving flooding. Several HQTAs are included areas that are subject to inundation from tsunamis. In particular, these areas on located along the coasts of Orange, Los Angeles and Ventura Counties. Levee or dam failure could occur at Big Bear Lake, Lake Arrowhead, Lake Casistas, Castaic Lake, Pyramid Lake, Lake Elsinore, Diamond Valley Lake, and the Salton Sea. Hence, there is a potentially significant impact to exposing people and structures to a significant risk of loss, injury, and death involving flooding, including flooding as a result of the failure of a levee or dame, requiring the consideration of mitigation measures. IMPACT HYD-10: Potential for inundation by seiche, tsunami, or mudflow. Significant Impact The proposed 2016 RTP/SCS would result in significant impact in regards to potential risk of inundation by seiche, tsunami, or mudflow. The entire SCAG region is susceptible to impacts from seismic activity including the occurrence of seiches in Big Bear Lake, Lake Arrowhead, Lake Casistas, Castaic Lake, Pyramid Lake, Lake Elsinore, Diamond Valley Lake, and the Salton Sea. Development of transportation projects, particularly projects involving large-scale ground disturbance during construction such as grade separation projects, mixed flow lane projects, and rail projects, in addition to regional land use strategies included in the 2016 RTP/SCS that encourage compact development within the SCAG region, constituting a significant impact. Potentially significant impacts to property and public safety could occur due to subsidence, slope failure, and the presence of expansive soils. Subsidence has historically

2016 RTP/SCS 3.10 Hydrology and Water Quality Draft PEIR
3.10-52
occurred within the SCAG region due to groundwater overdraft and petroleum extraction. Table 3.7.4-1 shows the number of acres within each County where 2016 RTP/SCS transportation projects and strategies are affected by liquefaction and earthquake-induced landslides. Figure 3.7.4-1 shows the location of the 2016 RTP/SCS transportation projects and potential development patterns encouraged by land use strategies, in relation to these areas. As such, there is a potentially significant impact for inundation by seiche, tsunami, and mudflow, requiring the consideration of mitigation measures. 3.10.5 CUMULATIVE IMPACTS IMPACT HYD-1: Potential to violate any water quality standards or waste discharge requirements. Significant Cumulative Impact The 2016 RTP/SCS would be expected to contribute incrementally in the SCAG region to impacts on water quality standards because transportation projects that are with jurisdiction and implementing have the potential to violate water quality requirement pursuant to Sections 401 and 404 of the Federal CWA and specific TMDLs adopted by the RWQCBs in the SCAG region, constituting a significant impact. The Plan has the potential to increase impervious surface areas which in turn will increase urban runoff, resulting in the transport of greater quantities of contaminants to receiving waters that may currently be impaired IMPACT HYD-2: Potential to substantially deplete groundwater supplies or interfere substantially with groundwater recharge such that there would be a net deficit in aquifer volume or a lowering of the local groundwater table level (e.g., the production rate of pre-existing nearby wells would drop to a level that would not support existing land uses or planned uses for which permits have been granted). Significant Cumulative Impact The 2016 RTP/SCS would also be expected to contribute incrementally in the SCAG region to impacts depleting groundwater supplies. The anticipated regional population growth of 3.8 million people by 2040 reflected in the 2016 RTP/SCS, would result in net increase in water demand in the SCAG region that would have the potential to substantially deplete groundwater supplies. Additionally, higher-density, infill development patterns to accommodate such growth as encouraged by the Plan, would potentially interfere with groundwater recharge due to an increase in impervious surfaces, such that there would be a net deficit in aquifer volume or a lowering of local groundwater level.

2016 RTP/SCS 3.10 Hydrology and Water Quality Draft PEIR
3.10-53
IMPACT HYD-3: Potential to substantially alter the existing drainage pattern of the site or area, including through the alteration of the course of a stream or river, in a manner that would result in substantial erosion or siltation on or off site. Significant Cumulative Impact The 2016 RTP/SCS would also be expected to contribute incrementally with related projects in the SCAG region to significant cumulative impacts on the alteration of drainage patterns, thus requiring the consideration of mitigation measures. Several projects may impact water bodies by placing fill material within a stream channel. For example, several of the lane widening projects and new transportation facilities could cross existing creeks or be expanded into wetland areas. IMPACT HYD-4: Potential to substantially alter the existing drainage pattern of the site or area, including through the alteration of the course of a stream or river, or substantially increase the rate or amount of surface runoff in a manner that would result in flooding on site or off site. Significant Cumulative Impact The 2016 RTP/SCS would be expected to contribute incrementally with related projects in the SCAG region to significant cumulative impacts on the alteration of drainage patterns, thus requiring the consideration of mitigation measures. Several projects may impact water bodies by placing fill material within a stream channel. For example, several of the lane widening projects and new transportation facilities could cross existing creeks or be expanded into wetland areas.IMPACT HYD-5: Potential to substantially create or contribute runoff water that would exceed the capacity of existing or planned stormwater drainage systems or providing substantial additional sources of polluted runoff. Significant Impact The 2016 RTP/SCS would be expected to contribute incrementally with related projects in the SCAG region to significant cumulative impacts on contributing to runoff water that would exceed the capacity of existing or planned stormwater drainage systems. Paved surfaces and drainage conduits can accelerate the velocity of runoff, concentrating peak flows in downstream areas faster than under natural conditions. Significant increases to runoff and peak flow can overwhelm drainage systems and alter flood elevations in downstream locations. Increased runoff velocity can promote scouring of existing drainage facilities, reducing system reliability and safety IMPACT HYD-6: Potential to otherwise substantially degrade water quality. Significant Cumulative Impact The 2016 RTP/SCS would be expected to contribute incrementally with related projects in the SCAG region to significant cumulative impacts to degrading water quality. The Plan’s transportation projects and anticipated new growth in urbanized areas would increase impervious areas. The runoff from these

2016 RTP/SCS 3.10 Hydrology and Water Quality Draft PEIR
3.10-54
new impervious areas would contribute to local water impairments by degrading the water quality of the receiving waters, both in the short-term (during project construction) and in the long-term (during the project’s operation). There is a significant impact to otherwise substantially degrade water quality, requiring the consideration of mitigation measures. IMPACT HYD-7: Potential to place housing within a 100-year flood hazard area as mapped on a federal flood hazard boundary or flood insurance rate map or other flood hazard delineation map. No Cumulative Impact The 2016 RTP/SCS would not be expected to contribute incrementally with related projects in the SCAG region by placing housing within a 100-year flood hazard area. The 2016 RTP/SCS’s forecasted land use pattern encourages the trend of new higher-density housing and commercial development in the region’s HQTAs. The HQTAs are generally located in areas that are subject to Flood Management Plans, and major flood control infrastructure has been constructed to constrain the 100-year flood in to flood control systems Impact HYD-8: Potential to place within a 100-year flood hazard area structures that would impede or redirect flood flows. Significant Cumulative Impact The 2016 RTP/SCS would be expected to contribute incrementally with related projects in the SCAG region to significant cumulative impacts to placing structures that would impede or redirect flood flows within a 100-year flood hazard area. Many of the transportation projects included in the 2016 RTP/SCS would pass through these floodplain areas as currently delineated. IMPACT HYD-9: Potential to expose people or structures to a significant risk of loss, injury, or death involving flooding, including flooding as a result of the failure of a levee or dam. Significant Cumulative Impact The 2016 RTP/SCS would be expected to contribute incrementally with related projects in the SCAG region to significant cumulative impacts to placing structures within a 100-year flood hazard. Several HQTAs are included areas that are subject to inundation from tsunamis, in particular these areas on located along the coasts of Orange, Los Angeles and Ventura Counties.

2016 RTP/SCS 3.10 Hydrology and Water Quality Draft PEIR
3.10-55
IMPACT HYD-10: Potential for inundation by seiche, tsunami, or mudflow. Significant Cumulative Impact The 2016 RTP/SCS would be expected to contribute incrementally with related projects in the SCAG region to significant cumulative impacts to potential inundation by seiche, tsunami, or mudflow. The entire SCAG region is susceptible to impacts from seismic activity including the occurrence of seiches in Big Bear Lake, Lake Arrowhead, Lake Casistas, Castaic Lake, Pyramid Lake, Lake Elsinore, Diamond Valley Lake, and the Salton Sea In sum, cumulatively, the proposed Plan would impact water quality, groundwater recharge, flood hazards, and water supply. To reduce land consumption, the proposed Plan includes land use strategies that encourage compact development targeted in HQTAs and existing suburban town centers and walkable, mixed-use communities. The implementation of transportation projects and land use strategies included in the proposed Plan, would result in greater demands on water supply. This increase in water consumption would pull additional water from imported sources, thereby limiting water available for other parts of the State. Mitigation measures would reduce cumulative impacts related to water resources outside the region. However, water resources impacts outside the region would remain cumulatively considerable. 3.10.6 MITIGATION MEASURES Mitigation measures as they pertain to each CEQA question related to hydrology and water quality are described below. Mitigation measures are categorized into two categories: SCAG mitigation and project-level mitigation measures. SCAG mitigation measures shall be implemented by SCAG over the lifetime of the proposed 2016 RTP/SCS. Project-level mitigation measures can and should be implemented by Lead Agencies for transportation and development projects, as applicable and feasible. IMPACT HYD-1: Potential to violate any water quality standards or waste discharge requirements. SCAG Mitigation Measures MM-HYD-1(a): SCAG shall continue to work with local jurisdictions and water quality agencies, and other means, to encourage regional-scale planning for improved water quality management and pollution prevention. Future impacts to water quality shall be avoided to the extent practical and feasible through cooperative planning, information sharing, and comprehensive pollution control measure development within the SCAG region. This cooperative planning shall occur as part of current and existing coordination, an integral part of SCAG’s ongoing regional planning efforts. Project-Level Mitigation Measures MM-HYD-1(b): Consistent with the provisions of Section 15091 of the State CEQA Guidelines, SCAG has identified mitigation measures capable of avoiding or reducing the potential impacts on water quality on related waste discharge requirements that are within the jurisdiction and authority of the Regional Water Quality Control Boards and other regulatory agencies. Where the Lead Agency has identified that

2016 RTP/SCS 3.10 Hydrology and Water Quality Draft PEIR
3.10-56
a project has the potential for significant effects, the Lead Agency can and should consider mitigation measures to ensure compliance with all applicable laws, regulations, and health and safety standards set forth by regulatory agencies responsible for regulating and enforcing water quality and waste discharge requirements in a manner that conforms with applicable water quality standards and/or waste discharge requirements, as applicable and feasible. Such measures may include the following, or other comparable measures identified by the Lead Agency:
Complete, and have approved, a Stormwater Pollution Prevention Plan (SWPPP) prior to initiation of construction.
Implement Best Management Practices to reduce the peak stormwater runoff from the project site to the maximum extent practicable.
Comply with the Caltrans storm water discharge permit as applicable; and identify and implement Best Management Practices to manage site erosion, wash water runoff, and spill control.
Complete, and have approved, a Standard Urban Stormwater Management Plan, prior to occupancy of residential or commercial structures.
Ensure adequate capacity of the surrounding stormwater system to support stormwater runoff from new or rehabilitated structures or buildings.
Prior to construction within an area subject to Section 404 of the Clean Water Act, obtain all required permit approvals and certifications for construction within the vicinity of a watercourse: o U.S. Army Corps of Engineers (Corps): Section 404. Permit approval from the
Corps should be obtained for the placement of dredge or fill material in Waters of the U.S., if any, within the interior of the project site, pursuant to Section 404 of the federal Clean Water Act.
o Regional Walter Quality Control Board (RWQCB): Section 401 Water Quality Certification. Certification that the project will not violate state water quality standards is required before the Corps can issue a 404 permit, above.
o California Department of Fish and Wildlife (CDFW): Section 1602 Lake and Streambed Alteration Agreement. Work that will alter the bed or bank of a stream requires authorization from CDFW.
Where feasible, restore or expand riparian areas such that there is no net loss of impervious surface as a result of the project.
Install structural water quality control features, such as drainage channels, detention basins, oil and grease traps, filter systems, and vegetated buffers to prevent pollution of adjacent water resources by polluted runoff where required by applicable urban storm water runoff discharge permits, on new facilities.
Provide structural storm water runoff treatment consistent with the applicable urban storm water runoff permitWhere Caltrans is the operator, the statewide permit applies.
Provide operational best management practices for street cleaning, litter control, and catch basin cleaning are implemented to prevent water quality degradation in compliance with applicable storm water runoff discharge permits; and ensure treatment controls are in place as early as possible, such as during the acquisition process for rights-of-way, not just later during the facilities design and construction phase.
Comply with applicable municipal separate storm sewer system discharge permits as well as Caltrans’ storm water discharge permit including long-term sediment control and

2016 RTP/SCS 3.10 Hydrology and Water Quality Draft PEIR
3.10-57
drainage of roadway runoff Incorporate as appropriate treatment and control features such as detention basins,
infiltration strips, and porous paving, other features to control surface runoff and facilitate groundwater recharge into the design of new transportation projects early on in the process to ensure that adequate acreage and elevation contours are provided during the right-of-way acquisition process.
Design projects to maintain volume of runoff, where any downstream receiving water body has not been designed and maintained to accommodate the increase in flow velocity, rate, and volume without impacting the water's beneficial uses. Pre-project flow velocities, rates, and volumes must not be exceeded. This applies not only to increases in storm water runoff from the project site, but also to hydrologic changes induced by flood plain encroachment. Projects should not cause or contribute to conditions that degrade the physical integrity or ecological function of any downstream receiving waters.
Provide culverts and facilities that do not increase the flow velocity, rate, or volume and/or acquiring sufficient storm drain easements that accommodate an appropriately vegetated earthen drainage channel.
Upgrade stormwater drainage facilities to accommodate any increased runoff volumes. These upgrades may include the construction of detention basins or structures that will delay peak flows and reduce flow velocities, including expansion and restoration of wetlands and riparian buffer areas. System designs shall be completed to eliminate increases in peak flow rates from current levels.
Encourage Low Impact Development (LID) and incorporation of natural spaces that reduce, treat, infiltrate and manage stormwater runoff flows in all new developments, where practical and feasible.
IMPACT HYD-2: Potential to substantially deplete groundwater supplies or interfere substantially with groundwater recharge such that there would be a net deficit in aquifer volume or a lowering of the local groundwater table level (e.g., the production rate of pre-existing nearby wells would drop to a level that would not support existing land uses or planned uses for which permits have been granted). SCAG Mitigation Measures MM-HYD-2(a): SCAG shall build from existing efforts including those at the sub-regional and local level and shall continue to work with local jurisdictions and water agencies, to encourage regional-scale planning for improved stormwater management and groundwater recharge, including consideration of alternative recharge technologies and practices. Future adverse impacts may be avoided through cooperative planning, information sharing, and comprehensive implementation efforts within the SCAG region.

2016 RTP/SCS 3.10 Hydrology and Water Quality Draft PEIR
3.10-58
Project-Level Mitigation Measures MM-HYD-2(b): Consistent with the provisions of the Section 15091 of the State CEQA Guidelines, SCAG has identified mitigation measures capable of avoiding or reducing the potential impacts to groundwater resources that are within the jurisdiction and authority of the State Water Resources Control Board, Regional Water Quality Control Boards, Water Districts, and other groundwater management agencies. Where the Lead Agency has identified that a project has the potential for significant effects, the Lead Agency can and should consider mitigation measures to ensure compliance with applicable laws, regulations, and health and safety standards set forth by federal, state, regional, and local authorities that regulate groundwater management, consistent with the provisions of the Groundwater Management Act and implementing regulations, including recharge in a manner that conforms with federal, state, regional, and local standards for sustainable management of groundwater basins, as applicable and feasible. Such measures may include the following, or other comparable measures identified by the Lead Agency:
For projects requiring continual dewatering facilities, implement monitoring systems and long-term administrative procedures to ensure proper water management that prevents degrading of surface water and minimizes, to the greatest extent possible, adverse impacts on groundwater for the life of the project, Construction designs shall comply with appropriate building codes and standard practices including the Uniform Building Code.
Maximize, where practical and feasible, permeable surface area in existing urbanized areas to protect water quality, reduce flooding, allow for groundwater recharge, and preserve wildlife habitat. Minimize to the greatest extent possible, new impervious surfaces , including the use of in-lieu fees and off-site mitigation.
Avoid designs that require continual dewatering where feasible. Avoid construction and siting on groundwater recharge areas, to prevent conversion of
those areas to impervious surface. Reduce hardscape to the extent feasible to facilitate groundwater recharge as
appropriate. IMPACT HYD-3: Potential to substantially alter the existing drainage pattern of the site or area, including through the alteration of the course of a stream or river, in a manner that would result in substantial erosion or siltation on or off site. SCAG Mitigation Measures MM-HYD-3(a): SCAG shall build from existing efforts including those at the sub-regional and local level and shall continue to work with local jurisdictions to encourage regional-scale planning for maintaining and/or improving existing drainage patterns. Future adverse impacts may be avoided through cooperative planning, information sharing, and comprehensive implementation efforts within the SCAG region.

2016 RTP/SCS 3.10 Hydrology and Water Quality Draft PEIR
3.10-59
Project-Level Mitigation Measures MM-HYD-1(b). IMPACT HYD-4: Potential to substantially alter the existing drainage pattern of the site or area, including through the alteration of the course of a stream or river, or substantially increase the rate or amount of surface runoff in a manner that would result in flooding on site or off site? SCAG Mitigation Measures MM-HYD-3(a) Project-Level Mitigation Measures MM-HYD-1(b). IMPACT HYD-5: Potential to substantially create or contribute runoff water that would exceed the capacity of existing or planned stormwater drainage systems or providing substantial additional sources of polluted runoff. SCAG Mitigation Measures MM-HYD-2(a) and MM-HYD-3(a) Project-Level Mitigation Measures MM-HYD-1(b) IMPACT HYD-6: Potential to otherwise substantially degrade water quality. SCAG Mitigation Measures MM-HYD-3(a). Project-Level Mitigation Measures MM-HYD-1(b).

2016 RTP/SCS 3.10 Hydrology and Water Quality Draft PEIR
3.10-60
IMPACT HYD-8: Potential to place within a 100-year flood hazard area structures that would impede or redirect flood flows. SCAG Mitigation Measures MM-HYD-8(a): SCAG shall continue to work with local jurisdictions and water quality agencies to encourage flood protection and prevent development in flood hazard areas that do not have appropriate protections. This shall be accomplished through cooperation and information sharing regarding specific alignments and rights-of-way planning for RTP projects, and regional program development as part of SCAG’s ongoing regional planning efforts. These include but are not limited to web-based planning tools and sustainability programs for local government such as CA LOTS, and other GIS tools and data services. Such services would consist of an inventory of areas located near a 100-year flood hazard zone and hazard areas that would potentially be affected by a failure of a levee or dam; and or inundation by seiche, tsunami, or mudflow. Project-Level Mitigation Measures MM-HYD-8(b): Consistent with the provisions of Section 15091 of the State CEQA Guidelines, SCAG has identified mitigation measures capable of avoiding or reducing the potential impacts of locating structures that would impede or redirect flood flows in a 100-year flood hazard area that are within the jurisdiction and authority of the Flood Control District, County Public Works Departments, local agencies, regulatory agencies, and/or Lead Agencies. Where the Lead Agency has identified that a project has the potential for significant effects, the Lead Agency can and should consider mitigation measures to ensure compliance with all federal, state, and local floodplain regulations, consistent with the provisions of the National Flood Insurance Program, as applicable and feasible. Such measures may include the following, or other comparable measures identified by the Lead Agency:
Comply with Executive Order 11988 on Floodplain Management, which requires avoidance of incompatible floodplain development, restoration and preservation of the natural and beneficial floodplain values, and maintenance of consistency with the standards and criteria of the National Flood Insurance Program.
Ensure that all roadbeds for new highway and rail facilities be elevated at least one foot above the 100-year base flood elevation. Since alluvial fan flooding is not often identified on FEMA flood maps, the risk of alluvial fan flooding should be evaluated and projects should be sited to avoid alluvial fan flooding. Delineation of floodplains and alluvial fan boundaries should attempt to account for future hydrologic changes caused by global climate change.

2016 RTP/SCS 3.10 Hydrology and Water Quality Draft PEIR
3.10-61
IMPACT HYD-9: Potential to expose people or structures to a significant risk of loss, injury, or death involving flooding, including flooding as a result of the failure of a levee or dam. SCAG Mitigation Measures MM-HYD-8(a) Project-Level Mitigation Measures MM-HYD-8(b) IMPACT HYD-10: Potential for inundation by seiche, tsunami, or mudflow. SCAG Mitigation Measures MM-HYD-8(a) Project-Level Mitigation Measures MM-HYD-8(b). 3.10.7 LEVEL OF SIGNIFICANCE AFTER MITIGATION IMPACT HYD-1: Potential to violate any water quality standards or waste discharge requirements. Implementation of Mitigation Measures MM-HYD-1(a) and MM-HYD-1(b) would reduce the potential the direct, indirect, and cumulative impacts to water quality to below the level of significance. IMPACT HYD-2: Potential to substantially deplete groundwater supplies or interfere substantially with groundwater recharge such that there would be a net deficit in aquifer volume or a lowering of the local groundwater table level (e.g., the production rate of pre-existing nearby wells would drop to a level that would not support existing land uses or planned uses for which permits have been granted). Implementation of Mitigation Measures MM-HYD-2(a) and MM-HYD-2(b) would reduce the potential impacts to groundwater; however, due to the anticipated net increase in consumptive use of water in the SCAG region, the potential for direct, indirect, and cumulative impacts on groundwater resources and groundwater recharge would remain significant and unavoidable.

2016 RTP/SCS 3.10 Hydrology and Water Quality Draft PEIR
3.10-62
IMPACT HYD-3: Potential to substantially alter the existing drainage pattern of the site or area, including through the alteration of the course of a stream or river, in a manner that would result in substantial erosion or siltation on or off site. Implementation of Mitigation Measures MM-HYD-3(a) and MM-HYD-1(b) would reduce the potential direct, indirect, and cumulative impacts to a less than significant level as they are regulations required by law, prior to construction. IMPACT HYD-4: Potential to substantially alter the existing drainage pattern of the site or area, including through the alteration of the course of a stream or river, or substantially increase the rate or amount of surface runoff in a manner that would result in flooding on site or off site. Implementation of Mitigation Measures MM-HYD-4(a) and MM-HYD-1(b) would reduce the potential impacts to flooding; however, due to the regional scale of the proposed Plan, the direct, indirect, and cumulative impacts would remain significant and unavoidable. IMPACT HYD-5: Potential to substantially create or contribute runoff water that would exceed the capacity of existing or planned stormwater drainage systems or providing substantial additional sources of polluted runoff. Implementation of Mitigation Measures MM-HYD-5(a) and MM-HYD-5(b) would reduce the potential impacts; however, due to the regional scale of the proposed Plan, the direct, indirect, and cumulative impacts would remain significant and unavoidable. IMPACT HYD-6: Potential to otherwise substantially degrade water quality. Implementation of Mitigation Measures MM-HYD-3(a) and MM-HYD-6(b) would reduce the potential impacts; however, due to the regional scale of the proposed Plan, the direct, indirect, and cumulative impacts would remain significant and unavoidable. IMPACT HYD-8: Potential to place within a 100-year flood hazard area structures that would impede or redirect flood flows. Implementation of Mitigation Measures MM-HYD-8(a) and MM-HYD-8(b) would reduce the potential impacts; however, due to the regional scale of the proposed Plan, the direct, indirect, and cumulative impacts would remain significant and unavoidable.

2016 RTP/SCS 3.10 Hydrology and Water Quality Draft PEIR
3.10-63
IMPACT HYD-9: Potential to expose people or structures to a significant risk of loss, injury, or death involving flooding, including flooding as a result of the failure of a levee or dam. Implementation of Mitigation Measures MM-HYD-9(a) and MM-HYD-9(b) would reduce the potential impacts; however, due to the regional scale of the proposed Plan, the direct, indirect, and cumulative impacts would remain significant and unavoidable. IMPACT HYD-10: Potential for inundation by seiche, tsunami, or mudflow. Implementation of Mitigation Measures MM-HYD-10(a) and MM-HYD-10(b) would reduce the potential impacts; however, due to the regional scale of the proposed Plan, the direct, indirect, and cumulative impacts would remain significant and unavoidable.
![[MS-RTP]: Real-time Transport Protocol (RTP) ExtensionsMS-RTP... · The Real-Time Transport Protocol (RTP) Extensions specifies a set of proprietary extensions to the base Real-Time](https://static.fdocuments.net/doc/165x107/5fcb11338738b8501a5201b4/ms-rtp-real-time-transport-protocol-rtp-extensions-ms-rtp-the-real-time.jpg)


![[MS-RTP]: Real-time Transport Protocol (RTP) …...Release: July 24, 2018 [MS-RTP]: Real-time Transport Protocol (RTP) Extensions Intellectual Property Rights Notice for Open Specifications](https://static.fdocuments.net/doc/165x107/5ecb4ebafdd0d04e1c3c1812/ms-rtp-real-time-transport-protocol-rtp-release-july-24-2018-ms-rtp.jpg)

