PGI Server 8.0, PGI Workstation 8.0 Installation Guide - The Portland

Community-Based Risk
Management:
Participatory Mapping & PGIS for
CRA
Issues
Michael McCall
ITC, Netherlands
CENN
Bulachauri
Georgia

Risks
Hazards: physical and human/social
Vulnerability – physical, social, economic, &
environmental factors or processes, increase the
susceptibility of a community to impact of
hazards.
Coping Capacity - strengths & resources within
community or organization to reduce level of
risk, or effects of a disaster. Capacity include
physical, institutional, social economic means;
skills, collective attributes, leadership.

Armero – Colombia - 1985
Choluteca – Honduras -
1998
economic loss and social dislocation = disaster
Risk
= f (
{Flood} Hazard
+
Vulnerable
Context)
-
Coping Capacity
Graciela
Peters

Participación

PGIS represents
Local Spatial Knowledge in CRA
ADDING to CONVENTIONAL INFORMATION
FINDING OUT NEW & UNKNOWN INFORMATION
ALTERNATIVE COMPETING KNOWLEDGE
(counter maps)
CULTURAL/ HISTORICAL (SACRED, MYSTICAL) K.

Mapping Social Vulnerability & Coping
Capacity
Spatial elements are:
Distance from sources
Proximity to shelter, support, etc.
Networks – transport, communications
Networks – supporting mechanisms
Thresholds – environmental. Social
Land cover and land uses

ADDING to CONVENTIONAL GeoSpatial INFORMATION
Specific local spatial „technical‟ knowledge, similar in characteristics, structure, purpose, and cognition to ordinary „scientific‟ knowledge,
but known only (or in detail) to local people,
e.g. local knowledge of frequency, intensity, variability, space of natural hazards; existence of man-made hazards, vulnerability, coping & adaptation, etc..
Similar to spatial component of local people‟s ITK about resources, events, activities, etc. - local instances unknown to external professionals, sciences
Related to this is local spatial knowledge of physical phenomena that external scientists / professionals do not yet know, - e.g. in hazards and risks, hot spots, vulnerable areas, pests, diseases.

PGIS in CRA
Cross-checking Hazard parameters (e.g. locations, boundaries, duration, extent, intensity, frequency), with external expert knowledge
Ex-post Damage assessment
Vulnerability, Preparedness (social & spatial variability)
Coping Capacity and mechanisms, Resilience
Location of resources for coping; e.g. water holes, dry season grazing, secure buildings, famine foods, secure escape routes
Local (indigenous) forecasting – e.g. flood (river & coastal) areas, landslide & avalanche hazards, volcanic activities (e.g. thermal spots)

PGIS in CRA
LK of slow onset hazards, - potential drought damage, soil degradation, forest degradation, pests & diseases,
Pollution areas (& rates, routes, sources, etc.)
Safety & security
Land mine hazards, Cambodia
Counter mapping - Children‟s maps, Women‟s maps, minority maps
Conflict mapping
Integrated Vulnerability assessments (people, groups, specific places

Egs. P-Map in Community Risk Assessment
Rural lands & settlements
Participatory Mapping &/or PGIS of
environmental hazard areas, Kerala, Pakistan, Australia, Ethiopia e.g. landslides, floods, pests, malaria, etc.).
flood risk assessment – damage, vulnerability, coping, Mozambique, Guatemala, Philippines
land mine hazards, Cambodia
potential contamination in hunting areas from nuclear facilities, USA Native lands
IK in water quality sampling near copper-zinc mine, Manitoba (changes in taste in local meat & water)

Community Risk Assessment - rural
Ethiopia & Kenya: Participatory mapping environmental
& conflict risks with pastoralist peoples (Boran, Gabra,
Samburu et al.) in arid lands (Smith et al. 2000)
Mozambique, Sofala Province: P-GIS and disaster risk
management, assessing flood vulnerability with PGIS
methods; Community mapping and community
integrated GIS. (Kienberger et al.)

Local / Indigenous Spatial Knowledge
(LSK): Hazards & Risks
Mozambique PGIS and disaster risk management, assessing
flood vulnerability with PGIS methods; Community mapping and community integrated GIS.
Potential contamination in hunting areas from nuclear facilities, USA Native lands
IK in water quality sampling near copper-zinc mine, Manitoba (changes in taste in local meat & water
Ethiopia & Kenya: Participatory mapping environmental & conflict risks with pastoralist peoples (Boran, Gabra, Samburu et al.) in arid lands

PGIS Tools for DRR Applications APPLICATIONS
TOOLS & METHODS
Communi
ty map
Environ
mental
Hazards
Propert
y
allocate
Land
use
plan
Locatio
n
Hazards
Vulnerab
ility
Assess
Risk
Map
ping
Safety
Securit
y
RRA & PRA methods (for
spatial info) o o
o o o
P-mapping with: Sketch
mapping o
o o 0
P-mapping: Topo maps o o o o o
P-mapping: aerial photos o o o o o o o o
P-mapping: sat, images o o o o o o
P3DM o o o o o o
Mobile GIS, GPS, Cyber
Tracker o o
o o
GIS o o o o o o
Visualisation, Graphics
software o o
o o o
Digital camera, Video,
Multi Media o
o o o
Dynamic GIS (web-based
GIS) o o o
Virtual reality o o o
Interactive Planning
Tables o o o o o
o o

Participatory Mapping & PGIS Tools

Community Vulnerability Mapping, Mozambique,
Kienberger

CARE Household Livelihood Security

Participatory Mapping & PGIS Tools

Mobile GIS

Flood Map and Flood Duration Map

People‟s perception
Bali Mester
SubdistrictBukit Duri
Subdistrict
Kebon Manggis Subdistrict N
Map Projection : UTM 48S
Datum : WGS 1984
0.16 0 0.16KmScale 1:8.000
#S#S
#S
#S#S #S
#S
#S #S
#S
#S
#S#S
#S#S
#S
#S
#S#S
#S #S#S #S
#S
#S
#S
#S
#S
#S#S
#S#S
#S
#S
#S#S
#S#S#S
#S
#S
#S
#S
#S
#S
#S#S#S
#S
#S
#S
#S
#S
#S#S
#S
#S
#S#S
#S
#S
#S
#S
#S#S
#S
#S
#S
#S
#S
#S#S
#S#S
#S#S
#S
#S
#S
#S#S
#S
#S
#S #S
#S
#S
#S
#S
#S
#S
#S
#S#S
#S
#S
#S
#S
#S#S
#S#S
#S
#S#S
#S
#S
#S
River
Railway
Footprint
Road
UnmanageableManageableNormal
Flood Risk Perception
based on interview:
Disastrous
Jatin
ega
ra Ba
ra t Ro
ad
Ciliwung River
The annual flood comes every rainy
season; big floods come with five
years return period.
Gotong royong
Location factors: Proximity to
livelihood rather than safety
The root causes of flooding :are banjir
kiriman, garbage blocking the river
channel, and excessive rainfall.

ALTERNATIVE COMPETING GeoSpatial INFORMATION –
Counter Maps
Knowledge representing different viewpoints, priorities, interests, problems of different local actors, (different from dominant „official‟ view, & from other local actors).
The knowledge of local actors‟ needs, priorities values includes local configurations of land & resource ownership with complexities of multiple user rights, communal property regimes, etc.
Different viewpoints can be reflected in „counter maps’.
Counter maps first applied to mapping gendered spaces, especially women‟s maps of resource access or control. Children, landless, resource-poor, subordinate ethnic groups or castes also merit dedicated counter-maps.
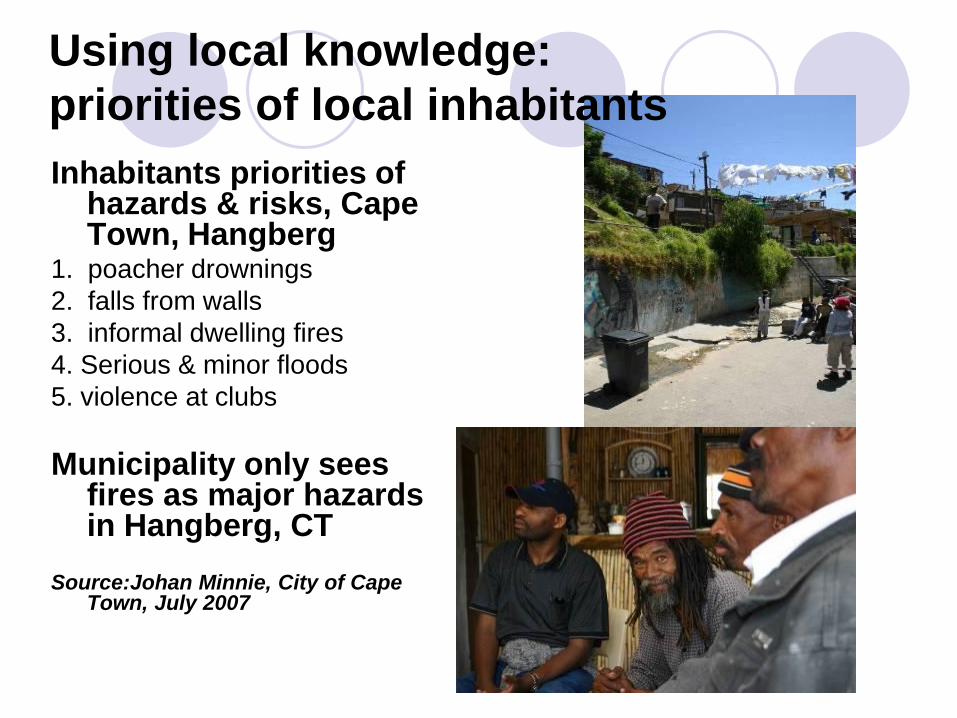
Using local knowledge:
priorities of local inhabitants
Inhabitants priorities of hazards & risks, Cape Town, Hangberg
1. poacher drownings
2. falls from walls
3. informal dwelling fires
4. Serious & minor floods
5. violence at clubs
Municipality only sees fires as major hazards in Hangberg, CT
Source:Johan Minnie, City of Cape Town, July 2007

People’s perception - Flooding, Java
The annual flood comes every rainy
season; big floods come with five years
return period.
Gotong royong
Location factors: Proximity to livelihood
rather than safety
The root causes of flooding :are banjir
kiriman, garbage blocking the river
channel, and excessive rainfall.

Mapping Vulnerability & Coping
Spatial elements are:
Event Locations
People locations
Distance from sources
Proximity to shelter, support, etc.
Networks – transport, communications
Networks – supporting mechanisms
Spatial Thresholds – environmental. social
Land cover and land uses

Distribution of each structural
type of building
Ja tinegara B
ara t Road
Ciliwung River
Bali Mester
SubdistrictBukit Duri
Subdistrict
Kebon Manggis Subdistrict N
Map Projection : UTM 48S
Datum : WGS 1984
0.16 0 0.16KmScale 1:8.000
#S
#S
#S #S
#S
#S #S
#S
#S
#S
#S
#S#S #S
#S
#S
#S
#S
#S
#S#S
#S
#S
#S
#S
#S
#S#S#S
#S
#S
#S
#S
#S
#S#S
#S
#S
#S
#S#S
#S
#S
#S
#S
#S
#S
#S#S
#S#S
#S
#S
#S
#S#S
#S
#S
#S#S
#S
#S
#S
#S
#S#S
#S#S
#S
#S#S
RiverRailway
Footprint
Road
Structure type 3#S
Structure type 2#S
Structure type 1#S
Structural type:
#S Structure type 4#S Structure type 5

Vulnerability Assessment –
0
0.2
0.4
0.6
0.8
1
0 100 200 300 400 500
Water depth inside the house (cm)
Vu
lne
rab
ilit
y Structure 1
Structure 2
Structure 3
Structure 4
Structure 5
Structural Vulnerability
Class
Vulnerability
No Vulnerability 0
Low Vulnerability <=0.2
Moderate Vulnerability <=0.5
High Vulnerability <=0.8
Very High Vulnerability <=1

Vulnerability Assessment –
Building Content
BC Vulnerability Class Vulnerability
No Vulnerability 0
Low Vulnerability <=0.2
Moderate Vulnerability <=0.5
High Vulnerability <=0.8
Very High Vulnerability <=1
Assumptions:
Located in bedrooms, living room,
dining rooms and kitchen.
Three socio-economic levels have
different values of building
contents.
Value of articles differs related to
the income level; and the number
of items increases with the
economic class.

Coping Capacity & Coping Mechanisms
TECHNOLOGICAL /
STRUCTURAL ECONOMIC SOCIAL
BEFORE FLOODING
Long term:
1. Build a secure place
2. Build the house with
more than one floor
3. Cleaning the canal
4. Construct house using
the concrete material
Long term:
1. Store basic food items
2. Store clothes and
valuable things in the
plastic bag
3. Store the properties in
higher place
Long term:
1. Cleaning the house and
surroundings together
(gotong royong)
2. Discuss with other
households about the
action plan to cope with
flood
Short term:
1. Placing the motorcycle
in safe place
2. Put sand bags in front of
the house to barrier the
water
Short term:
1. Prepare the cooking
equipment
2. Prepare baby’s stuffs
(clothes, blankets, etc),
light and battery
Short term:
1. Check the water depth in
Watergate
2. Placing properties in
relative’s or neighbor’s
house

Coping Capacity & Coping Mechanisms
DURING FLOODING
1. Evacuate personal
goods to the higher
place
2. Evacuate the children,
pregnant women and
the elderly
3. Rescue the important
documents
4. Tie a rope in dangerous
places
Long term:
1. Find alternative jobs
2. Extra money for buying
the food
3. Continue to work
4. Can not go to work …
reasons?
Long term:
1. Stay at evacuation
centre/neighbors/relatives
2. Help each other during
evacuation
3. Guard their house
4. Disseminate flood
information
5. Share their food and water
IMMEDIATE POST- FLOOD
1. Repairing the damage
2. Sourcing house
materials
3. Cleaning the mud from
house and furniture
4. Drying wet clothes,
furniture, etc
1. Sell goods
2. Borrowing money from
relatives or friends
1. Clean up the mud and
debris after the flood
together (gotong royong)

Coping Mechanisms

Why ‘Spatial’ Knowledge
What are the spatial features?
What spatial elements need to be mapped?

Mapping Social Vulnerability & Coping
Capacity
Spatial elements are:
Distance from sources
Proximity to shelter, support, etc.
Networks – transport, communications
Networks – supporting mechanisms
Thresholds – environmental. Social
Land cover and land uses

P-Mapping and PGIS in CRA
“Natural” Hazards
Point
location
Spatial
Extent
Frequency Vulnerability
measures
Contributory
Causes
Floods √ √ √ √
Landslips /
faults
√ √ √
Bush fires √ √ √
Township
fires
√ √ √ √
Storms, Wind √ √ √
Pest
outbreaks
√ √
Drought √ √ √
Rare events √ √

P-Mapping and PGIS in Community
Hazard Assessment
Economic
Activities
Point
locatio
n
Spatial
Extent
Frequenc
y
Vulnerability Contributory
Causes
Air Pollution √ √ √ √ √
Hazardous
wastes
√ √ √
√
Water pollution
- illegal
discharges, etc
√ √ √ √
√


P-Map in Community Risk Assessment
Urban Neighbourhoods
Urban hazards:
Landslides,
Urban fires.
Flood risk assessment –
damage, vulnerability

P-Map in Community Risk Assessment
Urban Municipalities
Volcano areas
threatening urban
expansion Mexico
Landslides
Tsunamis
Industrial air pollution,
Haryana, Mexico DF
Community involvement
in siting of LULUs (locally
unacceptable land uses)

Urban Hazards: Refuse, Traffic
The Daily Hazards

Environmental Equity
no subpopulations bear
disproportionate risk from
environmental hazards
distributional equity of outcomes,
and equity during the (causal)
planning processes.
Environmental justice spatial
distribution of environmental
impacts
Environmental Equity & Justice

Social Hazards
Crime, Drugs, Accidents
Mapping the realities and the perceptions of social dangers and safety and lifestyle hazards, crime and security.
Urban issues: anti-social behaviour, street drunkenness, street and house crime, drug dealing, road and other accidents, robbery and rape.
Links to gender issues, especially women‟s actual and perceived spaces, and to children‟s safe spaces.
Mapping of public (individual and group) perceptions and attitudes towards sites of presumed social risks e.g. prisons, drug rehab centres, asylum / immigration centres.

Egs. Social Hazards, Crime, Health
Neighbourhood environmental information system for inner-city communities, Cleveland, tracking hazards.
Local knowledge of environmental risk of breast cancer. UK
Spatial /social associations between HIV and youth violence: Dar es Salaam
Photo mapping and PGIS with residents of a low-income urban fringe, Mexico - hazards from crime, drug-dealing, lack of policing, poor street lighting etc. outweighed the hazards due to flash floods, landslips, garbage dumping,

Mapping Urban Security with Aerial
Photos

Counter Maps – Competing Views of
Spatial Information
Knowledge represent different viewpoints, needs,
priorities, problems, values of local actors,
(different from dominant „official‟ view, & other
local actors).
Different viewpoints reflected in ‘counter maps’.
Counter maps of gendered spaces, esp.
women‟s maps of accessibility, vulnerability.
Children, landless, resource-poor, subordinate
ethnics or castes - dedicated counter-maps.

Gendered Risk Spaces Equity, Legitimacy
Ignorance – of Women‟s specialised K of
hazards and risks & risk management.
Double (triple) labour burdens.
Gendered spaces are different in character and
value and use.
Exclusion
Women‟s space, mobility & opportunities may be
very restricted (due to culture, or danger)
E.g. house fires, earthquakes, tsunami (SL). Safe
places, refuges
Invisibility – Spatial scale of women´s activities.
Women‟s space may not be visible, nor easily
transferable to conventional GIS

Mapping Children Safety & Security
Children‟s journey to school
Road safety
Play areas
Environmental & pollution hazards
Drowning hazards
Animal & Human dangers, Drugs

Children’s Space
radical participatory planning USA & Canada 1970s William Bunge, “Society for Human Exploration”, “Detroit Geographical Expedition”,
Items & map legend of Geography of the Children of Detroit include: automobiles, trucks, dogs, cats, green shrubs & trees, dead shrubs & trees, bicycles, … rubbish, trash, broken bottles, paper. litter cans, …
Atlas of Love and Hate mapped “areas friendly to children” and “areas hostile to children”.
Children’s cognitive map Tukwila

Mapping Children’s Spaces

Mapping the Journey to School
Mapping behaviour pattern of school
children as road users (mainly pedestrian,
also bus & other vehicles) on travel to/from
school.
Children‟s mobility and road use behaviour.


Some applications

Mapping Lost Homes
Drawing & painting are therapeutic after trauma of
surviving disasters, wars, earthquakes, tsunami,
especially for children – who can map their „lost
home spaces‟, e.g. play areas, relatives‟ homes,
schools, shopping, recreation, playgrounds, „secret
sites‟, dangerous areas
Memories of home & community need preserving,
“home map” recreates child‟s lost neighbourhood.
Maybe the only preserved spatial records for the
older generations

TOOLS – mapping lost homes
Sketch maps; plastic overlays on topographic maps, tourist map; best on aerial photos; 3D models.
Symbology (map legend) selected and placed by the children
Digitally photograph the children‟s map for preservation

Fear maps

Bio Mapping
The Bio Mapping tool allows the wearer to record
their Galvanic Skin Response (GSR), which is a
simple indicator of emotional arousal in
conjunction with their geographical location. This
can be used to plot a map that highlights point of
high and low arousal. By sharing this data we
can construct maps that visualise where we as a
community feel stressed and excited.
http://biomapping.net/index.htm Christian Nold

Bio Mapping (C. Nold)

Risk map (www.risicokaart.nl)

Risk map (www.risicokaart.nl)
Transport

Risk map (www.risicokaart.nl)
Nuclear Accident Zones

Risk map (www.risicokaart.nl)
Hazard contours

Risk map (www.risicokaart.nl)
Flood risk

Crime mapping (www.misdaadkaart.nl)

Crime map (www.misdaadkaart.nl)
Online crime statistics and location

Crime map (www.misdaadkaart.nl)
Online crime statistics and location

Crime map (www.misdaadkaart.nl)
Online crime statistics and location

Post-Disaster emergency Mapping
MapAction, UK-based specialist volunteers, support humanitarian operations provide spatial data & mapping capabilities in the field. Large-scale maps focused on specific relief requirements sectoral overlays. http://www.mapaction.org/
GISCorps since 2003 volunteer basis. GISCorps volunteers reside in USA and work collaboratively. Emergency & relief work in: Andaman Is. Tsunami. With Global MapAid, post-tsunami; Katrina USA, Afghanistan; Armenia, Hungary, Kenya. Marshall Is., Mali, Namibia
http://www.giscorps.org/
Global MapAid, supplies specialist maps to emergency & humanitarian aid. Aid Workers, GIS Analysts, web developers. Map crisis hotspots by capturing data in slow onset disasters such as food security, drought, HIV monitoring, refugee programs e.g. UN WFP. Also rapid onset disasters such as floods.
http://www.globalmapaid.rdvp.org/

Campus dangers – UNAM. Mexico DF

1
2 3
4
5
6
7 8
9
10

1
2 3
4
5
6
7 8
9
10

1
2 3
4
5
6
7 8
9
10

Manuals and Toolboxes (using PGI) ACTIONAID
PVA Participatory Vulnerability Analysis
Focus groups. Historical profiles, Vulnerability map, seasonal calendar. Livelihood analysis, problem trees, concept mapping?, Coping matrix, venns, scenarios, timelines
Action Aid Participatory Vulnerability Analysis (PVA) Case Studies
Johannesburg: Action Aid
http://www.actionaid.org/wps/content/documents/PVA%20case%20studies%20Final.pdf
CEPREDENAC
Local Risk Management
Lavell, Allan with Elizabeth Mansilla and David Smith (2003)
Local Risk Management: Ideas and Notions relating to Concept and Practice.
Guatemala: CEPREDENAC Centro de Coordinación para la Prevención de los Desastres Naturales en América Central, CEPREDENAC – PNUD; and: Geneva: UNDP, Regional Programme for Risk Management in Central America. (62p.)
http://www.crid.or.cr/digitalizacion/pdf/eng/doc15784/doc15784-contenido.pdf

ProVention
ProVention
Measuring Mitigation. Tools for Mainstreaming Disaster Risk Reduction
Collecting & using Info on Natural Hazards
Economic appraisal; environmental appraisal , Log Frames; M & E; appraisal of Institutions
Vulnerability & Capacity Analysis (VCA) (cf. VA, SIA, HIA, livelihoods analysis)
Sustainable Livelihoods Approaches; 2ry data; sample surveys, Interviews, HH Case studies; Envir. Checklists, Timelines, Seasonal calendars, mapping, Ranking methods, Venns, Shocks & Trends Indicators
Risk Assessment - hazard mapping, forecasts, economic appraisal, social appraisal
ProVention (2006?) Community Risk Assessment Methodologies and Case Studies.
Compiled by Maya Schaerer. Geneva: ProVention.
http://www.proventionconsortium.org/?pageid=43 or, go to main website www.proventionconsortium.org
Working with women at risk: practical guidelines for assessing local disaster risk. International Hurricane Research Centre, Florida International

Manuals and Toolboxes (using PGI)
ADPC - CBDRM Community based disaster Risk Management
Disaster Risk Assessment : Gender analysis Gender Needs Activity Profiles
vulnerability assessment , Timeline. Hazard & Resources Map, Seasonal Calendar, Ranking. Transect. Historical Transect. Matrix Ranking. Proportional Piling,
CBDRM Field Practitioners‟ Handbook
Abarquez, Imelda; and Zubair Murshed (2004) Pathumthani, Thailand: ADPC (163p.)
http://www.adpc.net/pdr-sea/publications/12Handbk.pdf
GTZ
CBDRM Community Based Disaster Risk Management
Timelines actor mapping. Problem trees ranking venns vulnerability & capacity analysis
SSI Participatory observation Social / Wellbeing Ranking
Bollin, Christina (2003) Community-Based Disaster Risk Management Approach. Experience gained in Central America. Eschborn: GTZ , Division 4200 Governance and Democracy. http://www.gtz.de/de/dokumente/en-community-based-drm.pdf
IFRC
VCA Vulnerability & Capacity Assessment
e.g. Solomon Islands
Stakeholder analysis; seasonal calendar; Cause analysis, SWOT Community Mapping. Scoring & ranking of health problems Food security SSI etc


Armero, Colombia