30p. · DOCUMENT RESUME. ED 414 464 CE 075 386. AUTHOR Crown, William H.; Leavitt, Thomas D. TITLE...
31
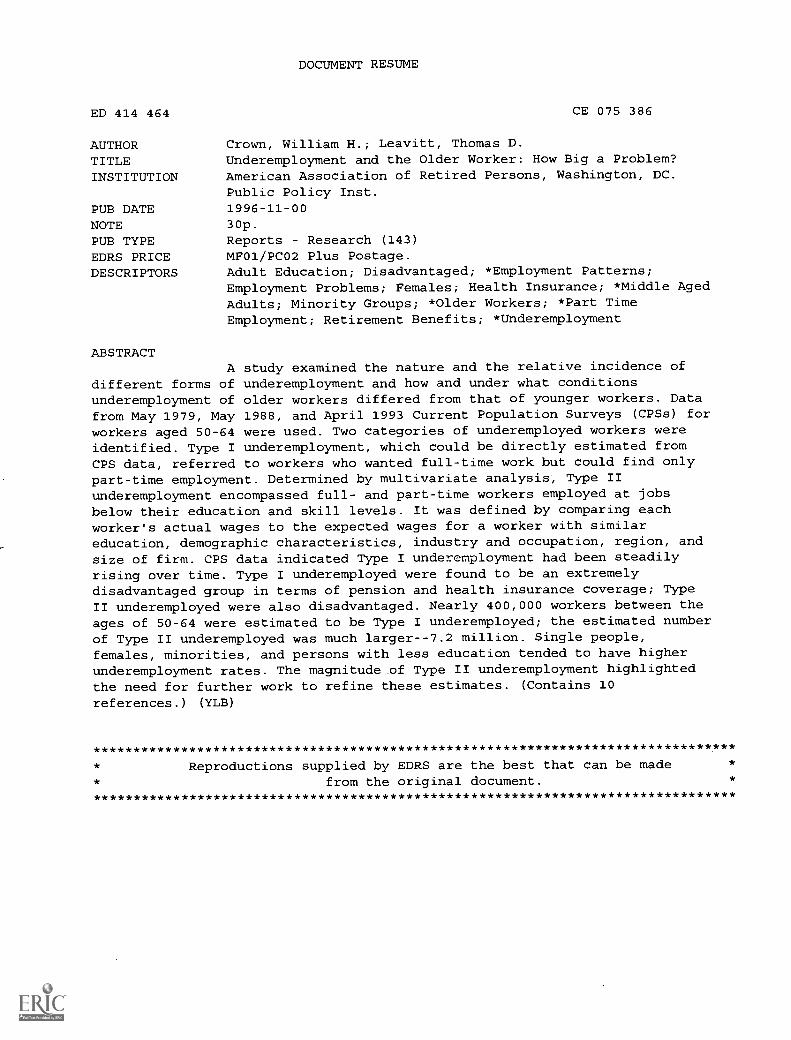
DOCUMENT RESUME ED 414 464 CE 075 386 AUTHOR Crown, William H.; Leavitt, Thomas D. TITLE Underemployment and the Older Worker: How Big a Problem? INSTITUTION American Association of Retired Persons, Washington, DC. Public Policy Inst. PUB DATE 1996-11-00 NOTE 30p. PUB TYPE Reports Research (143) EDRS PRICE MF01/PCO2 Plus Postage. DESCRIPTORS Adult Education; Disadvantaged; *Employment Patterns; Employment Problems; Females; Health Insurance; *Middle Aged Adults; Minority Groups; *Older Workers; *Part Time Employment; Retirement Benefits; *Underemployment ABSTRACT A study examined the nature and the relative incidence of different forms of underemployment and how and under what conditions underemployment of older workers differed from that of younger workers. Data from May 1979, May 1988, and April 1993 Current Population Surveys (CPSs) for workers aged 50-64 were used. Two categories of underemployed workers were identified. Type I underemployment, which could be directly estimated from CPS data, referred to workers who wanted full-time work but could find only part-time employment. Determined by multivariate analysis, Type II underemployment encompassed full- and part-time workers employed at jobs below their education and skill levels. It was defined by comparing each worker's actual wages to the expected wages for a worker with similar education, demographic characteristics, industry and occupation, region, and size of firm. CPS data indicated Type I underemployment had been steadily rising over time. Type I underemployed were found to be an extremely disadvantaged group in terms of pension and health insurance coverage; Type II underemployed were also disadvantaged. Nearly 400,000 workers between the ages of 50-64 were estimated to be Type I underemployed; the estimated number of Type II underemployed was much larger--7.2 million. Single people, females, minorities, and persons with less education tended to have higher underemployment rates. The magnitude of Type II underemployment highlighted the need for further work to refine these estimates. (Contains 10 references.) (YLB) ******************************************************************************** Reproductions supplied by EDRS are the best that can be made from the original document. ********************************************************************************
Transcript of 30p. · DOCUMENT RESUME. ED 414 464 CE 075 386. AUTHOR Crown, William H.; Leavitt, Thomas D. TITLE...
DOCUMENT RESUME
ED 414 464 CE 075 386
AUTHOR Crown, William H.; Leavitt, Thomas D.
TITLE Underemployment and the Older Worker: How Big a Problem?
INSTITUTION American Association of Retired Persons, Washington, DC.Public Policy Inst.
PUB DATE 1996-11-00NOTE 30p.
PUB TYPE Reports Research (143)
EDRS PRICE MF01/PCO2 Plus Postage.DESCRIPTORS Adult Education; Disadvantaged; *Employment Patterns;
Employment Problems; Females; Health Insurance; *Middle AgedAdults; Minority Groups; *Older Workers; *Part TimeEmployment; Retirement Benefits; *Underemployment
ABSTRACTA study examined the nature and the relative incidence of
different forms of underemployment and how and under what conditionsunderemployment of older workers differed from that of younger workers. Datafrom May 1979, May 1988, and April 1993 Current Population Surveys (CPSs) forworkers aged 50-64 were used. Two categories of underemployed workers wereidentified. Type I underemployment, which could be directly estimated fromCPS data, referred to workers who wanted full-time work but could find onlypart-time employment. Determined by multivariate analysis, Type IIunderemployment encompassed full- and part-time workers employed at jobsbelow their education and skill levels. It was defined by comparing eachworker's actual wages to the expected wages for a worker with similareducation, demographic characteristics, industry and occupation, region, andsize of firm. CPS data indicated Type I underemployment had been steadilyrising over time. Type I underemployed were found to be an extremelydisadvantaged group in terms of pension and health insurance coverage; TypeII underemployed were also disadvantaged. Nearly 400,000 workers between theages of 50-64 were estimated to be Type I underemployed; the estimated number
of Type II underemployed was much larger--7.2 million. Single people,females, minorities, and persons with less education tended to have higherunderemployment rates. The magnitude of Type II underemployment highlightedthe need for further work to refine these estimates. (Contains 10references.) (YLB)
********************************************************************************Reproductions supplied by EDRS are the best that can be made
from the original document.********************************************************************************
#9619November 1996
Underemployment and the Older Worker:How Big a Problem?
by
William H. Crown and Thomas D. LeavittAnalytic Resources
U S DEPARTMENT OF EDUCATIONlice of Educational Research
and Improvement
E CATIONAL RESOURCES INFORMATION
CENTER (ERIC)This document has been reproduced asreceived from the person or organization
originating itMinor changes have been made to
improve reproduction quality
Points of view or opinions stated in this
document do not necessarily represent
official OERI position or policy
BEST COPY AVAILABLE
PERMISSION TO REPRODUCE ANDDISSEMINATE THIS MATERIAL
HAS BEEN GRANTED BY
TO THE EDUCATIONAL RESOURCESINFORMATION CENTER (ERIC)
#9619November 1996
Underemployment and the Older Worker:How Big a Problem?
by
William H. Crown and Thomas D. LeavittAnalytic Resources
Sara E. Rix, Ph.D.Project Manager
The Public Policy Institute, formed in 1985, is part of theDivision of Legislation and Public Policy of the AmericanAssociation of Retired Persons. One of the missions of theInstitute is to foster research and analysis on public policy issuesof interest to older Americans. This paper represents part ofthat effort.
The views expressed herein are for information, debate, anddiscussion, and do not necessarily represent formal policies ofthe Association.
© 1996, American Association of Retired Persons.Reprinting with permission only.AARP, 601 E Street, NW, Washington, DC 20049
3

Table of Contents
Foreword
Executive Summary ii
Introduction 1
Previous Research on Underemployment 1
Methods 3
Type I Underemployment 4
Type II Underemployment 4
Type I Underemployment: Descriptive Findings 4
Type I Underemployment Among Workers Between the Ages of 50 and 64 5
A Profile of the Type I Underemployed 9
Levels of Type I Underemployment in Other Age Groups 10
Pension Coverage, Pension Receipt, and Health Insurance Coverage 11.
A Multivariate Model of Type I Underemployment 13
Type II Underemployment of Older Workers 14
Region, Gender, and Marital Status 15
Race 18
Education 18
Industry and Occupation 19
Health Insurance and Pension Coverage 19
Type I Underemployment 19
Directions for Future Research 20
Conclusions 21
References 22
Foreword
Underemployment, in the view of some employment observers, may be at least as serious aproblem as unemployment, especially among older workers who have been downsized before theyare ready to retire. These workers may be forced into jobs that are not commensurate with theones they lost, or with their skills and abilities. Nonetheless, while anumber of studies haveexamined underemployment, as well as job change and downward mobility, the issue ofunderemployment and the older worker has received scant attention. Analyses by theCongressional Budget Office (CBO) in 1993 point to the potential severity of underemploymentfor older displaced workers, who, upon job loss, are far less likely than their younger counterpartsto become reemployed and far more likely to leave the labor force. When older displaced workersdo find work, they are also apparently more likely than younger job finders to experience a sizableearnings decline. For example, according to the CBO, over half of aged 60-plus workersdisplaced in the 1980s who eventually managed to find work ended up earning less than 80percent of what they had been earning in their old jobs. They were, in fact, nearly 15 percentagepoints more likely than workers between the ages of 18 and 34 to experience an earnings loss ofthis magnitude.
Concern about the extent to which older workers, perhaps as a result of corporate down-sizing, restructuring, reengineering, and/or the growth of the contingent workforce, might beexperiencing underemployment led the Public Policy Institute to commission research aimed atanswering a very basic question: How big a problem is underemployment for older workerstoday? Underemployment has consequences not only for current income and well-being but forretirement-income security as well.
Undertaken by William Crown and Thomas Leavitt of Analytic Resources, the studydiscussed in this report was designed to examine the nature and extent of underemployment, witha particular focus on who is underemployed, what underemployment consists of, and how andunder what conditions the underemployment of older workers might differ from that of youngerworkers. Using the Current Population Survey for 1979, 1988, and 1993, Crown and Leavittlooked at two groups of underemployed workers: (1) workers who are employed part-timebecause they cannot find full-time work and (2) workers who are employed in jobs below theirskill and education levels. To their knowledge, this is the first study to focus specifically on theunderemployment of older workers, a study that concludes that underemployment characterizes asizable portion of the older pre-retirement workforce. Crown and Leavitt report that nearly400,000 workers between the ages of 50 and 64 were underemployed because they could not findfull-time work. Though further refinements of the Type II estimates are called for--job tenure, inparticular, needs careful consideration--preliminary estimates suggest that perhaps as many as 7.2million 50-to-64-year-old workers are employed in jobs below their skill and/or educational leveland hence qualify as underemployed according to the second definition.
Sara E. RixEconomics TeainPublic Policy Institute

Executive Summary
Background
The underemployed have received less attention from researchers and policymakers than theunemployed, but knowing the nature and scope of underemployment is important for a fullunderstanding of the work-retirement transition as it has evolved over the years. Furthermore,current concerns about the implications of population aging for Social Security financing have ledto a greater emphasis on programs or policies designed to increase the labor force participation ofolder persons. Without understanding the current barriers to full employment experienced by theunderemployed, such policies might well have unintended consequences. For instance, scheduledincreases in the actuarial reductions of Social Security benefits associated with early retirementmay have serious equity implications, forcing many low-income workers to remain in the laborforce, while having little impact on the retirement decisions of higher-income workers.
Purpose
Underemployment and the Older Worker: How Big a Problem? was designed to examine thenature and the relative incidence/importance of different forms of underemployment, as well ashow and under what conditions the underemployment of older workers differs from that ofyounger workers. The basic question the investigators were asked to address was: How big aproblem is underemployment for older workers today?
Methodology
Data from the May 1979, May 1988, and April 1993 Current Population Surveys (CPS) wereused in the research. William Crown and Thomas Leavitt of Analytic Resources examine twotypes of underemployment, which they term Type I and Type II underemployment. Type Iunderemployment, which can be directly estimated from CPS data, refers to workers who wantfull-time work but can only find part-time employment.
Type II underemployment encompasses full- and part-time workers employed at jobs belowtheir education and skill levels. The investigators employed a multivariate approach to examinethis type of underemployment. For their purposes, Type II underemployment was defined bycomparing each worker's actual wages to the expected wages for a worker with similar education,demographic characteristics, industry and occupation, region, and size of firm. Expected wageswere calculated by estimating a multiple regression model of wages and then using this model topredict the wages for each worker, given his or her characteristics. If a worker's actual wage wasless than or equal to 75 percent of the expected wage, that worker was classified as under-employed according to the Type II definition.
6
ii

Principal Findings
This study appears to be the first to focus specifically on the underemployment of olderworkers. CPS data for 1979, 1988, and 1993 indicate that Type I underemployment--workerswho want but cannot find full-time employment--has been steadily rising over time. The Type Iunderemployed were found to be an extremely disadvantaged group in terms of pension andhealth insurance coverage.
The Type II definition of underemployment among older workers was based on wages. Aswith the Type I underemployed, the investigators found that workers classified as underemployedby the Type II definition were disadvantaged.
Nearly 400,000 workers between the ages of 50 and 64 were estimated to be underemployedaccording to the Type I definition. The estimated number of underemployed by the Type IIdefinition was much larger, 7.2 million. Approximately 61 percent of the Type I underemployedwere also underemployed according to the Type II definition.
Conclusions
The magnitude of the numbers, particularly with respect to Type II underemployment,underscores the potential significance of underemployment for older workers. However, theestimated magnitude of Type II underemployment was very sensitive to the wage threshold used,an observation that highlights the desirability of further work to refine the estimate of the numberof Type II underemployed. Nonetheless, the fact that the Type II estimates of underemploymentwere much larger than the Type I estimates, even using the most stringent criteria of theinvestigators, illustrates the potential significance of this type of underemployment for olderworkers.
7
iii
Underemployment and the Older Worker: How Big a Problem?
Introduction
In recent years, the transition from full labor force participation to retirement has becomeconsiderably more varied. The availability of pension benefits for workers in their 50s and thepopularity of early retirement incentive programs (ERIPs) that encourage early departures fromlong-term jobs have resulted in an increasing pool of younger workers who have "retired" beforebecoming eligible for Social Security benefits. This pool has been further increased bydiscouraged older workers forced out of downsizing companies. Some may be able to affordretirement, but many cannot. Moreover, many of these individuals want to work (Quinn andBurkhauser 1994). Studies have shown that 30 to 40 percent of such retirees eventually reenterthe labor market (Ruhm 1990). However, although some of these jobseekers find theemployment situations they are looking for, others have difficulty. In particular, many olderworkers cannot find the amount of work they want, and others are employed in jobs below theireducation or skill level. These are the underemployed.
The underemployed have not received the attention from researchers and policymakers thatthe unemployed have received. Knowing the nature and scope of underemployment, however, isimportant to a full understanding of the work-retirement transition as it has evolved over theyears. Furthermore, current concerns about the implications of population aging for SocialSecurity financing have led to greater emphasis on programs or policies designed to increase thelabor force participation of older persons. Without taking into consideration the current barriersto full employment experienced by the underemployed, such policies might well have unintendedconsequences. For example, scheduled increases in the actuarial reductions of Social Securitybenefits associated with early retirement may have serious equity implications, forcing many low-income workers to remain in the labor force, while having little impact on the retirement decisionsof higher-income workers.
Previous Research on Underemployment
According to Nord, Phelps, and Sheets (1989), researchers have defined underemployment ina variety of ways since the mid-1960s. Definitions have ranged from employment in jobs below aworker's educational and skill level, to inability to get a full-time job, to indices designed tomeasure inadequate earnings. Although there is a fairly substantial literature onunderemployment, we were not able to identify any studies of underemployment that havefocused specifically on workers aged 65 or older. Most studies of underemployment have tendedto look at workers under 65 (see, e.g., Nord, Phelps, and Sheets 1989). Others have included theelderly as a subgroup in analyses but have not explicitly discussed the findings for workers 65 orolder. As a case in point, Jacobs (1993) includes the age categories 55 to 64 and 65-plus intables of the labor force transitions of underemployed workers but does not single them out forspecial attention.
Jacobs defines underemployed workers as persons who are working part-time for economicreasons. Workers considered underemployed for economic reasons include those who "couldonly find part-time work" or who were working part-time because of "slack work or materialshortages." Although Jacobs does not discuss the results for older underemployed workers in hispaper, the data presented in his tables highlight striking differences in the pathways out ofunderemployment for older male and female workers.
Jacobs shows, for example, that 53 percent of underemployed women aged 65 or older in1975 remained part-time workers in 1976, while 5 percent switched to full-time work, 11 percentbecame unemployed, and 31 percent left the labor force. The pattern was similar for transitionsover 1987-88. During the latter period, 55 percent of the older underemployed women remainedpart-time in 1988, while 9 percent switched to full-time, 3 percent became unemployed, and 34percent left the labor force.' Considering the small sample sizes (39 for 1975-76 and 49 for 1987-88), these patternsespecially for those who remain part-time or retire--appear to be remarkablystable.2
Interestingly, the transition patterns of underemployed older men appeared to changeconsiderably between 1975-76 and 1987-88. Over 1975-76, 40 percent of underemployed men65 and older continued part-time, 6 percent switched to full-time, 11 percent became unemployed,and 43 percent left the labor force. In contrast, in the 1987-88 time frame, 63 percent remainedpart-time, 5 percent switched to full-time, 6 percent became unemployed, and 26 percent left thelabor force. Thus, the proportion of older underemployed men remaining part-time increased by23 percentage points over 1975-76 to 1987-88, while the percentage leaving the labor forcedeclined from 43 percent to 26 percent.3
What interpretation can be given to these trends? The stability of the labor force transitions ofunderemployed females aged 65 and older is broadly consistent with the relative stability of theirlabor force participation rates over time. In contrast, the increasing proportion of underemployedmen 65 and older who remain part-time workers and the decreasing proportion who leave thelabor force are at odds with the declining labor force participation rates of older men in general.Is this indicative of fundamental differences in the labor force behavior of underemployed versustypical older workers? Or is it a result of a flaw in the definition of underemployment for olderworkers?
1 Due to rounding, totals here and in some tables may not always sum to 100.
2The sample sizes for underemployed women who shift to unemployment or full-time employment are too small tosupport reliable inferences.
3Peracchi and Welch (1994) conducted a similar analysis that focused on the labor force transitions of older menand women. However, their analysis is broader in scope and does not deal specifically with underemploymentamong older workers.
A related issue is the trend in underemployment among older workers over time. Several authors (e.g., Blank1990, Ichiowski and Preston 1986) have demonstrated that the rate of underemployment for the labor force ingeneral has been rising for the past two decades. They present no information on the trend in underemploymentamong workers 50 and older.
9Page 2
Methods
In this paper, two categories of underemployed workers are identified: (1) Type Iunderemployed, which refers to part-time workers who cannot find full-time employment, and (2)Type II underemployed, defined as full- or part-time workers employed at jobs below theireducation and skill levels. Current Population Survey (CPS) data are used to examine the natureand extent of both types of underemployment.
The CPS is a monthly survey of the civilian noninstitutionalized population. Conducted forover 50 years, its primary purpose is to serve as the official source for federal governmentstatistics on employment and unemployment. The CPS also provides detailed information ondemographic characteristics, educational attainment, economic status, and labor market activitiesof U.S. households.
The two types of underemployment require different strategies for analysis. In May 1979,May 1988, and April 1993, the CPS included supplemental surveys on employee benefits. Sinceinformation on pension and health insurance benefits is important for understanding the extent towhich an older worker's employment situation is voluntary, the analysis of Type Iunderemployment is based on 1979, 1988, and 1993 CPS data. The analysis of Type IIunderemployment, which requires a multivariate approach, is based on the April 1993 CPS only.
These analyses focus on the underemployed aged 50 and older. Although this is the age rangewhere physical limitations, in combination with job characteristics (e.g., heavy lifting, repetitivemotion), may force some workers to cut back on the number of hours they are working, it isimportant to recognize that workers employed less than full-time due to physical limitations arenot the same as workers unable to find full-time employment.
Age 50 is also generally the earliest year that individuals are allowed to collect employerpension benefits. Some older persons with large expected retirement incomes may decide to workin part-time or full-time jobs that would initially lead to their classification as underemployed.One of the most difficult challenges of defining underemployment among older workers isdistinguishing those who are "underemployed" at full-time jobs by choice from those who areunderemployed because they cannot find work at their education or skill level.
As described below, we believe that pension and health coverage data are useful in helping tomake this distinction, although this is undoubtedly an area where more research would be fruitful.The 50-to-64 age group permits the inclusion of a sample of workers who may be displaced fromdownsizing companies. These workers are also likely to be underemployed as they experiencedifficulties finding jobs that fully utilize their education and skill levels. Despite the fact that wedo not separately identify displaced workers in our analysis, this group is often targeted indownsizing efforts, especially in ERIPs.4
4For a recent review of the literature regarding ERIPs, see Mutschler (1996).
Page 3
0

Type I Underemployment
Part-time workers who desire but cannot find full-time work can be directly identified fromCPS data. Workers who usually work less than 35 hours per week are asked the reason why theywork less than 35 hours. For our analyses of Type I underemployment, respondents who said thatthey "could find only part-time work" were designated as underemployed workers.
Type II Underemployment
Many studies have defined underemployment in terms of inadequate earnings. Yet, the failureto earn adequate earnings (usually defined as exceeding 125 percent of the poverty level)5 is notnecessarily indicative of underemployment. Many individuals who earn low wages may simplyhave poor job skills and low productivity. As a consequence, in the present study, Type IIunderemployment is defined in a new way. First, a multivariate model of wages as a function ofeducation level, gender, race, region of the country, industry, and occupation generates apredicted value for wages for each person given his or her characteristics. Then, the actual wagethat the person was paid is compared to the predicted wage. If the actual wage is more than 25percent lower than the predicted wage, the individual is categorized as underemployed by theType II definition.
Type I Underemployment: Descriptive Findings
As noted above, workers are categorized as Type I underemployed if they are working part-time and they desire but cannot find full-time work. In this section, Type I underemploymentamong workers between the ages of 50 and 64 in 1979, 1988, and 1993 is examined. This isfollowed by a profile of the Type I 50-to-64-year-old underemployed population, which depictsthe underemployed in terms of their gender, marital status, education, race/ethnicity, and unionstatus. This profile is compared to the profiles of other part-time workers and full-time workersin the same age group.
The incidence of Type I underemployment in the 50-to-64 age group is then compared toType I underemployment among both younger (under 50) and older (65-plus) workers. Finally,pension coverage, pension receipt, and health insurance coverage within the 50-to-64-year-oldType I underemployed population are examined. Since this study looks at workers who, bydefinition, are working less than they would like, it is relevant to examine the extent to which theirunderemployment may be a threat to their health coverage and to their retirement-income securityas they approach retirement age.
5See, for example, Nord, Phelps, and Sheets (1989).
Page 4

Type I Underemployment Among Workers Between the Ages of 50 and 64
Type I underemployment among part-time workers between the ages of 50 and 64 grew 111percent during the 1979-1993 period, from 187,037 to 394,718 persons (Figure 1). In otherwords, in 1993 there were over 200,000 more middle-aged workers who wanted full-time workbut could only find part-time employment than there had been in 1979. Still, although theunderemployment rate doubled during the same period, the Type I underemployed between theages of 50 and 64 represented a small proportion of the middle-aged workforce in both 1979 and1993 (1 percent and 2 percent, respectively).
Figure 1Type I Underemployed, Aged 50 to 64:
1979, 1988, and 1993
Source: Authors' calculations of Current Population Survey data.
The underemployed also became a larger percentage of the middle-aged, part-time workforceover the years. In 1979, 5.3 percent of part-time workers between the ages of 50 and 64 wereType I underemployed. This number grew to 8 percent in 1988 and 8.9 percent in 1993.
Considerable variation exists in the Type I underemployment rate along a number ofdimensions, as can be seen in Table 1. Underemployment rates often mirror unemployment rates.Single people, females, minorities, and persons with less education tend to have the higherunderemployment rates. For example, in 1993, the underemployment rate for middle-aged single6individuals was twice the rate for married persons (3.3 percent vs. 1.6 percent); females werenearly three times more likely to be underemployed than males (3.2 percent vs. 1.1 percent);blacks (4 percent) and Hispanics (3.8 percent) were more than twice as likely to be Type Iunderemployed as whites (1.7 percent); and workers with a high school education or less weremore than twice as likely to be underemployed as those who had a college degree or apostgraduate education. As of 1993, however, there was little variation by age within the 50-to-64 age group. Nor were regional differences all that pronounced.
6 "Single" includes all nonmarried respondents.
Page 5 12

TABLE 1
TYPE 1 UNDEREMPLOYMENT RATES OF WORKERS AGED 50-64,BY SELECTED CHARACTERISTICS: 1979, 1988 AND 1993
Characteristic
Percent of All Workers Age 50to 64 Who Are Type I
Underemployed
Percent of Part-time WorkersAged 50 to 64 Who Are Type 1
Underemployed
1979 1988 1993 1979 1988 1993Age
50-54 1.0 1.8 2.0 6.1 10.3 10.555-59 0.9 1.7 2.0 5.0 8.6 9.360-61 0.9 1.5 2.3 5.0 6.6 8.962-64 1.3 1.0 2.2 4.3 3.1 5.8
GenderMale 0.5 0.9 1.1 4.4 7.0 7.4Female 1.8 2.6 3.2 5.7 8.5 10.1
Marital StatusMarried 0.7 1.3 1.6 4.0 6.6 7.2Single 2.1 2.8 3.3 10.1 12.3 14.4
Education8th grade or less 1.7 3.5 2.5 7.7 15.5 10.0
Some high school 1.3 2.7 5.6 6.7 12.8 21.3High school graduate 0.9 1.6 2.2 4.7 7.3 9.1
Some college 0.6 0.9 1.6 3.4 4.3 7.2College graduate 0.4 1.2 0.8 2.8 7.1 4.2Postgraduate education 0.8 0.4 0.5 6.6 2.5 3.1
RegionNortheast 1.4 1.0 2.3 7.4 5.3 10.4
Midwest 0.9 1.6 1.9 4.9 7.5 8.3South 0.7 1.9 2.2 3.4 9.6 9.7
West 1.3 1.9 1.7 6.4 8.6 7.7
Race/EthnicityWhite 0.8 1.3 1.7 4.6 6.1 7.3Black 2.6 2.8 4.0 10.6 15.2 17.9
Hispanic 1.6 4.9 3.8 9.3 24.7 18.3Other 0.8 2.6 3.1 4.4 15.0 15.7
Source: Authors' calculations of Current Population Survey data.
13Page 6

Some changes over time are noteworthy. For example, Figure 2 illuminates the 1979-1993trends in Type I underemployment rates by age. Underemployment rates increased for all agesubgroups over the 14-year period, although the rate for workers between the ages of 62 and 64did, for reasons that are not clear, decrease slightly between 1979 and 1988. The under-employment rate increased the most for workers between the ages of 60 and 61, who had had thelowest rate in 1979 (0.9 percent) and the highest rate in 1993 (2.3 percent). Contributing to thishigher underemployment rate among 60- and 61-year-old workers could be some form of pre-retirement transitional employment, i.e., a shift from long-term or career positions to "bridge" jobsin order to supplement pension incomes with earnings until becoming eligible for Social Securitybenefits at age 62 (Ruhm 1990). Some of these workers may be employed in bridge jobsvoluntarily; others may have been targeted by corporate downsizing and have no choice but towork in part-time jobs.
Figure 2Type I Underemployment Among All Workers
Percent Aged 50 to 64, by Age: 1979, 1988, and 1993(percent of all workers)
1979 1988 1993
a 50-54- - 55-59
- - - - 60-61
62-64
Source: Authors' calculations of Current Population Survey data.
Type I underemployment rates were higher for middle-aged females than for males in each ofthe three years. The difference between male and female rates increased during the 14-yearperiod, from 1.3 percentage points in 1979 to 2.1 percentage points in 1993.
Single workers were more than twice as likely to be Type I underemployed as marriedworkers throughout the 1979-1993 period, a difference that increased only slightly, from 1.4percentage points in 1979 to 1.7 percentage points in 1993.
Page 714
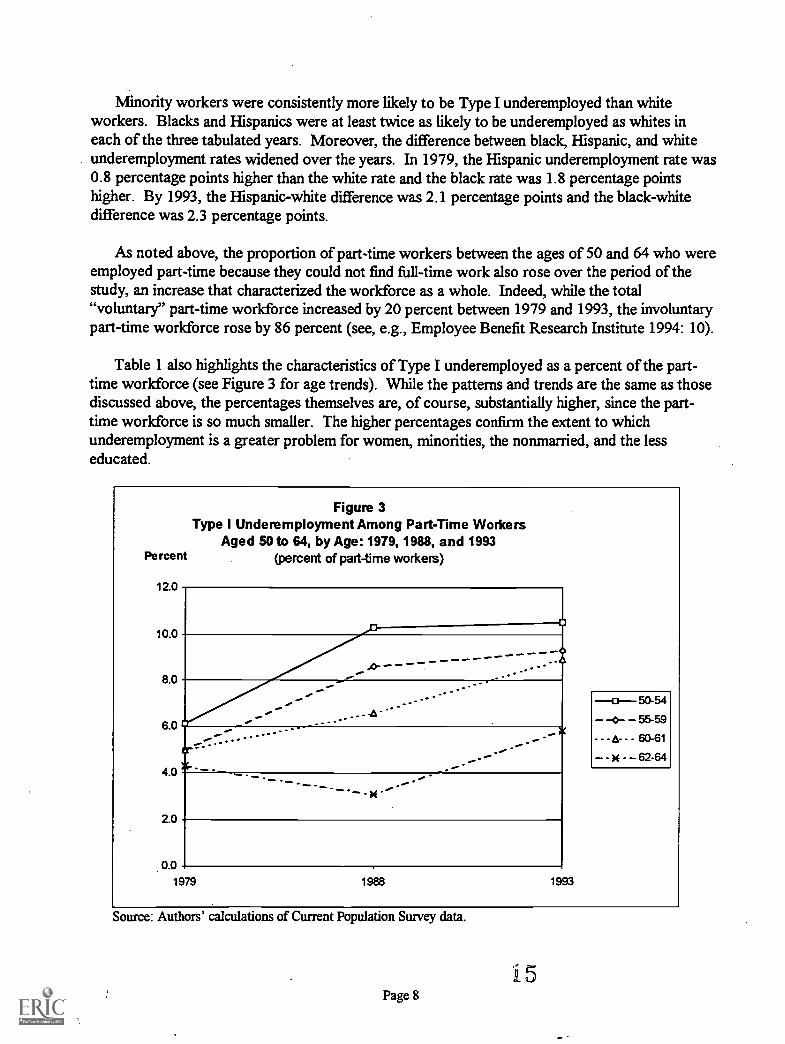
Minority workers were consistently more likely to be Type I underemployed than whiteworkers. Blacks and Hispanics were at least twice as likely to be underemployed as whites ineach of the three tabulated years. Moreover, the difference between black, Hispanic, and whiteunderemployment rates widened over the years. In 1979, the Hispanic underemployment rate was0.8 percentage points higher than the white rate and the black rate was 1.8 percentage pointshigher. By 1993, the Hispanic -white difference was 2.1 percentage points and the black-whitedifference was 2.3 percentage points.
As noted above, the proportion of part-time workers between the ages of 50 and 64 who wereemployed part-time because they could not find full-time work also rose over the period of thestudy, an increase that characterized the workforce as a whole. Indeed, while the total"voluntary" part-time workforce increased by 20 percent between 1979 and 1993, the involuntarypart-time workforce rose by 86 percent (see, e.g., Employee Benefit Research Institute 1994: 10).
Table 1 also highlights the characteristics of Type I underemployed as a percent of the part-time workforce (see Figure 3 for age trends). While the patterns and trends are the same as thosediscussed above, the percentages themselves are, of course, substantially higher, since the part-time workforce is so much smaller. The higher percentages confirm the extent to whichunderemployment is a greater problem for women, minorities, the nonmarried, and the lesseducated.
Percent
12.0
10.0
8.0
6.0
4.0
2.0
0.0
Figure 3Type I Underemployment Among Part-Time Workers
Aged 50 to 64, by Age: 1979, 1988, and 1993(percent of part-time workers)
1
.....
....."'.
-...."--
.---..... . - ' -a
. * ' . -...'"
-...- -
. --
-- -
-- - x .--.... .. -
1979 1988 1993
13-- 50-54- -0- - 55-59- - -e -- 60-61
- - x - - 62-64
Source: Authors' calculations of Current Population Survey data.
15Page 8
A Profile of the Type I Underemployed
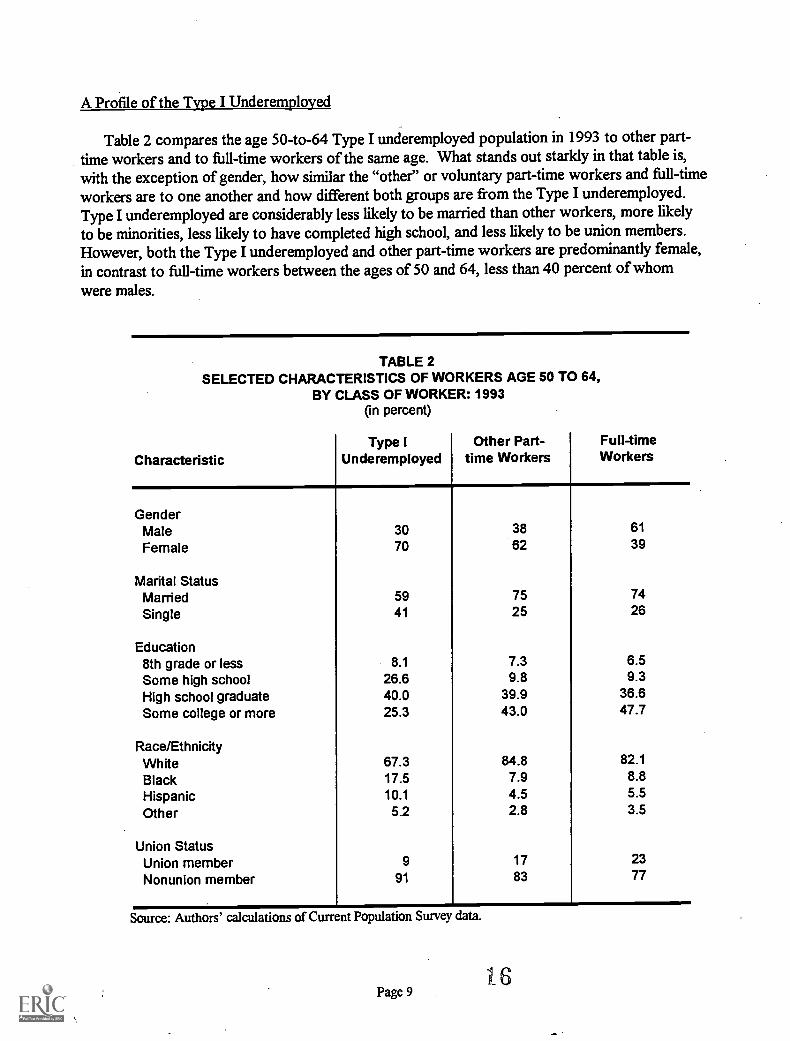
Table 2 compares the age 50-to-64 Type I underemployed population in 1993 to other part-time workers and to full-time workers of the same age. What stands out starkly in that table is,with the exception of gender, how similar the "other" or voluntary part-time workers and full-timeworkers are to one another and how different both groups are from the Type I underemployed.Type I underemployed are considerably less likely to be married than otherworkers, more likelyto be minorities, less likely to have completed high school, and less likely to be union members.However, both the Type I underemployed and other part-time workers are predominantly female,in contrast to full-time workers between the ages of 50 and 64, less than 40 percent of whom
were males.
TABLE 2SELECTED CHARACTERISTICS OF WORKERS AGE 50 TO 64,
BY CLASS OF WORKER: 1993(in percent)
CharacteristicType I
UnderemployedOther Part-
time WorkersFull-timeWorkers
GenderMale 30 38 61
Female 70 62 39
Marital StatusMarried 59 75 74
Single 41 25 26
Education8th grade or less 8.1 7.3 6.5
Some high school 26.6 9.8 9.3
High school graduate 40.0 39.9 36.6
Some college or more 25.3 43.0 47.7
Race/EthnicityWhite 67.3 84.8 82.1
Black 17.5 7.9 8.8
Hispanic 10.1 4.5 5.5
Other 5.2 2.8 3.5
Union StatusUnion member 9 17 23
Nonunion member 91 83 77
Source: Authors' calculations of Current Population Survey data.
16Page 9
Levels of Type I Underemployment in Other Age Groups
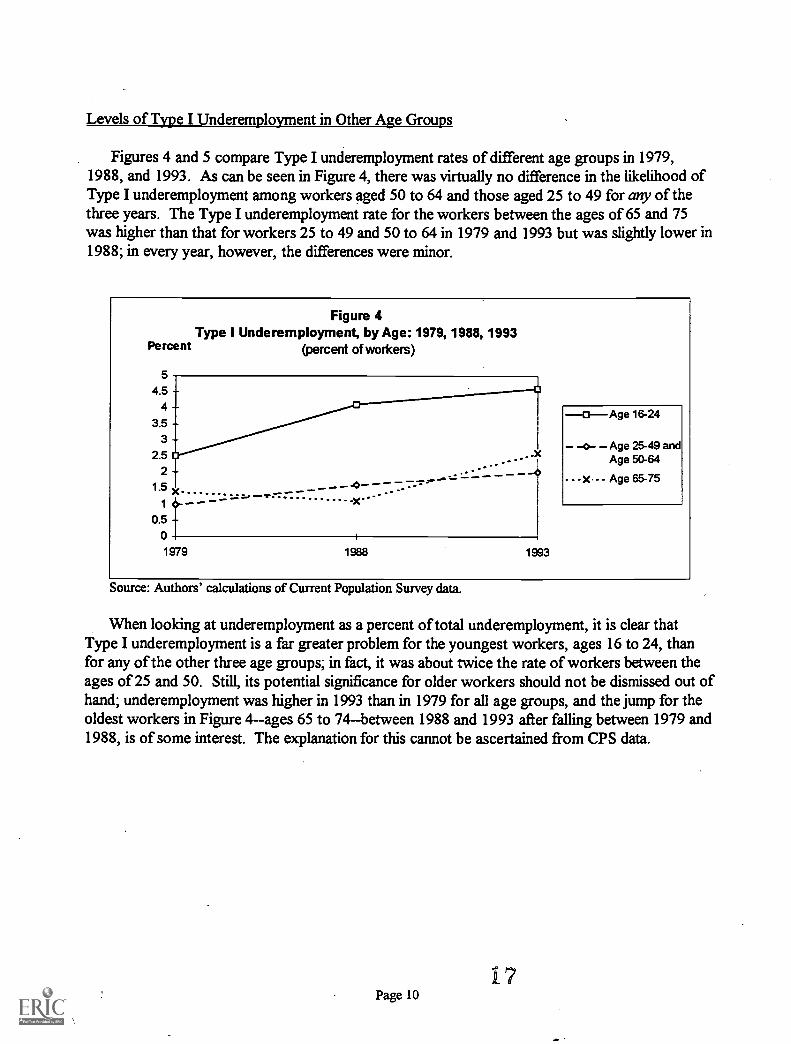
Figures 4 and 5 compare Type I underemployment rates of different age groups in 1979,1988, and 1993. As can be seen in Figure 4, there was virtually no difference in the likelihood ofType I underemployment among workers aged 50 to 64 and those aged 25 to 49 for any of thethree years. The Type I underemployment rate for the workers between the ages of 65 and 75was higher than that for workers 25 to 49 and 50 to 64 in 1979 and 1993 but was slightly lower in1988; in every year, however, the differences were minor.
Figure 4Type I Underemployment, by Age: 1979, 1988, 1993
Percent (percent of workers)
5
4.5
4-3.53-
2.5
2
1.5
0.5
0
-
--------X --------------
_____ -0
0Age 16-24
- -o- - Age 25-49 andAge 50-64
- -X. - - Age 65-75
1979 1988 1993
Source: Authors' calculations of Current Population Survey data.
When looking at underemployment as a percent of total underemployment, it is clear thatType I underemployment is a far greater problem for the youngest workers, ages 16 to 24, thanfor any of the other three age groups; in fact, it was about twice the rate of workers between theages of 25 and 50. Still, its potential significance for older workers should not be dismissed out ofhand; underemployment was higher in 1993 than in 1979 for all age groups, and the jump for theoldest workers in Figure 4--ages 65 to 74between 1988 and 1993 after falling between 1979 and1988, is of some interest. The explanation for this cannot be ascertained from CPS data.
Page 10

Percent
12
10
Figure 5Type I Underemployment Among Part-Time Workers,
by Age: 1979, 1988, 1993(percent of part-time workers)
.......... -a--------------------
x.et0T1979 1988 1993
0Age 16-24- -0- - Age 25-49
- - -A- - Age 50-64
- - x - - Age 65-75
Source: Authors' calculations of Current Population Survey data.
As a percentage of part-time workers, the picture looks a bit more dramatic, and, moreover,differences between workers ages 25 to 49 and 50 to 64 emerge. It is not clear whether the rapidrise in Type I underemployment was due to the targeting of older workers by downsizing firmsduring this period or to other reasons, such as a rising demand among older workers for full-time
work.
Pension Coverage, Pension Receipt, and Health Insurance Coverage
Workers between the ages of 50 and 64 are approaching or have already reached the age atwhich most workers retire. How secure are the Type I underemployed in this age group in termsof their pension coverage or receipt? How does their pension situation compare with that of full-time workers and other part-time workers in the same age group? Are the Type I underemployedprotected by health insurance to the extent that other workers are?
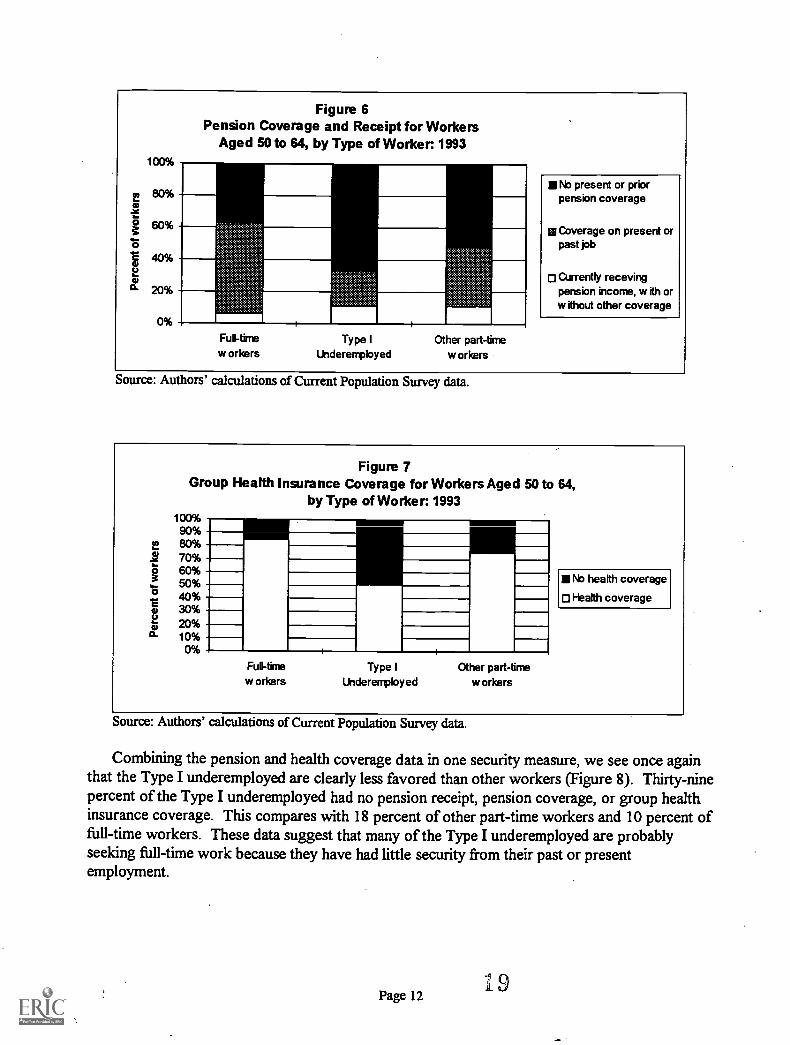
Analysis of the 1993 CPS data indicates that the Type I underemployed are clearly adisadvantaged group in terms of pension coverage (Figure 6). Sixty-seven percent of theType Iunderemployed had no present or prior coverage from which they could expect future retirementincome. This compares with 52 percent of other part-time workers and 37 percent offull-time
workers. Eleven percent of the 50-to-64-year-old Type I underemployed were already receivingpension income, suggesting that a significant portion of the Type I underemployed are retiredindividuals who find that they want or need full-time work.
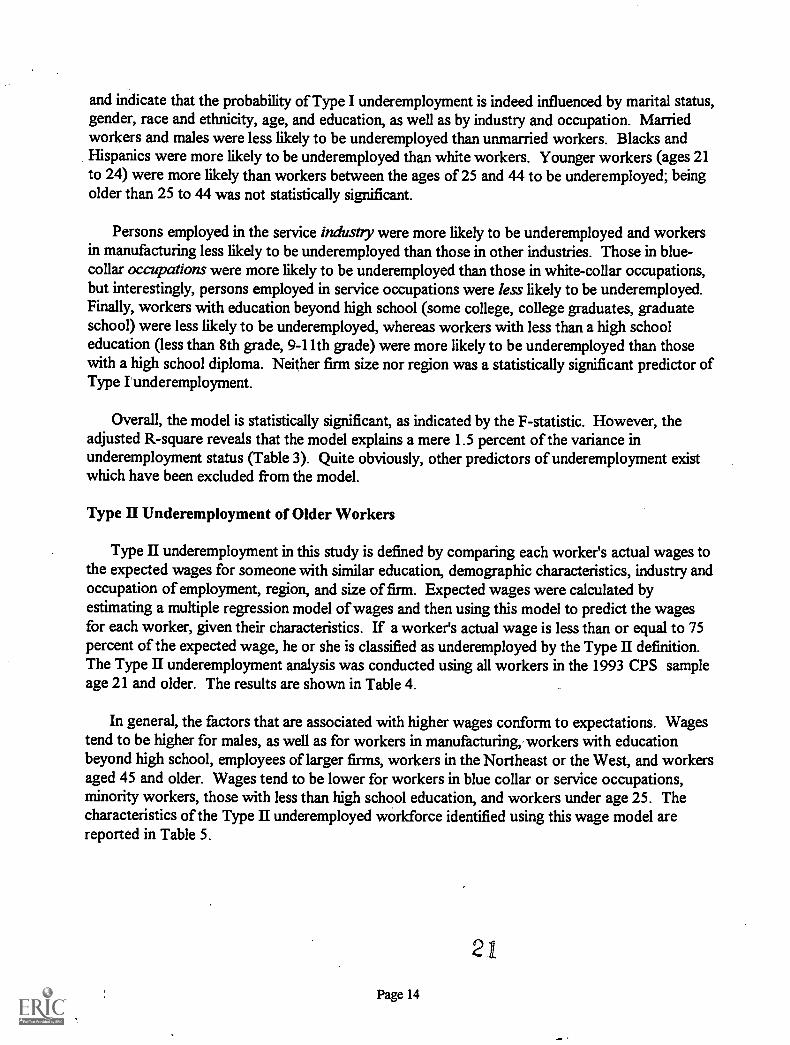
The Type I underemployed are also disadvantaged when it comes to coverage by group healthinsurance (Figure 7). Half of the Type I underemployed had no group health insurance comparedwith 25 percent of other part-time workers and 15 percent of full-time workers.
Page 1 1 IS
100%
80%
60%
40%
20%
0%
Figure 6Pension Coverage and Receipt for Workers
Aged 50 to 64, by Type of Worker: 1993
Full-time
w orkersType I
UnderemployedOther part-time
workers
No present or priorpension coverage
g Coverage on present orpast job
Currently recevingpension income, with orwithout other coverage
Source: Authors' calculations of Current Population Survey data.
Figure 7Group Health Insurance Coverage for Workers Aged 50 to 64,
by Type of Worker: 1993100%90 %-80%70%60%50%40%30 %-20%10%0%
Fuatime Type I Other part-timew orkers Underemployed w others
No health coverage
Health coverage
Source: Authors' calculations of Current Population Survey data.
Combining the pension and health coverage data in one security measure, we see once againthat the Type I underemployed are clearly less favored than other workers (Figure 8). Thirty-ninepercent of the Type I underemployed had no pension receipt, pension coverage, or group healthinsurance coverage. This compares with 18 percent of other part-time workers and 10 percent offull-time workers. These data suggest that many of the Type I underemployed are probablyseeking full-time work because they have had little security from their past or presentemployment.
Page 1219

Figure 8Pension and Group Health Insurance Security for Workers
Aged 60 to 64, by Type of Worker 1993100%90%80%70%60%50%
40%
30%20%
10%0%
Full-time
w orkersType I
Underetnpbyed
Other part-timeworkers
No Security
Health Security Only
Pension Security Only
o Pension and HealthSecurity
Source: Authors' calculations of Current Population Survey data.
A Multivariate Model of Type I Underemployment
The discussion thus far has focused on generating a descriptive profile of Type Iunderemployment. In this section, we build upon this descriptive analysis by estimating amultivariate model of Type I underemployment. Multivariate models are appropriate foridentifying variables that are statistically significant predictors of a dependent variable of interest(in this case, Type I underemployment status), controlling for the effects of other explanatoryvariables. This is important because inferences based on bivariate analyses can be misleading. Forexample, in the discussion above, we noted differences in the racial and educational characteristicsof underemployed workers compared with other workers. This suggests that both of thesevariables may be associated with the probability of being underemployed. Yet it is possible, forexample, that after controlling for educational characteristics, no additional differences inunderemployment by race would remain. If this were the case, it would indicate that educationwas the "real" predictor of underemployment, not race (although race might, in turn, influenceaccess to education).
A multivariate regression model of Type I underemployment was estimated using the CPSdata for 1993 (Table 3).7 The results of the model confirm the descriptive findings reported above
7This model should be considered preliminary because it is based on regression analysis, rather than logit or probit(which are generally considered to be more appropriate techniques when the dependent variables takes on values ofone or zero). Regression analysis was used to estimate the model because it provides more extensive diagnosticinformation than logit or probit models. For exploratory work, this is extremely helpful in assessing modelspecification. For example, tolerance and variance inflation factor statistics are available for multiple regressionmodels but not for logit or probit models. These statistics enable the researcher to evaluate the role ofmulticollinearity as an explanation for statistically insignificant parameter estimates. (Multicollinearity is astatistical problem created by the correlation among explanatory variables which obscures the relationship of thesevariables with the dependent variable.) There was no evidence of multicollinearity for any of the variables in themodel.
Page 13 20( BEST COPY AVARLUILE
and indicate that the probability of Type I underemployment is indeed influenced by marital status,gender, race and ethnicity, age, and education, as well as by industry and occupation. Marriedworkers and males were less likely to be underemployed than unmarried workers. Blacks andHispanics were more likely to be underemployed than white workers. Younger workers (ages 21to 24) were more likely than workers between the ages of 25 and 44 to be underemployed; beingolder than 25 to 44 was not statistically significant.
Persons employed in the service industry were more likely to be underemployed and workersin manufacturing less likely to be underemployed than those in other industries. Those in blue-collar occupations were more likely to be underemployed than those in white-collar occupations,but interestingly, persons employed in service occupations were less likely to be underemployed.Finally, workers with education beyond high school (some college, college graduates, graduateschool) were less likely to be underemployed, whereas workers with less than a high schooleducation (less than 8th grade, 9-11th grade) were more likely to be underemployed than thosewith a high school diploma. Neither firm size nor region was a statistically significant predictor ofType lunderemployment.
Overall, the model is statistically significant, as indicated by the F-statistic. However, theadjusted R-square reveals that the model explains a mere 1.5 percent of the variance inunderemployment status (Table 3). Quite obviously, other predictors of underemployment existwhich have been excluded from the model.
Type II Underemployment of Older Workers
Type II underemployment in this study is defined by comparing each worker's actual wages tothe expected wages for someone with similar education, demographic characteristics, industry andoccupation of employment, region, and size of firm. Expected wages were calculated byestimating a multiple regression model of wages and then using this model to predict the wagesfor each worker, given their characteristics. If a worker's actual wage is less than or equal to 75percent of the expected wage, he or she is classified as underemployed by the Type II definition.The Type II underemployment analysis was conducted using all workers in the 1993 CPS sampleage 21 and older. The results are shown in Table 4.
In general, the factors that are associated with higher wages conform to expectations. Wagestend to be higher for males, as well as for workers in manufacturing,-workers with educationbeyond high school, employees of larger firms, workers in the Northeast or the West, and workersaged 45 and older. Wages tend to be lower for workers in blue collar or service occupations,minority workers, those with less than high school education, and workers under age 25. Thecharacteristics of the Type II underemployed workforce identified using this wage model arereported in Table 5.
21
Page 14

Region. Gender. and Marital Status
Type II (low-wage) underemployment was the highest in the South in all age groups.Interestingly, however, there appears to be little difference in the regional distribution of Type IIunderemployment by age category.
TABLE 3MULTIPLE REGRESSION MODEL OF TYPE I UNDEREMPLOYMENT
Variable Coefficient t-statistic
Married -0.0114 -8.447
Male -0.0095 -7.041
Black 0.0066 2.904
Hispanic 0.0054 1.998
Other 0.0027 0.92
Age 21-24 0.0128 5.595
Age 45-54 -0.002 -1.242
Age 55-64 -0.003 -1.439Age 65+ -0.0039 -1.089Manufacturing -0.0134 -7.228
Service (industry) 0.0048 3.314
Blue-collar occup. 0.0116 7.48
Service (occupation) -0.0097 -5.088
Grade 8 0.0119 3.376
Some high school 0.0197 7.671
Some college -0.009 -5.73
College graduate -0.0132 -6.988
Postgraduate -0.0163 -6.538
Firm size 100-499 -0.0041 -1.217Firm size 500-999 -0.0005 -0.103
Firm size 1000+ -0.0023 -1.312
Northeast 0.0011 0.717
West 0.0028 1.693
Constant 0.0372 18.162
Adjusted R-Square 0.0148F-Statistic 39.6Sample size 59,000
Source: Authors' calculations of Current Population Survey data.
22Page 15

TABLE 4MULTIPLE REGRESSION MODEL OF WAGES
Variable Coefficient t-statistic
Married 1.5835 8.022Male 3.9884 20.28Black -0.7367 -2.203Hispanic -1.0226 -2.569Other -0.4557 -1.022Manufacturing 1.046 3.847Age 21-24 -3.2966 -9.714Age 45-54 1.7402 7.555Age 55-64 1.4011 4.616Age 65+ 4.8075 8.765Service (industry) -0.4679 -2.213Blue-collar occup. -1.6519 -7.261Service (occupation) -1.3799 -4.944Grade 8 -3.5193 -6.656Some high school -1.7277 -4.585Some college 1.8957 8.269College graduate 5.37 19.37Postgraduate 10.3731 28.578Firm size 100-499 0.2321 0.658Firm size 500-999 0.7426 1.58Firm size 1000+ 1.3199 6.453Northeast 1.622 7.368West 1.2938 5.459Constant 7.0569 23.081
Adjusted R-Square 0.104F-Statistic 138.9Sample size 27,300
Source: Authors' calculations of Current Population Survey data
The Type II underemployed are also more likely to be male than female, except in the 45-to-54 age group, where the odds are essentially equal. The concentration of Type IIunderemployment is particularly high in the 21-to 34-age group, where 64 percent of low-wageunderemployed workers are male. Note that care must be taken in interpreting these findings,however. They do not necessarily imply that males have a higher rate of Type IIunderemployment than females--only that the majority of low-wage underemployed workersaremale. The percentages reported in Table 5 are also influenced by the distribution of the respectivevariables in the labor force at large. For example, if 80 percent of the labor force were male,females could have a much higher rate of underemployment and still have a smaller reportedpercentage than males in Table 5.
Page 16 23

TABLE 5CHARACTERISTICS OF TYPE II UNDEREMPLOYED BY AGE
(in percent)
Variable 21 to 34 35 to 44 45 to 54 55 to 64 65+ All Ages
RegionNortheast 22.9 21.8 23.8 24.1 25.4 23.1
Midwest 26.4 25.2 23.7 26.8 26.0 25.6
South 28.5 29.6 29.0 30.1 30.4 29.1
West 22.2 23.4 23.5 19.1 18.2 22.2
GenderMale 64.4 55.4 49.5 55.5 56.8 57.8
Female 35.6 44.6 50.3 44.5 43.2 42.2
Married 53.2 76.6 77.9 78.4 62.7 67.3
RaceWhite 80.0 81.3 84.3 86.6 88.1 82.3
Black 8.1 8.2 6.2 6.0 6.7 7.4
Hispanic 7.2 5.2 5.4 3.1 2.3 5.6
Other 4.7 5.3 4.2 4.3 2.9 4.6
Education8th grade or less 1.6 2.0 3.6 7.0 15.5 3.4
Some high school 5.9 5.0 6.5 10.0 11.5 6.5
High school graduate 31.5 31.3 36.7 39.1 37.5 33.7
Some college 32.4 28.5 22.1 19.3 15.3 27.0
College graduate 22.4 20.5 17.1 14.0 11.1 19.3
Postgraduate education 6.2 12.6 14.0 10.7 9.2 10.0
IndustryMining 0.3 0.5 0.3 0.4 0.2 0.3
Construction 5.3 6.1 4.8 3.8 1.9 5.1
Manufacturing 14.8 15.6 14.7 13.4 8.8 14.5
Trans/Comm 5.2 5.3 6.0 4.8 3.3 5.2
Trade 29.1 21.4 21.7 25.7 23.7 25.0
Fin/Ins/Real estate 5.5 4.8 5.4 6.4 6.9 5.5
Services 33.1 37.7 39.5 35.7 42.1 36.3
Other 6.7 8.7 7.7 9.8 13.2 8.0
OccupationWhite collar 42.1 45.2 47.0 39.5 38.8 43.4
Blue collar 25.7 24.5 25.8 31.2 34.4 26.5
Service 16.0 15.4 15.2 14.5 9.6 15.2
Other 16.2 14.9 12.0 14.8 17.2 14.9
Page 17 9 4

TABLE 5 (cont.)CHARACTERISTICS OF TYPE II UNDEREMPLOYED BY AGE
(in percent)
Variable 21 to 34 35 to 44 45 to 54 55 to 64 65+ All Ages
Health Ins. CoverageSelf and family 31.4 46.0 46.4 43.3 28.8 39.2Self only 36.7 25.8 29.8 32.1 32.1 32.0None 31.3 28.1 23.6 24.4 39.1 28.5
Pension coverage 22.2 29.0 33.7 26.9 16.1 26.4
Type I Underemployed 3.6 3.3 3.0 3.5 2.3 3.3
Source: Authors' calculations of Current Population Survey data.
Similarly, differences in the distribution of marital status across age groups are evident amongthe low-wage underemployed. Again, these differences probably reflect marital statusdistributions by age in the labor force at large. Type II underemployed workers ages 21 to 34 and65-plus were less likely to be married than workers aged 35 to 64.
Race
Table 5 indicates a general increase in the concentration of Type II underemployment amongwhite workers in higher age groups. It is possible that this increase reflects higher labor forceparticipation rates of whites, but we suspect that these relationships are very complex. Forexample, it is a well-known fact that labor force participation rates among older people arestrongly influenced by the availability of adequate retirement income. Some older workers are inthe labor force because their nonearnings retirement income is insufficient. Others are in the laborforce in bridge jobs, working only until they become eligible for Social Security benefits at age 62.Still others are in the labor force because they enjoy their work, even though they could afford toretire. Differences in the adequacy of retirement incomes by race, therefore, are likely to havestrong influences on labor force participation rates and, in turn, on Type II underemployment.
Education
The educational distribution of Type II underemployment is very pronounced. Older low-wage underemployed workers are much more likely to have lower education levels than youngerworkers. This probably partly reflects differences in educational attainment across age cohorts(education levels have been rising over time). However, the large increase in the percentage ofType II underemployed in the 55-to-64 and 65-plus age groups suggests an additional explanationfor the higher rate of low-wage underemployment beyond cohort differences in educationalattainment (e.g., age discrimination against poorly educated older workers, which forces theminto very low paying jobs). Still, the multiple regression approach controls for the effects ofeducation on the predicted wage of these workers. To be considered underemployed by the Type
Page 18

II definition, the wages they are earning must be substantially lower than the predicted wage giventheir education and other characteristics.
Industry and Occupation
The most notable differences in the industrial distribution of Type II underemployment seemto occur with the 65-plus age group compared with the younger age groups. The percentage oflow-wage underemployed workers 65 and older in manufacturing declines to 8.8 percent, whereas
the percentage working in the service industry increases to 42.1. This does not appear to reflectgeneral labor force patterns of retiring from a career job in manufacturing and working in a bridgejob in services, since persons 65-plus are already eligible for Social Securitybenefits. These TypeII underemployed age 65-plus are probably a mix of low-wage workers with inadequateretirement incomes and low-wage workers with adequate retirement incomes who chose tocontinue working for noneconomic reasons.
The occupational distribution of Type II underemployment appears to be even more complexthan the industrial distribution. The decline in the percentage of age 65-plus workers in theservice occupations is especially noteworthy and seemingly inconsistent with the higherpercentage of age 65-plus workers in the service industry. However, the service industry effectsjust discussed may be reflected in the decline in white-collar underemployment and the increase inblue-collar underemployment at ages 55 and older.
Health Insurance and Pension Coverage
Lack of employer health insurance coverage among the Type II underemployed declines with
age through the 45-to-54 age group, remains essentially stable in the 55-to-64 group, and thenrises with the 65-plus group. (Presumably, employer health insurance coverage is a much weakerincentive to work for persons aged 65 and older because of Medicare.) Similarly, employerpension coverage rises through the 45-to-54 group, declines among those aged 55 to 64, and falls
precipitously in the 65-plus group. Trends in employer health insurance and private pension
coverage in the 65-plus group are probably related mainly to part-time employment status.However, the availability of these benefits is correlated with race, gender, industry andoccupation, firm size, region, and other factors. Thus, it is likely that these other dimensions are
also part of the explanation for the lower rate of health insurance and private pension coverageamong the Type II underemployed 65 and older.
Type I Underemployment
The incidence of Type I underemployment (i.e., involuntary part-time workers) among theType II underemployed population is highest in the 21-to-34 and 55-to-64 age groups and lowestin the 65-plus group. The primary reason that the Type I underemployment constitutes such asmall percentage of the Type II group is that the size of the latter group is much larger. Forexample, as reported earlier, approximately 400,000 workers age 50 to 64 were consideredunderemployed by the Type I definition. In contrast, about 7.2 million workers age 50-64 areconsidered underemployed by the Type II definition. Interestingly, however, the percentage of
Page 19 6

Type I underemployed who are also considered underemployed by the low-wage Type II criteriais substantial, 61 percent.
The large magnitude of Type II underemployment relative to Type I underemployment has atleast two possible explanations. First, Type II underemployment includes both full-time and part-time workers in its definition, whereas Type I underemployment includes only part-time workers.Second, some workers classified as underemployed by the Type II criteria are in low-wage jobs bychoice. One aspect of this issue is the stringency of the wage threshold criteria used. In thisstudy, we used 75 percent of expected wages as the threshold for defining Type II under-employment, but this is admittedly arbitrary. We did, however, experiment with alternativethresholds to assess their affects on the size of the population classified a_ s Type II under-employed.
The impacts of making the wage threshold used in the definition of Type II underemploymentmore stringent are substantial. For instance, using a wage threshold of 50 percent of predictedwages reduces the estimated size of the Type II population by approximately 58 percent. Using awage threshold of 25 percent reduces the estimated size of the Type II underemployed labor forceby 89 percent. This is an area that could benefit from additional research.
Because some older workers may be employed in lower paying jobs by choice, any estimate ofType II underemployment derived by this approach will tend to be an overestimate for the wagethreshold chosen. Nevertheless, we believe that the approach suggested in this paper forestimating Type II underemployment is a significant improvement over using 125 percent of thepoverty line as the threshold because the latter is not tied to worker or job characteristics.Clearly, however, improvements in operationalizing the Type II approach are necessary before itcan be used as a reliable measure of low-wage underemployment among workers 50 years of ageand older.
Directions for Future Research
One refinement of the research presented in this paper would be to focus the Type II analysison full-time workers alone, since we can already classify part-time workers in terms of theirvoluntary or involuntary status. Presumably, part-time workers who are employed in low-wagejobs voluntarily should not be classified as Type II underemployed.
Another area of refinement would be to estimate separate wage models for each age group.This approach would control for the influences of cohort differences in demographic compositionand education on wages and enable the wage thresholds to be calculated separately for eachgroup.
A related, and very important area of work--particularly if further refinements in the definitionof Type H underemployment can be obtained---would be to estimate multivariate models of therisk of being low-wage underemployed similar to the approach used for the Type Iunderemployed. Type I and Type II multivariate analyses should be conducted using logit orprobit models, based on the preliminary work done with multiple regression models.
Page 20 27
In addition, the importance of job tenure or seniority needs careful attention in subsequentresearch. For example, Shapiro and Sandell (1987: 38) observed in their research that a very high
percentage of the wage reduction among older reemployed men could "be attributed to thenontransferability of workers' firm-specific skills and knowledge associated with seniority."Clearly, findings such as this are germane to the policy and programmatic recommendationsthatmight be proposed to deal with underemployment. Finally, distinguishing between the full- andpart-time Type II underemployed might prove fruitful.
Conclusions
This study is the first to our knowledge to focus specifically on the underemployment ofolderworkers. Data from the 1979, 1988, and 1993 Current Population Surveys indicate that Type Iunderemployment has been steadily rising over time. The Type I underemployed are an extremelydisadvantaged group in terms of pension and health insurance coverage, suggesting that many ofthese workers are probably forced to remain in the labor force because of the unaffordability of
retirement.
The Type II definition of underemployment among older workers was based on their wages.The standard definition often used in the literature compares worker earnings to 125 percent ofthe poverty line, but this measure is unsatisfactory because it fails to account for the potentiallypoor job skills and low productivity of some workers. Type II underemployment is based upon acomparison of workers' wages to "expected" wages, given their demographic and jobcharacteristics. As with the Type I underemployed, we found that workers classified asunderemployed by the Type II definition were also disadvantaged.
Nearly 400,000 workers between the ages of 50 and 64 were estimated to be underemployedby the Type I definition. The number underemployed by the Type II definition was muchlarger,7.2 million. Approximately 61 percent of the Type I underemployed were also underemployedaccording to the Type II definition.
The large magnitude of Type II underemployment highlights the need for further work torefine these estimates. The estimated magnitude of Type II underemployment was very sensitiveto the wage threshold used. Clearly , as suggested above, additional research is called for.Nevertheless, the fact that the Type II estimates of underemployment were much larger than the
Type I estimates, even using the most stringent criteria that were investigated, illustrates that thisis too important a dimension of underemployment to be ignored.
r) 8
Page 21

References
Blank, Rebecca. 1990. "Are part-time Jobs Bad Jobs?" In Gary Burt less (ed.), A Future of LousyJobs? The Changing Structure of U.S. Wages. Washington, DC: Brookings Institution.
Employee Benefit Research Institute. 1994. Characteristics of the part-time Work Force.Washington, DC: Employee Benefit Research Institute.
Ichiowski, Bernard, and Anne Preston. 1986. "New Trends in part-time Employment." IndustrialRelations Research Association 38th Annual Proceedings, 60-67.
Jacobs, Jerry. 1993. Trends in Wages, Underemployment, and Mobility Among part-timeWorkers. Discussion Paper No. 1021-93. Madison, WI: Institute for Research on Poverty,University of Wisconsin.
Mutschler, Phyllis. 1996. "Early Retirement Incentive Programs (ERIPs): Mechanisms forEncouraging Early Retirement." In William H. Crown (ed.) Handbook on Employment and theElderly. Westport, CT: Greenwood Press.
Nord, Steven, John Phelps, and Robert Sheets. 1989 "Service Industries and StructuralUnderemployment in Urban Areas in the United States." Revista Internazionale di ScienzeEconomiche e Commerciali 36(9): 785-800.
Peracchi, Franco, and Finis Welch. 1994. "Trends in Labor Force Transitions of Older Men andWomen." Journal of Labor Economics, 12(2): 210-242.
Quinn, Joseph, and Richard Burkhauser. 1994. "Public Policy and the Plans and Preferences ofOlder Americans." Journal of Aging and Social Policy, 6(3): 5-20. Ruhm, Christopher. 1989."Why Older Americans Stop Working." The Gerontologist, 29(3): 294-299.
Ruhm, Christopher. 1990. "Bridge Jobs and Partial Retirement." Journal of Labor Economics,8(4): 482-501.
Shapiro, David and Steven H. Sandell. 1987. "The Reduced Pay of Older Job Losers: AgeDiscrimination and Other Explanations." In Steven H. Sandell (ed.). The Problem Isn't Age.New York: Praeger.
29Page 22

A publication of thePublic Policy Institute
AARP1091/11000150010.0°
American Associationof Retired Persons
601 E Street, N.W.Washington, DC 20049

n
(9/92)
U.S. DEPARTMENT OF EDUCATIONOffice of Educational Research and Improvement (OERI)
Educational Resources Information Center (ERIC)
NOTICE
REPRODUCTION BASIS
ERIC
This document is covered by a signed "Reproduction Release(Blanket)" form (on file within the ERIC system), encompassing allor classes of documents from its source organization and, therefore,does not require a "Specific Document" Release form.
This document is Federally-funded, or carries its own permission toreproduce, or is otherwise in the public domain and, therefore, maybe reproduced by ERIC without a signed Reproduction Releaseform (either "Specific Document" or "Blanket").