3000F Grain and Flour Analyser - Trident Instrumentation
4
The Next Generation of Near Infrared Analysers 3000F Grain and Flour Analyser Analytical Solution for Flour Millers, Grain Processors and Food Manufacturers
Transcript of 3000F Grain and Flour Analyser - Trident Instrumentation
The Next Generation of Near Infrared Analysers
3000F Grain and Flour Analyser
Analytical Solution for Flour Millers, Grain Processors and Food
Manufacturers

Near Infrared Transmission (NIT) Spectroscopy Near Infrared Transmission Spectroscopy is the most widely used technology for measuring protein, oil and moisture in grains and oil seeds. NIT analysers offer farmers, grain buyers, flour millers, pasta producers and grain processors a rapid means of determining the composition of their incoming grains, their process streams and their final products. The CropScan 3000F Grain and Flour Analyser require no grinding and are designed for ease of use. The same system measures whole grains of wheat as well as flour and meals. The CropScan 3000F Grain and Flour Analyser can be coupled with the SeedCount Image Analysis System and Specktek software to provide a complete wheat and flour measurement system: Protein and Moisture in Wheat Protein, Moisture, Ash, Water Absorption and Starch
Damage in Flour and Semolina Specks in Flour and Semolina Protein and Moisture in Meals Protein, Moisture, Oil and Starch in Soybeans, Corn,
Rice and other grains and oil seeds. Protein, Moisture and Oil in Corn Flour, Rice Flour,
Soybean Meal and other processed grain products.
CropScan 3000F Grain and Flour Analyser Touch Screen Operation Measures Protein and Moisture in Wheat Measures Protein, Moisture, Ash, Water Absorption
and Starch Damage in Flour and Semolina Weighbridge software available Internet software available The CropScan 3000F is a bench top analyser designed for rapid measurement of protein and moisture in wheat, barley and other cereal grains. Powders including flour, semolina, lupin meal, soybean meal, soybean flour, corn flour and meals can be measured in a 5mm deep rotating dish that is simple to load and empty. Up to 30 sub scans can be collected for either grains or powders and averaged to provide excellent accuracy and precision. The Touch Screen PC provides users a simple to use interface. Once the NIR analyser has predicted the required parameters, the software prompts a set of customised data fields. The operator enters the following information:
Sample ID Test Weight and Screening Weight Storage Location Variety Grade Source(Farm, Paddock or Supplier) Truck ID
Once the data fields are completed, the information is stored in the on board memory and can then be posted to the CropNet web site where it can be retrieved form a Smart Phone, Tablet or PC. Reports are available at the press of a button for; Tabulated results Spectra Trends Plots Bin Averages for each silo, bunker or shed..
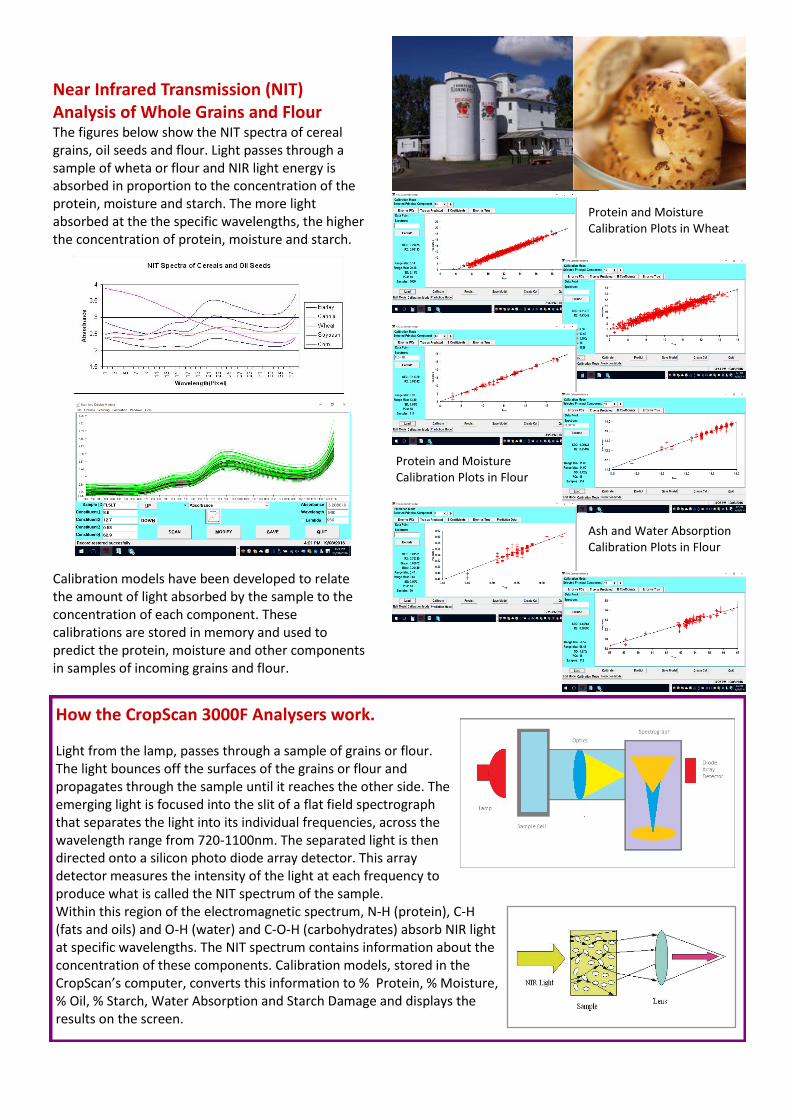
How the CropScan 3000F Analysers work.
Light from the lamp, passes through a sample of grains or flour. The light bounces off the surfaces of the grains or flour and propagates through the sample until it reaches the other side. The emerging light is focused into the slit of a flat field spectrograph that separates the light into its individual frequencies, across the wavelength range from 720-1100nm. The separated light is then directed onto a silicon photo diode array detector. This array detector measures the intensity of the light at each frequency to produce what is called the NIT spectrum of the sample. Within this region of the electromagnetic spectrum, N-H (protein), C-H (fats and oils) and O-H (water) and C-O-H (carbohydrates) absorb NIR light at specific wavelengths. The NIT spectrum contains information about the concentration of these components. Calibration models, stored in the CropScan’s computer, converts this information to % Protein, % Moisture, % Oil, % Starch, Water Absorption and Starch Damage and displays the results on the screen.
Near Infrared Transmission (NIT) Analysis of Whole Grains and Flour
The figures below show the NIT spectra of cereal grains, oil seeds and flour. Light passes through a sample of wheta or flour and NIR light energy is absorbed in proportion to the concentration of the protein, moisture and starch. The more light absorbed at the the specific wavelengths, the higher the concentration of protein, moisture and starch. Calibration models have been developed to relate the amount of light absorbed by the sample to the concentration of each component. These calibrations are stored in memory and used to predict the protein, moisture and other components in samples of incoming grains and flour.
Protein and Moisture Calibration Plots in Wheat
Protein and Moisture Calibration Plots in Flour
Ash and Water Absorption Calibration Plots in Flour

Specification CropScan 3000S
Wavelength Range 720-1100nm
Optical Detector Silicon Diode Array
Lamp Halogen 12VDC, 10W
Scan Rate 2-4 per scan
Sample Tray Pathlengths 8, 16, 24mm
Display Touch Screen PC Windows & OS
Power 19VDC using 110 –240VAC
Operating Temperature Range 5-450C, 41-1130F,
Dimensions (cm) Weight (Kg) 40 W x 40 D x 33 H 12Kg
Distributed by:
Manufactured by:
NIR Technology Systems
B1 366 Edgar Street, Condell Park, NSW, 2200, Australia Tel: 612 9771 5444, fax: 612 9771 5255 Email: [email protected] Web: www.nextinstruments.net
SeedCount Image Analysis System and Specktek Software Touch Screen Operation Measures Length, Width, Thickness Measures Colour Measures Defects and Broken Seeds Measures Diseases including Fusarium, Blacktip,
Smut, Yellow Berry Flour Yield Measures Specks in Flour and Semolina SeedCount includes a high resolution scanner, multiple sample tray system and a powerful set of image analysis routines to measure the physical characteristics of grains, flour and semolina.
Seeds are spread over the sample tray and inserted into the SeedCount scanner module. The SeedCount software draws a border around each seed and uses the pixels within the border to define each parameter.
4 black and white scans are collected from a 100 x 100mm flat sample of flour or semolina. The intensity of each spot within these
scans are measured and the software determines black and brown specks. The average of the four scans is presented with data shown for Black Large, Brown, Specks, Black/Large ppm, Brown ppm. Reports can be printed or stored.