Six Strategic Decisions for Transportation in Mega Cities -- Gakenheimer(1994)

STRATEC STASA CASA LT CERTU TRT STRAFICA CETE de l’Ouest 15
3. THE SIX CASE CITIES
The analysis performed in SCATTER is based on 6 case cities : Bristol, Brussels, Helsinki, Milan, Rennes and Stuttgart. These cities cover a wide range in terms city size as indicated in the table below. This section provides an overview on the main features of these six cities to better understand the results obtained in the various work packages of the project. The description focuses on the spatial pattern, the evolution of urbanisation, population and socio-economic variables in the last decades, and transport and mobility issues.
Table 3.1 Population in the 6 case cities
City Population of the urban area (study area)
Bristol 933 000 inhabitants
Brussels 2 945 000 inhabitants
Helsinki 1 624 000 inhabitants
Milan 3 607 000 inhabitants
Rennes 521 000 inhabitants
Stuttgart 2 613 000 inhabitants
3.1. Overall presentation of Bristol
3.1.1. Presentation of the study area
The study area for the Bristol case study comprises the former Avon County, which has been divided into four district authorities after the reform of the British institutional system: Bristol City, South Gloucestershire, Bath and Northeast Somerset, North Somerset (see Figure 3.1).

STRATEC STASA CASA LT CERTU TRT STRAFICA CETE de l’Ouest 16
Figure 3.1: The location of the study area
The total area of this subregion is 1346.41 km2 and the total population is 983860 inhabitants in 2001.
Total population % of the population
Avon area 983860 100%
Bath and NE Somerset 169045 17%
Bristol City 380615 38%
North Somerset 188556 20%
South Gloucestershire 245644 25%
Table 3.2: Population percentages among districts 2001 (Source: Population Census, ONS)
The area has been divided in 3 zones (see fig 2): the urban centre has been defined as the City of Bristol urbanised area, and is surrounded by a first urban ring comprising areas with more than 40% of commuters travelling towards the urban centre of Bristol, and then by a wider hinterland. The whole area is covering a 30km radius area and is composed by 168 wards (the study unit) corresponding to the 1981 census geography. The core area comprises 27 wards, the first ring 46 wards and the hinterland the remaining 96 wards.

STRATEC STASA CASA LT CERTU TRT STRAFICA CETE de l’Ouest 17
Figure 3.2: Urban definition of case study Bristol
3.1.2. Recent evolution of the Bristol region
A general comment can be made on the fact that the data on employment and population confirm both the local development trends of the area and the disparities among the four districts. Population and employment have grown steadily in the last 20 years and projections suggest a high rate of growth for the next years. Employment in particular has had a significant growth with top figures of 44% growth in the South Gloucestershire district in the decade between 1991 and 2001. The only slow growing area is the Bristol City district. This is mainly due to the tightness of the administrative boundaries forcing most development to occur outside them and providing chances for growth only in the form of brownfields’ redevelopment.
Change 81-91 % Change 91-99 % Avon area 3.5 4.5 Bath and NE Somerset 3.0 2.3 Bristol City -2.3 2.1 North Somerset 10.7 5.5 South Gloucestershire 9.3 9.5 Great Britain 2.8 2.9
Table 3.3: Population change % Avon area 1981-1999 (Source: Population Census, ONS Mid-year estimates
STRATEC STASA CASA LT CERTU TRT STRAFICA CETE de l’Ouest 18
3.2. Overall presentation of Brussels
3.2.1. Description of the Brussels case city
Brussels is a metropolitan area of about 2.9 million inhabitants (2001). Its central part, the so-called "Brussels-Capital Region", is an important administrative capital, grouping a little less than 1 million inhabitants. The Region has lost population for 30 years (about 120 000 inhabitants), while economic activities – with a rather stable total number of jobs (about 650 000) - were undergoing an important mutation: strong decline of industrial and heavy tertiary activities and strong growth of administrative functions. The result of this evolution is an increase in the number of daily commuters and traffic congestion.
The spatial structure of Brussels is quite typical. An old industrial axis along a canal surrounded by poor neighbourhoods of different ethnic communities with very few green spaces makes its way through the whole city, cutting it in two parts. Neglected during decades this area slowly begins to be renovated. On the other hand, the strong increase of administrative functions introduced a speculative pressure on higher status neighbourhoods making the cost of living increase. Emigration of middle class families to the suburbs encouraged urban sprawl, commuting by car and congestion. The decline of the population of the Brussels-Capital Region and the lowering of its average income increases the scarcity of the resources, essentially based on income taxes of residents, while a lot of public works must be done to adapt the Region to its new important administrative functions. One of the major goals of the local Development Plan is to reinforce the residential attractiveness of the capital by all means. On the other hand, since the efficiency of the public transport networks is too low, especially between the periphery and the urban centre, the authorities decided to implement what could be called a “regional metro” on the existing railway tracks: this is the REN or “Regional Express Railway Network” (“Réseau Express Régional”), linking the suburbs to the central part of the metropolitan area.
The effect expected from the implementation of the REN is a strong modal shift from private car towards public transport, shorter road travel times and a reduction of fuel consumption and of emissions of greenhouse gases and pollutants. However, the long-run effect could be an acceleration of the out-migration of households towards the periphery. Therefore the authorities are interested in testing and evaluating policies to counterbalance the accelerating effect of REN on urban sprawl, as well as to reinforce the positive effect of REN on modal shares. The Belgian authorities co-funding the research (the federal Transport Administration (Service Public Fédéral Transport et Mobilité) and the Equipment and Transport Administration (Administration de l’Equipement et des Déplacements) of the Brussels-Capital Region) are expecting the demonstration of the adequacy of policies in a long-term strategy to reach the goals of a sustainable development.

STRATEC STASA CASA LT CERTU TRT STRAFICA CETE de l’Ouest 19
Figure 3.3: Plan of the Regional Express Railway Network (REN)
Figure 3.4 : The urban zones of the Brussels study area

STRATEC STASA CASA LT CERTU TRT STRAFICA CETE de l’Ouest 20
3.2.2. Presentation of the study area
As for the other case cities, the study area has been divided in 3 zones: the urban centre has been defined as the Brussels-Capital Region, it is surrounded by a first outer urban ring, and then by a wide hinterland. The whole area is covering a zone with a 30km radius around Brussels, is composed by 135 communes (study unit), and contains the Brussels -Capital Region (centre) and territories of Flemish (North) and of Walloon Regions (South). The first periphery (outer urban ring presented on Figure 3.5) is composed by 33 communes, and the hinterland is composed by 83 communes.
Figure 3.5: Urban definition of case study Brussels
This study area comprises the Brussels -Capital Region and its suburbs, but also (in the hinterland) a further belt with secondary cities (Aalst, Leuven, Mechelen, Louvain-la-Neuve for example), which are more autonomous from Brussels. One also has to keep in mind that several important cities, with strong economic functions, are located close to the study area, such as Antwerp or Liège (economic poles), generating strong exchanges with some parts of the study area.
The Brussels-Capital Region has been created in 1989 and has been autonomous since then. The Region is an agglomeration of 19 communes, constituting one of the three Regions of the federal state of Belgium. It is the capital of Belgium, the siege of the French and Flemish communities, and the siege of European institutions officially since 1992. Brussels-Capital Region contained 964.405 inhabitants in 2001, and covers a territory of 162 km². However, this regional area is smaller than the continuous built up agglomeration (“agglomération morphologique”).

STRATEC STASA CASA LT CERTU TRT STRAFICA CETE de l’Ouest 21
Regarding these specific functions and the study area as a whole, the urban morphology has changed: the urbanisation of the area has been modified, and its socio-economic characteristics as well. The following sections will study in particular the evolution of the study area between 1991 and 2001.
3.2.3. Evolution of urbanisation between 1991 and 2001
In 2001, the study area, with a total area of 4331 km², comprises 2.945.000 inhabitants, of which 40.5% are active and resident. Since 1991, population and jobs have globally increased (respectively + 3.7% and +12.1%).
This study area has a strategic position at the European scale: close to two important European harbours (Antwerp and Rotterdam), on the Paris-Amsterdam axis which concentrates ¾ of the European logistic activities, it is also the administrative capital of Europe.
The increase of population and activities generates an increasing consumption of space: the total built area has increased of 18.1% from 1991 to 2001, with a yearly growth of 1304 ha. This growth is essentially due to a growth of residential areas and heavy activity areas.
However, the population density, regarding the residential areas, has decreased during that period: from 60.7 inhabitants/ha, it has come to 52.9 inhabitants/ha. In parallel, the land consumption per inhabitant has increased, from 1.65 ares to 1.89 ares. The growth is not homogeneous in space. The central urban area is nearly totally saturated; on the other hand, new development axes can be identified, some secondary poles appear, and a general phenomenon of sprawl seems to have occurred. A competition for space is taking place, between jobs and households, which involves their needs, preferences, and costs, regarding localisation and transport. A filtering process of households and jobs occurs, leading to a specialisation of locations.
3.2.4. Evolution of the population and the socio-economic variables between 1991 and 2001
When the three defined zones (urban centre, outer urban ring and hinterland) are compared in terms of population, it appears that the central urban region has gained 1.1% inhabitants between 1991 and 2001, when it was loosing population since 1967. But the suburbs grew more: the hinterland has grown the most, by 5.1%, whereas the outer urban ring has grown by 4.7%.
The jobs have grown by 12.1% from 1991 to 2001, but differently for different types of jobs having different location needs. Three different types can be distinguished:

STRATEC STASA CASA LT CERTU TRT STRAFICA CETE de l’Ouest 22
• Jobs consuming much space per employee: they have decreased in the study area by 10.2%. They include industrial, logistic, wholesale, transport and construction activities. They need large and cheap spaces, and a location with great car accessibility, but not necessarily close to the city. They have decreased in number in the urban centre, but slightly increased in periphery;
• Jobs in the decision centres of companies or administrations: they have increased by
22.6%. They include national and international administrations and private services to companies. They need a location with good accessibility by car and public transport, take benefit from being near the airport, and generally search for prestigious locations or locations with aesthetic quality. They have increased in all three of the defined zones;
• Jobs in the induced tertiary sector: they have increased by 19.8%. They include retail
trade, local private and public services. Their location is a response to the population’s demand, so that they are very sensitive to demographic variations. They are located in space according to a fine grid with commercial and services nodes. They have increased in all three zones.
The jobs have globally increased in each of the three defined zones, but not equally: the central area has had the lowest increase (4%), meanwhile the first outer urban ring has had the greatest increase (30.3%). The hinterland has had a considerable increase of jobs as well (16.3%). The first urban ring appears thus has having been the most attractive in this period.
The principal statement coming out of these observations is that sprawl has occurred during this period, in terms of jobs and population, with a strong consumption of space (2% of increase per year).

STRATEC STASA CASA LT CERTU TRT STRAFICA CETE de l’Ouest 23
Figure 3.6: Growth rhythm of total built area between 1991 and 2000 – synthesis (based on cadastral data)

STRATEC STASA CASA LT CERTU TRT STRAFICA CETE de l’Ouest 24
3.3. Overall presentation of Helsinki
3.3.1. Study Area
Helsinki, the capital city of Finland, forms a metropolitan area with the three other neighbouring cities, Espoo, Kauniainen and Vantaa. The study area covers not only the metropolitan area but also other parts of the Province of Southern Finland as well as the largest neighbouring towns of Lahti and Hameenlinna. This is due to the fact that the influence of the metropolitan area is expanding as an employment centre to serve the surrounding region. There are almost 50 municipalities in the study area.
The area is situated in the coastal area of the Gulf of Finland. It is some 200 km wide and extends approximately 150 km inland to the north totalling approximately 11 000 km2 of which about 95% is land and 5% covered by water. The metropolitan area itself covers 764 km2 of which 743 km2 is land and 21 km2 water (excluding sea area). Helsinki is actually a quite large region that includes both urban and rural areas.
The city has, in general, expanded in concentric rings as the population and economy have grown. However, the important transport corridors have attracted growth further away from the centre than otherwise would be expected.
By the 1960s, the radial road network was largely in place and the currently visible "Maple Leaf' form of the urban sprawl began to form supported by the second industrialisation and the resulting migration from the countryside to the cities.
The completion of the two ring roads and the current plans to build more private and public transport facilities in a circular fashion in the metropolitan area are likely to lessen the outward trend of land use away from the city centre.

STRATEC STASA CASA LT CERTU TRT STRAFICA CETE de l’Ouest 25
Figure 3.7: Urban definition of case study Helsinki
3.3.2. Population
The metropolitan area has the largest concentration of people in Finland. The total number of inhabitants in the study area is over 1.6 million people (out of 5.2 million in the whole country). Of this, 1 million people live in the metropolitan area. The growth has been sig-nificant especially after the Second World War and then levelling down in the seventies and eighties. In the 1990’s the region was growing faster once again. The rapid growth of population is estimated to continue, with the rate slowly decreasing, to the year 2020. It is expected that in 2020 there will live 1,1 million people in the metropolitan area. This rapid population growth increases the pressure to urban sprawl as well as the use of the natural areas within the existing structure. It is expected that Helsinki can only accommodate less than one-fourth of the forecast growth, the rest being directed to the other cities of the metropolitan area.
The population is slightly younger and more educated than in the rest of the country on average. 16% of the population in the study area are aged 14 years or under and about 10 % are 65 years or over. In the metropolitan area, both these shares are approximately same.
The average size of the household has been decreasing over the decades from 2.8 in 1970 to the current 2.1 in the metropolitan area. This is significantly lower than in the rest of the country. The average of the household is 2.3 for the whole of Finland.
The average population density is 96 inhabitants/km2 in the study area, 1251 inh./km2 in the metropolitan area and 2974 inh./km2 in Helsinki. The average figure for the whole of Finland is 15 inh./km2.
STRATEC STASA CASA LT CERTU TRT STRAFICA CETE de l’Ouest 26
3.3.3. Transport
On a normal working day, altogether over 3 million trips are made in the metropolitan area and 5 million trips in the study area. The mobility of the inhabitants has constantly increased, especially as measured in terms of the use of motorised modes. The urban sprawl has caused the lengthening of the trips and large increases in total vehicle kilometres. The amount of trips is much more constant over time but exhibits a shift from non-motorised to motorised travel.
The supply of transport supply provides good coverage in the area and there are, in general, no major problems. There are radial motorways originating from Helsinki to all directions as well as two main ring roads. The network of other roads is dense.
In the metropolitan area, the public transport level of service is better than in the rest of the region. There is a dense bus network, a metro line, commuter train lines and tram lines in the metropolitan area. For the rest of the area, the network consists of trains and buses.
During the last decades, the sprawl has been fought against by, for example, metro and rail investments and with an efficient bus system. As a result the decline of public transport share has stopped. But urban sprawl is still a problem. In parallel with the population growth predicted by 2020, it is predicted that mobility will increase more than the population. 1% growth in population causes 2% growth in car mileage resulting in environmental, congestion and other problems. One reason for this is the decentralising land use, but also the number of trips is expected to grow. If policies favouring public transport will be pursued, it is forecast that the share of collective transport will start slightly rising again. The speeds of vehicle traffic in the metropolitan area will continue their slight decrease unless the increase in the use of the private car can be curbed. The growing traffic will increase the noise nuisance experienced by the inhabitants. It has been estimated that the population living in areas where the daily average noise level exceeds 55 dB(A) will increase by about 15% to more than 200 000 people by 2020.

STRATEC STASA CASA LT CERTU TRT STRAFICA CETE de l’Ouest 27
3.3.4. Social Features
A sign of the structural change in the 1990s is the stratification of population and regions. The spread in income1 levels has increased along with the demand for the less educated labour force diminishing. The Helsinki Metropolitan area and its surroundings form a region that has been the most successful one in the country, but also within the region itself certain areas are prosperous while others are impoverished.
The unemployment rate in 2001 was 6 % in the study area and 9 % in the whole country. The rates rose sharply in the early 1990s because of the economic recession, which was largely due to the over-heating in the economy of 80s. During the 1980s, the rates were around or below 3 %. Male unemployment was clearly higher than for females. There have been problems in reducing the undergoing structural changes leading to lower work forces.
The average amount of floorspace per person in 2001 was 33.7 m2 in the study area and 32.6 m2 in the metropolitan area and 32 m2 in Helsinki (35 m2 in the whole country). The figure has been growing rapidly from 21 m2 in 1970 as the household sizes are getting smaller.
3.3.5. Economy
Helsinki region comprises about one third of the national GDP of Finland. In addition to its administrative status as the capital city and home for industry headquarters, the economy of the region is based on retail, wholesale and private services. The region, therefore, has a surplus in its trade with the rest of the country. While the traditional manufacturing industries have been declining, the share of high-technology industries and services has been growing. The large and concentrated traditional industries such as metal and paper are not typically located in the region. Consequently, the foreign exports are not so dominant as for the rest of the country. As a big concentration of population, the level of imports is high.
3.3.6. Housing Prices
Housing prices are significantly higher (66 %) in the metropolitan area than in the rest of the country. The housing market has been very volatile; from the boom of late eighties and the collapse in early nineties. In late nineties housing prices was growing once again.
1 Income includes here wages and salaries, entrepreneurial income and other income subject to state taxation

STRATEC STASA CASA LT CERTU TRT STRAFICA CETE de l’Ouest 28
Figure 3.8: Shaping the spatial structure of the Helsinki Metropolitan Area in the 1900s 2
Figure 3.9: Commuting trip lengths in 1993 (left) and in 1999 (right), focal smoothening
2 Lahti, P. & al. 1985. Yhdyskuntarakenteen kehitysnäkymät erityisesti yhdyskuntatekniikan ja teknologian kehityksen näkökulmasta. Suomen kaupunkiliiton julkaisusarja C 109. Espoo.

STRATEC STASA CASA LT CERTU TRT STRAFICA CETE de l’Ouest 29
3.4. Overall presentation of Milan
3.4.1. Introduction
Milan region, Lombardia, is situated in the north west of Italy; it covers a surface of 23,861 square Km. and includes 11 Provinces with a total of 1,546 Municipalities and more than 9,100,000 inhabitants. The Milan case city study area corresponds with the Milan Province3, one of the richest areas in Italy and in Europe. The study area is composed by 187 Municipalities and, for better understand the sprawl phenomenon, was divided in 3 functional and/or institutional areas: the main Municipality (Milan city), the Milan metropolitan area (outer urban ring), composed by the 38 Municipalities surrounding Milan, and the rest of the Province.
A further subdivision of the study area (see Figure 3.10) keeps into account the a different zoning of the Milan Province with an aggregation of the Municipality outside Milan based not on concentric rings, but on “development corridors”. Such zones, that have some characteristics of homogeneity, are the north zone (Main Municipalities are Sesto S. Giovanni and the ones located in the Brianza), the east zone (Vimercate and Municipality sourrounding the Adda river), the south zone (mainly rural), the west zone (Magenta and Abbiategrasso) and the northwest zone (Rho Legnano).
2001 data Municipalities Surface Population Density Milan 1 182 1,301,551 7,213 Metropolitan area 38 448 1,114,784 2,488 Rest of Province 149 1,337 1,350,257 1,010 Tot. Province 188 1,967 3,766,592 1,915
Table 3.4: Main figures of the Milan Province
During the last decades, Milan municipality has experienced a radical process of de-industrialisation and a constant loss of population. The transition characteristics of the entire area can be seen in the current asset (and in the changes it had in the last decades) of the economical and productive structures. These aspects can be seen in the major municipality, in the metropolitan area and, in general, in the whole Lombardia region.
Changes in the socio-economic structure of the whole area led (but it is still an on-going process) to changes in the mobility patterns within, and sometimes outside, the metropolitan area: from a centripetal pattern (with focus on Milan) to a centrifugal one (with focus on the metropolitan area). Such changes were not supported by an efficient transport supply, except for the road network (with the building of the external ring roads), and public transport is still designed according to the "historical" radial patterns within the metropolitan area.
The need of new and sometimes different transport services is strongly present in the local political debate and pushes local authorities to implement (or to ask for) new transport infrastructures and services.
3 Milan Province Includes 188 Municipalities but one of them, San Colombano al Lambro, is located
outside the rest of province territory and so outside study area. In 1995, when the new Province of Lodi was established and included part of the Milan Province territory, this Municipality chose not to join the new Province.

STRATEC STASA CASA LT CERTU TRT STRAFICA CETE de l’Ouest 30
RhoLegnano
MagentaAbbiategrasso
Milano
SestoBrianza
VimercateAdda
Sud
Figure 3.10: The Milan study area
Figure 3.11: Zoning system of Milan case study
STRATEC STASA CASA LT CERTU TRT STRAFICA CETE de l’Ouest 31
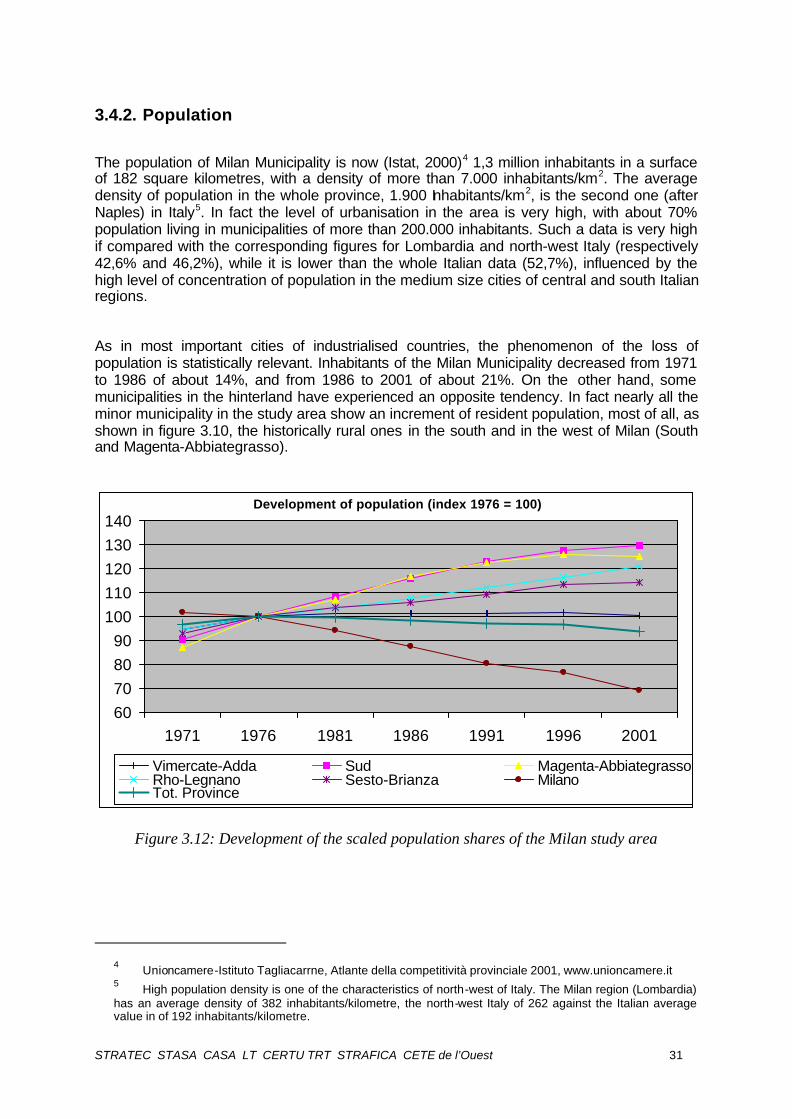
3.4.2. Population
The population of Milan Municipality is now (Istat, 2000)4 1,3 million inhabitants in a surface of 182 square kilometres, with a density of more than 7.000 inhabitants/km2. The average density of population in the whole province, 1.900 Inhabitants/km2, is the second one (after Naples) in Italy5. In fact the level of urbanisation in the area is very high, with about 70% population living in municipalities of more than 200.000 inhabitants. Such a data is very high if compared with the corresponding figures for Lombardia and north-west Italy (respectively 42,6% and 46,2%), while it is lower than the whole Italian data (52,7%), influenced by the high level of concentration of population in the medium size cities of central and south Italian regions.
As in most important cities of industrialised countries, the phenomenon of the loss of population is statistically relevant. Inhabitants of the Milan Municipality decreased from 1971 to 1986 of about 14%, and from 1986 to 2001 of about 21%. On the other hand, some municipalities in the hinterland have experienced an opposite tendency. In fact nearly all the minor municipality in the study area show an increment of resident population, most of all, as shown in figure 3.10, the historically rural ones in the south and in the west of Milan (South and Magenta-Abbiategrasso).
Development of population (index 1976 = 100)
60
70
80
90
100
110
120
130
140
1971 1976 1981 1986 1991 1996 2001
Vimercate-Adda Sud Magenta-AbbiategrassoRho-Legnano Sesto-Brianza MilanoTot. Province
Figure 3.12: Development of the scaled population shares of the Milan study area
4 Unioncamere-Istituto Tagliacarrne, Atlante della competitività provinciale 2001, www.unioncamere.it
5 High population density is one of the characteristics of north-west of Italy. The Milan region (Lombardia)
has an average density of 382 inhabitants/kilometre, the north-west Italy of 262 against the Italian average value in of 192 inhabitants/kilometre.

STRATEC STASA CASA LT CERTU TRT STRAFICA CETE de l’Ouest 32
The age structure of population in 2000 shows, as a demonstration of the productivity vocation of the area, a working age rate of population - from 15 to 64 years old - higher than the average Italian data (70,2% v/s 67,6%). The average income in the province of Milan in 1998 (Istituto Tagliacarne), is one of the highest in Italy: € 18.200 against the average Italian data € 13.500.
3.4.3. Production sectors
With more than 402,000 economic activities on its territory, the province of Milan occupies the first place at national level. The importance of industrial sectors, traditionally very high, is now (Istat, 2000) comparable with national data: 26% (employees 34%) in the Province against 25% (employees 32%) of Italy.
In fact the "strict" industrial sectors have experienced a radical process of de-industrialisation (partially still going on) that induced in Milan a decrease of employees from 1971 to 1991 of nearly 50%. In the metropolitan area this process is still relevant, but have a different temporal dimension. Statistical data show that the de-industrialisation in the outer urban ring began later than in the city of Milan: in the seventies the loss of industrial employees was of about 27% in Milan and "only" 7% in the metropolitan area. In the following decade, the process affected the two areas in a similar way (Municipality -30%, outer urban ring -27%). The location of industrial activities seems to move more and more in the external areas and have now reached municipalities which are outside the metropolitan area and the Province. A large part of the employees living Milan and the north industrialised Province tends to relocate to the external south and west municipalities.
It must be noted that the number of industry employees is now far higher outside the Milan province: in Milan (as seen above) they represent the 34% of total employees, in Lombardia the 40,5%, and if we consider the Lombardia without Milan Province, the 45%. Anyway the de-industrialisation process does not affect the entire production sector. The metropolitan core is still very attractive - 46% of the activities - for the new innovative, high-tech activities, with natural vocation to research and with need of high specialised employees. Moreover 63% of some "traditional" and highly specialised industries (as tailoring, leather, jewellery, graphics and publishing)6, still choose to locate their activity in the metropolitan core. Thus the industries that seem to move in the external areas are the "mass production" ones, i.e. those which requires wide low cost location and low cost employees with a lower level of specialisation.
6 Perulli, P., Atlante metropolitano, il mutamento sociale nelle grandi città, Il Mulino, Bologna, 1992

STRATEC STASA CASA LT CERTU TRT STRAFICA CETE de l’Ouest 33
Development of employees (index 1981 = 100)
60
70
80
90
100
110
120
130
140
1971 1981 1991 1996 2001Vimercate-Adda SudMagenta-Abbiategrasso Rho-LegnanoSesto-Brianza MilanoTot. Province
Figure 3.14: Development of the scaled employees shares of the Milan study area
3.4.4. Services
Commerce and Services To Business represent in year 2000 (Infocamere), more than 45% of the activities located in the Province (at national level this rate is about 35%). The growth of those sectors at local level began slowly during the seventies (+11%), and had a relevant acceleration in the following decade (e.g. +26% from '80 to '87).
Sectors related to banking and insurance are also very important: in the province these represent the 2,6% of activities against the 1,8% average Italian data. It's important to note that those are the ones with the higher growth rate (+54% in 7 years - from '80 to '87). Little importance have the agricultural sector: 1,4% against 7,1% of Lombardia and 18,8% of Italy.
It is interesting to note that in the study area the average dimension of activities is bigger than anywhere, in fact in Milan province more than 37% worker is employed in firms with more than 200 employees 7.
3.4.5. Car ownership
The Milan region has a very high car ownership rate. This is particularly true in Milan Municipality: in year 1999 (ACI data) 0,70 cars per inhabitant and decreases when referred to the province (0,59) or to the region Lombardia (0,57). In any case it is higher than the Italian average figure of 0,55 cars per inhabitant. It must be noted that this data refers to car owned both by physical persons and by economic activities (and many industrial
7 In Lombardia and north west Italy this percentage is about 25,5% and in whole Italy 21.5%.

STRATEC STASA CASA LT CERTU TRT STRAFICA CETE de l’Ouest 34
headquarters are located in Milan). In fact the car ownership rates derived from a household survey carried out by ATM (Azienda Trasporti Municipali) in 1995 are sensibly lower in Milan and in some other municipalities of the metropolitan area.
It is also worth to notice that in the area the rate of big cars (more than 2.000 c.c.) is higher than the Italian average rate (4.8% v/s 4.2%), and that the rate of renewal of the vehicle fleet is faster than in any other Italian region8.
3.4.6. Commuting trips
The structure of the commuting trips in the province of Milan (1991 Census data) shows the role that has the main Municipality in the study area. Milan attracts and generate commuters in all his metropolitan area, but this influence can be better stated for the recent developed Municipality located in the south and in the west of the Province.
It is to note that those zones, that are mainly residential, despite having a number of firms (and consequently of jobs) lower then the areas located in the north of the Province and a lower level in the public transport facilities, are able to attract a relevant number of trips from Milan. This can be explained by the fact that such zones do not have a strong “identity” and/or autonomy or an independent production structure and thus maintain strong relationships with the main Municipality.
8 The number of new cars purchased in 1999 is 56/1.000 inhabitants in the Milan province, 50 in
Lombardia and 40 in Italy.

STRATEC STASA CASA LT CERTU TRT STRAFICA CETE de l’Ouest 35
3.5. Overall presentation of Rennes
3.5.1. Study Area
The case city Rennes is located in the north-west of France (Brittany region). It covers 140 “communes” and represents a demographic weight of 521,000 inhabitants. Area’s definition is based on a statistical level called in France aire urbaine. It is defined by the French national statistics institute (INSEE) as a functional urban area delimited from analyses of commuters trips after each census. In this study, the limits are coming from the results of the analyses of the commuters trips in 1999. An aire urbaine comprises several local-authority areas (communes) whose 40% oh their inhabitants work in the city centre. Rennes aire urbaine concerns 140 communes with an area of 2542 km2 and represents a demographic weight of 521,000 inhabitants.
The Region of Rennes has no geomorphologic constraints. That’s why urban development is almost uniformly spread over the whole area. Historically, Rennes has always been a roads cross and a front door of Brittany region. A good accessibility by roads to suburban cities must be underlined with a developed free highways network.
Source : INSEE, “aire urbaine”, limits of 1999
Figure 3.15: Definition of the urban centre, outer urban ring and hinterland of the case study Rennes.

STRATEC STASA CASA LT CERTU TRT STRAFICA CETE de l’Ouest 36
For the SCATTER project, we used a typology of zones which needs to be explained in the Rennes case study (Figure 3.15).
Ø The “urban centre” corresponds to the commune of Rennes, the central city.
Ø The “outer urban ring” includes the local authorities which compose with the
commune of Rennes a political institution of cooperation called Rennes Métropole. This institution has been created in 1974 and has implemented several politics about urban planning, transport, environment, housing.
Ø The “hinterland” includes all other the communes of Rennes “aire urbaine” but outside Rennes métropole. It an outer suburbs defined from the daily commuters trips.
3.5.2. Population
Since two decades, Rennes is with Toulouse and Montpellier among the more dynamic of the great French urban areas in terms of growth of population and jobs.
The whole urban area has known a yearly growth of population of 1.6% per year between 1962 and 1999 On a long trend, one can see that Rennes has known a population growth that concerns all the parts of the urban area, but more the suburbs than the core since 1982. This year can be considered like the starting point of the scattered development (Figure 3.16).
4 0
6 0
8 0
1 0 0
1 2 0
1 4 0
1 6 0
1 9 6 0 1 9 6 5 1 9 7 0 1 9 7 5 1 9 8 0 1 9 8 5 1 9 9 0 1 9 9 5 2 0 0 0
urban cen t re outer u rban r ing h in te r land urban a rea
P o p u l a t i o n g r o w t h i n t h e u r b a n a r e a o f R E N N E S
f r om 1962 t o 1999 ( I ndex 100 = 1982 )
Source : census, INSEE
Figure 3.16: Population growth in the urban area of Rennes between 1962 and 1999 (Index : 1982 = 100).

STRATEC STASA CASA LT CERTU TRT STRAFICA CETE de l’Ouest 37
To sum up spatial structure of the case city Rennes and its evolution in the recent period, four characteristics can be underlined.
Ø The city core is still concentrating most of the population, dwellings and jobs (figure 3.17). Except the central city, densely populated (206,000 habitants), the biggest communes of Rennes area have only 10,000 inhabitants. The urban centre represents around 40% of the population of Rennes urban area. The urban centre and the outer urban ring represent 70%. The number of inhabitants in the central area has still known an increase all along this period.
Ø The recent period is still a context of strong growth for the urban area of Rennes (1.3% per year for population between 1990 and 1999, Figure 3.17). In this context, studying the scattered evolutions become of a great interest. Furthermore, one could underline that the number of inhabitants in the central City of Rennes is still increasing all along this period, even if the scattered urban developments are stronger. And that is a big difference with the other cases study, for example Stuttgart or Brussels.
Figure 3.17 : Evolution of population, jobs and housings (1990/1999)
Source : census, INSEE
Area
Main figures average annual growth from 1990 to 1999
population dwellings jobs
1990 1999 1990 1999 1990 1999 population dwellings jobs
Studied area of RENNES (urban area defined by INSEE in 1999)
463,366 521,188 190,052 231,978 202,477 228,445 1.3% 2.2% 1.3%
city of Rennes
197,536 206,229 91,478 108,053 103,915 110,351 0.5% 1.9% 0.7%
Rennes métropole except RENNES
129,075 158,423 43,763 60,616 64,590 78,555 2.3% 3.7% 2.2%
hinterland (urban area except Rennes Metropole)
137,055 156,536 54,811 63,309 33,972 39,539 1.5% 1.6% 1.7%

STRATEC STASA CASA LT CERTU TRT STRAFICA CETE de l’Ouest 38
3.5.3. Land use
A good analyse of the figures requires a knowledge of some morphological elements. Firstly, it is important to keep in mind the fact that there is a very important difference in the level of density between the central city and its suburbs (Figure 3.18).
The map about land use (Figure 3.19) shows that most of the built-up area is located in the central city of Rennes. So, one can says that the commune of Rennes includes most of its inner suburbs ; it means that possibilities for urban sprawling are high even in the inner suburbs but also that the political decisions in term of planning are very important for the sprawling issue even in the core of the urban area.
Urban growth has concerned all the «communes» of the Rennes urban area. But preservation of natural zones has always been a priority leading to an absence of a dense inner suburbs. In particular, the city centre is separated of its neighbouring «communes» by a green belt. Land allocation plans aims at fighting against the development of a contiguous suburban growth.
Figure 3.18 : Density in inhabitants in the urban area of Rennes in 1999
Population in 1999 Surface of the area
(km2)
Density (inhabitants/km2)
Urban centre 206,229 50 4,125
Outer urban ring 158,423 559 283
Hinterland 156,536 1,933 81
Urban area of Rennes 521,188 2,542 205
Source : census, INSEE

STRATEC STASA CASA LT CERTU TRT STRAFICA CETE de l’Ouest 39
Figure 3.19: Land use in the urban area of Rennes (1994)

STRATEC STASA CASA LT CERTU TRT STRAFICA CETE de l’Ouest 40
3.5.4. Economy
Employment is mainly located in the city centre and some of its neighbouring «communes» (figure 3.17). Five local authorities of the central area (that includes 36 communes) represent 80% of the jobs. Whereas residential function is scattered, there’s a spatial polarisation of jobs. Hypermarkets are also located around the city centre.
Industrial manufacturing has been existing in the Rennes area only since the sixties with the implantation of CITROEN. That’s why industrial manufacturing were located immediately in industrial zones around the city core and along the main roads. The fact that Rennes isn’t an old manufacturing city has consequences on urban sprawl. Indeed, it’s difficult for the local government to find old indurial zones in the city centre in the aim to build new housings.
Research and development are well-repersented activities in the Rennes area (communication, data processing). Important centres of research and engineer scholls are located in the Rennes area. University is one of the most important in french west region.
The number of workplaces in administrations and public sector is also important. It can explain why local economic activitie isn’t really affected by economic cycles. It depends a lot of public subsidies.
About local tax, it’s important to note that a one tax rate exists between the 36 communes of Rennes Métropole about location of firms since 1994. It has permitted to limit the concurrence for the location of new economic activities and then to rationalize industrial and business zones planning.
3.5.5. Transport
Rennes area and Brittany region aren’t concerned by the mean relations within the Trans-European Network (TEN). But Rennes area appears as the entrance from the rest of french territory in Brittany region. Historically Rennes area was always a roads cross (Paris, Brest, Nantes, Rouen). The absence of physical barriers has permitted to realize infrastructures without difficulties. Main roads were transformed in a highways network while a ring was built around the city core between 1965 and 1995. Due to urban and regional traffic, the motorway network around the City of Rennes is highly overcharged. There are a bundle of well constructed secondary roads connecting the City of Rennes with the peripherical zone
Public transport network is componed of city buses, metro (one line and a new one in project) and regional rail systems. All modes are present: pedestrian, bicycle, bus, metro, suburban rail, car, as well as intermodal transport opportunities like P&R (park-and-ride).
The railway lines connect Rennes to the other cities of Brittany region (Brest, Lorient, Saint-Brieuc, Vannes) and to Paris (high-speed trains, TGV).
The Rennes area is served by an national airport located in the south-west.

STRATEC STASA CASA LT CERTU TRT STRAFICA CETE de l’Ouest 41
3.6. Overall presentation of Stuttgart
3.6.1. Study Area
The case study Stuttgart covers the whole Stuttgart Region and is situated in the south-west of Germany. The Stuttgart Region exists of six state districts (Kreise, NUTS3) called Boeblingen, Esslingen, Goeppingen, Ludwigsburg, Rems-Murr and the City of Stuttgart with a total of 179 (Gemeinden, NUTS5) communities (Figure 3.20 and Figure 3.21). The overall population of the Stuttgart Region is about 2.6 million inhabitants. Together with its state capital, the City of Stuttgart, it represents the economic and cultural centre of the Federal State of Baden-Wuerttemberg. With an area of 3,700 km2 this region is one of the most densely populated regions of Germany.
The Region of Stuttgart has only a few geomorphologic constraints (horseshoe-like hills of about 200m – 250m above the city centre level in the south). Therefore, the urban development is almost uniformly spread over the whole area. This is reflected in the location of many medium size and big communities (sub-centres) organised almost uniformly around the City of Stuttgart (see Figure 3.20). In summer often a high concentration of ozone and nitrogen oxides can be found.
Figure 3.20: Map of the Stuttgart Region (120 km x 80 km)

STRATEC STASA CASA LT CERTU TRT STRAFICA CETE de l’Ouest 42
Figure 3.21: Definition of the urban centre, outer urban ring and hinterland of the case study Stuttgart
3.6.2. Population
There are about 584,000 inhabitants concentrated in the City of Stuttgart. This corresponds to 22% of the total population of the Stuttgart Region. Taking into account the adjacent communities within a small circle (about 15 km) around the centre of the City of Stuttgart (outer urban ring and urban centre) about 55% of the total population of the Stuttgart Region can be found.
Both the City of Stuttgart and its neighbouring communities are densely populated. The population density is depicted in Figure 3.22. In the Stuttgart Region the average population density counts 570 inhabitants per km2. In the city centre there are about 2900 inhabitants per km2, in the outer urban ring 1100 inhabitants per km2, and only about 440 inhabitants per km2 in the hinterland. The development of the population in the Stuttgart Region during the last few decades is characterised by a strong growth in the periphery (outer urban ring) of the City of Stuttgart (IHK 1990, 1991). In Figure 3.23 the development of the population numbers of the five state districts and of the total population of the Stuttgart Region between 1992 and 2003 are depicted9. The total population of this metropolitan area has grown by about 3% since 1992, beside the enormous decrease in the scaled population of the City of Stuttgart of about 4.5%. Especially the neighbouring districts Boeblingen (7.1%), the Rems-Murr-Kreis (5.5%), and Ludwigsburg (5.0%) are gaining inhabitants, Esslingen (2.4%) and Goeppingen (2.9%) seem to follow the general trend (Haag 2002).
9 Between 1992 and 1999 empirical data are presented, after 1999 forecasted population numbers are shown
(STASA 2001).

STRATEC STASA CASA LT CERTU TRT STRAFICA CETE de l’Ouest 43
Figure 3.22: Population density of the case study Stuttgart (urban centre: 206 km2, outer urban ring: 760 km2 and hinterland: 2690 km2)
Development of the population of the City of Stuttgart and the Region of Stuttgart (index: 1995=100)
94
96
98
100
102
104
106
1992 1993 1994 1995 1996 1997 1998 1999 2000 2001 2002 2003
CITY OF STUTTGART BOEBLINGEN
ESSLINGEN GOEPPINGEN
LUDWIGSBURG REMS-MURR-KREIS
REGION OF STUTTGART
Figure 3.23: Development of the scaled population shares of the Stuttgart Region (Index: 1995=100)

STRATEC STASA CASA LT CERTU TRT STRAFICA CETE de l’Ouest 44
In addition, an enormous growth in industrial and business zones took place in the peripheral zones, which, besides its traffic-generating impact on commuting and passenger transport in general, surely affects freight transport as well and has lead to a dramatic increase in population and workplace redistribution.
3.6.3. Social Features
Increasing demand for available floor space led to a disproportionate enlargement of the settlement area and its corresponding land use . Forty years ago the available floor space per person was merely 26 m2, in the year 2000 it was about 39 m2 In addition the required areas for production and services expanded also dramatically. Both effects are still much stronger than population growth in this particular region. The result is a corresponding decrease of contiguous areas and a related increase of scattered areas (urban sprawl).
Figure 3.24: The distribution of land-prices per m2 for the Stuttgart Region
3.6.4. Land Prices and Rents
In Figure 3.24 the distribution of land prices for the Stuttgart Region is depicted. After a period of population increase in the suburban ring due to strong out-migration processes from the City of Stuttgart, the land-prices in the suburbs (outer urban ring) increased dramatically.
High rent can be found along the main transport axes north-east to south-west, along the motorway A81 and the primary roads B29, B14 and B10. Communities in the neighbourhood of the radial main transport axis exhibit a good accessibility and are favoured by firms in the location choice process. These communities are also attractive places of residence for individuals.

STRATEC STASA CASA LT CERTU TRT STRAFICA CETE de l’Ouest 45
3.6.5. Economy
In the production sector an out-migration of enterprises from Stuttgart during the last decades can be found, mainly into the adjacent districts of the city (90% of all firms which fully changed their location, 100% of companies which opened an additional production place). This redistribution on the level of firms has led to corresponding shifts in the work place distribution. The chosen city-near shifts of firms indicate that not only the centre of Stuttgart did not lose its economical importance as a whole but also that firms are interested to be located close to the heart of the Stuttgart Region.
During the 1970s and 1980s the focus of manufacturing activity shifted from the City of Stuttgart to its surrounding communities. Also a growing population was accommodated in the suburban areas. This can be seen e.g. in the gap of attractiveness between the cities Heidelberg/Mannheim and the Rhine/Neckar-district, the urban districts of Karlsruhe and Heilbronn and the corresponding rural districts. Among the explaining factors of the observed gaps between urban and their closely linked rural districts, differences in the rent level and the prices of land must be mentioned, as well as the rather good accessibility of many urban centres, due to high investments in the transport infrastructure, especially in the radial elements of the transport network.
In 1995 the number of workplaces in the Stuttgart Region was about 1.34 million. In this year 513 workplaces were available to 1,000 inhabitants. It is worthwhile to emphasise that about 30% of the economic power of Baden-Wuerttemberg is concentrated in the region.
A long tradition of industrial manufacturing exists in the Stuttgart Region. The emphasis is given to export oriented branches like the car industry (yearly turn-over in 1994: € 2.4 billion), electrical equipment industry (yearly turn-over in 1994: € 7.1 billion) and mechanical engineering (yearly turn-over 1994: € 1.4 billion).
Modern manufacturers like DaimlerChrysler AG and Porsche in the car sector and firms like Siemens Nixdorf, IBM, Hewlett Packard and Kodak are concentrated in the City of Stuttgart and the outer urban ring as well as 100 different credit institutes and 133 publishing houses. Therefore, the Stuttgart Region belongs to one of the strongest economic regions in Germany. About 35% of the GRP (gross regional product) depends directly on export.
Research and development are important location factors of the Stuttgart Region. The City of Stuttgart houses two universities (University of Stuttgart with about 25,000 students, University of Hohenheim with about 15,000 students) as well as six academies and colleges and several non-university research centres like the German Aerospace Centre DLR, the Fraunhofer- and two Max-Planck-Institutes.
3.6.6. Transport The Stuttgart Region represents an important traffic node within the Trans-European Network (TEN). As to the traffic infrastructure, network elements on all spatial levels are represented: in private vehicle traffic they range from city streets to motorways, and in public transport from city buses, light rail systems (S-Bahn) and subway system (U-Bahn) to high-speed trains (ICE). All modes are present: pedestrian, bicycle, bus, light rail transport, suburban rail, car, as well as intermodal transport opportunities like P&R (park-and-ride). An important east-west link in the international traffic, namely the motorway A8, between Austria and France via Salzburg, Munich, Stuttgart and Karlsruhe exists. The motorway A81 is an important element in the Northern-Europe-Germany-Switzerland-Italy chain. The

STRATEC STASA CASA LT CERTU TRT STRAFICA CETE de l’Ouest 46
railway lines run in parallel to these links and connect the capital to the wider regions mainly by radial elements. Due to urban and regional traffic, the motorway network around the City of Stuttgart is highly overcharged. The consequences are overloading (congestion) leading to serious obstructions in long-distance traffic, as well as high environmental pollution in the adjacent areas of the motorways. The causes of the heavy regional traffic are suspected to be related to the interactions within the traffic system as well as with the settlement structure (SACTRA 1994,1998, Batty 1970). There are a bundle of well constructed secondary roads connecting the City of Stuttgart with the sub-centres of the other five state districts of the Stuttgart Region. The interactions within the traffic system include traffic diversions from the secondary road network, as well as extensive diversions from parallel major roads. In addition, there are also possible diversions in public transport at the time of the installation of the S-Bahn. The Stuttgart Region is served by an international airport located in the south of the City of Stuttgart. This airport is well connected to the region by the S-Bahn (light rail system S2, S3) and a junction to the motorway A8. Currently 6 S-Bahn lines (light rail system) serve mainly the radial axes of commuting traffic directed towards the centre of Stuttgart. In addition those lines connect the ICE-link Mannheim-Munich, as well as the Stuttgart Airport through the city’s central railway station. The existing lines are extremely overburdened in the peak hours - just like the parallel street network - although it still have potential capacity reserves. In the Stuttgart Region there are about 1.6 million listed cars, leading to a car density in the total area in 2001 of 557 private cars per 1,000 inhabitants (653 vehicles per 1000 inhabitants). The road network of the Region of Stuttgart consists of approx. 150 Km motorways and about 3,400 Km of secondary roads.