3-Nov-17 Market - · PDF fileExchange Deal Date Company Client Name Deal Type Quantity Price...
7
MARKET Diary 3-Nov-17 Value % Change SGX NIFTY 10,469.00 0.13% 22,539.12 0.53% HANG SENG 28,577.57 0.21% Sensex 33,573.22 -0.08% Nifty 10,423.80 -0.16% DOW 23,516.26 0.35% Event Today NASDAQ 6,714.94 -0.02% Spin Off CAC 5,510.50 -0.07% SHIVTEX DAX 13,440.93 -0.18% (Exdate : 3.10.2017) FTSE 7,555.32 0.89% Reduction of Capital EW ALL SHARE 19,420.94 0.15% ONGC (Exdate : 3.10.2017) Interim Value % Change EXIDEIND : Rs 1.6/- 29244.00 0.08% GEECEE : Rs 1.5/- 39614.00 -0.22% ONGC : Rs 3/- 60.83 0.13% (Exdate : 3.10.2017) 190.30 1.71% Result 64.61 0.02% BHARATGEAR , EDELWEISS 75.28 0.17% GODREJPROP , HINDALCO, PFC 85.34 -0.65% PNB , SCI, TATAPOWER TITAN , TORNTPHARM , TRIDENT UCOBANK , UNICHEMLAB UNIONBANK , ZENSARTECH Investor Buy(Cr.) Sale(Cr.) Net(Cr.) Concall 02-Nov-17 5442 4409 1033 Glenmark : 8:30 AM , ShriCity : 10:00 AM Nov-17 11574 9502 2071 Natco, HIL : 11:00 AM , Ujjivan : 12 AM 2017 1054791 1075836 (21045) IFB, Srikalahasthi : 3:00 PM , Bharat Road , Royal Orch : 3:30 PM Investor Buy(Cr.) Sale(Cr.) Net(Cr.) Hathway Cabl , Hindalco : 4:00 PM 02-Nov-17 4042 4499 (457) Godrej Prop, Power Grid : 4:30 PM Nov-17 8562 9687 (1124) Union Bank : 6:45 PM 2017 670097 599188 70909 Quote of the Day : "When purchasing depressed stock in troubled companies, seek out the ones with the superior financial positions and avoid the ones with loads of bank debt." Peter Lynch DOLLAR/RS. EURO/RS. % Change in 1 day FII DII Institutional Turnover Yesterday Closing Market POUND/RS. Market Outlook CRUDEOIL Commodity Price ( Yesterday Closing ) GOLD NATURALGAS Commodity/Currencies SILVER % Change in 1 day After opening on a subdued note, Nifty traded in the narrow band of 10412 and 10453 throughout the day on Thursday. At the end of the day the index closed at 10423.80. It had a net loss of 0.16% over the previous trading day’s close. The midcap and small cap indices outperformed the benchmark index and closed the day after gaining 0.2%-0.7%. On the sectoral front, Pharmaceutical stocks were on the buyers’ radar while PSU banking and FMCG stocks have shown some weakness. The breadth of the market was slightly negative with more declines than advances. After making a low of 9687.55 on 28th September, Nifty has given a sharp bullish rally over 7% in a time span of just one month. It has also given a bullish breakout (U-pattern) above 10180 on 16th October. The pattern target of the index is 10675. Currently, the market breadth is stable and midcap and small- cap indices also responding in the same direction with the benchmark index. On downside in near term 10,200 should act as strong support for Nifty NIKKIE Morning Traded Market Nifty Intraday Chart Market Market Narnolia Securities Ltd KEY LEVELS Support 1 : 10272 Resistance 1 : 10400
Transcript of 3-Nov-17 Market - · PDF fileExchange Deal Date Company Client Name Deal Type Quantity Price...

MARKET Diary3-Nov-17
Value % Change
SGX NIFTY 10,469.00 0.13%
22,539.12 0.53%
HANG SENG 28,577.57 0.21%
Sensex 33,573.22 -0.08%
Nifty 10,423.80 -0.16%
DOW 23,516.26 0.35%
Event Today NASDAQ 6,714.94 -0.02%
Spin Off CAC 5,510.50 -0.07%
SHIVTEX DAX 13,440.93 -0.18%
(Exdate : 3.10.2017) FTSE 7,555.32 0.89%
Reduction of Capital EW ALL SHARE 19,420.94 0.15%
ONGC
(Exdate : 3.10.2017)
Interim Value % Change
EXIDEIND : Rs 1.6/- 29244.00 0.08%
GEECEE : Rs 1.5/- 39614.00 -0.22%
ONGC : Rs 3/- 60.83 0.13%
(Exdate : 3.10.2017) 190.30 1.71%
Result 64.61 0.02%
BHARATGEAR , EDELWEISS 75.28 0.17%
GODREJPROP , HINDALCO, PFC 85.34 -0.65%
PNB , SCI, TATAPOWER
TITAN , TORNTPHARM , TRIDENT
UCOBANK , UNICHEMLAB
UNIONBANK , ZENSARTECH Investor Buy(Cr.) Sale(Cr.) Net(Cr.)
Concall 02-Nov-17 5442 4409 1033
Glenmark : 8:30 AM , ShriCity : 10:00 AM Nov-17 11574 9502 2071
Natco, HIL : 11:00 AM , Ujjivan : 12 AM 2017 1054791 1075836 (21045)
IFB, Srikalahasthi : 3:00 PM ,
Bharat Road , Royal Orch : 3:30 PM Investor Buy(Cr.) Sale(Cr.) Net(Cr.)
Hathway Cabl , Hindalco : 4:00 PM 02-Nov-17 4042 4499 (457)
Godrej Prop, Power Grid : 4:30 PM Nov-17 8562 9687 (1124)
Union Bank : 6:45 PM 2017 670097 599188 70909
Quote of the Day : "When purchasing depressed stock in troubled companies, seek out the ones with the
superior financial positions and avoid the ones with loads of bank debt." Peter Lynch
DOLLAR/RS.
EURO/RS.
% Change in 1 day
FII
DII
Institutional Turnover
Yesterday Closing Market
POUND/RS.
Market Outlook
CRUDEOIL
Commodity Price ( Yesterday Closing )
GOLD
NATURALGAS
Commodity/Currencies
SILVER
% Change in 1 day
After opening on a subdued note, Nifty traded
in the narrow band of 10412 and 10453
throughout the day on Thursday. At the end of
the day the index closed at 10423.80. It had a
net loss of 0.16% over the previous trading
day’s close. The midcap and small cap indices
outperformed the benchmark index and
closed the day after gaining 0.2%-0.7%.
On the sectoral front, Pharmaceutical stocks
were on the buyers’ radar while PSU banking
and FMCG stocks have shown some weakness.
The breadth of the market was slightly
negative with more declines than advances.
After making a low of 9687.55 on 28th
September, Nifty has given a sharp bullish rally
over 7% in a time span of just one month. It
has also given a bullish breakout (U-pattern)
above 10180 on 16th October. The pattern
target of the index is 10675. Currently, the
market breadth is stable and midcap and small-
cap indices also responding in the same
direction with the benchmark index.
On downside in near term 10,200 should act
as strong support for Nifty
NIKKIE
Morning Traded Market
Nifty Intraday Chart Market
Market
Narnolia Securities Ltd
KEY LEVELS
Support 1 : 10272
Resistance 1 : 10400
IEA Snapshot
"BUY"
"ACCUMULATE"
Top News>> GODREJCP’s Q2FY18 result concall Highlights:
Consumer off take has improved.
International business grew by 9% YoY in spite of political turmoil
in Kenya and South Africa.
The company is planning to launch new products in coming few
quarters.
HI(Home Insecticide) growth came at 4% in this quarter on the
previous year base of 18%.
Coil business de grown in this quarter due to higher saliency of
wholesale.
Hair color segment: Powder business also declined in this quarter.
Mgt. expects recovery owing to new launches.
Soap: the company has gained market share in No.1 and Cinthol.
Mgt. is confident of better performance in coming quarters.
Pipeline of new launches is strong for coming few quarters.
Management sees early sign of recovery from Indonesian
business. Regain some lost market share in home insecticide.
Management expects stronger growth from Afrian business in
H2FY18.
Rural growth for this quarter remained 1% higher than urban
growth.
Indonesian business: Promotional intensity has declined in last few
months and Home Insecticide category growth has also become
positive. Going forward, management sees gradual improvement.
>> SYNDIBANK Q2FY18 Concall Highlights:-
Loan growth is expected to be in the range of 8-10%.
Slippages for Q2FY18 stands at 1576 cr.
Plan to raise capital in the range of 750-1000 cr through QIP. Tier 1
bond-550 cr and Tier II issuance 500 cr.
Exposure of 12 A/c in NCLT cases-Total exposure-5156 cr. Out of 2906
cr of provisions 2195 cr has been already done.And about 345 cr
provisions to be done in next 2 quarters.
Percentage loan to MCLR-48%.
Reduction in interest rate to 3.5% on saving bank A/C of upto 25 lac
w.e.f 10th oct,2017.
SMA-2 book amounts to 2382 cr in the current quarter.
100-150 branches to be opened in the FY18.
S4A and SDR amounts to 1824 cr in the quarter.
Expected retail growth -15% area.Agri-18%, SME-10% and corporate-4-
5%
CET is expected to be 8% by March18.
Composition of ratings for sept 18-AA-37% , A-20% and BBB and
below-40%.
Credit cost guidance for FY18-2%>> TECH MAHINDRA CONCALL HIGHLIGHTS:
• Margin improved on account of operational efficiency and lower visa
cost
• Expected tax band at 25% to 26%
• IP agreement with visualization and cloud result in cash spent usd
$35mn in 2QFY18, from Q3 usd $105mn will spent in 12 installments.
• Steady progress in seen in 2QFY18 & Utilization as up to companies
top end. 21 client added in 2QFY18
• 2large deals wins in BFSI & Communication
• Better growth in H2 in communication
• Margin expected to continue to improve for Q3 and rest of the year.
• Core telecom:H2 will be slightly better result .
>> HIL Mgt Guideline : Company is seeing goods and services tax
(GST) definitely supporting the market growth and demonetisation
stabilising a lot of consolidation in the market. Company is steadily
looking at improving all its numbers on the working capital.
Company has already come down from 12 percent to 8 percent on
the working capital and a huge element of cost saving drive is
going. The momentum will be on and company can look at closing
the year pretty positively this year
3rd Nov 2017
*For details, refer to our daily report- India Equity Analytics
Looking forward among the Indian Pharma peers Aurobindo Pharma is better placed and has come up with a good performance in the
recent month especially in US by mitigating challenging pricing pressure in US. We believe Auropharma’s US growth momentum to improve
from current levels ,despite Price Erosion ,aided by new product launches and execution of its injectable pipeline which are expected to be
monetized in FY18/FY19. Better cash flow from launches of high margin and limited competition drugs will increase the growth visibility
going forward. We value Auropharma at 3.69x times of FY19 expected BV and recommend a buy rating on the stock with a price target of
Rs.950
3rd Nov 2017
GODREJCP has reported sales growth of 3% YoY(on Comparable basis 10%) to Rs 2507 cr led by 26%YoY growth in soap business. Domestic
volume has shown smart recovery, grew by 10% YoY led by refilling of channels and improvement in offtake. International business revenue
grew by 9% YoY in Constant currency (CC) terms driven by Africa (up by 13% in CC terms), Latin America (up by 30%) and Europe (up by
15%). Company's resilient performance in spite of tough demand scenario and company's thrust on innovation gives us confidence of better
growth going ahead. We believe that new launches and recovery in domestic market after GST will ensure volume growth while cost saving
initiatives like project PI and better product mix will help in maintaining margin going ahead. Presently GODREJCP is trading at 37 times of
FY19 expected EPS. We value it at 40x of 19’s EPS and maintain our target price of Rs 1050
AUROPHARMA
GODREJCP

Exchange Deal Date Company Client Name Deal Type Quantity Price
NSE 02-Nov-17 A2ZINFRA BUY 863152 40
NSE 02-Nov-17 AKSHOPTFBR BUY 839183 30
NSE 02-Nov-17 ARCOTECH BUY 450024 48
NSE 02-Nov-17 CANDC BUY 142903 76
NSE 02-Nov-17 HUBTOWN BUY 402378 141
NSE 02-Nov-17 LOTUSEYE BUY 129552 40
NSE 02-Nov-17 RUCHISOYA BUY 1945068 30
NSE 02-Nov-17 A2ZINFRA SELL 2250322 38
NSE 02-Nov-17 A2ZINFRA SELL 863152 41
NSE 02-Nov-17 AKSHOPTFBR SELL 859713 30
NSE 02-Nov-17 ARCOTECH SELL 544003 49
NSE 02-Nov-17 CELESTIAL SELL 110000 19
NSE 02-Nov-17 HBSTOCK SELL 165655 32
NSE 02-Nov-17 HUBTOWN SELL 402378 141
NSE 02-Nov-17 JBCHEPHARM SELL 472096 290
NSE 02-Nov-17 RUCHISOYA SELL 1945068 30
NSE 02-Nov-17 STAMPEDE SELL 1706288 7
ADROIT FINANCIAL SERVICES PRIVATE LIMITED
JHAVERI TRADING AND INVESTMENT PVT LTD
VICKY R. JHAVERI
SANTOSH THOMAS
PATEL MANAV NARESHBHAI
IL&FS FINANCIAL SERVICES LTD - PROPRIETARY PORTFOLIO
PARTH INFIN BROKERS PVT LTD
Block Deal
PARTH INFIN BROKERS PVT LTD
ADROIT FINANCIAL SERVICES PRIVATE LIMITED
JHAVERI TRADING AND INVESTMENT PVT LTD
ASHIKA SHARE TRADING PVT LTD
F&O OPEN INTEREST ( Number of Contracts )
Nifty Movers NSE Sectoral Indices Performance
Individual Foreign Institutions
MARKET MOVERS (1 MONTH CHANGE)
ADITYA NARAYAN SINGH
DELHI IRON & STEEL CO.PVT LTD
DHARA TECHNOSYSTEM LLP
VICKY R. JHAVERI
ASHISH DHAWAN
PATEL MANAV NARESHBHAI

BSE Code Company Name Date BSE Code Company Name Date
538778 AKASHDEEP 03-Nov-17 500114 TITAN 03-Nov-17
538777 ASIACAP 03-Nov-17 500420 TORNTPHARM 03-Nov-17
505688 BHARATGEAR 03-Nov-17 521064 TRIDENT 03-Nov-17
531556 CORALFINAC 03-Nov-17 532505 UCOBANK 03-Nov-17
532922 EDELWEISS 03-Nov-17 506690 UNICHEMLAB 03-Nov-17
523754 EPCIN 03-Nov-17 532477 UNIONBANK 03-Nov-17
531953 GCCL 03-Nov-17 539118 VRLLOG 03-Nov-17
531375 GCCLINP 03-Nov-17 511147 WSFIN 03-Nov-17
500174 GLFL 03-Nov-17 504067 ZENSARTECH 03-Nov-17
540743 GODREJAGRO 03-Nov-17 532774 AFL 04-Nov-17
533150 GODREJPROP 03-Nov-17 500012 ANDHRAPET 04-Nov-17
511441 GUJCRED 03-Nov-17 500016 ARUNAHTEL 04-Nov-17
500440 HINDALCO 03-Nov-17 526433 ASMTEC 04-Nov-17
517526 INDITALIA 03-Nov-17 524606 BERLDRG 04-Nov-17
506528 KELENRG 03-Nov-17 531582 BERYLSE 04-Nov-17
500245 KIRLFER 03-Nov-17 517236 CALCOM 04-Nov-17
504258 LAKSELEC 03-Nov-17 531067 CONTILI 04-Nov-17
540648 PALASHSEC 03-Nov-17 532240 INDNIPPON 04-Nov-17
532911 PARLESOFT 03-Nov-17 539083 INOXWIND 04-Nov-17
532810 PFC 03-Nov-17 521248 KITEX 04-Nov-17
532461 PNB 03-Nov-17 517206 LUMAXIND 04-Nov-17
531562 PUSHPIN 03-Nov-17 532892 MOTILALOFS 04-Nov-17
523598 SCI 03-Nov-17 524709 NACLIND 04-Nov-17
540203 SFL 03-Nov-17 524654 NATCAPSUQ 04-Nov-17
520086 SICAL 03-Nov-17 539333 PENPEBS 04-Nov-17
532795 SITINET 03-Nov-17 531768 POLYMED 04-Nov-17
514454 SOUTLAT 03-Nov-17 530517 RELAXO 04-Nov-17
517214 SPICEMOBI 03-Nov-17 504614 SARDAEN 04-Nov-17
504959 STOVACQ 03-Nov-17 530075 SELAN 04-Nov-17
530883 SUCROSA 03-Nov-17 513709 SHILGRAVQ 04-Nov-17
500400 TATAPOWER 03-Nov-17 533389 SHILPI 04-Nov-17
534392 VSSL 04-Nov-17
BSE Code Company Name Sale ( Cr. ) Sales Growth ( %) PAT ( Cr.) PAT Growth (%)
02-Nov-17 GET&D 930.00 11.50 37.00 79.80
02-Nov-17 GLENMARK 2316.00 6.60 186.30 (15.10)
02-Nov-17 POWERGRID 7254.20 16.40 2089.70 11.40
02-Nov-17 RAMCOCEM 993.10 (1.90) 141.40 (31.70)
02-Nov-17 SHRIRAMCIT 842.10 14.60 230.70 12.80
02-Nov-17 VEDL 21307.30 34.30 2208.50 76.40
03-Nov-17 TATAPOWER 7108.00 (1.40) 544.40 61.90
03-Nov-17 HINDALCO 26612.20 9.90 1107.30 126.20
03-Nov-17 PNB 3916.70 0.90 415.90 (24.30)
03-Nov-17 SITICABLE 351.60 21.70 (26.50) Loss
Result Calendar Q2FY18
Earning Estimate Q2FY18
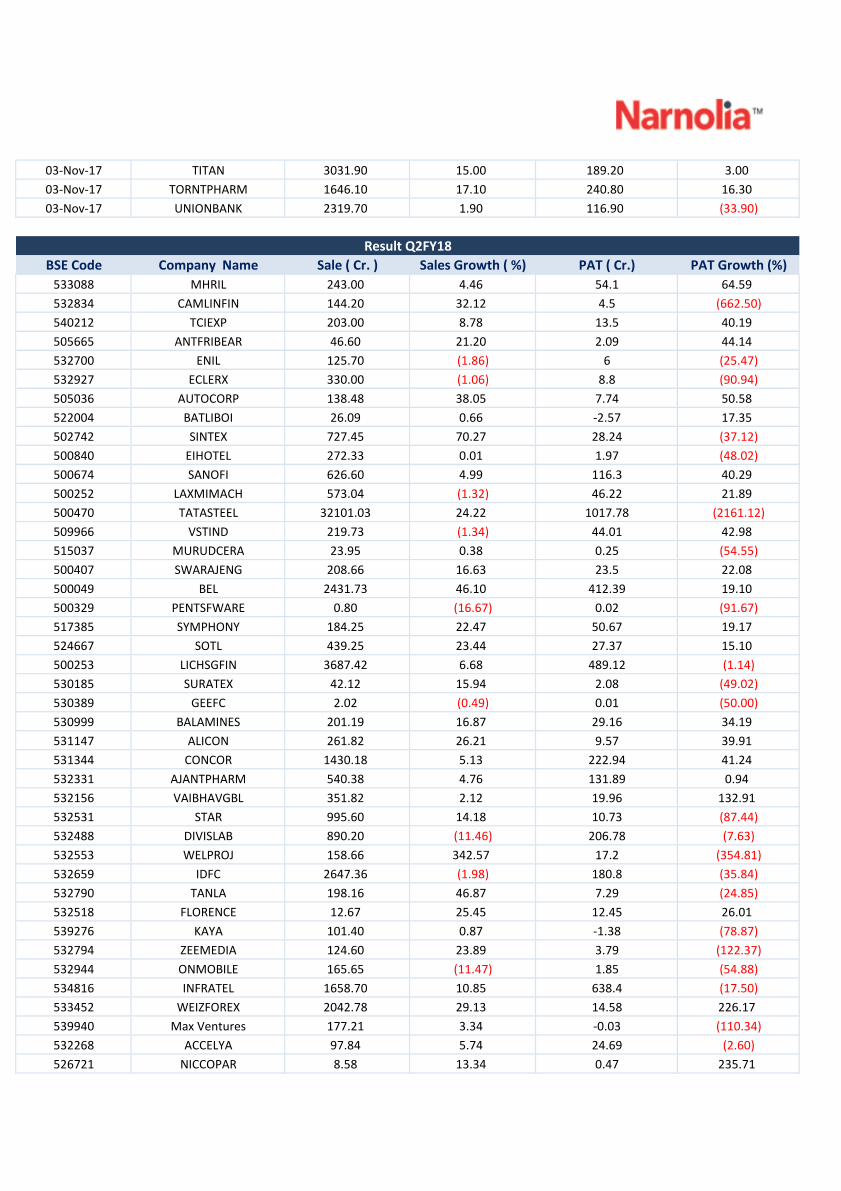
03-Nov-17 TITAN 3031.90 15.00 189.20 3.00
03-Nov-17 TORNTPHARM 1646.10 17.10 240.80 16.30
03-Nov-17 UNIONBANK 2319.70 1.90 116.90 (33.90)
BSE Code Company Name Sale ( Cr. ) Sales Growth ( %) PAT ( Cr.) PAT Growth (%)
533088 MHRIL 243.00 4.46 54.1 64.59
532834 CAMLINFIN 144.20 32.12 4.5 (662.50)
540212 TCIEXP 203.00 8.78 13.5 40.19
505665 ANTFRIBEAR 46.60 21.20 2.09 44.14
532700 ENIL 125.70 (1.86) 6 (25.47)
532927 ECLERX 330.00 (1.06) 8.8 (90.94)
505036 AUTOCORP 138.48 38.05 7.74 50.58
522004 BATLIBOI 26.09 0.66 -2.57 17.35
502742 SINTEX 727.45 70.27 28.24 (37.12)
500840 EIHOTEL 272.33 0.01 1.97 (48.02)
500674 SANOFI 626.60 4.99 116.3 40.29
500252 LAXMIMACH 573.04 (1.32) 46.22 21.89
500470 TATASTEEL 32101.03 24.22 1017.78 (2161.12)
509966 VSTIND 219.73 (1.34) 44.01 42.98
515037 MURUDCERA 23.95 0.38 0.25 (54.55)
500407 SWARAJENG 208.66 16.63 23.5 22.08
500049 BEL 2431.73 46.10 412.39 19.10
500329 PENTSFWARE 0.80 (16.67) 0.02 (91.67)
517385 SYMPHONY 184.25 22.47 50.67 19.17
524667 SOTL 439.25 23.44 27.37 15.10
500253 LICHSGFIN 3687.42 6.68 489.12 (1.14)
530185 SURATEX 42.12 15.94 2.08 (49.02)
530389 GEEFC 2.02 (0.49) 0.01 (50.00)
530999 BALAMINES 201.19 16.87 29.16 34.19
531147 ALICON 261.82 26.21 9.57 39.91
531344 CONCOR 1430.18 5.13 222.94 41.24
532331 AJANTPHARM 540.38 4.76 131.89 0.94
532156 VAIBHAVGBL 351.82 2.12 19.96 132.91
532531 STAR 995.60 14.18 10.73 (87.44)
532488 DIVISLAB 890.20 (11.46) 206.78 (7.63)
532553 WELPROJ 158.66 342.57 17.2 (354.81)
532659 IDFC 2647.36 (1.98) 180.8 (35.84)
532790 TANLA 198.16 46.87 7.29 (24.85)
532518 FLORENCE 12.67 25.45 12.45 26.01
539276 KAYA 101.40 0.87 -1.38 (78.87)
532794 ZEEMEDIA 124.60 23.89 3.79 (122.37)
532944 ONMOBILE 165.65 (11.47) 1.85 (54.88)
534816 INFRATEL 1658.70 10.85 638.4 (17.50)
533452 WEIZFOREX 2042.78 29.13 14.58 226.17
539940 Max Ventures 177.21 3.34 -0.03 (110.34)
532268 ACCELYA 97.84 5.74 24.69 (2.60)
526721 NICCOPAR 8.58 13.34 0.47 235.71
Result Q2FY18

533162 HATHWAY 131.00 (58.91) 14.01 (134.64)
532511 EXCELCROP 384.75 40.19 45.15 79.10
502219 BOROGLASS 79.40 17.87 13.54 24.91
519600 CCL 296.36 114.37 33.42 157.87
532443 CERA 371.55 49.09 27.27 8.47
500097 DALMIASUG 521.30 24.83 37.31 (22.80)
500645 DEEPAKFERT 590.00 (36.74) 20.36 (24.48)
533146 DLINKINDIA 181.48 (10.06) 10.75 50.98
522275 GET&D 869.90 4.30 47.5 131.48
532296 GLENMARK 2223.40 2.31 214.1 (4.24)
533248 GPPL 151.60 (7.53) 44.1 (25.78)
500185 HCC 970.00 6.48 11.6 (49.74)
509631 HEG 409.00 101.48 113 (938.90)
520066 JAYBARMARU 419.55 20.63 16.61 24.79
532835 ICRA 73.77 (19.44) 24.53 13.15
500249 KSBPUMPS 200.47 26.90 11.61 57.53
524816 NATCOPHARM 426.70 2.77 84.1 26.37
535754 ORIENTCEM 523.07 36.12 10.15 (134.54)
532898 POWERGRID 7252.84 16.43 2141 14.37
500260 RAMCOCEM 1029.33 6.12 168.52 (18.59)
522034 SHANTIGEAR 54.00 20.51 7.16 6.39
CountryMonday
30th Oct 17
Tuesday
31th Oct 17
Wednesday
1th Nov 17
Thursday
2th Nov 17
Friday
3th Nov 17
US
Core PCE Price Index m/m ,
Personal Spending m/m ,
Personal Income m/m , Loan
Officer Survey
Employment Cost Index q/q ,
S&P/CS Composite-20 HPI y/y,
Chicago PMI , CB Consumer
Confidence
ADP Non-Farm
Employment Change ,
ISM Manufacturing PMI,
Construction Spending
m/m, Crude Oil
Inventories , FOMC
Statement, Federal
Funds Rate
Prelim Nonfarm Productivity
q/q , Prelim Unit Labor Costs
q/q , Challenger Job Cuts y/y
, Natural Gas Storage.
Average Hourly Earnings
m/m , Non-Farm
Employment Change ,
Unemployment Rate ,
Trade Balance , ISM Non-
Manufacturing PMI ,
Factory Orders m/m.
UK/EURO ZONE
German Retail Sales m/m ,
German Import Prices m/m ,
French Prelim CPI m/m ,
Spanish Flash CPI y/y ,
German Unemployment
Change, Net Lending to
Individuals m/m , M4 Money
Supply m/m
CPI Flash Estimate y/y , Core CPI
Flash Estimate y/y , EU Economic
Forecasts , Prelim Flash GDP q/q ,
Unemployment Rate
Italian Manufacturing
PMI , French Final
Manufacturing PMI,
German Final
Manufacturing PMI,
Manufacturing PMI ,
Spanish Manufacturing
PMI.
Construction PMI , BOE
Inflation Report , MPC
Official Bank Rate Votes ,
Monetary Policy Summary ,
Official Bank Rate , BOE Gov
Carney Speaks.
Services PMI , Spanish
Services PMI , Italian
Services PMI , French Final
Services PMI , German Final
Services PMI.
INDIAAuto no, Nikkei
Manufacturing PMI.Auto no,
Economic Calendar

Narnolia Securities Ltd201 | 2nd Floor | Marble Arch Build ing | 236B-AJC Bose
Road | Kolkata-700 020 , Ph : 033-40501500
email: [email protected],
website : www.narnolia.com
Risk Disclosure & Disclaimer: This report/message is for the personal information of
the authorized recipient and does not construe to be any investment, legal or taxation
advice to you. Narnolia Securities Ltd. (Hereinafter referred as NSL) is not soliciting any
action based upon it. This report/message is not for public distribution and has been
furnished to you solely for your information and should not be reproduced or
redistributed to any other person in any from. The report/message is based upon publicly
available information, findings of our research wing “East wind” & information that we
consider reliable, but we do not represent that it is accurate or complete and we do not
provide any express or implied warranty of any kind, and also these are subject to change
without notice. The recipients of this report should rely on their own investigations,
should use their own judgment for taking any investment decisions keeping in mind that
past performance is not necessarily a guide to future performance & that the the value of
any investment or income are subject to market and other risks. Further it will be safe to
assume that NSL and /or its Group or associate Companies, their Directors, affiliates
and/or employees may have interests/ positions, financial or otherwise, individually or
otherwise in the recommended/mentioned securities/mutual funds/ model funds and
other investment products which may be added or disposed including & other mentioned
in this report/message.