Gemcitabine as adjuvant chemotherapy in patients with high ...

Journals Library
DOI 10.3310/hta23640
3-month versus 6-month adjuvant chemotherapy for patients with high-risk stage II and III colorectal cancer: 3-year follow-up of the SCOT non-inferiority RCT Timothy Iveson, Kathleen A Boyd, Rachel S Kerr, Jose Robles-Zurita, Mark P Saunders, Andrew H Briggs, Jim Cassidy, Niels Henrik Hollander, Josep Tabernero, Andrew Haydon, Bengt Glimelius, Andrea Harkin, Karen Allan, John McQueen, Sarah Pearson, Ashita Waterston, Louise Medley, Charles Wilson, Richard Ellis, Sharadah Essapen, Amandeep S Dhadda, Mark Harrison, Stephen Falk, Sherif Raouf, Charlotte Rees, Rene K Olesen, David Propper, John Bridgewater, Ashraf Azzabi, David Farrugia, Andrew Webb, David Cunningham, Tamas Hickish, Andrew Weaver, Simon Gollins, Harpreet Wasan and James Paul
Health Technology AssessmentVolume 23 • Issue 64 • December 2019
ISSN 1366-5278


3-month versus 6-month adjuvantchemotherapy for patients with high-riskstage II and III colorectal cancer: 3-yearfollow-up of the SCOT non-inferiority RCT
Timothy Ivesono ,1* Kathleen A Boydo ,2
Rachel S Kerro ,3 Jose Robles-Zuritao ,2
Mark P Saunders,4 Andrew H Briggso ,2 Jim Cassidyo ,5
Niels Henrik Hollandero ,6 Josep Taberneroo ,7
Andrew Haydon,8 Bengt Glimeliuso ,9
Andrea Harkino ,5 Karen Allano ,5 John McQueeno ,5
Sarah Pearsono ,10 Ashita Waterstono ,11
Louise Medleyo ,12 Charles Wilsono ,13 Richard Elliso ,14
Sharadah Essapen,15 Amandeep S Dhaddao ,16
Mark Harrison,17 Stephen Falko ,18 Sherif Raoufo ,19
Charlotte Rees,1 Rene K Oleseno ,20 David Proppero ,21
John Bridgewatero ,22 Ashraf Azzabio ,23
David Farrugiao ,24 Andrew Webbo ,25
David Cunninghamo ,26 Tamas Hickish,27
Andrew Weavero ,28 Simon Gollins,29
Harpreet Wasano30 and James Paulo 4
1Southampton University Hospital NHS Foundation Trust, Southampton, UK2Institute of Health and Wellbeing, University of Glasgow, Glasgow, UK3Department of Oncology, University of Oxford, Oxford, UK4The Christie Hospital NHS Foundation Trust, Manchester, UK5Cancer Research UK Clinical Trials Unit, Institute of Cancer Sciences,University of Glasgow, Glasgow, UK
6Department of Oncology and Palliative Care, Zealand University Hospital,Naestved, Denmark
7Vall d’Hebron University Hospital and Institute of Oncology, UniversitatAutònoma de Barcelona, Barcelona, Spain
8Australasian Gastro-Intestinal Trials Group, Camperdown, NSW, Australia9University of Uppsala, Uppsala, Sweden
10Oncology Clinical Trials Office, Department of Oncology, University of Oxford,Oxford, UK
11Beatson West of Scotland Cancer Centre, Glasgow, UK

12Royal United Hospital, Bath, UK13Addenbrooke’s Hospital, Cambridge, UK14Royal Cornwall Hospitals NHS Trust, Cornwall, UK15St Luke’s Cancer Centre, Royal Surrey County Hospital NHS Foundation Trust,Guildford, UK
16Castle Hill Hospital, Hull, UK17Mount Vernon Cancer Centre, Northwood, UK18Bristol Cancer Institute, Bristol, UK19Barking Havering and Redbridge University Hospital NHS Trust, Barking, UK20Department of Oncology, Aarhus University Hospital, Aarhus, Denmark21Barts Cancer Institute, Queen Mary University of London, London, UK22Department of Oncology, University College London, London, UK23Newcastle upon Tyne Hospitals NHS Foundation Trust, Newcastle uponTyne, UK
24Gloucestershire Oncology Centre, Cheltenham General Hospital, UK25Brighton and Sussex University Hospital Trust, Brighton, UK26Royal Marsden NHS Foundation Trust, London, UK27Poole Hospital NHS Foundation Trust, Poole, UK28Department of Oncology, Oxford University Hospitals Foundation Trust,Oxford, UK
29North Wales Cancer Treatment Centre, Rhyl, UK30Hammersmith Hospital, Imperial College Healthcare NHS Trust, London, UK
*Corresponding author
Declared competing interests of authors: Timothy Iveson reports honoraria from Amgen Inc. (ThousandOaks, CA, USA), Bayer AG (Leverkusen, Germany), Bristol-Myers Squibb (New York, NY, USA), CelgeneCorporation (Summit, NJ, USA), Pierre-Fabre (Paris, France), Roche (Roche Holding AG, Basel, Switzerland)and Servier (Laboratories Servier, Suresnes, France). Kathleen A Boyd reports grants from the MedicalResearch Council during the conduct of the study. Mark P Saunders reports personal fees from Servier,Amgen, Merck (Merck and Co., Kenilworth, New Jersey, USA), Eisai (Eisai Co., Ltd., Tokyo, Japan) andRoche outside the submitted work. Jim Cassidy reports grants from the Medical Research Council duringthe conduct of the study and is currently an employee of Celgene Corporation. Josep Tabernero reportspersonal fees from Array Biopharma (Boulder, CO, USA), AstraZeneca (Cambridge, UK), Bayer AG(Leverkusen, Germany), BeiGene (Beijing, China), Boehringer Ingelheim (Ingelheim am Rhein, Germany),Chugai (Chugai Pharmaceutical Co., Tokyo, Japan), Genentech, Inc. (South San Francisco, CA, USA),Genmab A/S (Copenhagen, Denmark), Halozyme (Halozyme Therapeutics, San Diego, CA, USA), ImugeneLimited (Sydney, NSW, Australia), Inflection Biosciences Limited (Blackrock, Dublin), Ipsen (Paris, France),Kura Oncology (San Diego, CA, USA), Eli Lilly and Company (Indianapolis, IN, USA), Merck, Menarini (TheMenarini Group, Florence, Italy), Merck Serono (Rockland, MA, USA), Merrimack Pharmaceuticals (MA, USA),Merus (Utrecht, the Netherlands), Molecular Partners (Molecular Partners AG, Zurich, Switzerland), Novartis(Novartis International AG, Basel, Switzerland), Peptomyc, Pfizer Inc. (New York, NY, USA), Pharmacyclics(Pharmacyclics LLC, Sunnyvale, CA, USA), ProteoDesign SL (Barcelona, Spain), Rafael Pharmaceuticals (StonyBrook, NY, USA), F. Hoffmann-La Roche Ltd, Sanofi (Sanofi S. A., Paris, France), Seattle Genetics (Bothwell,WA, USA), Servier, Symphogen (Symphogen A/S, Ballerup, Denmark), Taiho Pharmaceutical (Tokyo, Japan),VCN Biosciences (Barcelona, Spain), Biocartis (Biocartis Group, Mechelen, Belgium), Foundation Medicine(Cambridge, MA, USA), HalioDX (Marseille, France), SAS Pharmaceuticals (Delhi, India) and Roche Diagnosticsoutside the submitted work. Bengt Glimelius reports support from PledPharma AB for being on advisoryboards. Sherif Raouf reports grants, personal fees and non-financial support from Roche, grants and personalfees from Amgen, and grants and personal fees from Merck outside the submitted work. David Farrugiareports that he received honoraria for speaking in educational events and support for meeting attendance

from Bristol-Myers Squibb, Novartis, Ipsen, Amgen, AstraZeneca and Merck. David Cunningham reportsgrants from 4SC (4SC AG, Planegg, Germany), AstraZeneca, Bayer, Amgen, Celgene, Clovis Oncology(Boulder, CO, USA), Eli Lilly and Company, Janssen Pharmaceuticals (Beerse, Belgium), MedImmune(Gaithersburg, MD, USA), Merck, Merrimack and Sanofi, outside the submitted work. Tamish Hickish reportsgrants from Pfizer, Roche, Pierre Fabre (Paris, France) and personal fees from Eli Lilly and Company during theconduct of the study. John Bridgewater reports funding from the University College London Hospitals NHSFoundation Trust/University College London Biomedical Research Centre. David Cunningham reports fundingfrom the National Institute for Health Research Biomedical Research Centres at the Royal Marsden.
Published December 2019DOI: 10.3310/hta23640
This report should be referenced as follows:
Iveson T, Boyd KA, Kerr RS, Robles-Zurita J, Saunders MP, Briggs AH, et al. 3-month versus
6-month adjuvant chemotherapy for patients with high-risk stage II and III colorectal cancer:
3-year follow-up of the SCOT non-inferiority RCT. Health Technol Assess 2019;23(64).
Health Technology Assessment is indexed and abstracted in Index Medicus/MEDLINE, ExcerptaMedica/EMBASE, Science Citation Index Expanded (SciSearch®) and Current Contents®/Clinical Medicine.


Health Technology Assessment HTA/HTA TAR
ISSN 1366-5278 (Print)
ISSN 2046-4924 (Online)
Impact factor: 3.819
Health Technology Assessment is indexed in MEDLINE, CINAHL, EMBASE, The Cochrane Library and the Clarivate Analytics ScienceCitation Index.
This journal is a member of and subscribes to the principles of the Committee on Publication Ethics (COPE) (www.publicationethics.org/).
Editorial contact: [email protected]
The full HTA archive is freely available to view online at www.journalslibrary.nihr.ac.uk/hta. Print-on-demand copies can be purchased from thereport pages of the NIHR Journals Library website: www.journalslibrary.nihr.ac.uk
Criteria for inclusion in the Health Technology Assessment journalReports are published in Health Technology Assessment (HTA) if (1) they have resulted from work for the HTA programme, and (2) theyare of a sufficiently high scientific quality as assessed by the reviewers and editors.
Reviews in Health Technology Assessment are termed ‘systematic’ when the account of the search appraisal and synthesis methods(to minimise biases and random errors) would, in theory, permit the replication of the review by others.
HTA programmeHealth Technology Assessment (HTA) research is undertaken where some evidence already exists to show that a technology can be effectiveand this needs to be compared to the current standard intervention to see which works best. Research can evaluate any intervention used inthe treatment, prevention or diagnosis of disease, provided the study outcomes lead to findings that have the potential to be of direct benefitto NHS patients. Technologies in this context mean any method used to promote health; prevent and treat disease; and improve rehabilitationor long-term care. They are not confined to new drugs and include any intervention used in the treatment, prevention or diagnosis of disease.
The journal is indexed in NHS Evidence via its abstracts included in MEDLINE and its Technology Assessment Reports inform National Institutefor Health and Care Excellence (NICE) guidance. HTA research is also an important source of evidence for National Screening Committee (NSC)policy decisions.
This reportThe research reported in this issue of the journal was funded by the HTA programme as project number 14/140/84. The contractual start datewas in December 2015. The draft report began editorial review in August 2018 and was accepted for publication in June 2019. The authorshave been wholly responsible for all data collection, analysis and interpretation, and for writing up their work. The HTA editors and publisherhave tried to ensure the accuracy of the authors’ report and would like to thank the reviewers for their constructive comments on the draftdocument. However, they do not accept liability for damages or losses arising from material published in this report.
This report presents independent research funded by the National Institute for Health Research (NIHR). The views and opinions expressed byauthors in this publication are those of the authors and do not necessarily reflect those of the NHS, the NIHR, NETSCC, the HTA programmeor the Department of Health and Social Care. If there are verbatim quotations included in this publication the views and opinions expressedby the interviewees are those of the interviewees and do not necessarily reflect those of the authors, those of the NHS, the NIHR, NETSCC,the HTA programme or the Department of Health and Social Care.
© Queen’s Printer and Controller of HMSO 2019. This work was produced by Iveson et al. under the terms of a commissioningcontract issued by the Secretary of State for Health and Social Care. This issue may be freely reproduced for the purposes ofprivate research and study and extracts (or indeed, the full report) may be included in professional journals provided thatsuitable acknowledgement is made and the reproduction is not associated with any form of advertising. Applications forcommercial reproduction should be addressed to: NIHR Journals Library, National Institute for Health Research, Evaluation,Trials and Studies Coordinating Centre, Alpha House, University of Southampton Science Park, Southampton SO16 7NS, UK.
Published by the NIHR Journals Library (www.journalslibrary.nihr.ac.uk), produced by Prepress Projects Ltd, Perth, Scotland(www.prepress-projects.co.uk).

NIHR Journals Library Editor-in-Chief
Professor Ken Stein Professor of Public Health, University of Exeter Medical School, UK
NIHR Journals Library Editors
Professor John Powell Chair of HTA and EME Editorial Board and Editor-in-Chief of HTA and EME journals. Consultant Clinical Adviser, National Institute for Health and Care Excellence (NICE), UK, and Senior Clinical Researcher, Nuffield Department of Primary Care Health Sciences, University of Oxford, UK
Professor Andrée Le May Chair of NIHR Journals Library Editorial Group (HS&DR, PGfAR, PHR journals) and Editor-in-Chief of HS&DR, PGfAR, PHR journals
Professor Matthias Beck Professor of Management, Cork University Business School, Department of Management and Marketing, University College Cork, Ireland
Dr Tessa Crilly Director, Crystal Blue Consulting Ltd, UK
Dr Eugenia Cronin Senior Scientific Advisor, Wessex Institute, UK
Dr Peter Davidson Consultant Advisor, Wessex Institute, University of Southampton, UK
Ms Tara Lamont Director, NIHR Dissemination Centre, UK
Dr Catriona McDaid Senior Research Fellow, York Trials Unit, Department of Health Sciences, University of York, UK
Professor William McGuire Professor of Child Health, Hull York Medical School, University of York, UK
Professor Geoffrey Meads Professor of Wellbeing Research, University of Winchester, UK
Professor John Norrie Chair in Medical Statistics, University of Edinburgh, UK
Professor James Raftery Professor of Health Technology Assessment, Wessex Institute, Faculty of Medicine, University of Southampton, UK
Dr Rob Riemsma Reviews Manager, Kleijnen Systematic Reviews Ltd, UK
Professor Helen Roberts Professor of Child Health Research, UCL Great Ormond Street Institute of Child Health, UK
Professor Jonathan Ross Professor of Sexual Health and HIV, University Hospital Birmingham, UK
Professor Helen Snooks Professor of Health Services Research, Institute of Life Science, College of Medicine, Swansea University, UK
Professor Ken Stein Professor of Public Health, University of Exeter Medical School, UK
Professor Jim Thornton Professor of Obstetrics and Gynaecology, Faculty of Medicine and Health Sciences, University of Nottingham, UK
Professor Martin Underwood Warwick Clinical Trials Unit, Warwick Medical School, University of Warwick, UK
Please visit the website for a list of editors: www.journalslibrary.nihr.ac.uk/about/editors
Editorial contact: [email protected]
NIHR Journals Library www.journalslibrary.nihr.ac.uk

Abstract
3-month versus 6-month adjuvant chemotherapy forpatients with high-risk stage II and III colorectal cancer:3-year follow-up of the SCOT non-inferiority RCT
Timothy Ivesono ,1* Kathleen A Boydo ,2 Rachel S Kerro ,3
Jose Robles-Zuritao ,2 Mark P Saunders,4 Andrew H Briggso ,2
Jim Cassidyo ,5 Niels Henrik Hollandero ,6 Josep Taberneroo ,7
Andrew Haydon,8 Bengt Glimeliuso ,9 Andrea Harkino ,5
Karen Allano ,5 John McQueeno ,5 Sarah Pearsono ,10
Ashita Waterstono ,11 Louise Medleyo ,12 Charles Wilsono ,13
Richard Elliso ,14 Sharadah Essapen,15 Amandeep S Dhaddao ,16
Mark Harrison,17 Stephen Falko ,18 Sherif Raoufo ,19 Charlotte Rees,1
Rene K Oleseno ,20 David Proppero ,21 John Bridgewatero ,22
Ashraf Azzabio ,23 David Farrugiao ,24 Andrew Webbo ,25
David Cunninghamo ,26 Tamas Hickish,27 Andrew Weavero ,28
Simon Gollins,29 Harpreet Wasano 30 and James Paulo 4
1Southampton University Hospital NHS Foundation Trust, Southampton, UK2Institute of Health and Wellbeing, University of Glasgow, Glasgow, UK3Department of Oncology, University of Oxford, Oxford, UK4The Christie Hospital NHS Foundation Trust, Manchester, UK5Cancer Research UK Clinical Trials Unit, Institute of Cancer Sciences, University of Glasgow,Glasgow, UK
6Department of Oncology and Palliative Care, Zealand University Hospital, Naestved, Denmark7Vall d’Hebron University Hospital and Institute of Oncology, Universitat Autònoma de Barcelona,Barcelona, Spain
8Australasian Gastro-Intestinal Trials Group, Camperdown, NSW, Australia9University of Uppsala, Uppsala, Sweden
10Oncology Clinical Trials Office, Department of Oncology, University of Oxford, Oxford, UK11Beatson West of Scotland Cancer Centre, Glasgow, UK12Royal United Hospital, Bath, UK13Addenbrooke’s Hospital, Cambridge, UK14Royal Cornwall Hospitals NHS Trust, Cornwall, UK15St Luke’s Cancer Centre, Royal Surrey County Hospital NHS Foundation Trust, Guildford, UK16Castle Hill Hospital, Hull, UK17Mount Vernon Cancer Centre, Northwood, UK18Bristol Cancer Institute, Bristol, UK19Barking Havering and Redbridge University Hospital NHS Trust, Barking, UK20Department of Oncology, Aarhus University Hospital, Aarhus, Denmark21Barts Cancer Institute, Queen Mary University of London, London, UK22Department of Oncology, University College London, London, UK23Newcastle upon Tyne Hospitals NHS Foundation Trust, Newcastle upon Tyne, UK
DOI: 10.3310/hta23640 HEALTH TECHNOLOGY ASSESSMENT 2019 VOL. 23 NO. 64
© Queen’s Printer and Controller of HMSO 2019. This work was produced by Iveson et al. under the terms of a commissioning contract issued by the Secretary of State for Healthand Social Care. This issue may be freely reproduced for the purposes of private research and study and extracts (or indeed, the full report) may be included in professionaljournals provided that suitable acknowledgement is made and the reproduction is not associated with any form of advertising. Applications for commercial reproduction shouldbe addressed to: NIHR Journals Library, National Institute for Health Research, Evaluation, Trials and Studies Coordinating Centre, Alpha House, University of Southampton SciencePark, Southampton SO16 7NS, UK.
vii

24Gloucestershire Oncology Centre, Cheltenham General Hospital, UK25Brighton and Sussex University Hospital Trust, Brighton, UK26Royal Marsden NHS Foundation Trust, London, UK27Poole Hospital NHS Foundation Trust, Poole, UK28Department of Oncology, Oxford University Hospitals Foundation Trust, Oxford, UK29North Wales Cancer Treatment Centre, Rhyl, UK30Hammersmith Hospital, Imperial College Healthcare NHS Trust, London, UK
*Corresponding author [email protected]
Background: Oxaliplatin and fluoropyrimidine chemotherapy administered over 6 months is the standardadjuvant regimen for patients with high-risk stage II or III colorectal cancer. However, the regimen isassociated with cumulative toxicity, characterised by chronic and often irreversible neuropathy.
Objectives: To assess the efficacy of 3-month versus 6-month adjuvant chemotherapy for colorectalcancer and to compare the toxicity, health-related quality of life and cost-effectiveness of the durations.
Design: An international, randomised, open-label, non-inferiority, Phase III, parallel-group trial.
Setting: A total of 244 oncology clinics from six countries: UK (England, Scotland, Wales and NorthernIreland), Denmark, Spain, Sweden, Australia and New Zealand.
Participants: Adults aged ≥ 18 years who had undergone curative resection for high-risk stage II or IIIadenocarcinoma of the colon or rectum.
Interventions: The adjuvant treatment regimen was either oxaliplatin and 5-fluorouracil or oxaliplatin andcapecitabine, randomised to be administered over 3 or 6 months.
Main outcome measures: The primary outcome was disease-free survival. Overall survival, adverseevents, neuropathy and health-related quality of life were also assessed. The main cost categories werechemotherapy treatment and hospitalisation. Cost-effectiveness was assessed through incremental costcomparisons and quality-adjusted life-year gains between the options and was reported as net monetarybenefit using a willingness-to-pay threshold of £30,000 per quality-adjusted life-year per patient.
Results: Recruitment is closed. In total, 6088 patients were randomised (3044 per group) between27 March 2008 and 29 November 2013, with 6065 included in the intention-to-treat analyses (3-monthanalysis, n = 3035; 6-month analysis, n = 3030). Follow-up for the primary analysis is complete. The 3-yeardisease-free survival rate in the 3-month treatment group was 76.7% (standard error 0.8%) and in the6-month treatment group was 77.1% (standard error 0.8%), equating to a hazard ratio of 1.006 (95%confidence interval 0.909 to 1.114; p-value for non-inferiority = 0.012), confirming non-inferiority for3-month adjuvant chemotherapy. Frequent adverse events (alopecia, anaemia, anorexia, diarrhoea,fatigue, hand–foot syndrome, mucositis, sensory neuropathy, neutropenia, pain, rash, altered taste,thrombocytopenia and watery eye) showed a significant increase in grade with 6-month duration; thegreatest difference was for sensory neuropathy (grade ≥ 3 was 4% for 3-month vs.16% for 6-monthduration), for which a higher rate of neuropathy was seen for the 6-month treatment group from month4 to ≥ 5 years (p < 0.001). Quality-of-life scores were better in the 3-month treatment group over months4–6. A cost-effectiveness analysis showed 3-month treatment to cost £4881 less over the 8-year analysisperiod, with an incremental net monetary benefit of £7246 per patient.
Conclusions: The study achieved its primary end point, showing that 3-month oxaliplatin-containingadjuvant chemotherapy is non-inferior to 6 months of the same regimen; 3-month treatment showed abetter safety profile and cost less. For future work, further follow-up will refine long-term estimates of theduration effect on disease-free survival and overall survival. The health economic analysis will be updatedto include long-term extrapolation for subgroups. We expect these analyses to be available in 2019–20.The Short Course Oncology Therapy (SCOT) study translational samples may allow the identification ofpatients who would benefit from longer treatment based on the molecular characteristics of their disease.
ABSTRACT
NIHR Journals Library www.journalslibrary.nihr.ac.uk
viii

Trial registration: Current Controlled Trials ISRCTN59757862 and EudraCT 2007-003957-10.
Funding: This project was funded by the National Institute for Health Research (NIHR) Health TechnologyAssessment programme and will be published in full in Health Technology Assessment; Vol. 23, No. 64.See the NIHR Journals Library website for further project information. This research was supported by theMedical Research Council (transferred to NIHR Evaluation, Trials and Studies Coordinating Centre – Efficacyand Mechanism Evaluation; grant reference G0601705), the Swedish Cancer Society and Cancer ResearchUK Core Clinical Trials Unit Funding (funding reference C6716/A9894).
DOI: 10.3310/hta23640 HEALTH TECHNOLOGY ASSESSMENT 2019 VOL. 23 NO. 64
© Queen’s Printer and Controller of HMSO 2019. This work was produced by Iveson et al. under the terms of a commissioning contract issued by the Secretary of State for Healthand Social Care. This issue may be freely reproduced for the purposes of private research and study and extracts (or indeed, the full report) may be included in professionaljournals provided that suitable acknowledgement is made and the reproduction is not associated with any form of advertising. Applications for commercial reproduction shouldbe addressed to: NIHR Journals Library, National Institute for Health Research, Evaluation, Trials and Studies Coordinating Centre, Alpha House, University of Southampton SciencePark, Southampton SO16 7NS, UK.
ix

Contents
List of tables xiii
List of figures xv
List of abbreviations xvii
Plain English summary xix
Scientific summary xxi
Chapter 1 Introduction 1
Chapter 2 Methods 3Study design 3Study participants 3
Public/patient involvement 4Study interventions 4
Oxaliplatin and 5-fluorouracil 4Oxaliplatin and capecitabine 4
Objectives 5Outcomes 5
Sample size 5Randomisation 6Statistical analyses 7
Efficacy and safety analyses 7Changes to the study protocol 8
Chapter 3 Results 9Participant recruitment and flow 9Baseline data 9Exposure to study medication 9Comparison of efficacy for 3-month versus 6-month adjuvant chemotherapy 13
Disease-free survival 13Overall survival 22Safety 22Health-related quality of life 27
Chapter 4 Economic analyses 35Methodology 35
Outcome data 35Cost data 36Cost-effectiveness 37
Results 37Effectiveness 37Costs 41Cost-effectiveness 45
DOI: 10.3310/hta23640 HEALTH TECHNOLOGY ASSESSMENT 2019 VOL. 23 NO. 64
© Queen’s Printer and Controller of HMSO 2019. This work was produced by Iveson et al. under the terms of a commissioning contract issued by the Secretary of State for Healthand Social Care. This issue may be freely reproduced for the purposes of private research and study and extracts (or indeed, the full report) may be included in professionaljournals provided that suitable acknowledgement is made and the reproduction is not associated with any form of advertising. Applications for commercial reproduction shouldbe addressed to: NIHR Journals Library, National Institute for Health Research, Evaluation, Trials and Studies Coordinating Centre, Alpha House, University of Southampton SciencePark, Southampton SO16 7NS, UK.
xi
Chapter 5 Discussion 51Efficacy assessment 51
Chemotherapy regimen 52Disease stage 53
Safety and toxicity 54Peripheral neuropathy 55
Health-related quality of life 55Health-related quality of life and peripheral neuropathy 56
Health economic assessment 56Study context 57Limitations of the study 57
Chapter 6 Conclusions 59Implications for practice and implications for research 60
Acknowledgements 61
References 65
Appendix 1 Baseline characteristics of analysis subgroups 69
Appendix 2 Reasons for missing quality of life questionnaires, examination ofpattern of missingness and sensitivity analysis 75
Appendix 3 Short Course Oncology Therapy site recruitment andprincipal investigators 79
CONTENTS
NIHR Journals Library www.journalslibrary.nihr.ac.uk
xii
List of tables
TABLE 1 Baseline patient characteristics as recorded at randomisation,by treatment group 11
TABLE 2 Treatment duration by treatment group 12
TABLE 3 Maximum NCI CTCAE grade of toxicity recorded during treatment byrandomised treatment group (for toxicities with an incidence of ≥ 10%) 23
TABLE 4 Patient characteristics by EQ-5D subsample 36
TABLE 5 Overall survival time (restricted mean survival) up to 8 years by healthstatus and treatment group 37
TABLE 6 Overall survival time by health state: subgroup analysis 39
TABLE 7 Health utilities regression 40
TABLE 8 Unit costs used for cost-effectiveness analyses 41
TABLE 9 Hospitalisation unit costs 42
TABLE 10 Adjuvant chemotherapy received by intervention and plannedregimen (mg/patient) 42
TABLE 11 Hospital resources by intervention and planned regimen (night stay,day stay or appointment per patient) 43
TABLE 12 Patient costs by treatment group 45
TABLE 13 Cost estimates and quality-adjusted life-years by treatment group 46
TABLE 14 Cost estimates and QALYs for patient subgroups 47
TABLE 15 Characteristics of patients assessed with NCI CTC AE 69
TABLE 16 Characteristics of patients assessed with EQ-5D 70
TABLE 17 Characteristics of patients assessed with EORTC QLQ-C30/CR29 72
TABLE 18 Characteristics of patients assessed with GOG-Ntx4 73
TABLE 19 Reasons for missing questionnaires as recorded on study CRF 75
TABLE 20 Missing questionnaires (yes/no) by baseline characteristics 76
TABLE 21 Sensitivity analysis of PRO results 77
DOI: 10.3310/hta23640 HEALTH TECHNOLOGY ASSESSMENT 2019 VOL. 23 NO. 64
© Queen’s Printer and Controller of HMSO 2019. This work was produced by Iveson et al. under the terms of a commissioning contract issued by the Secretary of State for Healthand Social Care. This issue may be freely reproduced for the purposes of private research and study and extracts (or indeed, the full report) may be included in professionaljournals provided that suitable acknowledgement is made and the reproduction is not associated with any form of advertising. Applications for commercial reproduction shouldbe addressed to: NIHR Journals Library, National Institute for Health Research, Evaluation, Trials and Studies Coordinating Centre, Alpha House, University of Southampton SciencePark, Southampton SO16 7NS, UK.
xiii


List of figures
FIGURE 1 The CONSORT flow diagram of patient progression through the SCOT trial 10
FIGURE 2 Treatment delivery by treatment group and adjuvant regimen 14
FIGURE 3 (a) Disease-free survival and (b) overall survival, by treatment group 15
FIGURE 4 Plot of 3-month/6-month HR by actual treatment duration (analysisaccording to duration restricted to eligible patients who started treatment) withassociated non-inferiority p-values 16
FIGURE 5 Disease-free survival and heterogeneity in subgroups byminimisation variables 17
FIGURE 6 Disease-free survival by treatment group and adjuvantchemotherapy regimen 18
FIGURE 7 Disease-free survival by treatment group and disease stage 19
FIGURE 8 Disease-free survival by treatment group, disease stage, and adjuvantchemotherapy regimen 20
FIGURE 9 Frequency of patients with selected grade ≥ 3 toxicities, by treatmentgroup and treatment regimen 24
FIGURE 10 Peripheral neuropathy score, by treatment group 25
FIGURE 11 The EORTC global health status, by treatment group 28
FIGURE 12 The EQ-5D self-rated visual analogue scale, by treatment group 30
FIGURE 13 Differences in HRQoL assessments based on the degree of numbness/tingling/discomfort in hands or feet 32
FIGURE 14 Partitioned survival model 35
FIGURE 15 Overall survival partitioned into ToT, disease-free state aftertreatment, and recurrence, Kaplan–Meier estimates over 8 years, by treatmentgroup at (a) 3 months and (b) 6 months 38
FIGURE 16 Evolution of EQ-5D utilities over time, by treatment group 41
FIGURE 17 Cost-effectiveness acceptability curve: base-case analysis 46
FIGURE 18 Cost-effectiveness acceptability curves: subgroup analysis 49
DOI: 10.3310/hta23640 HEALTH TECHNOLOGY ASSESSMENT 2019 VOL. 23 NO. 64
© Queen’s Printer and Controller of HMSO 2019. This work was produced by Iveson et al. under the terms of a commissioning contract issued by the Secretary of State for Healthand Social Care. This issue may be freely reproduced for the purposes of private research and study and extracts (or indeed, the full report) may be included in professionaljournals provided that suitable acknowledgement is made and the reproduction is not associated with any form of advertising. Applications for commercial reproduction shouldbe addressed to: NIHR Journals Library, National Institute for Health Research, Evaluation, Trials and Studies Coordinating Centre, Alpha House, University of Southampton SciencePark, Southampton SO16 7NS, UK.
xv


List of abbreviations
5FU 5-fluorouracil
AE adverse event
AUC area under the curve
CI confidence interval
CONSORT Consolidated Standards ofReporting Trials
CTCAE common terminology criteria foradverse event
DFS disease-free survival
DMC Data Monitoring Committee
EORTC European Organisation for Researchand Treatment of Cancer
EQ-5D EuroQol-5 Dimensions
EQ-5D-3L EuroQol-5 Dimensions,three-level version
FACT/GOG-Ntx4
Functional Assessment of CancerTherapy/Gynecologic OncologyGroup–Neurotoxicity
HR hazard ratio
HRQoL health-related quality of life
IDEA International Duration Evaluationof Adjuvant chemotherapy
IQR interquartile range
ITT intention to treat
i.v. intravenous
NCI National Cancer Institute
NIHR National Institute forHealth Research
NMB net monetary benefit
pNI p-value for non-inferiority
PRO patient-reported outcome
QALY quality-adjusted life-year
RCT randomised controlled trial
SCOT Short Course Oncology Therapy
SD standard deviation
SE standard error
ToT time on treatment
ULN upper limit of normal
WTP willingness to pay
DOI: 10.3310/hta23640 HEALTH TECHNOLOGY ASSESSMENT 2019 VOL. 23 NO. 64
© Queen’s Printer and Controller of HMSO 2019. This work was produced by Iveson et al. under the terms of a commissioning contract issued by the Secretary of State for Healthand Social Care. This issue may be freely reproduced for the purposes of private research and study and extracts (or indeed, the full report) may be included in professionaljournals provided that suitable acknowledgement is made and the reproduction is not associated with any form of advertising. Applications for commercial reproduction shouldbe addressed to: NIHR Journals Library, National Institute for Health Research, Evaluation, Trials and Studies Coordinating Centre, Alpha House, University of Southampton SciencePark, Southampton SO16 7NS, UK.
xvii


Plain English summary
Patients diagnosed with bowel cancer are likely to have surgery to remove the tumour. Patientsdiagnosed with a more advanced stage of the disease are then likely to be offered what is known as
adjuvant chemotherapy – chemotherapy to kill any cancer cells that have already spread but cannot beseen. Adjuvant chemotherapy is usually given over 6 months using two medicines known as oxaliplatinand fluoropyrimidine. This chemotherapy has side effects of diarrhoea, nausea and vomiting, and itreduces the numbers of cells in the blood. It can also damage nerves, which causes discomfort, numbnessand tingling; in some cases, this can go on for years. These side effects are more likely to develop withlonger treatment. This study looked at whether or not shortening the time over which patients were givenoxaliplatin and fluoropyrimidine chemotherapy reduced its effectiveness.
In this large study of over 6000 patients, half of the patients were allocated by chance to be treated for3 months and the other half to be treated for 6 months. Reducing the time that patients had chemotherapyfrom 6 months to 3 months did not make the treatment less effective. When patients treated withchemotherapy over 3 months were compared with those treated over 6 months, 77% of patients in bothgroups were well with no detectable disease 3 years after surgery. Patients were less likely to get sideeffects with 3-month chemotherapy. In particular, the chance of persistent long-term nerve damage waslower, resulting in patients with 3-month chemotherapy having better health-related quality of life.
Overall, the study showed that 3-month adjuvant chemotherapy for patients with bowel cancer is aseffective as 6-month adjuvant chemotherapy and causes fewer side effects.
DOI: 10.3310/hta23640 HEALTH TECHNOLOGY ASSESSMENT 2019 VOL. 23 NO. 64
© Queen’s Printer and Controller of HMSO 2019. This work was produced by Iveson et al. under the terms of a commissioning contract issued by the Secretary of State for Healthand Social Care. This issue may be freely reproduced for the purposes of private research and study and extracts (or indeed, the full report) may be included in professionaljournals provided that suitable acknowledgement is made and the reproduction is not associated with any form of advertising. Applications for commercial reproduction shouldbe addressed to: NIHR Journals Library, National Institute for Health Research, Evaluation, Trials and Studies Coordinating Centre, Alpha House, University of Southampton SciencePark, Southampton SO16 7NS, UK.
xix


Scientific summary
Background
Patients with high-risk stage II or stage III colorectal cancer usually undergo surgical resection, followed by6-month adjuvant chemotherapy. Administration of an oxaliplatin and fluoropyrimidine-based adjuvantchemotherapy regimen improves disease-free survival but is associated with a problematic toxicity profile; inparticular, dose-dependent, cumulative peripheral neuropathy is a key toxicity that can persist long term despitethe treatment for colorectal cancer having been curative. The toxicity of oxaliplatin and fluoropyrimidineregimens is cumulative, so reducing adjuvant treatment duration could ameliorate such effects; however,whether or not shortening the duration of adjuvant treatment could compromise its efficacy is debated.
The cost of colorectal cancer treatment in the year after diagnosis is considerably higher than that oftreating other common cancers. Three-month adjuvant chemotherapy could be anticipated to be morecost-effective than the current standard 6-month treatment, provided that efficacy is maintained.
The Short Course Oncology Therapy (SCOT) study was designed to compare 3-month and 6-monthoxaliplatin-based adjuvant chemotherapy in patients with colorectal cancer in terms of efficacy, toxicity,health-related quality of life and economic aspects.
Objectives
The objectives of the study were to assess the efficacy of 3-month versus 6-month adjuvant chemotherapyfor colorectal cancer and to compare the associated toxicity and health-related quality of life. The primaryend point of the study was disease-free survival, with the null hypothesis being that 3-month chemotherapyis inferior to 6-month chemotherapy with a hazard ratio of > 1.13. Secondary end points were overallsurvival, safety, health-related quality of life and cost-effectiveness parameters.
The economic evaluation explored the cost-effectiveness of 3-month versus 6-month adjuvant chemotherapy(in terms of incremental cost, quality-adjusted life-year gains and net monetary benefit with a willingness-to-pay threshold of £30,000/quality-adjusted life-year), using trial data on treatment and hospitalisation costs,health-related quality of life, and survival outcomes within the timeframe of the SCOT clinical trial.
Methods
The SCOT trial was an international, randomised (1 : 1), open-label (non-blinded), non-inferiority, Phase III,parallel-group trial comparing 3 months with 6 months of oxaliplatin plus fluoropyrimidine adjuvantchemotherapy in patients with high-risk stage II or stage III colorectal cancer. The study was conducted in244 oncology clinics in six countries (the UK, Denmark, Spain, Sweden, Australia and New Zealand).Eligible patients were adults aged ≥ 18 years who had undergone curative resection for high-risk stage II(having one or more of the following risk features: T4 disease, tumour obstruction and/or perforation ofthe primary tumour, < 10 lymph nodes harvested, poorly differentiated histology, perineural invasion orextramural venous/lymphatic vascular invasion) or stage III adenocarcinoma of the colon or the rectum.
DOI: 10.3310/hta23640 HEALTH TECHNOLOGY ASSESSMENT 2019 VOL. 23 NO. 64
© Queen’s Printer and Controller of HMSO 2019. This work was produced by Iveson et al. under the terms of a commissioning contract issued by the Secretary of State for Healthand Social Care. This issue may be freely reproduced for the purposes of private research and study and extracts (or indeed, the full report) may be included in professionaljournals provided that suitable acknowledgement is made and the reproduction is not associated with any form of advertising. Applications for commercial reproduction shouldbe addressed to: NIHR Journals Library, National Institute for Health Research, Evaluation, Trials and Studies Coordinating Centre, Alpha House, University of Southampton SciencePark, Southampton SO16 7NS, UK.
xxi

Patients were randomised (one to one) to receive either 3 months or 6 months of treatment using aminimisation algorithm incorporating a random component. Minimisation factors were study centre,treatment regimen, sex, disease site (colon or rectum), N stage (X, 0, 1 or 2), T stage (X, 0, 1, 2, 3 or 4),and capecitabine starting dose (for those receiving oxaliplatin and capecitabine). The adjuvant treatmentregimen used could be oxaliplatin with 5-fluorouracil or oxaliplatin with capecitabine, with the treatmentselected on an individual-patient basis to reflect the choice of the patient and/or physician.
Disease-free survival was defined as the time from randomisation (or trial registration for those randomisedafter 3 months of therapy) to relapse, development of a new colorectal cancer, or death from any cause.Overall survival was defined as the time from randomisation (or registration for those randomised at3 months) to death from any cause. Comparison of disease-free survival between treatment groups wasbased on a Cox regression model incorporating minimisation factors as covariates; the population selectionwas intention to treat.
Toxicity was assessed by the investigators after each cycle of chemotherapy, with adverse events gradedusing the National Cancer Institute common terminology criteria for adverse events (version 3). Patientswere followed up for a minimum of 3 years to a maximum of 8 years. Health-related quality of life wasassessed using the European Organisation for Research and Treatment of Cancer questionnaires QLQ-C30and QLQ-CR29, and using EuroQol-5 Dimensions, three-level version. Neuropathy was assessed with theFunctional Assessment of Cancer Therapy/Gynecologic Oncology Group–Neurotoxicity (FACT/GOG-Ntx4)questionnaire.
The economic analysis was undertaken from the perspective of the UK NHS and Personal Social Servicesfor 2016. The effectiveness measure for the economic analysis was the discounted quality-adjusted life-year gain per patient. Overall survival data were partitioned into three health states, (1) time on treatment,(2) disease free and (3) recurrence, with Kaplan–Meier sample averages used to compute the quality-adjusted survival time in each health state over the 8-year within-trial period; a separate model estimatedhealth-related quality of life for each health state. Costs associated with patient treatment were calculatedby measuring and valuing resources used by patients during the treatment and follow-up periods. Thetotal cost of treatment per patient was estimated as the Kaplan–Meier survival analysis, considering themain cost categories of chemotherapy treatment and hospitalisation. Bootstrapping was used to accountfor uncertainty of the results and probabilistic sensitivity analysis was reported through confidence intervalsand cost-effectiveness acceptability curves.
Results
A total of 6088 patients from 244 centres were randomised into the trial between 27 March 2008 and29 November 2013: 5244 patients were randomised at 164 study centres in the UK, 311 patients wererandomised at 10 centres in Denmark, 237 patients were randomised at 19 centres in Spain, 197 patientswere randomised at 32 centres in Australia, 83 patients were randomised at 14 centres in Sweden and16 patients were randomised at five centres in New Zealand. Of these, 6065 patients were included in theintention-to-treat analysis population and 6022 patients started study treatment. Data cut-off point for theanalyses was 1 December 2016, at which time patients in both treatment groups had reached a medianfollow-up of 37 months.
Baseline data identified approximately 60% of patients as male and 40% as female, with the medianage being 65 years. Most patients (> 80%) had a diagnosis of colon cancer and approximately 80% hadstage III disease. For about 67% of patients, the planned treatment comprised oxaliplatin and capecitabine,with the remaining 33% of patients planned to receive oxaliplatin and 5-fluorouracil. Baseline characteristicswere comparable for the 3-month and 6-month treatment groups.
SCIENTIFIC SUMMARY
NIHR Journals Library www.journalslibrary.nihr.ac.uk
xxii

Overall, 83.3% of patients randomised to the 3-month treatment group received 3 months of treatmentand 58.8% of those randomised to the 6-month treatment group received 6 months of treatment; 6.9%of patients randomised to the 6-month treatment group stopped treatment at 3 months. The mostcommon reason for not completing 6 months of treatment was an inability to tolerate the associatedtoxicity. The median percentage of the full fluoropyrimidine dose delivered was 95.3% for the 3-monthand 83.2% for the 6-month treatment group; the median percentage of the full oxaliplatin dose deliveredwas 96.6% for the 3-month and 70.2% for the 6-month treatment group.
By the time of analysis, there were 1482 disease-free survival events (740 in the 3-month treatment groupand 742 in the 6-month treatment group). The 3-year disease-free survival rate was 76.7% (standard error0.8%) for the 3-month treatment group and was 77.1% (standard error 0.8%) for the 6-month treatmentgroup; this equated to a hazard ratio of 1.006 (95% confidence interval 0.909 to 1.114; p-value fornon-inferiority = 0.012). The study, therefore, confirmed non-inferiority for 3-month versus 6-monthoxaliplatin-based adjuvant chemotherapy. By the time of analysis, there were 787 deaths, with the 3-yearoverall survival rate for the 3-month treatment group being 90.0% (standard error 0.6%) and for the6-month treatment group 89.6% (standard error 0.6%), equating to a hazard ratio of 0.994 (95%confidence interval 0.964 to 1.143; p-value for non-inferiority = 0.035).
Treatment safety/toxicity was assessed for 868 patients. The most common adverse events seen duringthe study were alopecia, anaemia, anorexia, diarrhoea, fatigue, hand–foot syndrome, mucositis, sensoryneuropathy, neutropenia, pain, rash, altered taste, thrombocytopenia and watery eye; these adverseevents showed a statistically significant increase in severity for the 6-month treatment group compared withthe 3-month treatment group. Sensory neuropathy, diarrhoea, neutropenia, fatigue, pain, nausea andhand–foot syndrome were the most common grade ≥ 3 adverse events reported, with statistically significantdifferences observed between treatment groups for diarrhoea (p = 0.033), neutropenia (p = 0.023), pain(p = 0.014), hand–foot syndrome (p = 0.031) and sensory neuropathy (p < 0.001). The most marked increasein the proportion of patients with grade ≥ 3 with 6-month adjuvant chemotherapy was for sensoryneuropathy (16.4% vs. 4.3% with 3-month treatment). Serious adverse reactions were reported for421 patients in the 3-month treatment group and for 511 patients in the 6-month treatment group.Thirty-two patients died as a result of events attributed to treatment toxicity, with the events distributedequally between the randomised groups (16 patient deaths for both the 3-month and the 6-monthtreatment groups).
Peripheral neuropathy was also assessed using the FACT/GOG-Ntx4 questionnaire, with data available for2871 patients who were assessed for up to 7 years. The neurotoxicity standardised adjusted area underthe curves for questionnaire scores differed markedly between treatment groups (p < 0.001), with a higherrate of neuropathy for the 6-month treatment group being apparent from 4 months and persisting to≥ 5 years (p < 0.001).
Health-related quality of life was assessed using the European Organisation for Research and Treatmentof Cancer QLQ-C30 and CR29 (n = 1829) and EuroQol-5 Dimensions, three-level version (n = 1828) andthe area under the curves was compared. European Organisation for Research and Treatment of CancerQLQ-C30 global health status and functional and symptom scales demonstrated a statistically significantdifference between treatment groups. Scores for the two groups mirrored each other for the first 3 monthsof treatment but subsequently showed functional improvement and decreased side effects in those whostopped treatment at 3 months. The largest difference between the treatment groups was seen at 6 monthsand, thereafter, mean values became more comparable as patients completed 6 months of treatment. Forthe European Organisation for Research and Treatment of Cancer QLQ-CR30, a subset of symptoms showedstatistically significant differences, indicating fewer side effects in patients who received 3-month adjuvantchemotherapy (body image, p = 0.037; dry mouth, p < 0.001; hair loss, p = 0.035; taste alteration,p < 0.0001). The magnitude of the mean differences in functional and global health status scales betweentreatment groups was indicative of ’moderate’ differences in global health status, role functioning and socialfunction and ’a little’ difference in physical, emotional and cognitive functions. Statistically significant
DOI: 10.3310/hta23640 HEALTH TECHNOLOGY ASSESSMENT 2019 VOL. 23 NO. 64
© Queen’s Printer and Controller of HMSO 2019. This work was produced by Iveson et al. under the terms of a commissioning contract issued by the Secretary of State for Healthand Social Care. This issue may be freely reproduced for the purposes of private research and study and extracts (or indeed, the full report) may be included in professionaljournals provided that suitable acknowledgement is made and the reproduction is not associated with any form of advertising. Applications for commercial reproduction shouldbe addressed to: NIHR Journals Library, National Institute for Health Research, Evaluation, Trials and Studies Coordinating Centre, Alpha House, University of Southampton SciencePark, Southampton SO16 7NS, UK.
xxiii

differences in area under the curves between the treatment groups were also seen for both the EuroQol-5Dimensions self-rated visual analogue scale (p = 0.00081) and the EuroQol-5 Dimensions, three-level versionhealth index (p = 0.00081), with differences apparent from months 4 to 6.
Adjuvant chemotherapy costs were higher for the 6-month treatment group (p < 0.001) and hospitalisationcosts differed between treatment groups from 4 to 6 months after the start of treatment (p < 0.001).However, 6-month adjuvant chemotherapy was also associated with higher hospitalisation costs over the7- to 12-month period (p = 0.030), possibly reflecting the persistence of treatment-related complications.No difference in cost was seen between the treatment groups after 12 months. Overall, the cost wassignificantly higher for the 6-month treatment group (p < 0.001), driven primarily by hospitalisation(–£2835) rather than the by cost of the adjuvant chemotherapy agents (–£1829). The 3-month treatmentstrategy was dominant, as it was cost saving and showed an improvement in quality-adjusted life-years,with an incremental net monetary benefit of £7246 per patient. Three-month adjuvant chemotherapy forcolorectal cancer showed 99% probability of being cost-effective across the UK decision threshold rangeof £20,000–30,000 per quality-adjusted life-year.
Conclusions
The SCOT study showed that the efficacy of 3 months of oxaliplatin-containing adjuvant chemotherapy isnon-inferior to 6 months of the same regimen; 6-month treatment was also associated with considerablyhigher levels of toxicity, particularly neurotoxicity, which can be chronic. Compared with traditional6-month adjuvant chemotherapy, the 3-month treatment strategy costs significantly less and has nosignificant detrimental impact on patient outcomes (health-related quality of life and survival). Three-monthoxaliplatin-based chemotherapy should, therefore, be considered as an option as adjuvant therapy forpatients with high-risk stage II or stage III colorectal cancer, particularly when using oxaliplatin andcapecitabine combination therapy.
Recommendations for research
The SCOT trial raised questions regarding whether 3-month treatment is applicable when using oxaliplatin and5-fluorouracil as the adjuvant regimen or when treating patients with high-risk disease (T4 or N2 pathology).Further research should be conducted to identify any specific patient groups (e.g. patients with specific high-risk pathological features) for whom 6 months of adjuvant chemotherapy might be appropriate and if this isdependent on the regimen selected. The translational tissue samples from the SCOT study (3383 tumoursamples and 3100 blood samples) and other similar studies should be used to build molecular predictors ofwhich patients may benefit from a longer treatment duration. Some of this work is currently underway for theSCOT study.
Trial registration
This trial is registered as ISRCTN23516549 and EudraCT 2007-003957-10.
Funding
Funding for this study was provided by the Health Technology Assessment programme of the NationalInstitute for Health Research (NIHR). This research was supported by the Medical Research Council(transferred to NIHR Evaluation, Trials and Studies Coordinating Centre – Efficacy and MechanismEvaluation; grant reference G0601705), the Swedish Cancer Society and Cancer Research UK Core ClinicalTrials Unit Funding (funding reference C6716/A9894).
SCIENTIFIC SUMMARY
NIHR Journals Library www.journalslibrary.nihr.ac.uk
xxiv

Chapter 1 Introduction
Colorectal cancer is a common malignancy, with 1,360,000 cases annually, leading to 694,000 deathseach year. Colorectal cancer accounts for 12% of all new cancer cases each year in the UK, with
approximately 41,265 cases estimated in 2014.1 The initial treatment for patients presenting withcolorectal cancer is usually surgical resection, which is potentially curative; however, 40–50% of patientssubsequently relapse and die as a result of the disease becoming metastatic.2 Postoperative adjuvantfluoropyrimidine-based chemotherapy was first shown to reduce the recurrence of colon cancer in 1990.3
Initially, adjuvant treatment was given for 12 months, but a randomised study suggested equivalence for6 months of treatment,4 which is now accepted as the standard duration for adjuvant chemotherapy inpatients with high-risk stage II or stage III colorectal cancer.5
High-risk stage II is defined as having one of the following risk features: T4 disease, tumour obstructionand/or perforation, < 10 lymph nodes harvested, poorly differentiated histology, perineural invasion orextramural venous/lymphatic vascular invasion.
The addition of oxaliplatin to a fluoropyrimidine-based regimen has been shown to improve 3-year disease-free survival (DFS) in patients with colorectal cancer.6–8 The benefit seen in the MOSAIC6 and NSABP C-077
studies was similar, despite the total oxaliplatin doses being different (1020 mg/m2 and 765 mg/m2,respectively).6,7 These studies led to the adoption of oxaliplatin and fluoropyrimidine chemotherapy asthe adjuvant treatment of choice for most patients with stage III disease who were aged < 70 years.5,9
However, the administration of oxaliplatin with the fluoropyrimidine backbone results in additional toxicity,with increased neutropenia, thrombocytopenia, diarrhoea, nausea and vomiting.6,7 There is also increasedperipheral neuropathy, which is cumulative, dose-dependent and often irreversible, persisting long termdespite the treatment of colorectal cancer having been curative. Neurotoxicity was measured using theNational Cancer Institute (NCI) common terminology criteria for adverse events (CTCAE) (version 1) in MOSAICstudy,6 and the NCI-Sanofi Neurosensory score in the NSABP C-07 study.7 In the MOSAIC trial, 12.4% ofpatients experienced grade 3 sensory neuropathy, with 0.5% having residual problems at 18 months;6 in theNSABP C-07 trial, 8.4% of patients had grade 3 or 4 neuropathy at the end of treatment, with 10% reportingsome residual neuropathy beyond 2 years.10
As the toxicity of oxaliplatin and fluoropyrimidine regimens is cumulative, a reduction in the duration ofadjuvant treatment could potentially ameliorate such effects;11 however, whether or not short-duration adjuvanttreatment could compromise efficacy is widely debated. Data for one study12 are available in the literature,comparing 3 months with 6 months of adjuvant treatment with a fluoropyrimidine-based chemotherapyregimen; however, the study was conducted before the introduction of oxaliplatin-combination adjuvanttreatment. Although the study was somewhat underpowered, reducing treatment duration did not appear toaffect patient outcomes and was associated with reduced toxicity and improved health-related quality oflife (HRQoL).
The cost of treatment for colorectal cancer in the first year after diagnosis is considerably higher thanthat of treating other common cancers and was estimated to cost the English health-care system £542Min 2010.13 Three-month duration adjuvant chemotherapy for patients with colorectal cancer could beanticipated to be more cost-effective than the current standard 6-month duration, provided that efficacyis maintained. Benefits might be associated not only with lower treatment costs but also with reducedexpenditure to manage problematic side effects and improvements in HRQoL.
DOI: 10.3310/hta23640 HEALTH TECHNOLOGY ASSESSMENT 2019 VOL. 23 NO. 64
© Queen’s Printer and Controller of HMSO 2019. This work was produced by Iveson et al. under the terms of a commissioning contract issued by the Secretary of State for Healthand Social Care. This issue may be freely reproduced for the purposes of private research and study and extracts (or indeed, the full report) may be included in professionaljournals provided that suitable acknowledgement is made and the reproduction is not associated with any form of advertising. Applications for commercial reproduction shouldbe addressed to: NIHR Journals Library, National Institute for Health Research, Evaluation, Trials and Studies Coordinating Centre, Alpha House, University of Southampton SciencePark, Southampton SO16 7NS, UK.
1

The Short Course Oncology Therapy (SCOT) study was designed to compare 3-month and 6-monthoxaliplatin-based adjuvant chemotherapy in patients with colorectal cancer in terms of efficacy, toxicity,HRQoL and economic aspects. At the time of starting this study, no published data were available on theeffectiveness of short-duration treatment with adjuvant oxaliplatin and fluoropyrimidine regimens inpatients with colorectal cancer. The main objective of the study was to identify whether or not 3-monthadjuvant chemotherapy was inferior to 6-month treatment in terms of DFS rate. The trial also aimed tocompare overall survival, toxicity and HRQoL in patients between the two treatment groups and to assessthe cost-effectiveness of the two regimens. The SCOT study was designed as an international, stand-alonestudy of adjuvant oxaliplatin and fluoropyrimidine treatment conducted in patients with high-risk stage IIor stage III colon or rectal cancers. Although stand-alone, the SCOT study was conducted in parallel withthe International Duration Evaluation of Adjuvant chemotherapy (IDEA) collaborative initiative, which aimedto consolidate results from numerous worldwide trials that were attempting to clarify the importance ofadjuvant treatment duration for colon cancer patients. The IDEA initiative was restricted to treatment ofpatients with stage III colon cancer; therefore, it was prospectively planned that patient data from the SCOTstudy would be pooled with those from six other studies (TOSCA, IDEA France, CALGB/SWOG 80702,ACHIEVE and HORG).14
INTRODUCTION
NIHR Journals Library www.journalslibrary.nihr.ac.uk
2
Chapter 2 Methods
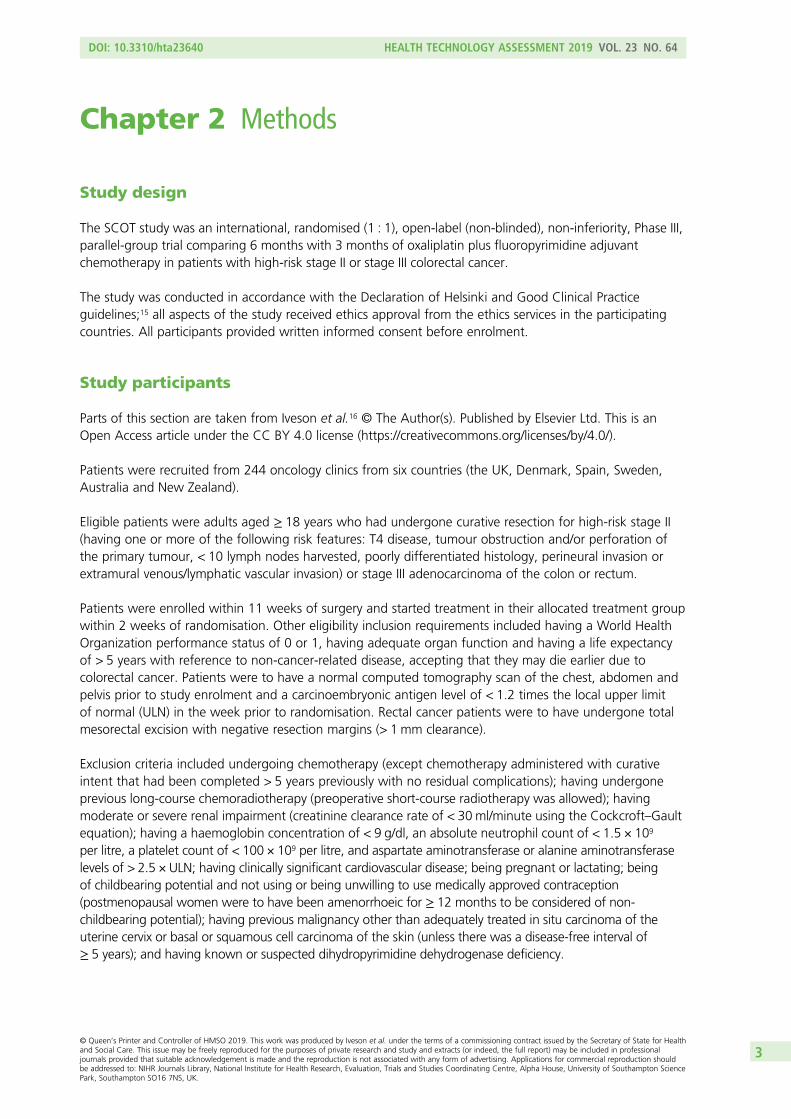
Study design
The SCOT study was an international, randomised (1 : 1), open-label (non-blinded), non-inferiority, Phase III,parallel-group trial comparing 6 months with 3 months of oxaliplatin plus fluoropyrimidine adjuvantchemotherapy in patients with high-risk stage II or stage III colorectal cancer.
The study was conducted in accordance with the Declaration of Helsinki and Good Clinical Practiceguidelines;15 all aspects of the study received ethics approval from the ethics services in the participatingcountries. All participants provided written informed consent before enrolment.
Study participants
Parts of this section are taken from Iveson et al.16 © The Author(s). Published by Elsevier Ltd. This is anOpen Access article under the CC BY 4.0 license (https://creativecommons.org/licenses/by/4.0/).
Patients were recruited from 244 oncology clinics from six countries (the UK, Denmark, Spain, Sweden,Australia and New Zealand).
Eligible patients were adults aged ≥ 18 years who had undergone curative resection for high-risk stage II(having one or more of the following risk features: T4 disease, tumour obstruction and/or perforation ofthe primary tumour, < 10 lymph nodes harvested, poorly differentiated histology, perineural invasion orextramural venous/lymphatic vascular invasion) or stage III adenocarcinoma of the colon or rectum.
Patients were enrolled within 11 weeks of surgery and started treatment in their allocated treatment groupwithin 2 weeks of randomisation. Other eligibility inclusion requirements included having a World HealthOrganization performance status of 0 or 1, having adequate organ function and having a life expectancyof > 5 years with reference to non-cancer-related disease, accepting that they may die earlier due tocolorectal cancer. Patients were to have a normal computed tomography scan of the chest, abdomen andpelvis prior to study enrolment and a carcinoembryonic antigen level of < 1.2 times the local upper limitof normal (ULN) in the week prior to randomisation. Rectal cancer patients were to have undergone totalmesorectal excision with negative resection margins (> 1 mm clearance).
Exclusion criteria included undergoing chemotherapy (except chemotherapy administered with curativeintent that had been completed > 5 years previously with no residual complications); having undergoneprevious long-course chemoradiotherapy (preoperative short-course radiotherapy was allowed); havingmoderate or severe renal impairment (creatinine clearance rate of < 30 ml/minute using the Cockcroft–Gaultequation); having a haemoglobin concentration of < 9 g/dl, an absolute neutrophil count of < 1.5 × 10⁹
per litre, a platelet count of < 100 × 109 per litre, and aspartate aminotransferase or alanine aminotransferaselevels of > 2.5 × ULN; having clinically significant cardiovascular disease; being pregnant or lactating; beingof childbearing potential and not using or being unwilling to use medically approved contraception(postmenopausal women were to have been amenorrhoeic for ≥ 12 months to be considered of non-childbearing potential); having previous malignancy other than adequately treated in situ carcinoma of theuterine cervix or basal or squamous cell carcinoma of the skin (unless there was a disease-free interval of≥ 5 years); and having known or suspected dihydropyrimidine dehydrogenase deficiency.
DOI: 10.3310/hta23640 HEALTH TECHNOLOGY ASSESSMENT 2019 VOL. 23 NO. 64
© Queen’s Printer and Controller of HMSO 2019. This work was produced by Iveson et al. under the terms of a commissioning contract issued by the Secretary of State for Healthand Social Care. This issue may be freely reproduced for the purposes of private research and study and extracts (or indeed, the full report) may be included in professionaljournals provided that suitable acknowledgement is made and the reproduction is not associated with any form of advertising. Applications for commercial reproduction shouldbe addressed to: NIHR Journals Library, National Institute for Health Research, Evaluation, Trials and Studies Coordinating Centre, Alpha House, University of Southampton SciencePark, Southampton SO16 7NS, UK.
3
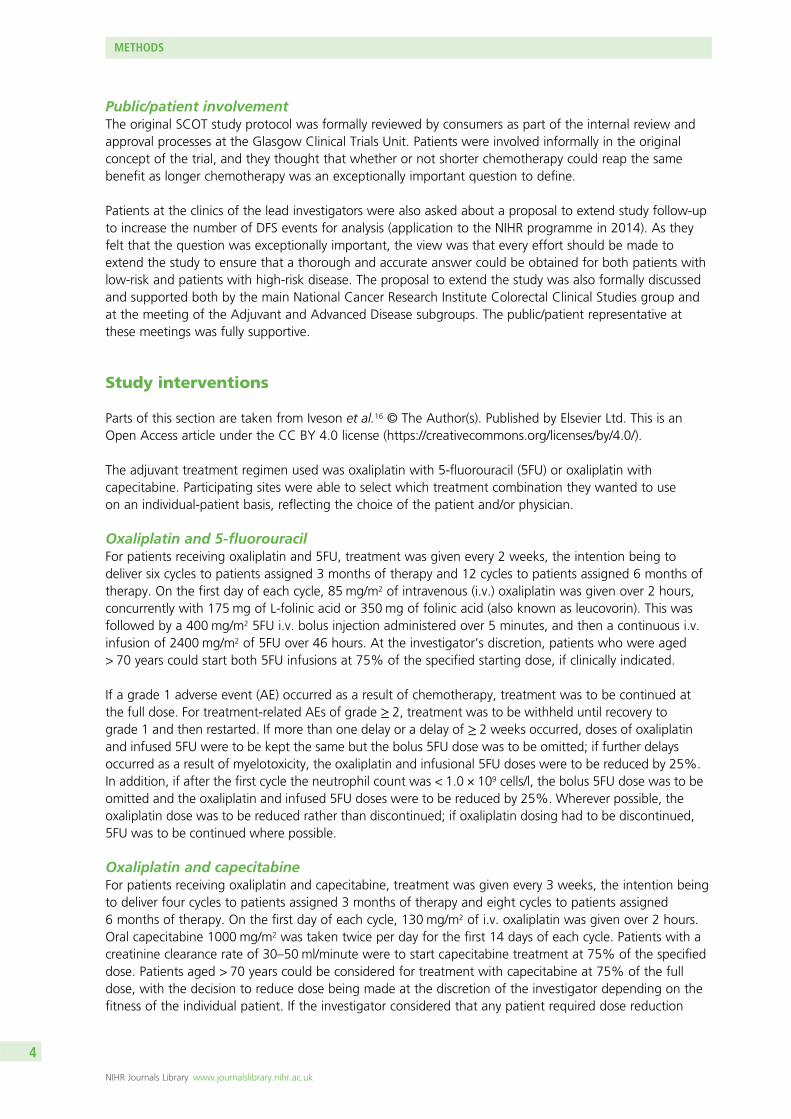
Public/patient involvementThe original SCOT study protocol was formally reviewed by consumers as part of the internal review andapproval processes at the Glasgow Clinical Trials Unit. Patients were involved informally in the originalconcept of the trial, and they thought that whether or not shorter chemotherapy could reap the samebenefit as longer chemotherapy was an exceptionally important question to define.
Patients at the clinics of the lead investigators were also asked about a proposal to extend study follow-upto increase the number of DFS events for analysis (application to the NIHR programme in 2014). As theyfelt that the question was exceptionally important, the view was that every effort should be made toextend the study to ensure that a thorough and accurate answer could be obtained for both patients withlow-risk and patients with high-risk disease. The proposal to extend the study was also formally discussedand supported both by the main National Cancer Research Institute Colorectal Clinical Studies group andat the meeting of the Adjuvant and Advanced Disease subgroups. The public/patient representative atthese meetings was fully supportive.
Study interventions
Parts of this section are taken from Iveson et al.16 © The Author(s). Published by Elsevier Ltd. This is anOpen Access article under the CC BY 4.0 license (https://creativecommons.org/licenses/by/4.0/).
The adjuvant treatment regimen used was oxaliplatin with 5-fluorouracil (5FU) or oxaliplatin withcapecitabine. Participating sites were able to select which treatment combination they wanted to useon an individual-patient basis, reflecting the choice of the patient and/or physician.
Oxaliplatin and 5-fluorouracilFor patients receiving oxaliplatin and 5FU, treatment was given every 2 weeks, the intention being todeliver six cycles to patients assigned 3 months of therapy and 12 cycles to patients assigned 6 months oftherapy. On the first day of each cycle, 85 mg/m2 of intravenous (i.v.) oxaliplatin was given over 2 hours,concurrently with 175 mg of L-folinic acid or 350 mg of folinic acid (also known as leucovorin). This wasfollowed by a 400 mg/m2 5FU i.v. bolus injection administered over 5 minutes, and then a continuous i.v.infusion of 2400 mg/m2 of 5FU over 46 hours. At the investigator’s discretion, patients who were aged> 70 years could start both 5FU infusions at 75% of the specified starting dose, if clinically indicated.
If a grade 1 adverse event (AE) occurred as a result of chemotherapy, treatment was to be continued atthe full dose. For treatment-related AEs of grade ≥ 2, treatment was to be withheld until recovery tograde 1 and then restarted. If more than one delay or a delay of ≥ 2 weeks occurred, doses of oxaliplatinand infused 5FU were to be kept the same but the bolus 5FU dose was to be omitted; if further delaysoccurred as a result of myelotoxicity, the oxaliplatin and infusional 5FU doses were to be reduced by 25%.In addition, if after the first cycle the neutrophil count was < 1.0 × 10⁹ cells/l, the bolus 5FU dose was to beomitted and the oxaliplatin and infused 5FU doses were to be reduced by 25%. Wherever possible, theoxaliplatin dose was to be reduced rather than discontinued; if oxaliplatin dosing had to be discontinued,5FU was to be continued where possible.
Oxaliplatin and capecitabineFor patients receiving oxaliplatin and capecitabine, treatment was given every 3 weeks, the intention beingto deliver four cycles to patients assigned 3 months of therapy and eight cycles to patients assigned6 months of therapy. On the first day of each cycle, 130 mg/m2 of i.v. oxaliplatin was given over 2 hours.Oral capecitabine 1000 mg/m2 was taken twice per day for the first 14 days of each cycle. Patients with acreatinine clearance rate of 30–50 ml/minute were to start capecitabine treatment at 75% of the specifieddose. Patients aged > 70 years could be considered for treatment with capecitabine at 75% of the fulldose, with the decision to reduce dose being made at the discretion of the investigator depending on thefitness of the individual patient. If the investigator considered that any patient required dose reduction
METHODS
NIHR Journals Library www.journalslibrary.nihr.ac.uk
4

because of any other comorbidity, the patient could receive a minimum starting dose of oral capecitabineof 800 mg/m2 twice per day.
If a grade 1 AE occurred as a result of chemotherapy, treatment was to be continued at the full dose.For treatment-related AEs of grade ≥ 2, treatment was to be withheld until recovery to grade 1 and thenrestarted. For AEs related to oxaliplatin and capecitabine, if more than one delay or a delay of ≥ 2 weeksoccurred, capecitabine and oxaliplatin doses were to be reduced by 25%; if further delays occurred as aresult of myelotoxicity, further dose reductions were allowed at the investigator’s discretion.
Objectives
The objective of the SCOT study was to assess the efficacy of 3-month versus 6-month adjuvantchemotherapy for colorectal cancer and to compare the associated toxicity and HRQoL. The study alsoprovided data for an economic analysis of the cost-effectiveness of the two regimens. The primary endpoint of the study was DFS, the null hypothesis being that 3-month chemotherapy is inferior to 6-monthchemotherapy with a hazard ratio (HR) of > 1.13. Secondary end points were overall survival, safety,HRQoL and cost-effectiveness parameters.
The aim of the economic evaluation was to explore the cost-effectiveness of 3-month versus 6-monthadjuvant chemotherapy [in terms of incremental cost per quality-adjusted life-year (QALY) gains and netmonetary benefit (NMB)], using trial data on treatment and hospitalisations costs, HRQoL and survivaloutcomes within the timeframe of the SCOT clinical trial.
OutcomesParts of this section are taken from Iveson et al.16 © The Author(s). Published by Elsevier Ltd. This is anOpen Access article under the CC BY 4.0 license (https://creativecommons.org/licenses/by/4.0/).
Disease-free survival was defined as the time from randomisation (or from trial registration for those randomisedafter 3 months of therapy) to relapse, development of a new colorectal cancer, or death from any cause. Overallsurvival was defined as the time from randomisation (or registration for those randomised at 3 months) to deathfrom any cause. Toxicity was assessed by the investigators after each cycle of chemotherapy with AEs gradedusing NCI CTCAE version 3.
Patients were followed up for a minimum of 3 years to a maximum of 8 years, with full blood count, ureaand electrolyte levels, liver function and carcinoembryonic antigen all being tested at 9, 12, 18, 24 and36 months, and then annually. Computed tomography of the chest, abdomen and pelvis was conductedat 6, 12, 18, 24 and 36 months.
Health-related quality of life was assessed using the European Organisation for Research and Treatmentof Cancer (EORTC) questionnaires QLQ-C3017 and QLQ-CR29,18 and using the EuroQol-5 Dimensions,three-level version (EQ-5D-3L) (with both the visual analogue scale and the health index),19 with UK valuesets.20 Neuropathy was assessed using the Functional Assessment of Cancer Therapy/Gynecologic OncologyGroup–Neurotoxicity (FACT/GOG-Ntx4) questionnaire.21 Questionnaires were administered at baseline andbefore each treatment cycle. Additionally, HRQoL was assessed each month in the first 3 months aftertreatment for the 3-month treatment group. Subsequent assessments were conducted at 9 and 12 monthsfor the EORTC questionnaires; 9, 12, 18 and 24 months and then annually for the EQ-5D-3L; and up to12 months for the FACT/GOG-Ntx4.
Sample size
Parts of this section are taken from Iveson et al.16 © The Author(s). Published by Elsevier Ltd. This is anOpen Access article under the CC BY 4.0 license (https://creativecommons.org/licenses/by/4.0/).
DOI: 10.3310/hta23640 HEALTH TECHNOLOGY ASSESSMENT 2019 VOL. 23 NO. 64
© Queen’s Printer and Controller of HMSO 2019. This work was produced by Iveson et al. under the terms of a commissioning contract issued by the Secretary of State for Healthand Social Care. This issue may be freely reproduced for the purposes of private research and study and extracts (or indeed, the full report) may be included in professionaljournals provided that suitable acknowledgement is made and the reproduction is not associated with any form of advertising. Applications for commercial reproduction shouldbe addressed to: NIHR Journals Library, National Institute for Health Research, Evaluation, Trials and Studies Coordinating Centre, Alpha House, University of Southampton SciencePark, Southampton SO16 7NS, UK.
5

In the previous MOSAIC trial, 3-year DFS in the oxaliplatin and 5FU treatment group was 78% comparedwith 73% for 5FU plus leucovorin.6 To be able to conclude that the 3-month treatment group in the SCOTstudy was non-inferior, it was assumed that at least half of this benefit should be retained.
The SCOT study was designed as a randomised (1 : 1) non-inferiority trial aiming to reliably determinewhether or not there was < 2.5% decrease in the 3-year DFS for patients in the 3-month treatment group(from 78% in the 6-month treatment group), which corresponds to excluding a HR of > 1.13 with 90%power at the 2.5%, one-sided level of significance. Assuming that the study would recruit over a period of5 years with a subsequent minimum follow-up of 2 years, this design required 8600 patients to undergorandomisation and 2750 events (relapses, deaths or new colorectal cancers) to be observed; to allow forloss to follow-up, the recruitment target was 9500 patients.
From the outset, it was recognised that detecting meaningful differences based on safety and HRQoL datawould not require information from all of the 9500 planned patients. For safety outcomes, 700 patients(350 in each group) were deemed sufficient to detect (80% power and a 2-sided significance level of 5%)a halving in the proportion of patients with grade 3 or 4 toxic effects from 12% to 6% (12% being therate at which grade 3 or 4 paraesthesia, the most common non-haematological grade 3 or 4 toxic effect,occurred in the oxaliplatin treatment group in the MOSAIC trial).6 This sample size would allow smallchanges in global HRQoL to be detected (assuming a difference of magnitude of 7.5322 and a standarddeviation of 23.4)17 with 95% power at the 1% significance level. This more stringent level of significancewas used to allow for multiple testing across various health-related quality-of-life scales. It should be notedthat the power and sample size calculations for safety and health-related quality-of-life outcomes arebased on a superiority comparisons, not on non-equivalence.
All sample size calculations were made in EAST 5.3.0.0 (Cytel Corporation, Cambridge, MA, USA).
Information on toxicity and health-related quality-of-life end points was collected from recruited patientsuntil the number required was exceeded and the decision to stop was endorsed by the independent datamonitoring committee (DMC) and trial steering committee. An administrative delay in notifying sites aboutthe end of collection of detailed toxicity information resulted in data being collected from 868 patients. TheDMC had access to summary plots of EORTC HRQoL data, EuroQol-5 Dimensions (EQ-5D) health status dataand FACT/GOG-Ntx4 neuropathy data. In May 2010 (based on interim data from 1047 randomised patients),the committee recommended that the collection of HRQoL data and FACT/GOG-Ntx4 data should becontinued because they were concerned that the number of missing data might undermine comparison atlater time points. They also recommended that collection of FACT/GOG-Ntx4 data should be extendedbeyond 12 months for new patients and, where possible, for patients already participating in the study. InNovember 2010, the DMC recommended that the collection of these data should stop once 1800 patientshad been recruited; delays in the amendment of the protocol led to patient recruitment beyond thisrecommendation. These extensions to data collection were made to compensate for missing data and werenot based on formal power calculations.
Randomisation
The adjuvant treatment (oxaliplatin and 5FU or oxaliplatin and capecitabine) that was administered wasselected on an individual-patient basis and was not randomised. Patients were randomised (1 : 1) centrallyto receive either 3 months or 6 months of treatment using a minimisation algorithm incorporating arandom component (80% probability of allocation to the ‘minimum’ group; 1 : 1 randomisation if nopreferred group). Minimisation factors were study centre, treatment regimen, sex, disease site (colon orrectum), N stage (X, 0, 1 or 2), T stage (X, 0, 1, 2, 3 or 4) and capecitabine starting dose (from February2010 for those receiving oxaliplatin and capecitabine). Centralised randomisation was conducted by theCancer Research UK Clinical Trials Unit (Glasgow, UK). The computerised randomisation system allocatedevery patient a unique identification number and determined their treatment duration.
METHODS
NIHR Journals Library www.journalslibrary.nihr.ac.uk
6
Initially, some participating centres were randomly allocated such that patients would be registered in thestudy prior to starting treatment but then be randomised after completing the first 3 months of treatment(delayed randomisation) to either receive a further 3 months of treatment or stop treatment. The remainingcentres randomised patients to 3 months or 6 months of treatment prior to starting treatment. This delayedrandomisation approach was discontinued because of a poorer randomisation rate [median 4.09, interquartilerange (IQR) 1.29–7.09; n = 41, patients/centre/year] than in centres that randomised patients before the startof treatment (median 5.21, IQR 3.56–11.55; n = 36).24
The study was open-label for patients, clinicians, and those conducting data analysis.
Statistical analyses
Parts of this section are taken from Iveson et al.16 © The Author(s). Published by Elsevier Ltd. This is anOpen Access article under the CC BY 4.0 license (https://creativecommons.org/licenses/by/4.0/).
Efficacy and safety analysesThe efficacy analyses of DFS and overall survival included, as far as possible, all randomly assigned patients[the intention-to-treat (ITT) population] and were plotted using Kaplan–Meier techniques. Analysis oftreatment delivery and safety was based on patients who started the study treatment. The analysis timewas prespecified in the study protocol. Statistical analyses used SPSS version 22 (IBM Corporation, Armonk,NY, USA) and R version 3.1.2 (The R Foundation for Statistical Computing, Vienna, Austria). The datacut-off point for this analysis was 1 December 2016.
Comparison of disease-free and overall survival between treatment groups was based on a Cox regressionmodel incorporating minimisation factors as covariates; this approach was also used to derive the HR andassociated 95% confidence intervals (CIs). The p-value for testing the null hypothesis, that the HR comparing3 months with 6 months of adjuvant treatment was ≥ 1.13, was derived from this model by comparing thelog-likelihood of the fitted model with the log-likelihood of a model where the HR between groups was setto 1.13 using a likelihood-ratio test. The proportional hazards assumption implicit in these analyses wasexamined graphically using a log-minus log plot of survival function against log time and using a test of theinteraction between treatment group and time (logged) obtained from a Cox model incorporating anappropriate time-varying covariate.
The components of the forest plot (estimated hazard for the comparison between groups and associated95% CI) were derived from a Cox model that included separate terms for the effect of duration in eachcategory of the relevant stratification factor or other factors being examined. The p-value for heterogeneitywas derived from comparison of the log-likelihoods of a model with separate terms for the effect ofduration in each category compared with the model with a single overall term. The aim of this analysis wasto establish whether or not the impact of treatment duration varied across important patient subgroups.
Multiple imputation analysis25 was used to fill in missing data for questionnaires in the HRQoL andneuropathy scales. Five multiple imputation sets were produced for each HRQoL or neuropathy scale andthe area under the curve (AUC)26 was calculated with imputed data, as prespecified in the statisticalanalysis plan. The AUC was then adjusted by dividing by the follow-up period and subtracting the baselinevalue for each patient to produce a standardised-adjusted AUC. The standardised-adjusted AUC wascalculated for the five imputed data sets and compared between the randomised treatment groups via ageneralised linear model (with treatment group as an independent factor and study minimisation factorsas covariates). The test statistics associated with treatment group from each of the five imputations werefinally combined to provide an overall p-value that took into account the extent of missing data. To allowfor the number of scales being examined, an adjustment for multiple comparisons (separately for theEORTC and the EQ-5D questionnaires) was made using the sharpened Hochberg procedure;27 the p-value
DOI: 10.3310/hta23640 HEALTH TECHNOLOGY ASSESSMENT 2019 VOL. 23 NO. 64
© Queen’s Printer and Controller of HMSO 2019. This work was produced by Iveson et al. under the terms of a commissioning contract issued by the Secretary of State for Healthand Social Care. This issue may be freely reproduced for the purposes of private research and study and extracts (or indeed, the full report) may be included in professionaljournals provided that suitable acknowledgement is made and the reproduction is not associated with any form of advertising. Applications for commercial reproduction shouldbe addressed to: NIHR Journals Library, National Institute for Health Research, Evaluation, Trials and Studies Coordinating Centre, Alpha House, University of Southampton SciencePark, Southampton SO16 7NS, UK.
7

threshold for statistical significance was 5% after adjustment. Comparison of these scales at individualtime points also made use of multiple imputation and generalised linear models.
The Mann–Whitney U-test was used to compare ordered categorical variables for toxicity grade. Fisher’sexact test was used to compare the incidence of grade 3–5 toxicity and logistic regression was used toestimate the odds ratio and associated CI for the incidence of grade 3–5 toxicity.
Study data were reviewed by the DMC approximately once a year to assess safety and efficacy issues froman ethics viewpoint. Conditional power methods28 were used to aid the committee in reaching decisionsabout study continuation, but no formal stopping rules were set. The conditional power for DFS waspresented at the fifth (June 2012), sixth (January 2013) and seventh (October 2013) meetings of the DMC;the DMC requested the analysis because of apparent differences in DFS curves. The results were discussedby the DMC in the context of the limited follow-up of patients and available survival data. The DMCconcluded that no action was required.
Changes to the study protocol
The approach of randomising patients to a treatment group was changed after the trial had been runningfor 1 year; after this time all patients were randomised as they started adjuvant therapy (rather than somebeing randomised after 3 months of adjuvant chemotherapy), as this approach proved to have a higherrandomisation rate and a lower dropout rate.
From March 2012, the requirement for the neuropathy questionnaire to be completed was extended tofollow-up visits at 18 and 24 months; from December 2012 the neuropathy questionnaire was to becompleted at follow-up visits to a maximum of 8 years. These extensions to data collection were madeto compensate for missing data and to monitor long-term change in neuropathy.
The planned duration of patient follow-up for the primary analysis was extended so that (1) patients withstage III disease were to be followed up until the end November 2014 or for a minimum of 3 years (if theydid not have ≥ 3 years of follow-up at the end of November 2014) and (2) all patients with stage II diseasewere to be followed up until the end of November 2016. Follow-up was extended to increase the numberof events for the primary study analysis.
METHODS
NIHR Journals Library www.journalslibrary.nihr.ac.uk
8

Chapter 3 Results
Participant recruitment and flow
The data cut-off point for the analyses presented here was 1 December 2016, at which time patients inboth treatment groups had undergone median follow-up of 37 months (IQR 36–49 months, as calculatedusing the reverse Kaplan–Meier approach). A total of 88% of patients were followed up for a minimum of3 years, which allowed for a 2-month window around the follow-up time. A total of 787 patients had diedby the time of analysis. Study patients are still undergoing follow-up to support further DFS and overallsurvival analyses.
A total of 6088 patients were randomised to the trial between 27 March 2008 and 29 November 2013from 244 centres: 5244 patients were randomised at 164 study centres in the UK, 311 patients at10 centres in Denmark, 237 patients at 19 centres in Spain, 197 patients at 32 centres in Australia, 83 patientsat 14 centres in Sweden, and 16 patients at five centres in New Zealand. The study did not meet its target of9500 patients as a result of slow recruitment; despite extending the planned enrolment period by 6 months,the target was not reached and recruitment was stopped to allow adequate follow-up of ongoingrandomised patients within the budget for the trial. This allowed the minimum follow-up period to beextended to 3 years. A total of 1482 DFS events were observed, which gave the study 66% power ratherthan the planned 90% power for rejecting the null hypothesis.
A total of 6065 patients were included in the ITT analysis population, 6022 of whom started studytreatment. Treatment safety/toxicity was assessed after each chemotherapy cycle for 868 patients. HRQoLwas assessed using EORTC QLQ-C30 and CR29 (n = 1829) and EQ-5D-3L (n = 1828) and neuropathy wereassessed using FACT/GOG-Ntx4 (n = 2871).
The Consolidated Standards of Reporting Trials (CONSORT) flow diagram (Figure 1) shows patients whoentered and progressed through the trial and provided data for the different assessment parameters.Of the 6088 patients entering the trial, 3044 were randomised into each treatment group (3-month and6-month duration). Of these 3044 patients, 3035 (99.7% of 3044 randomised to this group) in the3-month treatment group were included in the ITT analyses, with 3009 patients receiving the study drug,and 3030 (99.5% of 3044 randomised to this group) in the 6-month treatment group were included inthe ITT analyses, with 3013 patients receiving the study drug. The reasons patients were not includedin the ITT analysis and did not start study treatment are also detailed in Figure 1.
Baseline data
Baseline data (recorded at the time of randomisation) identified approximately 60% of patients as maleand 40% as female, with the median age being 65 years. Most patients (> 80%) had a diagnosis of coloncancer and approximately 80% had stage III disease. For about 67% of patients, the planned treatment wasoxaliplatin and capecitabine, with the remaining 33% planned to receive oxaliplatin and 5FU. Baselinecharacteristics were comparable for the 3-month and 6-month treatment groups for the overall patientpopulation (Table 1) and for the other analysis sets considering toxicity and HRQoL (see Appendix 1).
Exposure to study medication
The duration of adjuvant chemotherapy, based on the number of treatment cycles delivered, is presentedin Table 2; for the purpose of this analysis, one cycle of oxaliplatin and 5FU equated to 2 weeks of
DOI: 10.3310/hta23640 HEALTH TECHNOLOGY ASSESSMENT 2019 VOL. 23 NO. 64
© Queen’s Printer and Controller of HMSO 2019. This work was produced by Iveson et al. under the terms of a commissioning contract issued by the Secretary of State for Healthand Social Care. This issue may be freely reproduced for the purposes of private research and study and extracts (or indeed, the full report) may be included in professionaljournals provided that suitable acknowledgement is made and the reproduction is not associated with any form of advertising. Applications for commercial reproduction shouldbe addressed to: NIHR Journals Library, National Institute for Health Research, Evaluation, Trials and Studies Coordinating Centre, Alpha House, University of Southampton SciencePark, Southampton SO16 7NS, UK.
9

Randomised to study before startingadjuvant chemotherapy
(n = 5929)
Registered to study before startingadjuvant chemotherapy (n = 215)
to be randomised at 3 months
Follow-up on 3035 patients
Allocated to 3 months’ treatment(n = 3044)
Allocated to 6 months’ treatment(n = 3044)
Follow-up on 3030 patients
Allocation
Efficacy analysis
Disease-free andoverall survival
Randomised(n = 6088)
Enrolment
Treatment
• Patients with consent to use data , n = 3035• Started study treatment, n = 3009• Did not start study treatment, n = 26 • Adverse event, n = 1 • Protocol violation/ineligibility, n = 9 • Clinical decision, n = 6 • Patient decision, n = 4 • Other, n = 9 (patient can have multiple reasons) – missing for 1 patient
• Patients with consent to use data, n = 3030• Started study treatment, n = 3013• Did not start study treatment, n = 17 • Adverse event, n = 3 • Protocol violation/ineligibility, n = 5 • Clinical decision, n = 5 • Patient decision, n = 4 • Other, n = 2 (patient can have multiple reasons) – missing for 3 patients
CTC-graded AEs(n = 434)
CTC-graded AEs(n = 434)
Toxicity and QoLanalysis
Toxicity, QoL andneurotoxicity in
subset of patients
Registered patients not randomisedat 3 months
(n = 56)
• Patients withdrew consent for use of on study data, n = 14• Patients ineligible, n = 11 • Wrong stage, n = 4 • Excess delay from surgery to chemotherapy, n = 6 • Not R0 resection, n = 1 (included in ITT analysis)
• Patient stopped treatment before 3 months, n = 22• Patient not fit to receive more than 3 months of treatment, n = 6• Patient withdrew consent, n = 1• Other reason, n = 27
• Patients withdrew consent for use of on study data, n = 9• Patients ineligible, n = 16 • Wrong stage, n = 6 • Excess delay from surgery to chemotherapy, n = 9 • Not R0 resection, n = 1 (included in ITT analysis)
EORTC QLQ-C30/CR229(n = 916)
EQ-5D(n = 916)
FACT/GOG-Ntx4(n = 1445)
EORTC QLQ-C30/CR229(n = 913)
EQ-5D(n = 912)
FACT/GOG-Ntx4(n = 1426)
FIGURE 1 The CONSORT flow diagram of patient progression through the SCOT trial. Reproduced fromIveson et al.16 © The Author(s). Published by Elsevier Ltd. This is an Open Access article under the CC BY 4.0 license(https://creativecommons.org/licenses/by/4.0/).
RESULTS
NIHR Journals Library www.journalslibrary.nihr.ac.uk
10

TABLE 1 Baseline patient characteristics as recorded at randomisation, by treatment group
Characteristic
Randomised treatment group
3 months of treatment (N= 3044) 6 months of treatment (N= 3044)
Gender, n (%)
Female 1201 (39.5) 1200 (39.4)
Male 1843 (60.5) 1844 (60.6)
Total 3044 (100.0) 3044 (100.0)
Age (years)
Median 65 65
IQR 58–70 58–70
Range 23–84 20–85
Total 3044 3044
Performance status at randomisation, n (%)
0 2190 (71.9) 2144 (70.4)
1 854 (28.1) 900 (29.6)
Total 3044 (100.0) 3044 (100.0)
Disease site, n (%)
Colon 2492 (81.9) 2495 (82.0)
Rectum 552 (18.1) 549 (18.0)
Total 3044 (100.0) 3044 (100.0)
T stage, n (%)
0 1 (0.0) 3 (0.1)
1 92 (3.0) 95 (3.1)
2 284 (9.3) 283 (9.3)
3 1749 (57.5) 1748 (57.4)
4 917 (30.1) 915 (30.1)
X 1(0.0) 0 (0.0)
Total 3044 (100.0) 3044 (100.0)
N stage, n (%)
0 559 (18.4) 557 (18.3)
1 1731 (56.9) 1732 (56.9)
2 754 (24.8) 755 (24.8)
Total 3044 (100.0) 3044 (100.0)
Planned treatment, n (%)
FOLFOX 993 (32.6) 988 (32.5)
CAPOX 2051 (67.4) 2056 (67.5)
Total 3044 (100.0) 3044 (100.0)
If CAPOX planned, starting dose of capecitabine, n (%)
750mg/m2 348 (19.5) 349 (19.4)
800 mg/m2 72 (4.0) 78 (4.3)
1000mg/m2 1369 (76.5) 1370 (76.2)
Total 1789 (100.0) 1797 (100.0)
continued
DOI: 10.3310/hta23640 HEALTH TECHNOLOGY ASSESSMENT 2019 VOL. 23 NO. 64
© Queen’s Printer and Controller of HMSO 2019. This work was produced by Iveson et al. under the terms of a commissioning contract issued by the Secretary of State for Healthand Social Care. This issue may be freely reproduced for the purposes of private research and study and extracts (or indeed, the full report) may be included in professionaljournals provided that suitable acknowledgement is made and the reproduction is not associated with any form of advertising. Applications for commercial reproduction shouldbe addressed to: NIHR Journals Library, National Institute for Health Research, Evaluation, Trials and Studies Coordinating Centre, Alpha House, University of Southampton SciencePark, Southampton SO16 7NS, UK.
11

TABLE 1 Baseline patient characteristics as recorded at randomisation, by treatment group (continued )
Characteristic
Randomised treatment group
3 months of treatment (N= 3044) 6 months of treatment (N= 3044)
High-risk stage II, n (%)
No 2493 (81.9) 2499 (82.1)
Yes 551 (18.1) 545 (17.9)
Total 3044 (100.0) 3044 (100.0)
Randomisation time point, n (%)
Baseline 2964 (97.4) 2965 (97.4)
3 months 80 (2.6) 79 (2.6)
Total 3044 (100.0) 3044 (100.0)
CAPOX, oxaliplatin and capecitabine; FOLFOX, oxaliplatin and 5FU.Adapted from Iveson et al.16 © The Author(s). Published by Elsevier Ltd. This is an Open Access article under the CC BY 4.0license (https://creativecommons.org/licenses/by/4.0/).
TABLE 2 Treatment duration by treatment group
TreatmentDuration of treatment (based onthe number of cycles) (weeks)
3-month treatment(N= 3044), n (%)
6-month treatment(N= 3044), n (%)
FOLFOX < 12 116 (11.8) 107 (10.9)
12 845 (86.2) 55 (5.6)
> 12, ≤ 16 18 (1.8) 64 (6.5)
> 16, ≤ 20 0 (0.0) 88 (8.9)
> 20, ≤ 24 1 (0.1) 74 (7.5)
24 0 (0.0) 586 (59.5)
> 24 0 (0.0) 11 (1.1)
Total 980 (100.0) 985 (100.0)
CAPOX < 12 310 (15.2) 310 (15.3)
12 1675 (81.9) 154 (7.6)
> 12, ≤ 16 59 (2.9) 75 (3.7)
> 16, ≤ 20 0 (0.0) 124 (6.1)
> 20, ≤ 24 0 (0.0) 141 (7.0)
24 0 (0.0) 1187 (58.5)
> 24 0 (0.0) 37 (1.8)
Total 2044 (100.0) 2028 (100.0)
All patients < 12 426 (14.1) 417 (13.8)
12 2520 (83.3) 209 (6.9)
> 12, ≤ 16 77 (2.5) 139 (4.6)
> 16, ≤ 20 0 (0.0) 212 (7.0)
> 20, ≤ 24 1 (0.0) 215 (7.1)
24 0 (0.0) 1773 (58.8)
> 24 0 (0.0) 48 (1.6)
Total 3024a (100.0) 3013b (100.0)
CAPOX, oxaliplatin and capecitabine; FOLFOX, oxaliplatin and 5FU.a Missing for 20 patients: 9 withdrew consent for use of information, 11 had data missing.b Missing for 31 patients: 14 withdrew consent for use of information, 17 had data missing.
RESULTS
NIHR Journals Library www.journalslibrary.nihr.ac.uk
12

treatment and one cycle of oxaliplatin and capecitabine equated to 3 weeks of treatment. Overall, 83.3%of patients randomised to the 3-month treatment group received 3 months of treatment: the frequencywas slightly higher for those receiving oxaliplatin and 5FU (86.2% of patients vs. 81.9% of those receivingoxaliplatin and capecitabine). Overall, 58.8% of those randomised to the 6-month treatment groupreceived 6 months of treatment, with the proportion being similar for those receiving oxaliplatin and 5FU(59.5%) and for those receiving oxaliplatin and capecitabine (58.5%); 6.9% of patients randomised to6 months of treatment stopped treatment at 3 months. A total of 13.8% of patients stopped treatmentbefore 3 months, with the proportion being similar for those randomised to receive 3 months of treatment(14.1%) and for those randomised to receive 6 months of treatment (13.8%).
The overall median treatment duration based on actual start and end dates was 11.3 weeks (IQR10.1–12.6 weeks) for the 3-month treatment group and 23.1 weeks (IQR 17.0–25.3 weeks) for the6-month treatment group. A higher proportion of patients receiving oxaliplatin and 5FU had at least onedelayed cycle in both the 3-month (65.0% vs. 45.2% with oxaliplatin and capecitabine) and the 6-month(83.0% vs. 66.3%) treatment groups.
The median percentage of the full fluoropyrimidine dose delivered was 95.3% (IQR 83.1–99.8%) in the3-month and 83.2% (IQR 56.7–95.7%) in the 6-month treatment groups. The median percentage of thefull oxaliplatin dose delivered was 96.6% (IQR 82.3% to 99.7%) in the 3-month and 70.2% (IQR 44.3%to 87.1%) in the 6-month treatment groups. These values were similar irrespective of the fluoropyrimidinebackbone (Figure 2).
A total of 788 patients (26.2%) underwent 5FU or capecitabine dose reduction in the 3-month treatmentgroup compared with 1286 patients (42.7%) in the 6-month treatment group; 906 patients (30.1%)underwent oxaliplatin dose reduction in the 3-month treatment group compared with 1869 patients(62.0%) in the 6-month treatment group.
As patients receiving oxaliplatin and 5FU require insertion of a line, this could potentially delay the start oftheir treatment. However, the difference in mean time from surgery to the start of adjuvant chemotherapywas negligible when comparing patients treated with oxaliplatin and 5FU [mean 58 days, standarddeviation (SD) 16 days)] and those treated with oxaliplatin and capecitabine (mean 56 days, SD 14 days).
Comparison of efficacy for 3-month versus 6-monthadjuvant chemotherapy
Disease-free survivalBy the time of analysis there had been 1482 DFS events (740 in the 3-month treatment group and 742 inthe 6-month treatment group). In the 3-month treatment group, 658 patients (21.7%) experienced diseaserecurrence, 71 patients (2.1%) died without disease recurrence or a new primary colorectal lesion, and11 patients (0.4%) had a new primary colorectal cancer lesion; in the 6-month treatment group, 654 patients(21.6%) experienced disease recurrence, 76 patients (2.6%) died without disease recurrence or new primarycolorectal lesion, and 12 patients (0.4%) had a new primary colorectal cancer lesion. The 3-year DFS rate inthe 3-month treatment group was 76.7% [standard error (SE) 0.8%] and in the 6-month treatment groupwas 77.1% (SE 0.8%); this equated to a HR of 1.006 [95% CI 0.909 to 1.114; p-value for non-inferiority(pNI) = 0.012] and therefore met the criteria confirming non-inferiority for 3-month compared with 6-monthadjuvant chemotherapy (Figure 3).
DOI: 10.3310/hta23640 HEALTH TECHNOLOGY ASSESSMENT 2019 VOL. 23 NO. 64
© Queen’s Printer and Controller of HMSO 2019. This work was produced by Iveson et al. under the terms of a commissioning contract issued by the Secretary of State for Healthand Social Care. This issue may be freely reproduced for the purposes of private research and study and extracts (or indeed, the full report) may be included in professionaljournals provided that suitable acknowledgement is made and the reproduction is not associated with any form of advertising. Applications for commercial reproduction shouldbe addressed to: NIHR Journals Library, National Institute for Health Research, Evaluation, Trials and Studies Coordinating Centre, Alpha House, University of Southampton SciencePark, Southampton SO16 7NS, UK.
13

02468
1012141618202224262830323436
3 months 6 monthsRandomised study arm
Trea
tmen
t d
ura
tio
n in
wee
ks(f
rom
rec
ord
ed d
ates
)Treatment
(a)
CAPOXFOLFOX
3 months 6 monthsRandomised study arm
Perc
enta
ge
of
full
oxa
lipla
tin
do
se
(b)
0102030405060708090
100110120130140150
TreatmentCAPOXFOLFOX
3 months 6 monthsRandomised study arm
Perc
enta
ge
of
full
5FU
/cae
pci
atb
ine
do
se
(c)
0102030405060708090
100110120130140150
TreatmentCAPOXFOLFOX
FIGURE 2 Treatment delivery by treatment group and adjuvant regimen. (a) Treatment duration; (b) percentageof intended oxaliplatin dose; and (c) percentage of intended 5FU/capecitabine dose. Boxes show median andIQR; whiskers show range; dots represent outliers. FOLFOX, oxaliplatin and 5FU. Adapted from Iveson et al.16
© The Author(s). Published by Elsevier Ltd. This is an Open Access article under the CC BY 4.0 license(https://creativecommons.org/licenses/by/4.0/).
RESULTS
NIHR Journals Library www.journalslibrary.nihr.ac.uk
14

Sensitivity analysis considered the difference between treatment groups based on the actual duration oftreatment (Figure 4). For eligible patient who received 3 months (2513 patients; see Table 2) or 6 months(1771 patients; see Table 2) of adjuvant chemotherapy, the observed HR was 1.158 (95% CI 1.018, 1.317;p = 0.641) with non-inferiority not confirmed in any of these smaller, non-ITT populations.
Number at risk (cumulative number censored)
Time from randomisation (years)
Perc
enta
ge
of
pat
ien
ts a
live
and
dis
ease
fre
e
0 1 2 3 4 5 6 7 8 9
0
10
20
30
40
50
60
70
80
90
100
3035 (0)3030 (0)
2661 (65)2697 (67)
2329 (152)2317 (154)
1500 (856)1540 (825)
705 (1604)757 (1558)
339 (1961)346 (1948)
102 (2195)113 (2175)
24 (2771)28 (2260)
3 (2292)4 (2284)
0 (2295)0 (2288)
3 months6 months
Arm
3 months
6 months
3-year DFS (95% CI)
76.7% (75.1% to 78.2%)
77.1% (75.6% to 78.6%)
3-year DFS difference = – 0.4% (– 2.6% to 1.8%)
HR (95% CI)
1.006 (0.909 to 1.114)
Ref
Non-inferiority p-value
0.012
(a)
3 months (n = 3035; events, n = 740)6 months (n = 3030; events, n = 742)
Number at risk (cumulative number censored)
Time from randomisation (years)
Perc
enta
ge
of
pat
ien
ts a
live
0 1 2 3 4 5 6 7 8 9
0
10
20
30
40
50
60
70
80
90
100
3035 (0)3030 (0)
2900 (59)2890 (65)
2727 (124)2721 (129)
1988 (757)2005 (724)
803 (1878)856 (1812)
377 (2276)387 (2256)
109 (2534)120 (2517)
24 (2618)28 (2608)
3 (2639)4 (2632)
0 (2642)0 (2636)
3 months6 months
Arm
3 months
6 months
3-year OS (95% CI)
90.0% (88.9% to 91.1%)
89.6% (88.5% to 90.7%)
3-year OS difference = 0.4% (– 1.1% to 2.0%)
HR (95% CI)
0.994 (0.964 to 1.143)
Ref
Non-inferiority p-value
0.035
(b)
3 months (n = 3035; events, n = 393)6 months (n = 3030; events, n = 394)
FIGURE 3 (a) Disease-free survival and (b) overall survival, by treatment group. Adapted from Iveson et al.16
© The Author(s). Published by Elsevier Ltd. This is an Open Access article under the CC BY 4.0 license(https://creativecommons.org/licenses/by/4.0/).
DOI: 10.3310/hta23640 HEALTH TECHNOLOGY ASSESSMENT 2019 VOL. 23 NO. 64
© Queen’s Printer and Controller of HMSO 2019. This work was produced by Iveson et al. under the terms of a commissioning contract issued by the Secretary of State for Healthand Social Care. This issue may be freely reproduced for the purposes of private research and study and extracts (or indeed, the full report) may be included in professionaljournals provided that suitable acknowledgement is made and the reproduction is not associated with any form of advertising. Applications for commercial reproduction shouldbe addressed to: NIHR Journals Library, National Institute for Health Research, Evaluation, Trials and Studies Coordinating Centre, Alpha House, University of Southampton SciencePark, Southampton SO16 7NS, UK.
15

Heterogeneity of the 3-month versus 6-month effect was assessed for the stratification factors used forrandomisation and for the randomisation time-point. The resulting HRs, 95% CIs and p-values testing theheterogeneity of the treatment-duration effect for these subgroups are presented in Figure 5. The adjuvanttreatment regimen selected at randomisation was associated with a trend towards heterogeneity ineffect (p = 0.069).
Further (post hoc) analysis of DFS for patients receiving 3-month or 6-month duration adjuvant chemotherapywas conducted separately for patients who received oxaliplatin and 5FU and for patients who receivedoxaliplatin and capecitabine (Figure 6). For patients receiving oxaliplatin and capecitabine, the 3-year DFS ratefor the 3-month treatment group was 76.9% (SE 1.0%) and for the 6-month treatment group was 76.1%(SE 1.0%), resulting in a HR of 0.944 (95% CI 0.835 to 1.067; pNI = 0.002), which met the criteria fornon-inferiority. However, for patients receiving oxaliplatin and 5FU, the 3-year DFS for the 3-month treatmentgroup was 76.3% (SE 1.4%) and for the 6-month treatment group was 79.2% (SE 1.3%), resulting in a HRof 1.158 (95% CI 0.964 to 1.391; pNI = 0.591), which did not meet the non-inferiority criteria.
Treatment duration
= 3 months vs.> 3 months; p = 0.31
= 3 months vs.> 4 months; p = 0.55
= 3 months vs.> 5 months; p = 0.69
= 3 months vs.= 6 months; p = 0.64
Overall; p = 0.012
3-month armEvents/patients
595 / 2513
595 / 2513
595 / 2513
595 / 2513
740 / 3035
6-month armEvents/patients
532 / 2382
489 / 2244
435 / 2032
380 / 1771
742 / 3030
HR (95% CI)(3 months/6 months)
1.098 (0.977 to 1.234)
1.140 (1.011 to 1.285)
1.166 (1.030 to 1.32)
1.158 (1.018 to 1.317)
1.006 (0.909 to 1.114)
0.71 1.00 1.41
Non-inferiorityboundary
Hazard ratio
3 monthsbetter
6 monthsbetter
FIGURE 4 Plot of 3-month/6-month HR by actual treatment duration (analysis according to duration restricted toeligible patients who started treatment) with associated non-inferiority p-values. Reproduced from Iveson et al.16
© The Author(s). Published by Elsevier Ltd. This is an Open Access article under the CC BY 4.0 license(https://creativecommons.org/licenses/by/4.0/).
RESULTS
NIHR Journals Library www.journalslibrary.nihr.ac.uk
16
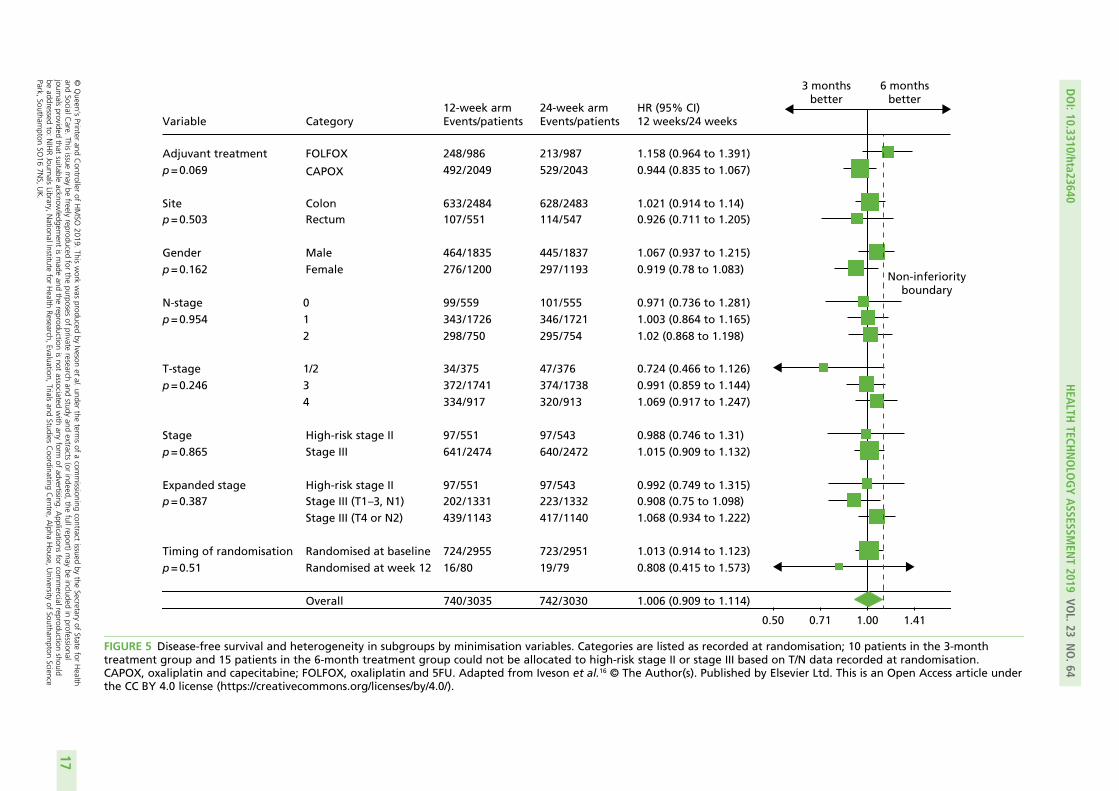
Variable
Adjuvant treatmentp = 0.069
Sitep = 0.503
Genderp = 0.162
N-stagep = 0.954
T-stagep = 0.246
Stagep = 0.865
Expanded stagep = 0.387
Timing of randomisationp = 0.51
Category
FOLFOX
CAPOX
ColonRectum
MaleFemale
012
1/234
High-risk stage IIStage III
High-risk stage IIStage III (T1 –3, N1)Stage III (T4 or N2)
Randomised at baselineRandomised at week 12
Overall
12-week armEvents/patients
248 / 986492 / 2049
633 / 2484107 / 551
464 / 1835276 / 1200
99 / 559343 / 1726298 / 750
34 / 375372 / 1741334 / 917
97 / 551641 / 2474
97 / 551202 / 1331439 / 1143
724 / 295516 / 80
740 / 3035
24-week armEvents/patients
213 / 987529 / 2043
628 / 2483114 / 547
445 / 1837297 / 1193
101 / 555346 / 1721295 / 754
47 / 376374 / 1738320 / 913
97 / 543640 / 2472
97 / 543223 / 1332417 / 1140
723 / 295119 / 79
742 / 3030
HR (95% CI)12 weeks/24 weeks
1.158 (0.964 to 1.391)0.944 (0.835 to 1.067)
1.021 (0.914 to 1.14)0.926 (0.711 to 1.205)
1.067 (0.937 to 1.215)0.919 (0.78 to 1.083)
0.971 (0.736 to 1.281)1.003 (0.864 to 1.165)1.02 (0.868 to 1.198)
0.724 (0.466 to 1.126)0.991 (0.859 to 1.144)1.069 (0.917 to 1.247)
0.988 (0.746 to 1.31)1.015 (0.909 to 1.132)
0.992 (0.749 to 1.315)0.908 (0.75 to 1.098)1.068 (0.934 to 1.222)
1.013 (0.914 to 1.123)0.808 (0.415 to 1.573)
1.006 (0.909 to 1.114)
0.50 0.71 1.00 1.41
Non-inferiorityboundary
3 monthsbetter
6 monthsbetter
FIGURE 5 Disease-free survival and heterogeneity in subgroups by minimisation variables. Categories are listed as recorded at randomisation; 10 patients in the 3-monthtreatment group and 15 patients in the 6-month treatment group could not be allocated to high-risk stage II or stage III based on T/N data recorded at randomisation.CAPOX, oxaliplatin and capecitabine; FOLFOX, oxaliplatin and 5FU. Adapted from Iveson et al.16 © The Author(s). Published by Elsevier Ltd. This is an Open Access article underthe CC BY 4.0 license (https://creativecommons.org/licenses/by/4.0/).
DOI:10.3310/hta23640
HEA
LTHTECH
NOLO
GYASSESSM
ENT2019
VOL.23
NO.64
©Queen
’sPrinter
andController
ofHMSO
2019.This
work
was
producedby
Ivesonet
al.under
theterm
sof
acom
missioning
contractissued
bythe
Secretaryof
Statefor
Health
andSocialC
are.This
issuemay
befreely
reproducedfor
thepurposes
ofprivate
researchand
studyand
extracts(or
indeed,the
fullreport)may
beincluded
inprofessional
journalsprovided
thatsuitable
acknowledgem
entismade
andthe
reproductionisnot
associatedwith
anyform
ofadvertising.
Applications
forcom
mercialreproduction
shouldbe
addressedto:
NIHRJournals
Library,NationalInstitute
forHealth
Research,Evaluation,
Trialsand
StudiesCoordinating
Centre,
Alpha
House,
University
ofSoutham
ptonScience
Park,Southam
ptonSO
167N
S,UK.
17

Previous clinical trials in patients with colorectal cancer have shown a marked difference in the risk ofrelapse between patients with T1–3, N1 disease and those with T4 or N2 disease.29 Post hoc analyses weretherefore conducted to assess whether or not disease stage affected DFS rate for patients with differingadjuvant treatment durations. Kaplan–Meier curves (Figure 7) showed that 3-year DFS for patients withT1–3, N1 primary disease in the 3-month treatment group reached 85.3% (SE 1.0%) and for the 6-monthtreatment group reached 84.0% (SE 1.0%), giving a HR of 0.907 (95% CI 0.749 to 1.097; pNI = 0.011).
Time from randomisation (years)
Perc
enta
ge
of
pat
ien
ts a
live
and
dis
ease
fre
e
0 1 2 3 4 5 6 7 8 9
0
10
20
30
40
50
60
70
80
90
100
2049 (0)2043 (0)
1795 (46)1810 (48)
1578 (101)1544 (106)
1014 (581)1024 (550)
482 (1082)517 (1016)
236 (1323)238 (1282)
66 (1492)71 (1443)
14 (1543)18 (1496)
1 (1556)3 (1511)
0 (1557)0 (1514)
3 months6 months
Arm
3 months
6 months
3-year DFS (95% CI)
76.9% (75.0% to 78.7%)
76.1% (74.2% to 78.0%)
3-year DFS difference = 0.8% (–1.9% to 3.5%)
HR (95% CI)
0.944 (0.835 to 1.067)
Ref
Non-inferiority p-value
0.0020
(a)
3 months(n = 2049; events, n = 492)6 months(n = 2043; events, n = 529)
Time from randomisation (years)
Perc
enta
ge
of
pat
ien
ts a
live
and
dis
ease
fre
e
0 1 2 3 4 5 6 7 8 9
0
10
20
30
40
50
60
70
80
90
100
986 (0)987 (0)
866 (19)887 (19)
751 (51)773 (48)
486 (275)516 (275)
223 (522)240 (542)
103 (638)108 (666)
36 (703)42 (732)
10 (728)10 (764)
2 (736)1 (773)
0 (738)0 (774)
3 months6 months
Arm
3 months
6 months
3-year DFS (95% CI)
76.3% (73.5% to 79.0%)
79.2% (76.6% to 81.8%)
3-year DFS difference = – 2.9% (– 6.7% to 0.8%)
HR (95% CI)
1.158 (0.964 to 1.391)
Ref
Non-inferiority p-value
0.59
(b)
3 months(n = 986; events, n = 248)6 months(n = 987; events, n = 213)
FIGURE 6 Disease-free survival by treatment group and adjuvant chemotherapy regimen. (a) CAPOX; and(b) FOLFOX. CAPOX, oxaliplatin and capecitabine; FOLFOX, oxaliplatin and 5FU. Adapted with minor correctionsfrom Iveson et al.16 © The Author(s). Published by Elsevier Ltd. This is an Open Access article under the CC BY 4.0license (https://creativecommons.org/licenses/by/4.0/).
RESULTS
NIHR Journals Library www.journalslibrary.nihr.ac.uk
18

For patients with T1–3, N1 disease non-inferiority was, therefore, demonstrated when comparing 3-monthwith 6-month chemotherapy. For stage III colorectal cancer patients with T4 and/or N2 pathology, 3-yearDFS for the 3-month treatment group was 63.0% (SE 1.5%) and for the 6-month treatment group was64.8% (SE 1.4%), giving a HR of 1.069 (95% CI 0.935 to 1.222; pNI = 0.19), which did not meet thenon-inferiority criteria.
Time from randomisation (years)
Perc
enta
ge
of
pat
ien
ts a
live
and
dis
ease
fre
e
0 1 2 3 4 5 6 7 8 9
0
10
20
30
40
50
60
70
80
90
100
1331 (0)1332 (0)
1220 (35)1226 (35)
1102 (87)1073 (94)
654 (492)640 (491)
250 (882)264 (848)
105 (1026)114 (995)
25 (1105)23 (1086)
3 (1126)2 (1107)
1 (1128)0 (1109)
0 (1129)0 (1109)
3 months6 months
Arm
3 months
6 months
3-year DFS (95% CI)
85.3% (82.5% to 88.2%)
84.0% (80.6% to 87.5%)
3-year DFS difference = 1.3% (– 1.5% to 4.1%)
HR (95% CI)
0.907 (0.749 to 1.097)
Ref
Non-inferiority p-value
0.011
(a)
3 months(n = 1331; events, n = 202)6 months(n = 1332; events, n = 223)
Time from randomisation (years)
Perc
enta
ge
of
pat
ien
ts a
live
and
dis
ease
fre
e
0 1 2 3 4 5 6 7 8 9
0
10
20
30
40
50
60
70
80
90
100
1143 (0)1140 (0)
929 (18)960 (18)
753 (46)763 (44)
433 (303)476 (277)
174 (537)203 (530)
84 (623)84 (640)
14 (691)16 (707)
0 (704)2 (721)
0 (704)0 (723)
0 (704)0 (723)
3 months6 months
Arm
3 months
6 months
3-year DFS (95% CI)
63.0% (60.2% to 65.9%)
64.8% (62.0% to 67.7%)
3-year DFS difference = – 1.8% (– 5.8% to 2.3%)
HR (95% CI)
1.069 (0.935 to 1.222)
Ref
Non-inferiority p-value
0.19
(b)
3 months(n = 1143; events, n = 439)6 months(n = 1140; events, n = 417)
FIGURE 7 Disease-free survival by treatment group and disease stage. (a) T1–3 or N1; and (b) T4 or N2. Adaptedwith minor corrections from Iveson et al.16 © The Author(s). Published by Elsevier Ltd. This is an Open Access articleunder the CC BY 4.0 license (https://creativecommons.org/licenses/by/4.0/).
DOI: 10.3310/hta23640 HEALTH TECHNOLOGY ASSESSMENT 2019 VOL. 23 NO. 64
© Queen’s Printer and Controller of HMSO 2019. This work was produced by Iveson et al. under the terms of a commissioning contract issued by the Secretary of State for Healthand Social Care. This issue may be freely reproduced for the purposes of private research and study and extracts (or indeed, the full report) may be included in professionaljournals provided that suitable acknowledgement is made and the reproduction is not associated with any form of advertising. Applications for commercial reproduction shouldbe addressed to: NIHR Journals Library, National Institute for Health Research, Evaluation, Trials and Studies Coordinating Centre, Alpha House, University of Southampton SciencePark, Southampton SO16 7NS, UK.
19

Analysis of these prognostic groups according to the chemotherapy regimen they received (Figure 8)showed that Kaplan–Meier DFS curves suggest that 3 months of treatment with oxaliplatin and oxaliplatin(CAPOX) may be adequate both for T1–3, N1 and for T4 and/or N2 patients (most reliably for T1–3, N1),but this is not as clear for oxaliplatin and 5FU (FOLFOX), particularly for T4 and/or N2.
Time from randomisation (years)
Perc
enta
ge
of
pat
ien
ts a
live
and
dis
ease
fre
e
0 1 2 3 4 5 6 7 8 9
0
10
20
30
40
50
60
70
80
90
100
453 (0)436 (0)
417 (8)405 (9)
370 (28)362 (26)
218 (163)219 (160)
85 (290)91 (286)
35 (339)41 (335)
10 (364)11 (365)
1 (373)1 (375)
1 (373)0 (376)
0 (374)0 (376)
3 months6 months
Arm3 months6 months
3-year DFS (95% CI)83.4% (79.9% to 86.9%)86.3% (83.0% to 89.6%)
N453436
Events7960
(a)
Time from randomisation (years)
Perc
enta
ge
of
pat
ien
ts a
live
and
dis
ease
fre
e
0 1 2 3 4 5 6 7 8 9
0
10
20
30
40
50
60
70
80
90
100
878 (0)896 (0)
803 (27)821 (26)
732 (59)711 (68)
436 (329)421 (331)
165 (592)173 (562)
70 (687)73 (660)
15 (741)12 (721)
2 (753)1 (732)
0 (755)0 (733)
0 (755)0 (733)
3 months6 months
Arm3 months6 months
3-year DFS (95% CI)86.3% (84.0% to 88.7%)82.3% (80.4% to 85.5%)
N878896
Events123163
(b)
FIGURE 8 Disease-free survival by treatment group, disease stage, and adjuvant chemotherapy regimen.(a) Low-risk stage III (T1–3, N1)/FOLFOX; (b) low-risk stage III (T1–3, N1)/CAPOX; (c) high-risk stage III (T4 or N2)/FOLFOX; and (d) high-risk stage III (T4 or N2)/CAPOX. CAPOX, oxaliplatin and capecitabine; FOLFOX, oxaliplatinand 5FU. Adapted from Iveson et al.16 © The Author(s). Published by Elsevier Ltd. This is an Open Access articleunder the CC BY 4.0 license (https://creativecommons.org/licenses/by/4.0/). (continued )
RESULTS
NIHR Journals Library www.journalslibrary.nihr.ac.uk
20

Note that although curves in some of the subgroups in Figures 7 and 8 cross, there is no suggestion in anycase that the proportional-hazards assumption is violated (minimum p-value testing for non-proportionality,p = 0.226).
Time from randomisation (years)
Perc
enta
ge
of
pat
ien
ts a
live
and
dis
ease
fre
e
0 1 2 3 4 5 6 7 8 9
0
10
20
30
40
50
60
70
80
90
100
385 (0)383 (0)
313 (9)327 (6)
255 (20)265 (17)
159 (97)169 (96)
62 (185)67 (194)
30 (216)25 (231)
5 (239)7 (249)
0 (243)1 (255)
0 (243)0 (256)
0 (243)0 (256)
3 months6 months
Arm3 months6 months
3-year DFS (95% CI)64.9% (60.0% to 69.8%)67.7% (62.9% to 72.5%)
N385383
Events (n)142127
(c)
Time from randomisation (years)
Perc
enta
ge
of
pat
ien
ts a
live
and
dis
ease
fre
e
0 1 2 3 4 5 6 7 8 9
0
10
20
30
40
50
60
70
80
90
100
758 (0)757 (0)
616 (9)633 (12)
498 (26)498 (27)
274 (206)307 (181)
112 (352)136 (336)
54 (407)59 (409)
9 (452)9 (458)
0 (461)1 (466)
0 (461)0 (467)
0 (461)0 (467)
3 months6 months
Arm3 months6 months
3-year DFS (95% CI)62.1% (58.6% to 65.6%)63.4% (59.9% to 67.9%)
N758757
Events (n)297290
(d)
FIGURE 8 Disease-free survival by treatment group, disease stage, and adjuvant chemotherapy regimen.(a) Low-risk stage III (T1–3, N1)/FOLFOX; (b) low-risk stage III (T1–3, N1)/CAPOX; (c) high-risk stage III (T4 or N2)/FOLFOX; and (d) high-risk stage III (T4 or N2)/CAPOX. CAPOX, oxaliplatin and capecitabine; FOLFOX, oxaliplatinand 5FU. Adapted from Iveson et al.16 © The Author(s). Published by Elsevier Ltd. This is an Open Access articleunder the CC BY 4.0 license (https://creativecommons.org/licenses/by/4.0/).
DOI: 10.3310/hta23640 HEALTH TECHNOLOGY ASSESSMENT 2019 VOL. 23 NO. 64
© Queen’s Printer and Controller of HMSO 2019. This work was produced by Iveson et al. under the terms of a commissioning contract issued by the Secretary of State for Healthand Social Care. This issue may be freely reproduced for the purposes of private research and study and extracts (or indeed, the full report) may be included in professionaljournals provided that suitable acknowledgement is made and the reproduction is not associated with any form of advertising. Applications for commercial reproduction shouldbe addressed to: NIHR Journals Library, National Institute for Health Research, Evaluation, Trials and Studies Coordinating Centre, Alpha House, University of Southampton SciencePark, Southampton SO16 7NS, UK.
21

Overall survivalBy the time of analysis, 787 participants in the 3-month treatment group had died [393 (12.9% of 3035in the efficacy analysis) and 394 participants in the 6-month treatment group had died (13.0% of the3030 in the efficacy analysis). The 3-year overall survival rate for the 3-month treatment group was 90.0%(SE 0.6%) and for the 6-month treatment group was 89.6% (SE 0.6%), equating to a HR of 0.994 (95% CI0.964 to 1.143; pNI = 0.035; see Figure 3b). Sixteen deaths in each treatment group were considered relatedto study medication.
SafetyThe occurrence of AEs was analysed for a total of 868 patients, comprising 434 patients in each treatmentgroup. Table 3 shows the maximum NCI CTCAE grade recorded per patient for AEs with an incidence of≥ 10% in either treatment group. Most of these events (alopecia, anaemia, anorexia, diarrhoea, fatigue,hand–foot syndrome, mucositis, sensory neuropathy, neutropenia, pain, rash, altered taste, thrombocytopeniaand watery eye) showed a statistically significant increase in grade for the 6-month treatment group comparedwith the 3-month treatment group.
The overall frequency of grade ≥ 3 toxicity was 59.4% for 6-month duration adjuvant chemotherapy and35.7% for 3-month adjuvant chemotherapy (p < 0.001). Sensory neuropathy, diarrhoea, neutropenia,fatigue, pain, nausea and hand–foot syndrome were the most common grade ≥ 3 AEs reported. Thedifference in frequency between treatment groups was statistically significant for diarrhoea (p = 0.033),neutropenia (p = 0.023), pain (p = 0.014), hand–foot syndrome (p = 0.031) and sensory neuropathy(p < 0.001). The AE for which there was the most marked increase in the proportion of patients withgrade ≥ 3 with 6-month adjuvant chemotherapy was sensory neuropathy (16.4% vs. 4.3% with3-month treatment).
The proportion of those with febrile neutropenia was 1.6% of patients for the 3-month treatment groupand 1.2% for the 6-month treatment group. Figure 9 shows that diarrhoea and hand–foot syndrome weremore common in patients receiving oxaliplatin and capecitabine and that neutropenia was more commonin those receiving oxaliplatin and 5FU.
A total of 244 patients in the 3-month treatment group and 576 patients in the 6-month treatment groupcited AEs as the reason for stopping treatment early. The most frequently cited AEs leading to treatmentdiscontinuation were diarrhoea (n = 90 patients) for the 3-month treatment group, and diarrhoea(n = 150 patients) and peripheral neuropathy (n = 156 patients) for the 6-month treatment group.
Serious adverse reactions were reported for 421 patients in the 3-month treatment group and for511 patients in the 6-month treatment group. Gastrointestinal SAEs were most common and occurredin similar proportions of patients in both groups. Thirty-two patients died owing to events attributed totreatment toxicity, with the events distributed equally between the groups (16 patients died in eachgroup); 27 of these deaths occurred during the first 3 months of treatment. A total of 21 patients ofthe 4108 who received oxaliplatin and capecitabine (0.51%) and 11 patients of the 1980 who receivedoxaliplatin and 5FU (0.56%) were reported to have died from toxicity.
Peripheral neuropathy was also assessed using a patient-reported outcome (PRO) FACT/GOG-Ntx4questionnaire. Data were available for 2871 patients who were assessed for up to 7 years. The meanFACT/GOG-Ntx4 questionnaire neuropathy scores for patients receiving 3-month and 6-month adjuvantchemotherapy are shown in Figure 10. The neurotoxicity standardised-adjusted AUC differed markedlybetween the groups (p < 0.001), with a higher rate of neuropathy for the 6-month treatment group beingclearly apparent from 4 months and persisting to ≥ 5 years (p < 0.001). Peak neuropathy occurred at6 months for the 3-month treatment group and at 9 months for the 6-month treatment group.
RESULTS
NIHR Journals Library www.journalslibrary.nihr.ac.uk
22
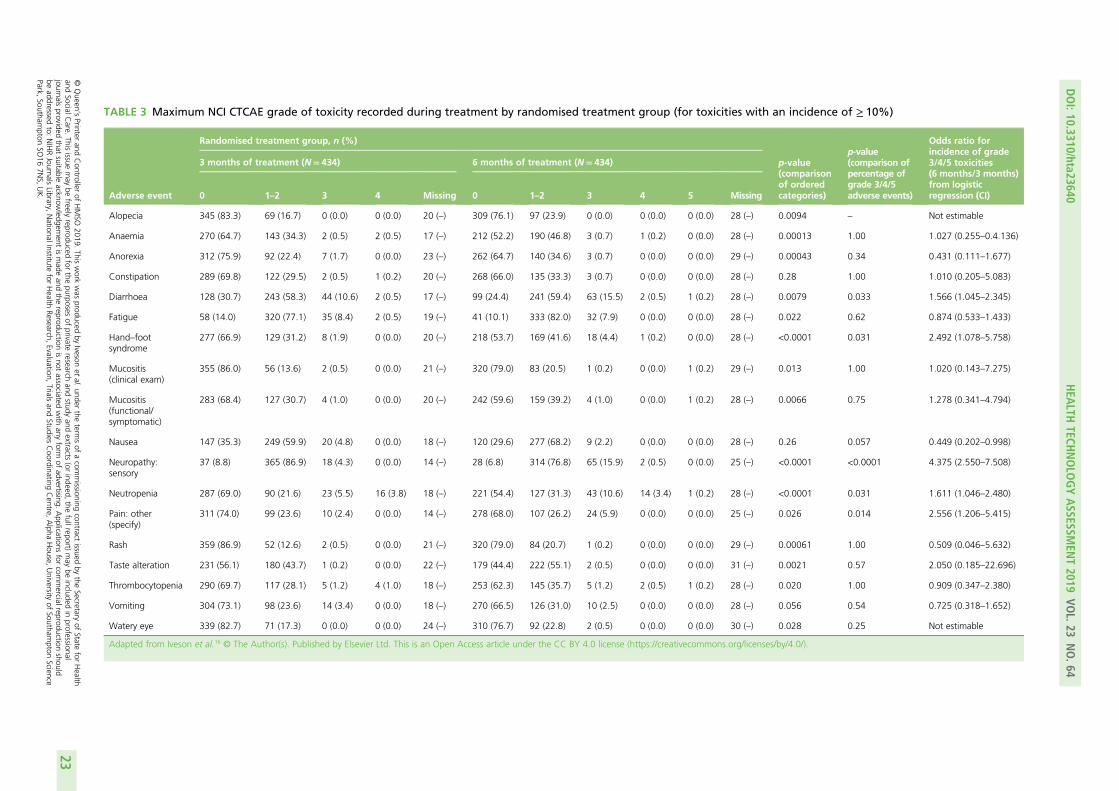
TABLE 3 Maximum NCI CTCAE grade of toxicity recorded during treatment by randomised treatment group (for toxicities with an incidence of ≥ 10%)
Adverse event
Randomised treatment group, n (%)
p-value(comparisonof orderedcategories)
p-value(comparison ofpercentage ofgrade 3/4/5adverse events)
Odds ratio forincidence of grade3/4/5 toxicities(6 months/3 months)from logisticregression (CI)
3 months of treatment (N= 434) 6 months of treatment (N= 434)
0 1–2 3 4 Missing 0 1–2 3 4 5 Missing
Alopecia 345 (83.3) 69 (16.7) 0 (0.0) 0 (0.0) 20 (–) 309 (76.1) 97 (23.9) 0 (0.0) 0 (0.0) 0 (0.0) 28 (–) 0.0094 – Not estimable
Anaemia 270 (64.7) 143 (34.3) 2 (0.5) 2 (0.5) 17 (–) 212 (52.2) 190 (46.8) 3 (0.7) 1 (0.2) 0 (0.0) 28 (–) 0.00013 1.00 1.027 (0.255–0.4.136)
Anorexia 312 (75.9) 92 (22.4) 7 (1.7) 0 (0.0) 23 (–) 262 (64.7) 140 (34.6) 3 (0.7) 0 (0.0) 0 (0.0) 29 (–) 0.00043 0.34 0.431 (0.111–1.677)
Constipation 289 (69.8) 122 (29.5) 2 (0.5) 1 (0.2) 20 (–) 268 (66.0) 135 (33.3) 3 (0.7) 0 (0.0) 0 (0.0) 28 (–) 0.28 1.00 1.010 (0.205–5.083)
Diarrhoea 128 (30.7) 243 (58.3) 44 (10.6) 2 (0.5) 17 (–) 99 (24.4) 241 (59.4) 63 (15.5) 2 (0.5) 1 (0.2) 28 (–) 0.0079 0.033 1.566 (1.045–2.345)
Fatigue 58 (14.0) 320 (77.1) 35 (8.4) 2 (0.5) 19 (–) 41 (10.1) 333 (82.0) 32 (7.9) 0 (0.0) 0 (0.0) 28 (–) 0.022 0.62 0.874 (0.533–1.433)
Hand–footsyndrome
277 (66.9) 129 (31.2) 8 (1.9) 0 (0.0) 20 (–) 218 (53.7) 169 (41.6) 18 (4.4) 1 (0.2) 0 (0.0) 28 (–) <0.0001 0.031 2.492 (1.078–5.758)
Mucositis(clinical exam)
355 (86.0) 56 (13.6) 2 (0.5) 0 (0.0) 21 (–) 320 (79.0) 83 (20.5) 1 (0.2) 0 (0.0) 1 (0.2) 29 (–) 0.013 1.00 1.020 (0.143–7.275)
Mucositis(functional/symptomatic)
283 (68.4) 127 (30.7) 4 (1.0) 0 (0.0) 20 (–) 242 (59.6) 159 (39.2) 4 (1.0) 0 (0.0) 1 (0.2) 28 (–) 0.0066 0.75 1.278 (0.341–4.794)
Nausea 147 (35.3) 249 (59.9) 20 (4.8) 0 (0.0) 18 (–) 120 (29.6) 277 (68.2) 9 (2.2) 0 (0.0) 0 (0.0) 28 (–) 0.26 0.057 0.449 (0.202–0.998)
Neuropathy:sensory
37 (8.8) 365 (86.9) 18 (4.3) 0 (0.0) 14 (–) 28 (6.8) 314 (76.8) 65 (15.9) 2 (0.5) 0 (0.0) 25 (–) <0.0001 <0.0001 4.375 (2.550–7.508)
Neutropenia 287 (69.0) 90 (21.6) 23 (5.5) 16 (3.8) 18 (–) 221 (54.4) 127 (31.3) 43 (10.6) 14 (3.4) 1 (0.2) 28 (–) <0.0001 0.031 1.611 (1.046–2.480)
Pain: other(specify)
311 (74.0) 99 (23.6) 10 (2.4) 0 (0.0) 14 (–) 278 (68.0) 107 (26.2) 24 (5.9) 0 (0.0) 0 (0.0) 25 (–) 0.026 0.014 2.556 (1.206–5.415)
Rash 359 (86.9) 52 (12.6) 2 (0.5) 0 (0.0) 21 (–) 320 (79.0) 84 (20.7) 1 (0.2) 0 (0.0) 0 (0.0) 29 (–) 0.00061 1.00 0.509 (0.046–5.632)
Taste alteration 231 (56.1) 180 (43.7) 1 (0.2) 0 (0.0) 22 (–) 179 (44.4) 222 (55.1) 2 (0.5) 0 (0.0) 0 (0.0) 31 (–) 0.0021 0.57 2.050 (0.185–22.696)
Thrombocytopenia 290 (69.7) 117 (28.1) 5 (1.2) 4 (1.0) 18 (–) 253 (62.3) 145 (35.7) 5 (1.2) 2 (0.5) 1 (0.2) 28 (–) 0.020 1.00 0.909 (0.347–2.380)
Vomiting 304 (73.1) 98 (23.6) 14 (3.4) 0 (0.0) 18 (–) 270 (66.5) 126 (31.0) 10 (2.5) 0 (0.0) 0 (0.0) 28 (–) 0.056 0.54 0.725 (0.318–1.652)
Watery eye 339 (82.7) 71 (17.3) 0 (0.0) 0 (0.0) 24 (–) 310 (76.7) 92 (22.8) 2 (0.5) 0 (0.0) 0 (0.0) 30 (–) 0.028 0.25 Not estimable
Adapted from Iveson et al.16 © The Author(s). Published by Elsevier Ltd. This is an Open Access article under the CC BY 4.0 license (https://creativecommons.org/licenses/by/4.0/).
DOI:10.3310/hta23640
HEA
LTHTECH
NOLO
GYASSESSM
ENT2019
VOL.23
NO.64
©Queen
’sPrinter
andController
ofHMSO
2019.This
work
was
producedby
Ivesonet
al.under
theterm
sof
acom
missioning
contractissued
bythe
Secretaryof
Statefor
Health
andSocialC
are.This
issuemay
befreely
reproducedfor
thepurposes
ofprivate
researchand
studyand
extracts(or
indeed,the
fullreport)may
beincluded
inprofessional
journalsprovided
thatsuitable
acknowledgem
entismade
andthe
reproductionisnot
associatedwith
anyform
ofadvertising.
Applications
forcom
mercialreproduction
shouldbe
addressedto:
NIHRJournals
Library,NationalInstitute
forHealth
Research,Evaluation,
Trialsand
StudiesCoordinating
Centre,
Alpha
House,
University
ofSoutham
ptonScience
Park,Southam
ptonSO
167N
S,UK.
23

0
5
10
15
20
25
30
Diarrh
oea
Hand–f
oot syn
drom
e
Neutro
penia
Senso
ry n
euro
pathy
Diarrh
oea
Hand–f
oot syn
drom
e
Neutro
penia
Senso
ry n
euro
pathy
Toxicity
Perc
enta
ge ≥
gra
de
3
3 months 6 months
3.0 3.4
13.1
4.4
19.0
5.8 6.2
16.2
(a)
Perc
enta
ge ≥
gra
de
3
3 months 6 months
0
5
10
15
20
25
30
7.3
0.0
20.1
4.0
11.5
2.7
28.4
16.8
(b)
Diarrh
oea
Hand–f
oot syn
drom
e
Neutro
penia
Senso
ry n
euro
pathy
Diarrh
oea
Hand–f
oot syn
drom
e
Neutro
penia
Senso
ry n
euro
pathy
Toxicity
FIGURE 9 Frequency of patients with selected grade ≥ 3 toxicities, by treatment group and treatment regimen.(a) CAPOX 3 months; (b) CAPOX 6 months; (c) FOLFOX 3 months; and (d) FOLFOX 3 months. CAPOX, oxaliplatinand capecitabine; FOLFOX, oxaliplatin and 5FU.
RESULTS
NIHR Journals Library www.journalslibrary.nihr.ac.uk
24

Baseli
ne1 m
onth2 m
onths
3 month
s4 m
onths
5 month
s6 m
onths
9 month
s1 y
ear
18 m
onths
2 yea
rs3 y
ears
4 yea
rs5 y
ears
6 yea
rs
Assessment time
1
2
3
4
GO
G-N
tx4
neu
rop
ath
y sc
ore
(m
ean
an
d 9
5% C
I)5
6
7
(a)
3 months6 months
FIGURE 10 Peripheral neuropathy score, by treatment group. Data beyond year 6 were omitted because of small numbers. Error bars show 95% CIs. a, Low completion rateat these time points reflect the fact that neurotoxicity data were initially collected only up to 12 months; b, low return rate because patients were assessed at the start ofthe last cycle rather than at 6 months. Adapted from Iveson et al.16 © The Author(s). Published by Elsevier Ltd. This is an Open Access article under the CC BY 4.0 license(https://creativecommons.org/licenses/by/4.0/). (continued )
DOI:10.3310/hta23640
HEA
LTHTECH
NOLO
GYASSESSM
ENT2019
VOL.23
NO.64
©Queen
’sPrinter
andController
ofHMSO
2019.This
work
was
producedby
Ivesonet
al.under
theterm
sof
acom
missioning
contractissued
bythe
Secretaryof
Statefor
Health
andSocialC
are.This
issuemay
befreely
reproducedfor
thepurposes
ofprivate
researchand
studyand
extracts(or
indeed,the
fullreport)may
beincluded
inprofessional
journalsprovided
thatsuitable
acknowledgem
entismade
andthe
reproductionisnot
associatedwith
anyform
ofadvertising.
Applications
forcom
mercialreproduction
shouldbe
addressedto:
NIHRJournals
Library,NationalInstitute
forHealth
Research,Evaluation,
Trialsand
StudiesCoordinating
Centre,
Alpha
House,
University
ofSoutham
ptonScience
Park,Southam
ptonSO
167N
S,UK.
25

Number of patients completing questionnaire
Year 6Year 5Year 4Year 3aYear 2aYear 1 Month 18aMonth 9Month 6Month 5Month 4Month 3Month 2Month 1
(b)
Baseline
54193286198169721 172733606638639527782817859
8431359088712021366 131213861400141314161421142614331445
646249221453 135343454537555759
54170257199174721 182665298624679701782796865
8531761088711951346 130813661375138213841389139514061426
645442221554 134920b454951565761
Completed (n)3 months
oftreatment
6 monthsof
treatment
Expected (n)
Expected (%)
Completed (n)
Expected (n)
Expected (%)
FIGURE 10 Peripheral neuropathy score, by treatment group. Data beyond year 6 were omitted because of small numbers. Error bars show 95% CIs. a, Low completion rateat these time points reflect the fact that neurotoxicity data were initially collected only up to 12 months; b, low return rate because patients were assessed at the start ofthe last cycle rather than at 6 months. Adapted from Iveson et al.16 © The Author(s). Published by Elsevier Ltd. This is an Open Access article under the CC BY 4.0 license(https://creativecommons.org/licenses/by/4.0/).
RESULTS
NIHRJournals
Librarywww.journalslibrary.nihr.ac.uk
26

Health-related quality of lifeA total of 1829 patients provided data on the EORTC questionnaires. Global health status and allfunctional and symptom scales of the EORTC QLQ-C30 showed statistically significant differences in termsof standardised-adjusted AUC, indicating better functioning and fewer side effects in patients receiving3-month adjuvant chemotherapy. Scores for the two groups mirrored each other over the first 3 months oftreatment but subsequently improved from months 4 to 6 for patients in the 3-month treatment group,indicative of functional improvement and decreased side effects in those who stopped treatment at3 months (Figure 11). For the EORTC QLQ-CR29, statistically significant differences were apparent forbody image (p = 0.037), dry mouth (p < 0.0001), hair loss (p = 0.035) and taste (p < 0.0001) scales.The magnitudes of the mean differences in functional and global health status scales between treatmentgroups were indicative of ‘moderate’ differences for global health status, role functioning, and socialfunction and ‘a little’ difference for physical, emotional and cognitive functions.22
A total of 1828 patients provided data on the EQ-5D. Statistically significant differences in standardised-adjusted AUC were seen for both the EQ-5D self-rated visual analogue scale (p = 0.00081) and the EQ-5D-3Lhealth index (p = 0.00081). Differences between the two treatment groups were apparent from months4 to 6 (Figure 12), consistent with the time when those in the 6-month treatment group were still receivingtreatment but those in the 3-month treatment group had finished. From 9 months to the 7-year follow-up,there were no clinically relevant differences23 between the treatment groups.
Given the notable number of missing data for HRQoL assessments (FACT/GOG-Ntx4, EORTC and EQ-5D),the reasons for missing questionnaires were analysed and are presented in Appendix 2. Missingquestionnaire data were generally related to various errors. Patients who did complete questionnaires wereshown to be representative of the overall study population, with no indication that missing data wereassociated with any particular baseline characteristic. Sensitivity analyses comparing the primary resultswith those based on just observed data or using data imputed only for patients who completed baselinequestionnaires showed similar results.
Exploratory analysis considered differences in HRQoL scales when comparing patients with ‘quite a bit’/‘very much’ numbness or tingling or discomfort in hands or feet on the FACT/GOG-Ntx4 toxicityquestionnaire with those who rated these symptoms as ‘somewhat’/‘a little bit’/‘not at all’. The proportionof patients recording neuropathy symptoms as being present ‘quite a bit’ or ‘very much’ was higher forpatients in the 6-month treatment group at 1 year (34% vs. 14% of patients in the 3-month treatmentgroup), 3 years (32% vs. 17%) and 5 years (29% vs. 16%). This analysis consistently demonstratedstatistically significantly poorer HRQoL across the different scales for patients who had ‘quite a bit’ or‘very much’ recorded for neuropathy symptoms, at all time points (p < 0.001; Figure 13).
DOI: 10.3310/hta23640 HEALTH TECHNOLOGY ASSESSMENT 2019 VOL. 23 NO. 64
© Queen’s Printer and Controller of HMSO 2019. This work was produced by Iveson et al. under the terms of a commissioning contract issued by the Secretary of State for Healthand Social Care. This issue may be freely reproduced for the purposes of private research and study and extracts (or indeed, the full report) may be included in professionaljournals provided that suitable acknowledgement is made and the reproduction is not associated with any form of advertising. Applications for commercial reproduction shouldbe addressed to: NIHR Journals Library, National Institute for Health Research, Evaluation, Trials and Studies Coordinating Centre, Alpha House, University of Southampton SciencePark, Southampton SO16 7NS, UK.
27

Baseli
ne
1 month
2 month
s
3 month
s
4 month
s
5 month
s
6 month
s
9 month
s
1 yea
r
Assessment time
65
70
EOR
TC g
lob
al h
ealt
h s
tatu
s (m
ean
an
d 9
5% C
I)75
80
(a)
3 months6 months
FIGURE 11 The EORTC global health status, by treatment group. a, Low return rate as patients were assessed at the start of the last cycle rather than at 6 months.Reproduced from Iveson et al.16 © The Author(s). Published by Elsevier Ltd. This is an Open Access article under the CC BY 4.0 license (https://creativecommons.org/licenses/by/4.0/). (continued )
RESULTS
NIHRJournals
Librarywww.journalslibrary.nihr.ac.uk
28

Number of patients completing questionnaire
Year 1Month 9Month 6Month 5Month 4Month 3Month 2Month 1
(b)
Baseline
593642509522543456660719796
866877882891894898901908916
697358596151737987
582554204504554597664677794
863873878885886889895902913
676423a576367747587
Completed (n)3 months
oftreatment
6 monthsof
treatment
Expected (n)
Expected (%)
Completed (n)
Expected (n)
Expected (%)
FIGURE 11 The EORTC global health status, by treatment group. a, Low return rate as patients were assessed at the start of the last cycle rather than at 6 months.Reproduced from Iveson et al.16 © The Author(s). Published by Elsevier Ltd. This is an Open Access article under the CC BY 4.0 license (https://creativecommons.org/licenses/by/4.0/).
DOI:10.3310/hta23640
HEA
LTHTECH
NOLO
GYASSESSM
ENT2019
VOL.23
NO.64
©Queen
’sPrinter
andController
ofHMSO
2019.This
work
was
producedby
Ivesonet
al.under
theterm
sof
acom
missioning
contractissued
bythe
Secretaryof
Statefor
Health
andSocialC
are.This
issuemay
befreely
reproducedfor
thepurposes
ofprivate
researchand
studyand
extracts(or
indeed,the
fullreport)may
beincluded
inprofessional
journalsprovided
thatsuitable
acknowledgem
entismade
andthe
reproductionisnot
associatedwith
anyform
ofadvertising.
Applications
forcom
mercialreproduction
shouldbe
addressedto:
NIHRJournals
Library,NationalInstitute
forHealth
Research,Evaluation,
Trialsand
StudiesCoordinating
Centre,
Alpha
House,
University
ofSoutham
ptonScience
Park,Southam
ptonSO
167N
S,UK.
29

Baseli
ne1 m
onth2 m
onths
3 month
s4 m
onths
5 month
s6 m
onths
9 month
s1 y
ear
18 m
onths
2 yea
rs3 y
ears
4 yea
rs5 y
ears
6 yea
rs
Assessment time
60
70
EQ-5
D s
elf-
rate
d V
AS
hea
lth
sta
tus
(mea
n a
nd
95%
CI)
80
90
(a)
3 months6 months
FIGURE 12 The EQ-5D self-rated visual analogue scale, by treatment group. Data beyond year 6 were omitted because of small numbers. a, Low return rate as patients wereassessed at the start of the last cycle rather than at 6 months. VAS, visual analogue scale. Reproduced from Iveson et al.16 © The Author(s). Published by Elsevier Ltd. This is anOpen Access article under the CC BY 4.0 license (https://creativecommons.org/licenses/by/4.0/). (continued )
RESULTS
NIHRJournals
Librarywww.journalslibrary.nihr.ac.uk
30

Number of patients completing questionnaire
Year 6Year 5Year 4Year 3Year 2Year 1 Month 18Month 9Month 6Month 5Month 4Month 3Month 2Month 1
(b)
Baseline
59197362423497541 528571470478498415594631692
84317588752807865 842877882891894898901907916
706262566263 636553545646667076
58191341408492541 512497186457509543591599695
86319617761815862 848873878884886889895902912
676055546063 605721a525761666676
Completed (n)3 months
oftreatment
6 monthsof
treatment
Expected (n)
Expected (%)
Completed (n)
Expected (n)
Expected (%)
FIGURE 12 The EQ-5D self-rated visual analogue scale, by treatment group. Data beyond year 6 were omitted because of small numbers. a, Low return rate as patients wereassessed at the start of the last cycle rather than at 6 months. VAS, visual analogue scale. Reproduced from Iveson et al.16 © The Author(s). Published by Elsevier Ltd. This is anOpen Access article under the CC BY 4.0 license (https://creativecommons.org/licenses/by/4.0/).
DOI:10.3310/hta23640
HEA
LTHTECH
NOLO
GYASSESSM
ENT2019
VOL.23
NO.64
©Queen
’sPrinter
andController
ofHMSO
2019.This
work
was
producedby
Ivesonet
al.under
theterm
sof
acom
missioning
contractissued
bythe
Secretaryof
Statefor
Health
andSocialC
are.This
issuemay
befreely
reproducedfor
thepurposes
ofprivate
researchand
studyand
extracts(or
indeed,the
fullreport)may
beincluded
inprofessional
journalsprovided
thatsuitable
acknowledgem
entismade
andthe
reproductionisnot
associatedwith
anyform
ofadvertising.
Applications
forcom
mercialreproduction
shouldbe
addressedto:
NIHRJournals
Library,NationalInstitute
forHealth
Research,Evaluation,
Trialsand
StudiesCoordinating
Centre,
Alpha
House,
University
ofSoutham
ptonScience
Park,Southam
ptonSO
167N
S,UK.
31

65
70
75
80
85
90
No Yes
Mea
n a
nd
95%
CI
N = 739 N = 228
(a)
Mean difference = 6.00(SE = 1.200; p < 0.001)
0.65
0.70
0.75
0.80
0.85
0.95
0.90
No Yes
Mea
n a
nd
95%
CI
N = 738 N = 236
(b)
Mean difference = 0.120(SE = 0.016; p < 0.001)
65
70
75
80
85
No Yes
Mea
n a
nd
95%
CI
N = 761 N = 242
(c)
Mean difference = 8.60(SE = 1.200; p < 0.001)
65
70
75
80
85
90
No Yes
Mea
n a
nd
95%
CI
N = 184 N = 59
(d)
Mean difference = 9.10(SE = 2.600; p < 0.001)
0.65
0.70
0.75
0.80
0.85
0.95
0.90
No Yes
Mea
n a
nd
95%
CI
N = 196 N = 66
(e)
Mean difference = 0.120(SE = 0.030; p < 0.001)
65
70
75
80
85
90
No Yes
Mea
n a
nd
95%
CI
N = 232 N = 55
(f)
Mean difference = 10.70(SE = 3.000; p < 0.001)
FIGURE 13 Differences in HRQoL assessments based on the degree of numbness/tingling/discomfort in hands orfeet. (a) EQ-5D visual analogue scale 1 year; (b) EQ-5D-3L health index 1 year; (c) EORTC global quality of life1 year; (d) EQ-5D visual analogue scale 3 years; (e) EQ-5D-3L health index 3 years; (f) EQ-5D visual analogue scale5 years; and (g) EQ-5D-3L health index 5 years. No/yes on all the x-axes refers to whether or not the patientexperienced ‘quite a bit/very much numbness or tingling or discomfort in hands or feet’ on the FACT/GOG-Ntx4toxicity score. Adapted from Iveson et al.16 © The Author(s). Published by Elsevier Ltd. This is an Open Access articleunder the CC BY 4.0 license (https://creativecommons.org/licenses/by/4.0/). (continued )
RESULTS
NIHR Journals Library www.journalslibrary.nihr.ac.uk
32

0.65
0.70
0.75
0.80
0.85
0.95
0.90
No Yes
Mea
n a
nd
95%
CI
N = 244 N = 60
(g)
Mean difference = 0.150(SE = 0.040; p < 0.001)
FIGURE 13 Differences in HRQoL assessments based on the degree of numbness/tingling/discomfort in hands orfeet. (a) EQ-5D visual analogue scale 1 year; (b) EQ-5D-3L health index 1 year; (c) EORTC global quality of life1 year; (d) EQ-5D visual analogue scale 3 years; (e) EQ-5D-3L health index 3 years; (f) EQ-5D visual analogue scale5 years; and (g) EQ-5D-3L health index 5 years. No/yes on all the x-axes refers to whether or not the patientexperienced ‘quite a bit/very much numbness or tingling or discomfort in hands or feet’ on the FACT/GOG-Ntx4toxicity score. Adapted from Iveson et al.16 © The Author(s). Published by Elsevier Ltd. This is an Open Access articleunder the CC BY 4.0 license (https://creativecommons.org/licenses/by/4.0/).
DOI: 10.3310/hta23640 HEALTH TECHNOLOGY ASSESSMENT 2019 VOL. 23 NO. 64
© Queen’s Printer and Controller of HMSO 2019. This work was produced by Iveson et al. under the terms of a commissioning contract issued by the Secretary of State for Healthand Social Care. This issue may be freely reproduced for the purposes of private research and study and extracts (or indeed, the full report) may be included in professionaljournals provided that suitable acknowledgement is made and the reproduction is not associated with any form of advertising. Applications for commercial reproduction shouldbe addressed to: NIHR Journals Library, National Institute for Health Research, Evaluation, Trials and Studies Coordinating Centre, Alpha House, University of Southampton SciencePark, Southampton SO16 7NS, UK.
33


Chapter 4 Economic analyses
Methodology
The economic analysis was undertaken from the perspective of the UK NHS and Personal Social Servicesfor the 2016 base year, adhering to good practice guidelines.30,31 A within-trial analysis utilised theindividual patient-level data on resource use, HRQoL (EQ-5D-3L) and survival.
Outcome dataThe effectiveness measure for the economic analysis was the discounted QALY gain per patient; QALYswere calculated using quality-adjusted survival analysis.32 Overall survival data from the SCOT study werepartitioned into three health states: time on treatment (ToT), disease-free state post treatment and recurrence(Figure 14). The model begins with patients who have undergone surgery and are now assumed to bedisease-free, who begin treatment with chemotherapy (ToT state). After completing treatment, patients moveinto the disease-free state and remain here until they experience a recurrence or die. Patients who experiencea recurrence remain in the recurrence state until they die.
Kaplan–Meier survival estimates were used for computation of quality-adjusted survival time in each healthstate over the 8-year within-trial period. A separate model estimated HRQoL for each health state.
The EQ-5D-3L data were collected for a subsample of 1832 patients (about 30% of the study sample) atbaseline and all follow-up times and combined with the UK EQ-5D-3L health-utility scores20 to calculateutilities. Table 4 details the characteristics of patients by EQ-5D subsample in comparison with the wholestudy sample. An interim analysis33 of the SCOT study EQ-5D and AE data showed that adequate datawere collected from the first 1832 patients in the SCOT study; therefore, discontinuation of the EQ-5D wasrecommended for new study recruits beyond that point. To control for plausible differences between theEQ-5D and total study populations, the HRQoL model included co-variables such as planned treatment,high-risk disease, gender, age and ethnicity. The model predicts health utilities for the averagecharacteristics of the patients in each health state.
Time on treatment Disease-freestate
Recurrence
Dead
FIGURE 14 Partitioned survival model.
DOI: 10.3310/hta23640 HEALTH TECHNOLOGY ASSESSMENT 2019 VOL. 23 NO. 64
© Queen’s Printer and Controller of HMSO 2019. This work was produced by Iveson et al. under the terms of a commissioning contract issued by the Secretary of State for Healthand Social Care. This issue may be freely reproduced for the purposes of private research and study and extracts (or indeed, the full report) may be included in professionaljournals provided that suitable acknowledgement is made and the reproduction is not associated with any form of advertising. Applications for commercial reproduction shouldbe addressed to: NIHR Journals Library, National Institute for Health Research, Evaluation, Trials and Studies Coordinating Centre, Alpha House, University of Southampton SciencePark, Southampton SO16 7NS, UK.
35

A linear regression with SEs clustered at the individual level estimated the HRQoL, including the followingindependent variables: health state, treatment group and individual characteristics. Time in the healthstates – ToT, disease-free state and recurrence – was computed by integration of the Kaplan–Meier curvesand then adjusted by HRQoL using the method of integrated quality-survival product to compute QALYs.This approach to quality-adjusted survival analysis avoids problems with informative censoring in survivalanalysis based on individual QALYs as an end point.34
Cost dataThe main cost categories were chemotherapy treatment and hospitalisation. Costs associated with patienttreatment were calculated by measuring and valuing resources used by trial participants during thetreatment and follow-up periods. Patient-level resource-use data were collected for adjuvant chemotherapydose/duration and hospitalisation during treatment and follow-up for the whole study sample. Costs werevalued in 2016 Great British pounds. The oxaliplatin, capecitabine and 5FU doses administered wererecorded, and the numbers of each were combined with their unit costs; the cost per mg of each drugwas obtained from the British National Formulary 73, where the lowest price per unit available was used.35
Hospitalisation costs incurred by patients receiving adjuvant chemotherapy and being treated for adversereactions were recorded. Hospitalisation resource use data included overnight stays in an intensive careunit, a high-dependency unit and general medicine wards,36 and inpatient chemotherapy administrationas well as day cases and outpatient cases. Primary care costs (general practitioner visits) were less relevantto this context and were therefore excluded. Direct and non-direct costs for each hospitalisation wereobtained from the Information Services Division of NHS Scotland.37 Direct costs were attributed to medical,nursing, health professional, pharmacy, theatre, laboratory and other costs. For inpatient and day casesoccurring within the treatment period, the pharmacy cost was subtracted to avoid double-counting
TABLE 4 Patient characteristics by EQ-5D subsample
Characteristic Total (N= 6065) Non-EQ-5D (N= 4308) EQ-5D (N= 1757) p-value
Planned treatment (%)
Oxaliplatin and capecitabine 67.5 67.5 67.5
Oxaliplatin and 5FU 32.5 32.5 32.5 0.99
Gender (%) and age (mean)
Female 39.46 39.65 38.99
Male 60.54 60.35 61.01 0.633
Age 63.43 63.35 63.62 0.3094
Disease risk (%)
High 53.19 54.32 50.43
Low 46.81 45.68 49.57 0.006
Ethnicity (%)
White/Caucasian 94.02 82.61 77.95
African/Caribbean 1.37 1.09 0.97
South Asian 1.42 1.02 0.86
Chinese 0.4 0.25 0.19
Other 2.79 15.04 20.03 < 0.001
NoteDifferences between groups were tested with a chi-squared test (planned treatment, gender, disease risk and ethnicity) ort-test (age).
ECONOMIC ANALYSES
NIHR Journals Library www.journalslibrary.nihr.ac.uk
36

chemotherapy medication. The cost of treating AEs was assumed to be included in hospitalisation costs forpatients attending hospital for night or day cases or during outpatient visits.
Given that the follow-up period differed among patients, the total cost per patient was estimated as theKaplan–Meier survival analysis;38 this allowed the average total cost to be estimated as the sum of theaverage cost for each period multiplied by the probability of surviving at the beginning of the period.
Cost-effectivenessThe cost and QALY outcomes for each treatment group were estimated and combined with the upperUK decision threshold for cost-effectiveness of £30,000 per QALY30 to report outcomes in terms of NMBaccording to good reporting practice guidance.39 The incremental NMB is the difference between the NMBof the two groups.
Analyses were performed using Stata 14.0 (StataCorp LP, College Station, TX, USA) to compare mean costand mean QALY differences between the treatment groups (3-month vs. 6-month treatment) and theNMB was reported in line with recent reporting guidelines39 and the UK reference case.30 Discounting ofcosts and QALY outcomes beyond 1 year was applied at a rate of 3.5%.30
Bootstrapping (1000 iterations)40 was used to account for uncertainty around the difference in costs andQALYs and to assess how this uncertainty affects the cost-effectiveness outcome. Uncertainty was reportedthrough CIs and the computation of cost-effectiveness acceptability probabilities was estimated as a functionof the threshold for the monetary value of a QALY.41 Subgroup analyses were undertaken, in line with themain trial analyses, to consider cost-effectiveness of the two treatment duration strategies according toplanned treatment regimen (oxaliplatin and 5FU or oxaliplatin and capecitabine), disease risk (high or low),gender and age.
Results
Cost-effectiveness analyses were conducted on information provided by the 6065 patients who consentedto their data being used (see Figure 1).
EffectivenessKaplan–Meier estimates up to 8 years after randomisation were used to determine how overall survivaltime would be split into the three health states – ToT, disease-free and recurrence – for the two treatmentgroups, as shown in Table 5. As would be expected, ToT was significantly higher for patients in the6-month treatment group, whereas disease-free was just outside the 5% statistical-significance level but
TABLE 5 Overall survival time (restricted mean survival) up to 8 years by health status and treatment group
Survival analysis(restricted mean survival)
3-month treatment,mean (n= 3035 patients)
6-month treatment,mean (n= 3030 patients)
Incremental difference
Mean p-value
Time-on-treatmenta 0.21 0.39 –0.18 0.000
Disease-free 5.93 5.74 0.19 0.053
Recurrence 0.73 0.77 –0.041 0.605
Total (overall survival) 6.87 6.90 –0.032 10.695
a Estimation of time-on-treatment was based on 3018 and 3013 patients for the 3-month and 6-month treatment groupsrespectively, owing to missing values.
NotesKaplan–Meier estimates were used for computation of expected time in each health state. Survival time (restricted meansurvival) was estimated to 8 years post randomisation.
DOI: 10.3310/hta23640 HEALTH TECHNOLOGY ASSESSMENT 2019 VOL. 23 NO. 64
© Queen’s Printer and Controller of HMSO 2019. This work was produced by Iveson et al. under the terms of a commissioning contract issued by the Secretary of State for Healthand Social Care. This issue may be freely reproduced for the purposes of private research and study and extracts (or indeed, the full report) may be included in professionaljournals provided that suitable acknowledgement is made and the reproduction is not associated with any form of advertising. Applications for commercial reproduction shouldbe addressed to: NIHR Journals Library, National Institute for Health Research, Evaluation, Trials and Studies Coordinating Centre, Alpha House, University of Southampton SciencePark, Southampton SO16 7NS, UK.
37

favoured the 3-month treatment group. No difference was seen between the groups for time in recurrenceor overall survival. Figure 15 shows the time of overall survival partitioned into ToT, disease-free state andrecurrence state for the two treatment groups, as generated using Kaplan–Meier estimates.
Kaplan–Meier estimates of how overall survival time would be split into the three health states – ToT,disease-free and recurrence – for the two treatment groups, by subgroup, are shown in Table 6.
0 1 2 3 4 5 6 7 8Years from randomisation
0.00
0.25
0.50
0.75
1.00
ToTDF stateRecurrence
(a)
0 1 2 3 4 5 6 7 8Years from randomisation
0.00
0.25
0.50
0.75
1.00
ToTDF stateRecurrence
(b)
FIGURE 15 Overall survival partitioned into ToT, disease-free state after treatment, and recurrence, Kaplan–Meierestimates over 8 years, by treatment group at (a) 3 months and (b) 6 months. DF, disease free.
ECONOMIC ANALYSES
NIHR Journals Library www.journalslibrary.nihr.ac.uk
38

Table 7 shows the results of the utility model for non-missing observations. The effect of recurrence andToT was captured by assigning a value of 1 to the EQ-5D responses occurring in those health states. ToTand recurrence have a significant negative effect on utility, as would be expected; however, the 3-monthtreatment group was estimated to have higher HRQoL (p < 0.05) even after controlling for recurrence andToT. These results are consistent with the higher incidence of AEs in the 6-month than in the 3-month
TABLE 6 Overall survival time by health state: subgroup analysis
Health state
3-monthtreatment,mean
6-monthtreatment,mean
Incrementaldifference,mean (p-value)
3-monthtreatment,mean
6-monthtreatment,mean
Incrementaldifference,mean (p-value)
By planned treatment
Oxaliplatin and 5FU (N = 1971) Oxaliplatin and capecitabine (N = 4094)
Patients (n) 984 987 2051 2043
Recurrence 0.78 0.67 0.11 (0.336) 0.71 0.82 –0.10 (0.336)
Disease-free 5.81 5.96 –0.14 (0.360) 5.98 5.63 0.35 (0.004)
ToT 0.22 0.42 0.20 (< 0.001) 0.20 0.37 –0.17 (< 0.001)
Total(overall survival)
6.82 7.05 –0.22 (0.128) 6.90 6.83 0.071 (0.508)
By risk
High risk (N = 2839) Low risk (N = 3226)
Patients (n) 1424 1415 1611 1615
Recurrence 0.95 0.86 0.08 (0.434) 0.55 0.71 –0.16 (0.158)
Disease-free 5.14 5.10 0.04 (0.739) 6.62 6.30 0.32 (0.016)
ToT 0.21 0.40 –0.18 (< 0.001) 0.21 0.39 –0.18 (< 0.001)
Total(overall survival)
6.31 6.36 –0.048 (0.736) 7.39 7.42 –0.023 (0.806)
By gender
Female (N = 2393) Male (N = 3672)
Patients (n) 1199 1194 1836 1836
Recurrence 0.60 0.67 –0.07 (0.576) 0.82 0.84 –0.02 (0.817)
Disease-free 6.10 5.73 0.37 (0.006) 5.80 5.74 0.053 (0.690)
ToT 0.21 0.38 –0.16 (< 0.001) 0.21 0.40 –0.19 (< 0.001)
Total(overall survival)
6.92 6.78 0.14 (0.279) 6.82 6.98 –0.16 (0.195)
By age
≥ 65 years (N = 3065) < 65 years (N = 3000)
Patients (n) 1525 1540 1510 1490
Recurrence 0.80 0.65 0.15 (0.287) 0.69 0.89 –0.20 (0.042)
Disease-free 5.72 5.69 0.03 (0.838) 6.10 5.78 0.31 (0.013)
ToT 0.21 0.38 –0.16 (< 0.001) 0.21 0.41 –0.20 (< 0.001)
Total(overall survival)
6.73 6.72 0.02 (0.900) 7.01 7.09 –0.077 (0.518)
NotesKaplan–Meier estimates were used for computation of expected time in each health state. Survival time was estimated upto 8 years post randomisation.
DOI: 10.3310/hta23640 HEALTH TECHNOLOGY ASSESSMENT 2019 VOL. 23 NO. 64
© Queen’s Printer and Controller of HMSO 2019. This work was produced by Iveson et al. under the terms of a commissioning contract issued by the Secretary of State for Healthand Social Care. This issue may be freely reproduced for the purposes of private research and study and extracts (or indeed, the full report) may be included in professionaljournals provided that suitable acknowledgement is made and the reproduction is not associated with any form of advertising. Applications for commercial reproduction shouldbe addressed to: NIHR Journals Library, National Institute for Health Research, Evaluation, Trials and Studies Coordinating Centre, Alpha House, University of Southampton SciencePark, Southampton SO16 7NS, UK.
39

treatment group. Patient characteristics were included in the model to adjust health utilities to the averagevalues for the whole SCOT study sample, with and without the EQ-5D data. A statistically significantpositive effect on HRQoL was associated with the variables male and age, with a negative effect seen forAfrican/Caribbean and South Asian patients compared with white/Caucasian patients. Planned treatmentand disease risk did not have a significant effect.
The results of the model follow the pattern of the evolution of EQ-5D scores over time as shown inFigure 16. After baseline, HRQoL decreased for both groups to 3 months; at this point, health utilities forthose in the 3-month treatment group increased as they completed treatment, whereas lower HRQoLpersisted for patients receiving 6 months of adjuvant chemotherapy. Changes in HRQoL were primarilyrelated to ToT, although Figure 16 illustrates that some difference in HRQoL was evident between the twogroups beyond 6 months (completion of adjuvant chemotherapy).
TABLE 7 Health utilities regression
Variable Coefficient Standard error
Number of patientsa (n) 1757
Number of observations (n) 16,091
Health states (reference: disease-free)
ToT –0.0394d 0.00408
Recurrence –0.0578d 0.0139
Treatment group: 6 months –0.0154b 0.00730
Other characteristics
Oxaliplatin and capecitabine 0.00402 0.00783
High risk –0.00911 0.00724
Male 0.0159b 0.00733
Age 0.00162d 0.000429
Ethnicity (reference: white/Caucasian)
African/Caribbean –0.0810b 0.0385
South Asian –0.145c 0.0536
Chinese –0.0447 0.0772
Other 0.0178 0.0217
Constant 0.866d 0.00944
a The total number of EQ-5D questionnaires reported by the patients included in the estimation.b p < 0.05.c p < 0.01.d p < 0.001.NotesThe constant in the model refers to a 65-year-old white female patient with low-risk, stage III disease, in the disease-freehealth state, who was treated with oxaliplatin and 5FU in the 3-month treatment group. Standard error clustered at thepatient level.
ECONOMIC ANALYSES
NIHR Journals Library www.journalslibrary.nihr.ac.uk
40

CostsThe unit costs for treatment and hospitalisation are detailed in Table 8, and Table 9 provides a detailedunit cost breakdown for each of the hospitalisation cost categories. Tables 10 and 11 detail resource usefor chemotherapy and hospitalisations, respectively, for each group of the intervention and by plannedtreatment regimen.
EQ-5
D
Time from randomisation
3 months6 months
0.75
0.85
0.95
1.00
0.80
0.90
Baseli
ne
Month
1
Month
2
Month
3
Month
4
Month
5
Month
6
Month
9
Month
12
Month
18
Year 2
Year 3
Year 4
Year 5
Year 6
Years
7 – 8
FIGURE 16 Evolution of EQ-5D utilities over time, by treatment group. Presented as means and 95% CIs.
TABLE 8 Unit costs used for cost-effectiveness analyses
Adjuvant chemotherapydrug Description Cost (£) Unit cost (£/mg)
Oxaliplatin 200 mg/40 ml concentrate of oxaliplatin forsolution for infusion vials
595.65 2.98
Capecitabine 500-mg tablets of capecitabine, 120 tablets 146.00 2.43 × 10⁻³
5FU (bolus) 500 mg/20 ml solution of 5FU for injectionvials, 10 vials
64.00 1.28 × 10⁻²
5FU (infusion) 2.5 g/100 ml solution of 5FU for infusion vials 32.00 1.28 × 10⁻²
Hospitalisation type Description Unit cost (£/night or case)
Intensive care unit Night in intensive care unit 2190.35
High-dependency unit Night in intensive care unit 937.87
General medicine Night in general medicine unit 476.73
Inpatient (clinical oncology) Night in clinical oncology unit, as inpatient 896.88
Day case (clinical oncology) Day case at clinical oncology 813.22
Outpatient (clinical oncology) Outpatient attendance for clinical oncology 251.77
NotesThe lowest priced medication for each drug at the appropriate dosage was used, as described in the British NationalFormulary 73.35 Hospitalisation unit costs are based on information reported by Information Services Division Scotland 2017(reports: R040 – nights, R042 – day cases, R044 – outpatient).37
DOI: 10.3310/hta23640 HEALTH TECHNOLOGY ASSESSMENT 2019 VOL. 23 NO. 64
© Queen’s Printer and Controller of HMSO 2019. This work was produced by Iveson et al. under the terms of a commissioning contract issued by the Secretary of State for Healthand Social Care. This issue may be freely reproduced for the purposes of private research and study and extracts (or indeed, the full report) may be included in professionaljournals provided that suitable acknowledgement is made and the reproduction is not associated with any form of advertising. Applications for commercial reproduction shouldbe addressed to: NIHR Journals Library, National Institute for Health Research, Evaluation, Trials and Studies Coordinating Centre, Alpha House, University of Southampton SciencePark, Southampton SO16 7NS, UK.
41

TABLE 9 Hospitalisation unit costs
Hospitalisations
Cost per night or case (£)
Total cost (£)Medical Nursing Allied health professional Pharmacy Theatre Laboratory Other Non-direct costs
Intensive care unita 284.24 1029.79 36.63 263.48 9.83 76.44 22.35 467.59 2190.35
High-dependency unita 125.74 423.47 13.82 87.07 41.43 6.40 239.95 937.87
General medicinea 73.12 161.03 16.60 47.80 3.77 25.77 5.81 142.82 476.73
Inpatient (clinical oncology)a 103.47 198.66 74.87 157.15 30.71 38.25 293.77 896.88
Day case (clinical oncology)b 147.27 77.37 51.67 281.32 17.41 24.84 213.34 813.22
Outpatient (clinical oncology)c – – – – – – 192.40 59.37 251.77
a Report R040.b Report R042.c Report R044.NotesAll outpatient indirect costs are included in the ‘other’ category.Hospitalisation unit costs are based on information reported by Information Services Division Scotland 2017.37
TABLE 10 Adjuvant chemotherapy received by intervention and planned regimen (mg/patient)
Drug
All patients (N= 6065) Oxaliplatin and 5FU (N= 1971) Oxaliplatin and capecitabine (N= 4094)
3-monthtreatment,mean
6-monthtreatment,mean
Incrementaldifference:3-month vs.6-month; p-value
3-monthtreatment
6-monthtreatment
Incrementaldifference:3-month vs.6-month; p-value
3-monthtreatment
6-monthtreatment
Incrementaldifference:3-month vs.6-month; p-value
Patients (n) 3035 3030 984 987 2051 2043
Oxaliplatin 842.1 1273.0 –430.8; < 0.001 875.8 1352.5 –476.7; < 0.001 826.0 1234.5 –408.5; < 0.001
Capecitabine 114,142.1 192,930.5 –78,788.4; < 0.001 3622.8 7110.4 –3487.7; 0.031 167,165.6 282,702.6 –115,537.0; < 0.001
5FU bolus 1293.9 2184.6 –890.7; < 0.001 3871.6 6391.7 –2520.1; < 0.001 57.3 152.1 –94.8; < 0.001
5FU continuousinfusion
8012.8 14,196.1 –6183.3; < 0.001 23,991.7 41,645.9 –17,654.3; < 0.001 346.6 934.7 –588.1; < 0.001
ECONOMIC
ANALYSES
NIHRJournals
Librarywww.journalslibrary.nihr.ac.uk
42
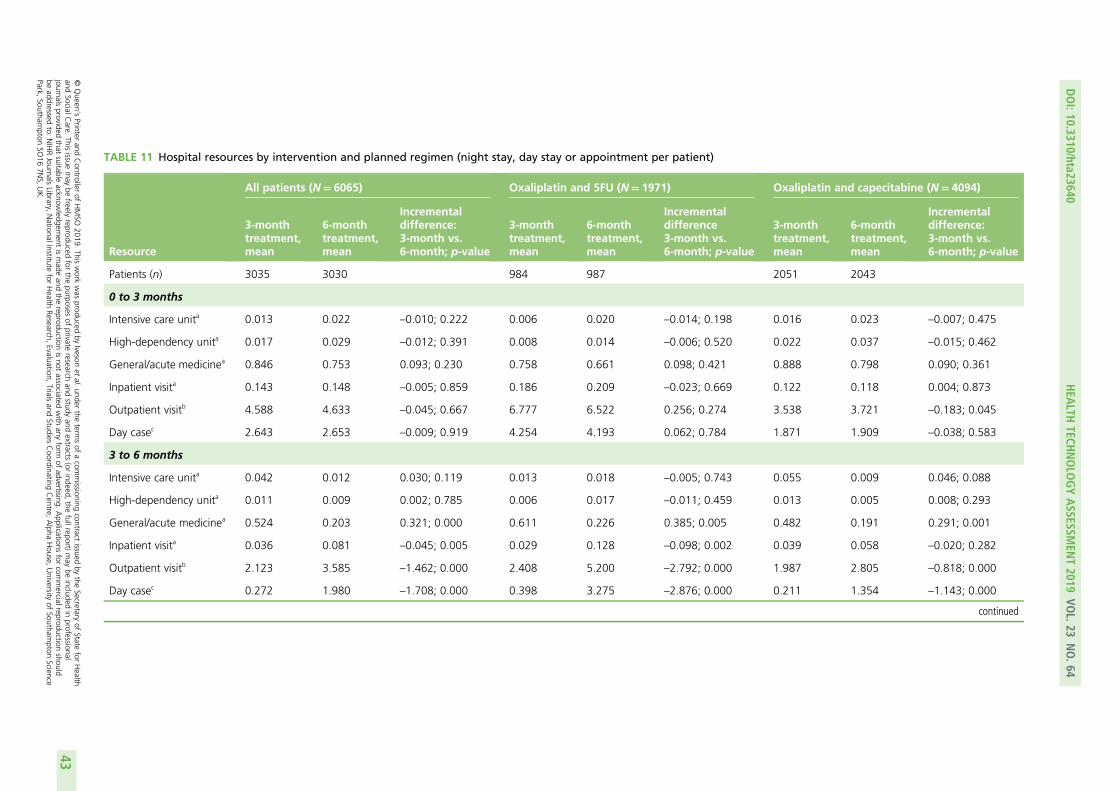
TABLE 11 Hospital resources by intervention and planned regimen (night stay, day stay or appointment per patient)
Resource
All patients (N= 6065) Oxaliplatin and 5FU (N= 1971) Oxaliplatin and capecitabine (N= 4094)
3-monthtreatment,mean
6-monthtreatment,mean
Incrementaldifference:3-month vs.6-month; p-value
3-monthtreatment,mean
6-monthtreatment,mean
Incrementaldifference3-month vs.6-month; p-value
3-monthtreatment,mean
6-monthtreatment,mean
Incrementaldifference:3-month vs.6-month; p-value
Patients (n) 3035 3030 984 987 2051 2043
0 to 3 months
Intensive care unita 0.013 0.022 –0.010; 0.222 0.006 0.020 –0.014; 0.198 0.016 0.023 –0.007; 0.475
High-dependency unita 0.017 0.029 –0.012; 0.391 0.008 0.014 –0.006; 0.520 0.022 0.037 –0.015; 0.462
General/acute medicinea 0.846 0.753 0.093; 0.230 0.758 0.661 0.098; 0.421 0.888 0.798 0.090; 0.361
Inpatient visita 0.143 0.148 –0.005; 0.859 0.186 0.209 –0.023; 0.669 0.122 0.118 0.004; 0.873
Outpatient visitb 4.588 4.633 –0.045; 0.667 6.777 6.522 0.256; 0.274 3.538 3.721 –0.183; 0.045
Day casec 2.643 2.653 –0.009; 0.919 4.254 4.193 0.062; 0.784 1.871 1.909 –0.038; 0.583
3 to 6 months
Intensive care unita 0.042 0.012 0.030; 0.119 0.013 0.018 –0.005; 0.743 0.055 0.009 0.046; 0.088
High-dependency unita 0.011 0.009 0.002; 0.785 0.006 0.017 –0.011; 0.459 0.013 0.005 0.008; 0.293
General/acute medicinea 0.524 0.203 0.321; 0.000 0.611 0.226 0.385; 0.005 0.482 0.191 0.291; 0.001
Inpatient visita 0.036 0.081 –0.045; 0.005 0.029 0.128 –0.098; 0.002 0.039 0.058 –0.020; 0.282
Outpatient visitb 2.123 3.585 –1.462; 0.000 2.408 5.200 –2.792; 0.000 1.987 2.805 –0.818; 0.000
Day casec 0.272 1.980 –1.708; 0.000 0.398 3.275 –2.876; 0.000 0.211 1.354 –1.143; 0.000
continued
DOI:10.3310/hta23640
HEA
LTHTECH
NOLO
GYASSESSM
ENT2019
VOL.23
NO.64
©Queen
’sPrinter
andController
ofHMSO
2019.This
work
was
producedby
Ivesonet
al.under
theterm
sof
acom
missioning
contractissued
bythe
Secretaryof
Statefor
Health
andSocialC
are.This
issuemay
befreely
reproducedfor
thepurposes
ofprivate
researchand
studyand
extracts(or
indeed,the
fullreport)may
beincluded
inprofessional
journalsprovided
thatsuitable
acknowledgem
entismade
andthe
reproductionisnot
associatedwith
anyform
ofadvertising.
Applications
forcom
mercialreproduction
shouldbe
addressedto:
NIHRJournals
Library,NationalInstitute
forHealth
Research,Evaluation,
Trialsand
StudiesCoordinating
Centre,
Alpha
House,
University
ofSoutham
ptonScience
Park,Southam
ptonSO
167N
S,UK.
43

TABLE 11 Hospital resources by intervention and planned regimen (night stay, day stay or appointment per patient) (continued )
Resource
All patients (N= 6065) Oxaliplatin and 5FU (N= 1971) Oxaliplatin and capecitabine (N= 4094)
3-monthtreatment,mean
6-monthtreatment,mean
Incrementaldifference:3-month vs.6-month; p-value
3-monthtreatment,mean
6-monthtreatment,mean
Incrementaldifference3-month vs.6-month; p-value
3-monthtreatment,mean
6-monthtreatment,mean
Incrementaldifference:3-month vs.6-month; p-value
6 to 12 months
Intensive care unita 0.027 0.059 –0.032; 0.082 0.021 0.087 –0.066; 0.042 0.030 0.046 –0.015; 0.489
High-dependency unita 0.015 0.028 –0.014; 0.200 0.024 0.030 –0.006; 0.794 0.010 0.027 –0.017; 0.122
General/acute medicinea 0.842 1.353 –0.511; 0.001 1.036 1.737 –0.701; 0.024 0.749 1.168 –0.419; 0.011
Inpatient visita 0.028 0.048 –0.020; 0.147 0.048 0.048 0.000; 0.996 0.019 0.047 –0.029; 0.042
Outpatient visitb 4.071 4.566 –0.495; 0.000 4.165 4.759 –0.594; 0.001 4.027 4.473 –0.447; 0.000
Day casec 0.399 0.629 –0.230; 0.000 0.477 0.888 –0.411; 0.000 0.362 0.504 –0.142; 0.004
> 12 months
Intensive care unita 0.050 0.053 –0.003; 0.874 0.057 0.065 –0.008; 0.801 0.047 0.047 –0.000; 0.993
High-dependency unita 0.063 0.081 –0.018; 0.520 0.053 0.062 –0.009; 0.775 0.068 0.091 –0.023; 0.561
General/acute medicinea 2.317 2.474 –0.158; 0.467 2.466 2.065 0.402; 0.266 2.245 2.672 –0.427; 0.113
Inpatient visita 0.133 0.110 0.023; 0.537 0.147 0.094 0.053; 0.374 0.126 0.117 0.008; 0.859
Outpatient visitb 8.623 8.755 –0.132; 0.615 8.747 8.380 0.367; 0.442 8.563 8.936 –0.373; 0.236
Day casec 1.319 1.441 –0.121; 0.330 1.311 1.498 –0.188; 0.397 1.323 1.413 –0.089; 0.553
a Number of nights’ stay.b Number of days.c Number of appointments.
ECONOMIC
ANALYSES
NIHRJournals
Librarywww.journalslibrary.nihr.ac.uk
44
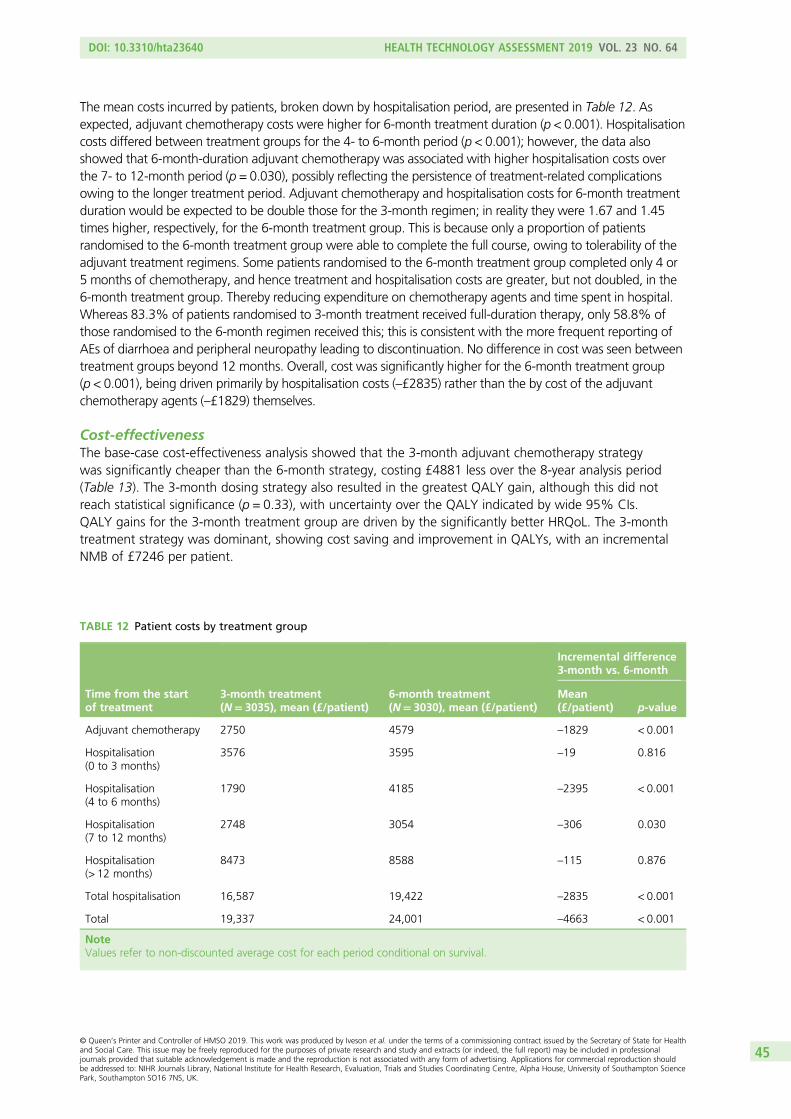
The mean costs incurred by patients, broken down by hospitalisation period, are presented in Table 12. Asexpected, adjuvant chemotherapy costs were higher for 6-month treatment duration (p < 0.001). Hospitalisationcosts differed between treatment groups for the 4- to 6-month period (p < 0.001); however, the data alsoshowed that 6-month-duration adjuvant chemotherapy was associated with higher hospitalisation costs overthe 7- to 12-month period (p = 0.030), possibly reflecting the persistence of treatment-related complicationsowing to the longer treatment period. Adjuvant chemotherapy and hospitalisation costs for 6-month treatmentduration would be expected to be double those for the 3-month regimen; in reality they were 1.67 and 1.45times higher, respectively, for the 6-month treatment group. This is because only a proportion of patientsrandomised to the 6-month treatment group were able to complete the full course, owing to tolerability of theadjuvant treatment regimens. Some patients randomised to the 6-month treatment group completed only 4 or5 months of chemotherapy, and hence treatment and hospitalisation costs are greater, but not doubled, in the6-month treatment group. Thereby reducing expenditure on chemotherapy agents and time spent in hospital.Whereas 83.3% of patients randomised to 3-month treatment received full-duration therapy, only 58.8% ofthose randomised to the 6-month regimen received this; this is consistent with the more frequent reporting ofAEs of diarrhoea and peripheral neuropathy leading to discontinuation. No difference in cost was seen betweentreatment groups beyond 12 months. Overall, cost was significantly higher for the 6-month treatment group(p < 0.001), being driven primarily by hospitalisation costs (–£2835) rather than the by cost of the adjuvantchemotherapy agents (–£1829) themselves.
Cost-effectivenessThe base-case cost-effectiveness analysis showed that the 3-month adjuvant chemotherapy strategywas significantly cheaper than the 6-month strategy, costing £4881 less over the 8-year analysis period(Table 13). The 3-month dosing strategy also resulted in the greatest QALY gain, although this did notreach statistical significance (p = 0.33), with uncertainty over the QALY indicated by wide 95% CIs.QALY gains for the 3-month treatment group are driven by the significantly better HRQoL. The 3-monthtreatment strategy was dominant, showing cost saving and improvement in QALYs, with an incrementalNMB of £7246 per patient.
TABLE 12 Patient costs by treatment group
Time from the startof treatment
3-month treatment(N= 3035), mean (£/patient)
6-month treatment(N= 3030), mean (£/patient)
Incremental difference3-month vs. 6-month
Mean(£/patient) p-value
Adjuvant chemotherapy 2750 4579 –1829 < 0.001
Hospitalisation(0 to 3 months)
3576 3595 –19 0.816
Hospitalisation(4 to 6 months)
1790 4185 –2395 < 0.001
Hospitalisation(7 to 12 months)
2748 3054 –306 0.030
Hospitalisation(> 12 months)
8473 8588 –115 0.876
Total hospitalisation 16,587 19,422 –2835 < 0.001
Total 19,337 24,001 –4663 < 0.001
NoteValues refer to non-discounted average cost for each period conditional on survival.
DOI: 10.3310/hta23640 HEALTH TECHNOLOGY ASSESSMENT 2019 VOL. 23 NO. 64
© Queen’s Printer and Controller of HMSO 2019. This work was produced by Iveson et al. under the terms of a commissioning contract issued by the Secretary of State for Healthand Social Care. This issue may be freely reproduced for the purposes of private research and study and extracts (or indeed, the full report) may be included in professionaljournals provided that suitable acknowledgement is made and the reproduction is not associated with any form of advertising. Applications for commercial reproduction shouldbe addressed to: NIHR Journals Library, National Institute for Health Research, Evaluation, Trials and Studies Coordinating Centre, Alpha House, University of Southampton SciencePark, Southampton SO16 7NS, UK.
45

Figure 17 shows the cost-effectiveness acceptability curve. Three-month-duration adjuvant chemotherapyfor colorectal cancer shows 99% probability of being cost-effective at both the upper and the lower UKdecision thresholds of £30,000 and £20,000 per QALY, respectively.30 The 3-month regimen alsorepresents the optimal choice across a range of willingness-to-pay (WTP) values.
Cost-effectiveness was assessed for various patient subgroups (treatment regimen, level of disease risk, genderand age), as shown in Table 14. Cost-effectiveness results were comparable for the base-case and mostsubgroups, with the exceptions being oxaliplatin and 5FU treatment and male gender; 3-month treatmentwas generally dominant and showed a 99% probability of being the cost-effective option. With oxaliplatinand 5FU treatment, the 3-month treatment group showed cost savings but had fewer QALY gains, whichwas driven by a slightly higher life expectancy in the 6-month treatment group. A relative QALY advantagefor 3-month treatment was seen for oxaliplatin and capecitabine chemotherapy, high-risk disease, femalepatients and older patients. An interaction test of differences in incremental QALYs between subgroupsconcluded that only in the case of the chemotherapy regimen was there a statistically significant difference inQALYs between the 3-month and 6-month treatment groups, amounting to 0.19 QALY gains for oxaliplatin
TABLE 13 Cost estimates and quality-adjusted life-years by treatment group
Interventionstrategy
Cost (£/patient),mean (95% CI)
Life expectancy,mean (95% CI)
QALYs,mean (95% CI)
NMB (Cost/QALY)(£), mean (95% CI)
Probable cost-effectiveness,λ= £30,000
3-monthtreatment
18,401(17,538 to 19,328)
6.87(6.73 to 6.99)
5.30(5.17 to 5.40)
140,492(135,327 to 145,658)
0.995
6-monthtreatment
23,282(22,227 to 24,367)
6.90(6.78 to 7.02)
5.22(5.10 to 5.34)
133,246(129,569 to 136,922)
0.005
Incrementaldifference,3-month vs.6-month
–4881(–6269 to –3492)
–0.03(–0.22 to 0.13)
0.08(–0.086 to 0.230)
7246(3469 to 11,023)
3-monthdominant
NotesHealth utilities conditional on survival considered. Kaplan–Meier survival analysis estimator and partitioned survival analysiswere used for costs and QALYs, respectively. CIs were computed using bootstrap sampling. Probability of cost-effectivenesswas calculated using 1000 bootstrap replications.
Pro
bab
ility
of
cost
-eff
ecti
ve
0 20 40 60 80 100Monetary value of a QALY (£000)
3 months6 months
0.0
0.2
0.4
0.6
0.8
1.0
FIGURE 17 Cost-effectiveness acceptability curve: base-case analysis.
ECONOMIC ANALYSES
NIHR Journals Library www.journalslibrary.nihr.ac.uk
46

TABLE 14 Cost estimates and QALYs for patient subgroups
Interventionstrategy
Cost perpatient (£),mean (95% CI)
Life expectancy,mean (95% CI)
QALYs,mean (95% CI)
NMB(£30,000/QALY),mean (95% CI)
Probability cost-effectivenessλ= £30,000
Oxaliplatin and capecitabine
3-monthtreatment
17,650(16,668 to 18,919)
6.90(6.75 to 7.04)
5.34(5.17 to 5.48)
142,500(136,469 to 148,531)
0.999
6-monthtreatment
21,503(20,389 to 22,723)
6.83(6.67 to 7.99)
5.16(5.00 to 5.32)
133,253(128,206 to 138,300)
0.001
Incrementaldifference
–3,853(–5487 to –2030)
0.07(–0.13 to 0.30)
0.19(–0.001 to 0.38)
9247(4178 to 14,315)
3-monthdominant
Oxaliplatin and 5FU
3-monthtreatment
19,641(18,477 to 20,774)
6.83(6.57 to 7.03)
5.21(4.99 to 5.39)
136,679(128,249 to 145,108)
0.772
6-monthtreatment
26,483(24,659 to 28,292)
7.05(6.87 to 7.23)
5.33(5.15 to 5.51)
133,449(127,107 to 139,791)
0.228
Incrementaldifference
–6841(–9040 to –4756)
–0.22(–0.52 to 0.03)
–0.12(–0.38 to 0.13)
3229(–2494 to 8953)
High risk
3-monthtreatment
19,057(17,888 to 20,339)
6.31(6.11 to 6.52)
4.84(4.46 to 5.03)
126,450(118,973 to 133,927)
0.997
6-monthtreatment
24,815(23,481 to 26,362)
6.36(6.15 to 6.54)
4.71(4.53 to 4.87)
116,477(110,700 to 122,254)
0.003
Incrementaldifference
–5758(–7686 to –3924)
–0.05(–0.32 to 0.24)
0.13(–0.08 to 0.37)
9972(4664 to 15,281)
3-monthdominant
Low risk
3-monthtreatment
17,671(16,596 to 18,925)
7.39(7.25 to 7.52)
5.72(5.58 to 5.85)
153,997(147,785 to 160,208)
0.922
6-monthtreatment
21,422(20,305 to 22,573)
7.41(7.28 to 7.53)
5.71(5.55 to 5.85)
149,816(145,425 to 154,206)
0.078
Incrementaldifference
–3751(–5402 to –2153)
–0.02(–0.20 to 0.17)
0.01(–0.17 to 0.21)
4180(–429 to 8791)
3-monthdominant
Female
3-monthtreatment
17,741(16,408 to 18,934)
6.92(6.74 to 7.08)
5.30(5.13 to 5.47)
141,617(133,821 to 149,413)
0.997
6-monthtreatment
22,228(20,716 to 23,936)
6.78(6.59 to 6.94)
5.10(4.92 to 5.27)
130,893(125,233 to 136,553)
0.003
Incrementaldifference
–4487(–6518 to –2637)
0.14(–0.11 to 0.39)
0.20(–0.03 to 0.44)
10,723(4880 to 16,567)
3-monthdominant
continued
DOI: 10.3310/hta23640 HEALTH TECHNOLOGY ASSESSMENT 2019 VOL. 23 NO. 64
© Queen’s Printer and Controller of HMSO 2019. This work was produced by Iveson et al. under the terms of a commissioning contract issued by the Secretary of State for Healthand Social Care. This issue may be freely reproduced for the purposes of private research and study and extracts (or indeed, the full report) may be included in professionaljournals provided that suitable acknowledgement is made and the reproduction is not associated with any form of advertising. Applications for commercial reproduction shouldbe addressed to: NIHR Journals Library, National Institute for Health Research, Evaluation, Trials and Studies Coordinating Centre, Alpha House, University of Southampton SciencePark, Southampton SO16 7NS, UK.
47

and capecitabine and –0.12 QALY gains for oxaliplatin and 5FU (p = 0.066). This relative advantage of 6-monthtreatment duration with oxaliplatin and 5FU was driven by the longer life expectancy gain (0.22 years vs.–0.007 years, interaction test p = 0.106). In the oxaliplatin and 5FU subgroup, 3-month treatment maintaineda greater NMB, with an incremental NMB compared with 6-month treatment of £3229 and a 77% probabilityof being cost-effective. Therefore, although 3-month treatment with oxaliplatin and 5FU is associated witha slightly lower life expectancy, it remains the optimal treatment strategy. An interaction test of differencesin incremental QALYs between the disease risk, gender and age subgroups showed no significantdifferences in incremental QALYs.
Figure 18 presents the cost-effectiveness acceptability curves for each of the subgroup analyses.For each subgroup, the 3-month strategy had the highest probability of being cost-effective over awide range of WTP values. Only when a threshold higher than £60,000/QALY was considered didthe 6-month regimen become the cost-effective strategy (with highest probability) for the oxaliplatinand 5FU treatment group.
TABLE 14 Cost estimates and QALYs for patient subgroups (continued )
Interventionstrategy
Cost perpatient (£),mean (95% CI)
Life expectancy,mean (95% CI)
QALYs,mean (95% CI)
NMB(£30,000/QALY),mean (95% CI)
Probability cost-effectivenessλ= £30,000
Male
3-monthtreatment
18,857(17,737 to 20,098)
6.83(6.63 to 7.03)
5.28(5.11 to 5.43)
139,377(132,810.1 to 145,944)
0.912
6-monthtreatment
23,695(22,531 to 24,930)
6.98(6.82 to 7.13)
5.29(5.15 to 5.83)
135,055(130,064 to 140,046)
0.088
Incrementaldifference
–4837(–6613 to –3011)
–0.15(–0.40 to 0.09)
–0.02(–0.22 to 0.18)
4321(–351 to 8994)
≥ 65 years
3-monthtreatment
19,364(18,101 to 20,831)
6.73(6.57 to 6.89)
5.24(5.10 to 5.39)
137,918(131,146 to 144,689)
0.985
6-monthtreatment
23,839(21,981 to 24,917)
6.72(6.52 to 6.87)
5.13(4.98 to 5.27)
130,294(125,355 to 135,234)
0.015
Incrementaldifference
–4474(–5994 to –2090)
0.01(–0.22 to 0.27)
0.11(–0.09 to 0.32)
7623(2789 to 12,457)
3-monthdominant
< 65 years
3-monthtreatment
17,572(16,431 to 18,672)
7.01(6.83 to 7.17)
5.35(5.18 to 5.50)
142,872(135,713 to 150,032)
0.977
6-monthtreatment
23,066(21,838 to 24,435)
7.09(6.94 to 7.24)
5.29(5.12 to 5.46)
135,670(130,541 to 140,799)
0.023
Incrementaldifference
–5493(–7297 to –3870)
–0.08(–0.32 to 0.14)
0.05(–0.17 to 0.28)
7202(1609 to 12,795)
3-monthdominant
NotesHealth utilities conditional on survival considered. Kaplan–Meier survival analysis estimator and partitioned survival analysiswere used for costs and QALYs, respectively. CIs were computed using bootstrap sampling. Probability of cost-effectivenesswas calculated using 1000 bootstrap replications.
ECONOMIC ANALYSES
NIHR Journals Library www.journalslibrary.nihr.ac.uk
48

Pro
bab
ility
th
at t
reat
men
t is
co
st-e
ffec
tive
0 20 40 60 80 100Monetary value of a QALY (£000)
0.0
0.2
0.4
0.6
0.8
1.0
3 months6 months
(a)
Pro
bab
ility
th
at t
reat
men
t is
cost
-eff
ecti
ve
0 20 40 60 80 100Monetary value of a QALY (£000)
0.0
0.2
0.4
0.6
0.8
1.0
3 months6 months
(b)
Pro
bab
ility
th
at t
reat
men
t is
cost
-eff
ecti
ve
0 20 40 60 80 100Monetary value of a QALY (£000)
0.0
0.2
0.4
0.6
0.8
1.0
3 months6 months
(c)
Pro
bab
ility
th
at t
reat
men
t is
cost
-eff
ecti
ve
0 20 40 60 80 100Monetary value of a QALY (£000)
0.0
0.2
0.4
0.6
0.8
1.0
3 months6 months
(d)
FIGURE 18 Cost-effectiveness acceptability curves: subgroup analysis. (a) Treatment: CAPOX; (b) treatment: FOLFOX;(c) risk: high; (d) risk: low; (e) gender: female; (f) gender: male; (h) age: ≥ 65 years; and (i) age: < 65 years.CAPOX, oxaliplatin and capecitabine; FOLFOX, oxaliplatin and 5FU. (continued )
DOI: 10.3310/hta23640 HEALTH TECHNOLOGY ASSESSMENT 2019 VOL. 23 NO. 64
© Queen’s Printer and Controller of HMSO 2019. This work was produced by Iveson et al. under the terms of a commissioning contract issued by the Secretary of State for Healthand Social Care. This issue may be freely reproduced for the purposes of private research and study and extracts (or indeed, the full report) may be included in professionaljournals provided that suitable acknowledgement is made and the reproduction is not associated with any form of advertising. Applications for commercial reproduction shouldbe addressed to: NIHR Journals Library, National Institute for Health Research, Evaluation, Trials and Studies Coordinating Centre, Alpha House, University of Southampton SciencePark, Southampton SO16 7NS, UK.
49

Pro
bab
ility
th
at t
reat
men
t is
cost
-eff
ecti
ve
0 20 40 60 80 100Monetary value of a QALY (£000)
0.0
0.2
0.4
0.6
0.8
1.0
3 months6 months
(e)
Pro
bab
ility
th
at t
reat
men
t is
cost
-eff
ecti
ve
0 20 40 60 80 100Monetary value of a QALY (£000)
0.0
0.2
0.4
0.6
0.8
1.0
3 months6 months
(f)
Pro
bab
ility
th
at t
reat
men
t is
cost
-eff
ecti
ve
0 20 40 60 80 100Monetary value of a QALY (£000)
0.0
0.2
0.4
0.6
0.8
1.0
3 months6 months
(g)
Pro
bab
ility
th
at t
reat
men
t is
cost
-eff
ecti
ve
0 20 40 60 80 100Monetary value of a QALY (£000)
0.0
0.2
0.4
0.6
0.8
1.0
3 months6 months
(h)
FIGURE 18 Cost-effectiveness acceptability curves: subgroup analysis. (a) Treatment: CAPOX; (b) treatment: FOLFOX;(c) risk: high; (d) risk: low; (e) gender: female; (f) gender: male; (h) age: ≥ 65 years; and (i) age: < 65 years.CAPOX, oxaliplatin and capecitabine; FOLFOX, oxaliplatin and 5FU.
ECONOMIC ANALYSES
NIHR Journals Library www.journalslibrary.nihr.ac.uk
50

Chapter 5 Discussion
T reatment with oxaliplatin and fluoropyrimidine is the usual adjuvant chemotherapy regimen for patientswith high-risk stage II or stage III colorectal cancer,5,9 with 6-month treatment duration being the accepted
standard. However, oxaliplatin administration is associated with cumulative toxicity that is often characterisedby chronic and often irreversible neuropathy.6,7 Because the toxicity of oxaliplatin/fluoropyrimidine regimensis cumulative, reducing the duration of adjuvant treatment could potentially ameliorate such effects.11 TheSCOT clinical trial was conducted to determine whether or not reducting the duration of administration ofoxaliplatin and fluoropyrimidine adjuvant chemotherapy from 6 months to 3 months is likely to compromiseefficacy; the study also considered the effect of reducing treatment duration on toxicity, HRQoL and healtheconomic parameters. It is our understanding that the SCOT study is the largest single randomised study ofinfusional adjuvant treatment for colorectal cancer to date.
Efficacy assessment
The SCOT study was designed to demonstrate that 3 months of adjuvant oxaliplatin-containingchemotherapy treatment was non-inferior to 6 months of treatment when used to treat patients withhigh-risk stage II or stage III colorectal cancer. The non-inferiority boundary was set to exclude a maximum2.5% decrease in 3-year DFS comparing the 3-month and 6-month treatment groups; based on previoustrials, this would result in an estimated 3-year DFS rate of 78%. The value of 2.5% was chosen because it washalf of the difference in 3-year DFS seen in the MOSAIC study6 when comparing the oxaliplatin-containingtreatment and fluoropyrimidine only.6 Clinicians who routinely treat colorectal cancer considered that thisrepresents a small difference and would be ‘an acceptable pay-off’ for a significant reduction in the sequalaeassociated with persistent neuropathy and the potential for HRQoL improvements in patients for whom thistreatment approach proved curative. This difference corresponds to a HR of 1.13, and it was planned that thiswould be detected with 90% power at the 2.5% one-sided statistical-significance level.
The study protocol planned for the recruitment of 9500 patients who were expected to experience a totalof 2750 DFS events over the course of the trial. However, owing to problems with recruitment, a totalof 6088 patients were randomised to study treatment and experienced 1482 events, thereby reducingthe statistical power to demonstrate an effect to 66%. Despite this limitation, the trial successfullydemonstrated that 3-month oxaliplatin-based adjuvant chemotherapy was non-inferior to 6 months oftreatment (pNI = 0.012) across the overall trial population (patients with high-risk stage II or stage III cancerof the colon or rectum); 3-year DFS rates were 77.1% of patients (SE = 0.8%) for 6-month treatment and76.7% of patients (SE = 0.8%) for 3-month treatment, resulting in a HR of 1.006 (95% CI 0.909 to1.114). The 3-year DFS rate seen for the 6-month treatment group in this study was similar to that seenwith 6 months of oxaliplatin-containing adjuvant chemotherapy in the MOSAIC6 and NSABP C-077 studies(78.2% and 76.1%, respectively), suggesting that the outcome observed in our ‘control’ group wascomparable to previous findings.6,7 The absolute reduction in 3-year DFS rate seen with 3-month treatmentwas 0.4% (SE = 1.1%).
Sensitivity analyses of DFS rate were conducted based on the actual duration of treatment that patientsreceived. These analyses did not show non-inferiority for 3-month adjuvant chemotherapy but were inherentlybiased by the differential exclusion of patients not able to receive prolonged therapy because of the differenttarget treatment durations for the treatment groups. In a setting such as this, where differential compliance isintrinsic to the treatments being compared, the ITT analysis is likely to represent a more appropriate reflectionof the effect of the intervention.
It is important to note that the proportion of patients randomised with stage II disease (as opposed tostage III) was lower than seen in previous trials (18.3% vs. 40% in the MOSAIC trial and 30% in the
DOI: 10.3310/hta23640 HEALTH TECHNOLOGY ASSESSMENT 2019 VOL. 23 NO. 64
© Queen’s Printer and Controller of HMSO 2019. This work was produced by Iveson et al. under the terms of a commissioning contract issued by the Secretary of State for Healthand Social Care. This issue may be freely reproduced for the purposes of private research and study and extracts (or indeed, the full report) may be included in professionaljournals provided that suitable acknowledgement is made and the reproduction is not associated with any form of advertising. Applications for commercial reproduction shouldbe addressed to: NIHR Journals Library, National Institute for Health Research, Evaluation, Trials and Studies Coordinating Centre, Alpha House, University of Southampton SciencePark, Southampton SO16 7NS, UK.
51
NASBP C-07 trial); the SCOT study recruitment, however, was restricted to patients with high-risk stage IIdisease, whereas the patients in the MOSAIC trial and the NASBP C-07 trial had all-risk stage II disease.The SCOT trial included a lower proportion of patients with stage II disease, which could lead to criticismthat the trial populations had different baseline prognoses. However, because the forest plots did notidentify dependence of the effect of duration of adjuvant chemotherapy on N-stage or T-stage disease,or between patients with high-risk stage II versus stage III disease, this indicates that effect of duration isnot a real concern. It should be noted that, in many parts of the world, clinical practice for patients withhigh-risk, stage II disease or stage III disease (especially if over 70 years of age) involves single-agentfluoropyrimidine administered over 6 months, as the addition of oxaliplatin to the regimen for thesepatients has not been shown to improve survival.42 The results of this trial do not provide information onduration of therapy for patients managed with single-agent fluoropyrimidine.
At the time the SCOT study started few data were available concerning the use of adjuvant chemotherapyfor rectal cancer, as many adjuvant-treatment studies exclude these patients. Patients with rectal cancerwere eligible to participate in the SCOT study if they had not received preoperative chemotherapy (short-course radiotherapy alone was allowed) and had undergone total mesorectal excision with an R0 resection.Forest plots did not appear to show any differences in the effect of duration of adjuvant chemotherapywhen comparing patients with rectal and patients with colon cancer. Although definitive conclusions aboutthe effect of treatment duration could not be drawn for patient subgroups from the SCOT trial, as a resultof the small size of many subgroups and fewer numbers of DFS events, the results do raise importantquestions about how to manage patients with rectal cancer. Data from the SCOT study suggest that3-month oxaliplatin-containing adjuvant chemotherapy could be considered for rectal cancer patientsrequiring adjuvant therapy.
This study did not attempt to address the potential impact of various other prognostic factors on theefficacy of standard or short duration oxaliplatin-based adjuvant chemotherapy, such as the sidedness ofthe cancer; RAS and BRAF status, which are known to have an impact on the prognosis of patients withmetastatic disease; and microsatellite instability status.43 These questions cannot be currently answered bythe results of the SCOT study, but the findings of an ongoing translational-research substudy (TransSCOT)will provide more information.
Chemotherapy regimenThe results of both the SCOT study and data pooled for the IDEA collaboration44 indicate that the effectivenessof 3 months of adjuvant chemotherapy may depend on the choice of chemotherapy regimen. When theeffect of duration was assessed for the two chemotherapy regimens specified for the trial (oxaliplatin andcapecitabine and oxaliplatin and 5FU), clear non-inferiority in terms of DFS was demonstrated for patientsreceiving oxaliplatin and capecitabine for 3 months compared with 6 months of treatment (HR 0.94, 95% CI0.84 to 1.07; pNI = 0.002); non-inferiority was not demonstrated when comparing patients receivingoxaliplatin and those receiving 5FU (HR 1.16, 95% CI 0.96 to 1.39; pNI = 0.591). The reasons for this arenot clear.
Achieving full-duration adjuvant chemotherapy treatment over 6 months is more difficult than over3 months. In this study, 83.3% of patients randomised to 3-month adjuvant chemotherapy continued withthe regimen for the planned duration; only 58.8% of those randomised to 6-month adjuvant chemotherapycontinued for the planned duration. However, compliance data showed that 94–98% of patients in the3-month treatment group and 82–85% in the 6-month treatment group were administered the fullplanned fluoropyrimidine dose depending on regimen choice; corresponding figures for oxaliplatin were96–98% for the 3-month treatment group and 69–73% for the 6-month treatment group. As similarproportions of patients received the full planned doses of the individual chemotherapeutic agents for thetwo treatment groups, poor treatment compliance is unlikely to explain the difference in the duration effectbetween the two regimens. It should be noted that capecitabine is an oral drug that is self-administered athome and these assessments are based on the prescribed dose, and so detailed compliance data are notavailable. This could potentially have led to an underestimation of the dose intensity for patients receiving
DISCUSSION
NIHR Journals Library www.journalslibrary.nihr.ac.uk
52

oxaliplatin and capecitabine. However, this is considered unlikely as compliance with oral chemotherapytreatments is usually high.
The chemotherapy regimen that individual patients received was not randomised but rather was selectedby the physician/patient. Thus, the particular chemotherapy combination may have been chosen due toparticular patient characteristics; or there could be a real difference between the 3-month and 6-monthregimens in the adjuvant setting.
l There may have been clinical reasons why a particular chemotherapy regimen was selected foran individual patient. For example, clinicians may have selected the oxaliplatin and capecitabinecombination for patients who were perceived as frail in order to avoid the risk of neutropenic sepsisinherent with oxaliplatin and 5FU; similarly, the starting dose of capecitabine may have been reducedbecause of perceived frailty. However, some clinicians specifically avoid giving capecitabine to olderpatients because of the risks associated with this agent in those with impaired renal function. In thisstudy, the reasons for selecting a particular adjuvant chemotherapy regimen for individual patients arenot known.
l Alternatively, there may be real differences between treatment regimens associated with exposure tothe component agents. For the oxaliplatin and capecitabine regimen, the oxaliplatin dose administeredin each cycle is higher than that for oxaliplatin and 5FU; therefore, it can be presumed that higher peakexposure may be achieved. Two previous studies suggest that peak oxaliplatin concentration is key toclinical effect, which would be likely to favour the oxaliplatin and capecitabine regimen.45,46 In addition,peak fluoropyrimidine exposure to is likely to be lower but the continuity of exposure is greater whenfluoropyrimidine is given twice daily for 2 out of 3 weeks (compared with 5FU, which is given as bolusand then over 2 days every 2 weeks); if cells are cycling through S-phase sporadically, the greatercontinuity of fluoropyrimidine exposure with the capecitabine regimen could mean that there is agreater chance that tumour cells will be exposed at a critical phase in the cell cycle. It could be thatmicrometastatic disease is rendered more sensitive because of one or both of these differences.
Disease stageStage III colorectal cancer is a heterogeneous disease group; data from the IDEA collaboration and frommultiple adjuvant trials have shown that patients with T1–3, N1 pathology have much better outcomesthan those with either T4 or N2 features.44 This has led to the evolution of the concept of high-risk (witheither T4 or N2 disease) and low-risk (with T1–3, N1 disease) stage III patient populations. To optimallytreat stage III colorectal cancer, it may be necessary to treat these groups in different ways. The SCOTstudy has similarly demonstrated that patients with T1–3, N1 disease have better 3-year DFS than thosewith either T4 or N2 pathology, but it did not show a difference in duration effect between these groupswhen this was assessed using a test for heterogeneity. Nonetheless, 3-month chemotherapy was clearlynon-inferior for patients with T1–3, N1 colorectal cancer (HR 0.91, 95% CI 0.75 to 1.10). For patientswith T4 and/or N2 pathology, outcomes were poorer when they received 3 months of treatment; thenon-inferiority of this treatment duration in terms of DFS was not seen in this group of patients in theSCOT study (HR 1.07, 95% CI 0.94 to 1.22). The HR was > 1 for the 3-month compared with the 6-monthduration, suggesting some loss of efficacy. However, the wide CIs mean that this result could reflect awide spectrum of possible effects, from a small potential benefit with 3-month treatment to decreasedefficacy beyond the non-inferiority boundary. It is important to note that the observed absolute reductionin 3-year DFS between the 3-month and the 6-month treatment groups was only 1.9%. Although non-inferiority was not formally met for high-risk stage III patients, in view of the small absolute difference in3-year DFS the benefits of longer treatment duration need to be carefully balanced against the increasedrisk of cumulative chronic toxicity.
Some text in this paragraph is taken from Iveson et al.16 © The Author(s). Published by Elsevier Ltd. This isan Open Access article under the CC BY 4.0 license (https://creativecommons.org/licenses/by/4.0/).
DOI: 10.3310/hta23640 HEALTH TECHNOLOGY ASSESSMENT 2019 VOL. 23 NO. 64
© Queen’s Printer and Controller of HMSO 2019. This work was produced by Iveson et al. under the terms of a commissioning contract issued by the Secretary of State for Healthand Social Care. This issue may be freely reproduced for the purposes of private research and study and extracts (or indeed, the full report) may be included in professionaljournals provided that suitable acknowledgement is made and the reproduction is not associated with any form of advertising. Applications for commercial reproduction shouldbe addressed to: NIHR Journals Library, National Institute for Health Research, Evaluation, Trials and Studies Coordinating Centre, Alpha House, University of Southampton SciencePark, Southampton SO16 7NS, UK.
53

Among patients with T4 or N2 disease, the absolute increase in 3-year DFS rate comparing 6-month with3-month treatment was 2.8% (95% CI –4.1% to 9.7%) for oxaliplatin and 5FU and 1.3% (95% CI –3.7%to 6.2%) for oxaliplatin and capecitabine (see Figure 8). In view of the difference in toxicity seen withlonger duration treatment, patients are likely to accept a small reduction in DFS in exchange for reducedtoxicity; this is especially true if they are able to receive oxaliplatin and capecitabine. There is less evidenceto support use of short-duration adjuvant treatment if it is decided that the patient needs to receiveoxaliplatin and 5FU or has T4 disease.
Safety and toxicity
To our knowledge, this is the largest randomised study of adjuvant chemotherapy for colorectal cancerand confirms the findings of previous studies by showing that oxaliplatin-based combination chemotherapycan be safely delivered, with a mortality rate of 0.5%.6,47 The most common grade 3/4 side effects reportedwere peripheral neuropathy, diarrhoea, neutropenia, fatigue, pain, nausea and hand–foot syndrome, alsoconsistent with previous studies. Although 12% of patients overall had grade 3/4 neutropenia, only 1.2% hadfebrile neutropenia; the febrile neutropenia rate in the MOSAIC study was 1.8%.6
Some text in this paragraph is taken from Iveson et al.16 © The Author(s). Published by Elsevier Ltd. This isan Open Access article under the CC BY 4.0 license (https://creativecommons.org/licenses/by/4.0/).
The SCOT study results show that 6 months of adjuvant chemotherapy is associated with significantlygreater toxicity than 3 months of treatment. This difference was most apparent for peripheral neuropathy,with 58% of patients in the 6-month treatment group reporting grade ≥ 2 neuropathy compared with25% of patients in the 3-month treatment group. Peripheral neuropathy, as reported via a patientquestionnaire, was significantly worse in the 6-month treatment group and persisted for ≥ 5 years. OtherAEs that are important to patients, such as diarrhoea and hand–foot syndrome, were also significantlymore common in patients undergoing 6 months of treatment. Our conclusions regarding long-termneuropathy consequences need to be interpreted in the light of a substantial number of missing data.However, the treatment effect and significance levels are substantial, with no evidence of bias betweenthe treatment groups, and the analysis approach was adapted to make allowance for missing data.
The effects of toxicity early in treatment are important; in the SCOT study, 14% of patients in each groupdid not complete 3 months of treatment. A similar proportion (13%) of those stopping treatment in thefirst 3 months in an adjuvant study using oxaliplatin and capecitabine was reported in 2007.47 Althoughthe choice of chemotherapy was not randomised, in the SCOT study a greater proportion of patientsreceiving oxaliplatin and capecitabine (15%) appeared to stop treatment before 3 months than estimatedfor those receiving oxaliplatin and 5FU (11%).
Achieving full-duration adjuvant chemotherapy treatment over 6 months is more difficult than over3 months. In this study, 83.3% of patients randomised to 3-month adjuvant chemotherapy continued withthe regimen for the planned duration, whereas only 58.8% of those randomised to 6-month adjuvantchemotherapy continued for the planned duration. Problems with delivering 6 months of therapy weremost pronounced for the oxaliplatin component, where the median percentage of full dose delivered was96.6% for the 3-month treatment group as compared with 70.2% for the 6-month treatment group.Fluoropyrimidine treatment was not compromised to the same extent, with the median percentage of fulldoses delivered being 95.3% and 83.2% for the 3-month and 6-month treatment groups, respectively.
As expected, there was a difference in the toxicity profile according to fluoropyrimidine backbone, withmore grade 3/4 neutropenia in those receiving oxaliplatin and 5FU (23% vs. 5%) and more grade3/4 diarrhoea in those receiving oxaliplatin and capecitabine (15% vs. 9%). The frequency of thesetoxicities is consistent with those reported in other studies of adjuvant treatment.6,47
DISCUSSION
NIHR Journals Library www.journalslibrary.nihr.ac.uk
54

Peripheral neuropathyThe only chronic toxicity seen in the SCOT study was sensory peripheral neuropathy, which occurredwith significantly lower frequency in the 3-month treatment group than in the 6-month treatmentgroup (overall grade 3/4 toxicity was 4.1% in the 3-month treatment group compared with 16.5% inthe 6-month treatment group). The study therefore met its aim of achieving a > 50% reduction in theincidence of grade 3/4 peripheral neuropathy by administering treatment over 3 months. The frequency ofperipheral neuropathy reported here is higher than seen for 6-month adjuvant treatment in the MOSAIC,NSABP C-07 and XELOXA trials (12.4%, 8.2% and 11%, respectively).6,7,47 Peripheral neuropathy in theSCOT study was assessed by the investigator using NCI CTCAE (version 3), which grades the condition ona scale of 0–4; neuropathy in the MOSAIC study was graded using NCI CTCAE (version 1), in the NSABPC-07 study using the NCI-Sanofi Neurosensory score (graded from 0–3) and in the XELOXA study usingNCI CTCAE (version 3). As peripheral neuropathy has become recognised as the main dose-limiting toxicitywith oxaliplatin, clinicians may be questioning patients more closely about such symptoms in more recenttrials. The incidence and course of acute and chronic peripheral neuropathy as a result of oxaliplatin hasbeen well documented using a comprehensive PRO measure (EORTC QLQ-CIPN 20).11 This study showedthat the incidence and severity of sensory peripheral neuropathy increases with the number of cycles ofadjuvant chemotherapy received, in broad agreement with the findings of this study.
In the SCOT study, patients were administered either oxaliplatin and capecitabine or oxaliplatin and 5FUin a non-randomised manner. Although the cumulative oxaliplatin dose is similar for the two regimens(1040 mg/m2 and 1020 mg/m2, respectively), the individual doses of oxaliplatin are higher with oxaliplatinand capecitabine (130 mg/m2 every third week compared with 85 mg/m2 every second week withoxaliplatin and 5FU). However, the rates of grade ≥ 2 peripheral neuropathy were similar irrespective ofthe fluoropyrimidine backbone for both the 3-month (21.3% with oxaliplatin and 5FU and 25.7% withoxaliplatin and capecitabine) and the 6-month (57.7% and 58.1%) groups.
In this study, some of the patients who were randomised to receive either 3- or 6-month duration ofadjuvant chemotherapy had persistent neuropathy over ≥ 5 years, with neuropathy frequency beingsignificantly higher (p < 0.001) at 3, 4 and 5 years for those randomised to the 6-month duration treatment.The level of chronic peripheral neuropathy seen in the SCOT study is in line with that previously reported18 months after treatment using EORTC QLQ-CIPN 20,48 with 50% of patients reporting < 10% reductionin sensory neuropathy scores and 19% reporting > 30% reduction in sensory neuropathy scores comparedwith baseline.11
The MOSAIC6 and the NSABP C-077 studies showed rates of grade 3 neuropathy reported at 1 year of1.1% and 0.6%, respectively. It is now recognised that persistent peripheral neuropathy is a major sideeffect for patients who have received oxaliplatin, especially in the adjuvant setting. For the majority ofthese patients neuropathy is a significant problem; because of this, it may be better detected using amore in-depth PRO measure such as the FACT/GOG-Ntx4 questionnaire rather than grading it using theNCI CTCAE.
Health-related quality of life
Health-related quality of life (measured using QLQ-C30 Global Health Status and EQ-5D-3L) declined whilepatients were receiving adjuvant chemotherapy. HRQoL was, therefore, reduced for longer in patientsrandomised to receive 6-month treatment compared with 3-month treatment. HRQoL improved afterstopping treatment and within 1 year there were no clinically important differences between the twotreatment groups. EQ-5D health status, assessed using both the self-rated visual analogue scale and theEQ-5D-3L utility index, did not differ between 9 months and the 7-year follow-up based on the minimalclinically important differences for health utilities in cancer.23
DOI: 10.3310/hta23640 HEALTH TECHNOLOGY ASSESSMENT 2019 VOL. 23 NO. 64
© Queen’s Printer and Controller of HMSO 2019. This work was produced by Iveson et al. under the terms of a commissioning contract issued by the Secretary of State for Healthand Social Care. This issue may be freely reproduced for the purposes of private research and study and extracts (or indeed, the full report) may be included in professionaljournals provided that suitable acknowledgement is made and the reproduction is not associated with any form of advertising. Applications for commercial reproduction shouldbe addressed to: NIHR Journals Library, National Institute for Health Research, Evaluation, Trials and Studies Coordinating Centre, Alpha House, University of Southampton SciencePark, Southampton SO16 7NS, UK.
55

Health-related quality of life and peripheral neuropathyIt is accepted that clinician assessment of neuropathy using methods such as the CTCAE criteria are less sensitivethan PRO tools such as the FACT/GOG-Ntx4 or the EORTC QLQC CIPN 20.49 In this study, we supplemented theCTCAE analyses with specific assessment of peripheral neuropathy using the FACT/GOG-Ntx4.
Health-related quality of life appeared to recover within 1 year of starting treatment; however, chronic sensoryperipheral neuropathy persisted for ≥ 5 years. Patients who recorded a greater degree of neuropathy symptomshad significantly worse HRQoL at 12, 36 and 60 months than those with lesser symptoms. These differencesin HRQoL reached at least minimal clinically important levels. Similar findings were reported for a Dutchstudy, in which there was a correlation between neuropathy symptoms and HRQoL for the 10% of patientswith the worst neuropathy symptoms (as measured by the EORTC QLQ-CIPN 20), with a reduction in theHRQoL scores (as measured by the QLQ-C3020) from 2 to 11 years after oxaliplatin treatment for colorectalcancer.50 It appears that a lack of an overall difference in HRQoL scores does not reflect the meaningfuldifferences experienced by patients with the worst long-term, chronic, neuropathy.
Health economic assessment
The results of the economic evaluation showed that a 3-month duration adjuvant regimen is cheaper and adominant strategy for chemotherapy treatment for patients with high-risk, stage II or stage III colorectalcancer. The shorter treatment duration significantly reduced costs related to adjuvant chemotherapyadministration and hospitalisation. The 3-month treatment group showed significantly better patient HRQoLduring the treatment period, with no significant impact on overall survival, leading to an overall QALY gainthat did not reach statistical significance. The probabilistic analysis and exploration of cost-effectivenessacceptability showed little uncertainty in the economic results over a wide range of WTP thresholds.
Four subgroup analyses came to similar conclusions, with the 3-month treatment group being thedominant or cost-effective strategy given a £30,000 cost per QALY threshold. The type of chemotherapyadministered showed the greatest subgroup affect on cost-effectiveness. The interaction between plannedtreatment and QALY differences between the two treatment groups was statistically significant. Withoxaliplatin and 5FU chemotherapy, the 6-month treatment group generated more QALYs than seen forthe 3-month treatment group, which were primarily driven by longer estimates of disease-free and overallsurvival. HRQoL differences between groups favoured 3-month treatment but the survival gains for the6-month oxaliplatin and 5FU regimen were relevant over the 8-year follow-up period, resulting in anoverall QALY gain. Nonetheless, at a decision threshold of £30,000/QALY the NMB was larger for 3-monthtreatment (incremental gain of £3229 per patient) and, therefore, the 6-month duration treatment wouldnot be considered cost-effective from a UK perspective.30
Modelling an 8-year patient follow-up period allowed exploration of cost-effectiveness outcomes over thislonger time period. Key cost differences occurred within the first year after randomisation, where 6-monthtreatment was nearly twice the cost of 3-month chemotherapy when including associated hospitalisations.When considering years 1 to 8 there were minimal differences in hospitalisation costs between groups;however, over the entire 8-year analysis period the total costs per patient were significantly different andfavoured 3-month treatment. Differences in costs between the treatment groups over an even longer termwould not be expected, with extrapolation beyond 8 years being unlikely to change outcomes unless therewere substantial differences in survival rate. The 8-year follow-up also allows thorough consideration ofthe QALY results, which are driven by event timing. The small differences in life expectancy are subject touncertainty in both the base-case and subgroup analyses, yet the overall HRQoL is consistently higher forthe 3-month treatment group across all analyses. The maximum benefit in terms of HRQoL is seen 3 to6 months after randomisation, at which time patients receiving 3-month duration chemotherapy havestopped treatment. The negative impact on HRQoL for the 6-month treatment group is accounted for bychemotherapy-related AEs.33
DISCUSSION
NIHR Journals Library www.journalslibrary.nihr.ac.uk
56

Study context
The SCOT trial is part of a wider initiative, the IDEA collaboration, which aims to consolidate the resultsfrom all trials being conducted worldwide (SCOT, TOSCA,51 IDEA France,52 CALGB/SWOG 80702, ACHIEVE,53
and HORG54) that are attempting to address whether or not the duration of oxaliplatin-based adjuvantchemotherapy can be reduced to 3 months for patients with stage III colon cancer.14 The results of theSCOT trial are consistent with those from the IDEA collaboration in indicating that the relative effect ofshortening the duration of adjuvant chemotherapy may depend on the choice of chemotherapy regimen(oxaliplatin and 5FU vs. oxaliplatin and capecitabine; p = 0.069 heterogeneity in the SCOT study).55 Whenthe effect of duration was considered separately for each regimen, oxaliplatin and capecitabine showednon-inferiority for 3-month treatment in terms of DFS when compared with 6-month duration adjuvantchemotherapy; for reasons that are not clear, this was not the case for oxaliplatin and 5FU adjuvantchemotherapy. The choice of chemotherapy was not randomised but was chosen by the physician andpatient, with the reasons for selection of a particular regimen being unknown.
Limitations of the study
Some text in this paragraph is taken from Iveson et al.16 © The Author(s). Published by Elsevier Ltd. This isan Open Access article under the CC BY 4.0 license (https://creativecommons.org/licenses/by/4.0/).
The SCOT study was underpowered owing to issues with recruitment, which meant that fewer patientsthan planned participated in the trial. However, the 95% CIs for the HR for the primary analysis lay belowthe non-inferiority boundary and the results were consistent with those of individual studies conductedwithin the IDEA group, particularly when considering how the duration effect depended on treatmentregimen and disease risk. This consistency with other studies indicates that the results of the SCOTstudy are unlikely to represent a false-positive, in terms of showing non-inferiority. The concept thatunderpowered studies are more likely to produce false-positives (ignoring the factor of publication bias,which does not apply to a large scale enterprise such as the SCOT study) is disputed.56
Despite the size of the SCOT study, there are limitations to the reliability of the conclusions that can bedrawn for some patient subgroups. In particular, the SCOT study and the IDEA results indicate that theduration effect differs according to the non-randomised choice of oxaliplatin and 5FU and oxaliplatin andcapecitabine chemotherapy; although non-inferiority could be shown for oxaliplatin and capecitabine, theresults for oxaliplatin and 5FU are less conclusive. Examination of results within the two stage III risk groups(T1–3, N1 and T4 or N2) are similarly compromised.
Some limitations were also associated with the cost-effectiveness analyses presented, which generallyrelate to the need for data censoring given the minimum 3-year follow-up and relatively high survivalrates (in the region of 75% after 8 years). The cost and quality-adjusted survival methodology used(Kaplan–Meier sample average and partitioned survival analysis, respectively) were chosen to reducecensoring-related bias. Lifetime extrapolation was not undertaken for the base-case within trial analysisgiven the non-inferiority of overall survival and DFS, and dominance of the 3-month treatment group.However, a lifetime analysis may improve the evidence for subgroup analyses where non-inferioritycriterion were not met and the dominance conclusion was subject to uncertainty. Future work will explorelifetime analyses for the subgroups.
It should be noted that, although the SCOT study results are applicable to all patients who might beconsidered for 6 months of adjuvant combination chemotherapy with oxaliplatin and fluoropyrimidine,there are patients who are currently treated with 6 months of adjuvant fluoropyrimidine only (somepatients with high-risk stage II disease or older patients with stage III disease). The SCOT study results arenot applicable to patients receiving single agent fluoropyrimidine.
DOI: 10.3310/hta23640 HEALTH TECHNOLOGY ASSESSMENT 2019 VOL. 23 NO. 64
© Queen’s Printer and Controller of HMSO 2019. This work was produced by Iveson et al. under the terms of a commissioning contract issued by the Secretary of State for Healthand Social Care. This issue may be freely reproduced for the purposes of private research and study and extracts (or indeed, the full report) may be included in professionaljournals provided that suitable acknowledgement is made and the reproduction is not associated with any form of advertising. Applications for commercial reproduction shouldbe addressed to: NIHR Journals Library, National Institute for Health Research, Evaluation, Trials and Studies Coordinating Centre, Alpha House, University of Southampton SciencePark, Southampton SO16 7NS, UK.
57


Chapter 6 Conclusions
The SCOT study achieved its primary end point for the overall trial population, showing that 3 monthsof oxaliplatin-containing adjuvant chemotherapy is non-inferior to 6 months of the same regimen.
Three-month oxaliplatin-based chemotherapy should, therefore, be considered as an adjuvant regimen,particularly to oxaliplatin and capecitabine combination therapy. As the study recruited 6088 patients withconventionally defined high-risk stage II and stage III colorectal cancer from a large number of centres andcountries and made use of standard chemotherapy regimens, the study findings are applicable to a typicalpatient with colorectal cancer who needs adjuvant chemotherapy treatment.
Although 3-month treatment with oxaliplatin and capecitabine was statistically non-inferior to 6-monthtreatment, the study did not demonstrate with statistical certainty non-inferiority for the 3-monthoxaliplatin and 5FU regimen. Similarly, for patients with T1–3, N1 disease, the SCOT study demonstratednon-inferiority for 3-month adjuvant treatment; however, for patients with T4 or N2 pathology, a smallabsolute decrease in 3-year DFS was seen with 3-month duration treatment for both the oxaliplatin andcapecitabine and the oxaliplatin and 5FU regimens. In both cases, these absolute differences are small withwide CIs. Therefore, in young, fit patients with very poor prognosis, a more aggressive approach, withlonger treatment duration, might be appropriate.
The SCOT results are supported by the IDEA collaboration, which also showed that the effect of durationof adjuvant treatment was influenced by the choice of chemotherapy regimen and was similarly dependenton whether the patient had low- or high-risk stage III disease.
Some text in this paragraph are taken from Iveson et al.16 © The Author(s). Published by Elsevier Ltd. This isan Open Access article under the CC BY 4.0 license (https://creativecommons.org/licenses/by/4.0/).
Six-month treatment is associated with a considerable increase in toxicity compared with 3-monthtreatment. The toxicity profiles of the oxaliplatin and capecitabine and oxaliplatin and 5FU regimens differ,with diarrhoea and hand–foot syndrome more common with capecitabine and neutropenia more commonwith 5FU. This study confirmed that patients receiving 6-month duration treatment experience significantlygreater acute and chronic neurotoxicity, with chronic neurotoxicity persisting to ≥ 5 years. Patients with theworst chronic neuropathy had significantly poorer HRQoL. Neuropathy is, therefore, a significant chronicside effect of oxaliplatin therapy for patients receiving 6 months of adjuvant chemotherapy. In view ofthe increased toxicity seen with longer therapy and the consequential effects on long-term HRQoL,there should always be a discussion with the individual patient about the most appropriate durationof treatment, balancing the potential for longer treatment to achieve small efficacy benefits with thelikelihood of increased toxicity and poorer HRQoL. The final decision on treatment duration and regimenfor each individual will depend on a careful discussion between the clinician and patient, taking intoaccount the risk of recurrence, the likely absolute difference in DFS and risk of long-term toxicity, and thestrength of evidence for that particular disease context available from both the SCOT study and the widerIDEA analysis.
This study found that, compared with traditional 6-month adjuvant chemotherapy, the 3-month treatmentstrategy costs significantly less and has no significant detrimental impact on patient outcome (HRQoL andsurvival). The 3-month regimen was found to dominate 6-month adjuvant chemotherapy for patients withhigh-risk stage II or stage III colorectal cancer. Cost-effectiveness is affected by the type of chemotherapyregimen used; however, the 3-month strategy was the optimal choice for both the oxaliplatin and capecitabineand the oxaliplatin and 5FU regimens based on relevant WTP thresholds. This economic evaluation adds to theevidence showing that 3-month treatment is not only cost-effective but also dominant over the currentstandard of 6-month treatment; little uncertainty is associated with this conclusion, which supports theeconomic case that 3-month treatment is sufficient for most patients.
DOI: 10.3310/hta23640 HEALTH TECHNOLOGY ASSESSMENT 2019 VOL. 23 NO. 64
© Queen’s Printer and Controller of HMSO 2019. This work was produced by Iveson et al. under the terms of a commissioning contract issued by the Secretary of State for Healthand Social Care. This issue may be freely reproduced for the purposes of private research and study and extracts (or indeed, the full report) may be included in professionaljournals provided that suitable acknowledgement is made and the reproduction is not associated with any form of advertising. Applications for commercial reproduction shouldbe addressed to: NIHR Journals Library, National Institute for Health Research, Evaluation, Trials and Studies Coordinating Centre, Alpha House, University of Southampton SciencePark, Southampton SO16 7NS, UK.
59

Implications for practice and implications for research
The findings of this research indicate that 3 months of adjuvant chemotherapy may be sufficient for somepatients. For patients with low-risk stage III disease (T1–3, N1) receiving adjuvant oxaliplatin and capecitabinechemotherapy, 3 months of treatment is sufficient. Many low-risk stage III patients receiving adjuvantoxaliplatin and 5FU chemotherapy and high-risk stage III patients receiving adjuvant oxaliplatin andcapecitabine chemotherapy may be considered for 3 months of treatment. The optimum duration ofadjuvant treatment for high-risk stage III patients is less certain.
Research is needed on the influence of T4 or N2 on the required duration of adjuvant treatment forhigh-risk stage III patients.
Further research should be conducted to identify any specific patient groups (e.g. patients with specifichigh-risk pathological features) for whom 6 months of adjuvant chemotherapy might be appropriate andif this is dependent on the regimen selected. The translational tissue samples from the SCOT study(3383 tumour samples and 3100 blood samples) and from other similar studies should be used to buildmolecular predictors of which patients may benefit from longer treatment. Some of this work is currentlyunder way for the SCOT study.
CONCLUSIONS
NIHR Journals Library www.journalslibrary.nihr.ac.uk
60

Acknowledgements
Contributions of authors
Professor Timothy Iveson (https://orcid.org/0000-0002-4681-2712) (Corresponding Author, MedicalOncologist) was involved in the study concept and design, trial supervision, patient recruitment, dataanalysis and manuscript writing and review.
Dr Kathleen A Boyd (https://orcid.org/0000-0002-9764-0113) (Senior Lecturer in Health Economics)undertook data analysis, manuscript writing and review.
Professor Rachel S Kerr (https://orcid.org/0000-0002-7240-3269) (Medical Oncologist) was involvedin study concept and design, trial supervision, data analysis and manuscript writing and review.
Dr Jose Robles-Zurita (https://orcid.org/0000-0002-3862-8798) (Health Economics) undertook dataanalysis, manuscript writing and review.
Professor Mark P Saunders (Clinical Oncologist) was involved in trial supervision, patient recruitment,data analysis and manuscript writing and review.
Professor Andrew H Briggs (https://orcid.org/0000-0002-0777-1997) (Professor of Health Economicsand Health Technology Assessment) was involved in grant submission, study concept and design,manuscript writing and review.
Professor Jim Cassidy (https://orcid.org/0000-0003-3917-561X) (Medical Oncologist) was involvedin grant submission, study concept and design, trial supervision, patient recruitment and review ofthe manuscript.
Dr Niels Henrik Hollander (https://orcid.org/0000-0003-2509-2231) (Clinical Oncologist) was involvedin trial supervision, patient recruitment and review of the manuscript.
Dr Josep Tabernero (https://orcid.org/0000-0002-2495-8139) (Medical Oncologist) was involved in trialsupervision, patient recruitment and review of the manuscript.
Dr Andrew Haydon (Medical Oncologist) was involved in trial supervision, patient recruitment and reviewof the manuscript.
Professor Bengt Glimelius (https://orcid.org/0000-0002-5440-791X) (Medical Oncologist): wasinvolved in trial supervision, patient recruitment and review of the manuscript.
Mrs Andrea Harkin (https://orcid.org/0000-0002-8831-7381) (Clinical Trials Unit Operations Director,Glasgow) was involved in grant submission, data interpretation, manuscript writing and review.
Mrs Karen Allan (https://orcid.org/0000-0002-3887-0402) (Clinical Trials Unit Project Manager, Glasgow)was involved in grant submission, data collection, data interpretation, manuscript writing and review.
Mr John McQueen (https://orcid.org/0000-0001-5950-8819) (Clinical Trials Unit Trial Co-ordinator,Glasgow) undertook data collection, data interpretation, manuscript writing and review.
Mrs Sarah Pearson (https://orcid.org/0000-0001-5386-1953) (Trial Co-ordination, Oxford) undertookdata interpretation, manuscript writing and review.
DOI: 10.3310/hta23640 HEALTH TECHNOLOGY ASSESSMENT 2019 VOL. 23 NO. 64
© Queen’s Printer and Controller of HMSO 2019. This work was produced by Iveson et al. under the terms of a commissioning contract issued by the Secretary of State for Healthand Social Care. This issue may be freely reproduced for the purposes of private research and study and extracts (or indeed, the full report) may be included in professionaljournals provided that suitable acknowledgement is made and the reproduction is not associated with any form of advertising. Applications for commercial reproduction shouldbe addressed to: NIHR Journals Library, National Institute for Health Research, Evaluation, Trials and Studies Coordinating Centre, Alpha House, University of Southampton SciencePark, Southampton SO16 7NS, UK.
61

Dr Ashita Waterston (https://orcid.org/0000-0002-2080-4749) (Medical Oncology) undertook patientrecruitment and review of the manuscript.
Dr Louise Medley (https://orcid.org/0000-0003-0725-3812) (Medical Oncology) undertook patientrecruitment and review of the manuscript.
Dr Charles Wilson (https://orcid.org/0000-0002-2597-5694) (Clinical Oncology) undertook patientrecruitment and review of the manuscript.
Dr Richard Ellis (https://orcid.org/0000-0002-4760-7921) (Clinical Oncology) undertook patientrecruitment and review of the manuscript.
Dr Sharadah Essapen (Clinical Oncology) undertook patient recruitment and review of the manuscript.
Dr Amandeep S Dhadda (https://orcid.org/0000-0003-3561-3811) (Clinical Oncology) undertookpatient recruitment and review of the manuscript.
Dr Mark Harrison (Clinical Oncology) undertook patient recruitment and review of the manuscript.
Dr Stephen Falk (https://orcid.org/0000-0001-6106-3062) (Clinical Oncology) undertook patientrecruitment and review of the manuscript.
Dr Sherif Raouf (https://orcid.org/0000-0002-3870-1828) (Clinical Oncology) undertook patientrecruitment and review of the manuscript.
Dr Charlotte Rees (Medical Oncology) undertook patient recruitment and review of the manuscript.
Dr Rene K Olesen (https://orcid.org/0000-0002-3331-6904) (Clinical Oncology) undertook patientrecruitment and review of the manuscript.
Dr David Propper (https://orcid.org/0000-0002-4274-5460) (Medical Oncology) undertook patientrecruitment and review of the manuscript.
Dr John Bridgewater (https://orcid.org/0000-0001-9186-1604) (Medical Oncology) undertook patientrecruitment and review of the manuscript.
Dr Ashraf Azzabi (https://orcid.org/0000-0003-4801-9109) (Medical Oncology) undertook patientrecruitment and review of the manuscript.
Dr David Farrugia (https://orcid.org/0000-0001-9777-1394) (Medical Oncology) undertook patientrecruitment and review of the manuscript.
Dr Andrew Webb (https://orcid.org/0000-0003-1304-0434) (Medical Oncology) undertook patientrecruitment and review of the manuscript.
Dr David Cunningham (https://orcid.org/0000-0001-5158-1069) (Medical Oncology) undertook patientrecruitment and review of the manuscript.
Dr Tamas Hickish (Medical Oncology) undertook patient recruitment and review of the manuscript.
Dr Andrew Weaver (https://orcid.org/0000-0001-8919-3598) (Clinical Oncology) undertook patientrecruitment and review of the manuscript.
ACKNOWLEDGEMENTS
NIHR Journals Library www.journalslibrary.nihr.ac.uk
62

Dr Simon Gollins (Clinical Oncology) undertook patient recruitment and review of the manuscript.
Dr Harpreet Wasan (https://orcid.org/0000-0002-6268-2030) (Medical Oncology) undertook patientrecruitment and review of the manuscript.
Mr James Paul (https://orcid.org/0000-0001-7367-5816) (Head of Biostatistics, Clinical Trials Unit,Glasgow) was involved in grant submission, study concept and design, data interpretation, data analysis,manuscript writing and review.
Data-sharing statement
All data requests should be submitted to the corresponding author for consideration. Access toanonymised data may be granted following review and appropriate agreements being in place.
Patient data
This work uses data provided by patients and collected by the NHS as part of their care and support. Usingpatient data is vital to improve health and care for everyone. There is huge potential to make better use ofinformation from people’s patient records, to understand more about disease, develop new treatments,monitor safety, and plan NHS services. Patient data should be kept safe and secure, to protect everyone’sprivacy, and it’s important that there are safeguards to make sure that it is stored and used responsibly.Everyone should be able to find out about how patient data are used. #datasaveslives You can find outmore about the background to this citation here: https://understandingpatientdata.org.uk/data-citation.
DOI: 10.3310/hta23640 HEALTH TECHNOLOGY ASSESSMENT 2019 VOL. 23 NO. 64
© Queen’s Printer and Controller of HMSO 2019. This work was produced by Iveson et al. under the terms of a commissioning contract issued by the Secretary of State for Healthand Social Care. This issue may be freely reproduced for the purposes of private research and study and extracts (or indeed, the full report) may be included in professionaljournals provided that suitable acknowledgement is made and the reproduction is not associated with any form of advertising. Applications for commercial reproduction shouldbe addressed to: NIHR Journals Library, National Institute for Health Research, Evaluation, Trials and Studies Coordinating Centre, Alpha House, University of Southampton SciencePark, Southampton SO16 7NS, UK.
63


References
1. Ferlay J, Soerjomataram I, Ervik M, Dikshit R, Eser S, Mathers C. GLOBOCAN 2012 v1.0, CancerIncidence and Mortality Worldwide: IARC Cancer Base No.11. Lyon: International Agency forResearch on Cancer; 2013.
2. Obrand DI, Gordon PH. Incidence and patterns of recurrence following curative resection forcolorectal carcinoma. Dis Colon Rectum 1997;40:15–24. https://doi.org/10.1007/BF02055676
3. Moertel CG, Fleming TR, Macdonald JS, Haller DG, Laurie JA, Goodman PJ, et al. Levamisole andfluorouracil for adjuvant therapy of resected colon carcinoma. N Engl J Med 1990;322:352–8.https://doi.org/10.1056/NEJM199002083220602
4. O’Connell MJ, Laurie JA, Kahn M, Fitzgibbons RJ, Erlichman C, Shepherd L, et al. Prospectivelyrandomized trial of postoperative adjuvant chemotherapy in patients with high-risk colon cancer.J Clin Oncol 1998;16:295–300. https://doi.org/10.1200/JCO.1998.16.1.295
5. National Comprehensive Cancer Network (NCCN). Guidelines: Colon Cancer (Version 2.2107).Plymouth Meeting, PA: NCCN.
6. André T, Boni C, Mounedji-Boudiaf L, Navarro M, Tabernero J, Hickish T, et al. Oxaliplatin,fluorouracil, and leucovorin as adjuvant treatment for colon cancer. N Engl J Med2004;350:2343–51. https://doi.org/10.1056/NEJMoa032709
7. Kuebler JP, Wieand HS, O’Connell MJ, Smith RE, Colangelo LH, Yothers G, et al. Oxaliplatincombined with weekly bolus fluorouracil and leucovorin as surgical adjuvant chemotherapy forstage II and III colon cancer: results from NSABP C-07. J Clin Oncol 2007;25:2198–204.https://doi.org/10.1200/JCO.2006.08.2974
8. Haller DG, Tabernero J, Maroun J, de Braud F, Price T, Van Cutsem E, et al. Capecitabine plusoxaliplatin compared with fluorouracil and folinic acid as adjuvant therapy for stage III coloncancer. J Clin Oncol 2011;29:1465–71. https://doi.org/10.1200/JCO.2010.33.6297
9. Schmoll HJ, Van Cutsem E, Stein A, Valentini V, Glimelius B, Haustermans K, et al. ESMOConsensus Guidelines for management of patients with colon and rectal cancer. A personalizedapproach to clinical decision making. Ann Oncol 2012;23:2479–516. https://doi.org/10.1093/annonc/mds236
10. Land SR, Kopec JA, Cecchini RS, Ganz PA, Wieand HS, Colangelo LH, et al. Neurotoxicity fromoxaliplatin combined with weekly bolus fluorouracil and leucovorin as surgical adjuvantchemotherapy for stage II and III colon cancer: NSABP C-07. J Clin Oncol 2007;25:2205–11.https://doi.org/10.1200/JCO.2006.08.6652
11. Pachman DR, Qin R, Seisler DK, Smith EM, Beutler AS, Ta LE, et al. Clinical course of oxaliplatin-induced neuropathy: results from the randomized phase III trial N08CB (Alliance). J Clin Oncol2015;33:3416–22. https://doi.org/10.1200/JCO.2014.58.8533
12. Saini A, Norman AR, Cunningham D, Chau I, Hill M, Tait D, et al. Twelve weeks of protractedvenous infusion of fluorouracil (5-FU) is as effective as 6 months of bolus 5-FU and folinic acid asadjuvant treatment in colorectal cancer. Br J Cancer 2003;88:1859–65. https://doi.org/10.1038/sj.bjc.6600995
13. Laudicella M, Walsh B, Burns E, Smith PC. Cost of care for cancer patients in England: evidencefrom population-based patient-level data. Br J Cancer 2016;114:1286–92. https://doi.org/10.1038/bjc.2016.77
DOI: 10.3310/hta23640 HEALTH TECHNOLOGY ASSESSMENT 2019 VOL. 23 NO. 64
© Queen’s Printer and Controller of HMSO 2019. This work was produced by Iveson et al. under the terms of a commissioning contract issued by the Secretary of State for Healthand Social Care. This issue may be freely reproduced for the purposes of private research and study and extracts (or indeed, the full report) may be included in professionaljournals provided that suitable acknowledgement is made and the reproduction is not associated with any form of advertising. Applications for commercial reproduction shouldbe addressed to: NIHR Journals Library, National Institute for Health Research, Evaluation, Trials and Studies Coordinating Centre, Alpha House, University of Southampton SciencePark, Southampton SO16 7NS, UK.
65

14. André T, Iveson T, Labianca R, Meyerhardt JA, Souglakos I, Yoshino T, et al. The IDEA (InternationalDuration Evaluation of Adjuvant Chemotherapy) collaboration: prospective combined analysis of phaseIII trials investigating duration of adjuvant therapy with the FOLFOX (FOLFOX4 or Modified FOLFOX6) orXELOX (3 versus 6 months) regimen for patients with stage III colon cancer: trial design and currentstatus. Curr Colorectal Cancer Rep 2013;9:261–9. https://doi.org/10.1007/s11888-013-0181-6
15. World Medical Association. World Medical Association Declaration of Helsinki. Ethical principles formedical research involving human subjects. Bull World Health Organ 2001;79:373–4.
16. Iveson TJ, Kerr RS, Saunders MP, Cassidy J, Hollander NH, Tabernero J, et al. 3 versus 6 monthsof adjuvant oxaliplatin-fluoropyrimidine combination therapy for colorectal cancer (SCOT):an international, randomised, phase 3, non-inferiority trial. Lancet Oncol 2018;19:562–78.https://doi.org/10.1016/S1470-2045(18)30093-7
17. Aaronson NK, Ahmedzai S, Bergman B, Bullinger M, Cull A, Duez NJ, et al. The EuropeanOrganization for Research and Treatment of Cancer QLQ-C30: a quality-of-life instrument foruse in international clinical trials in oncology. J Natl Cancer Inst 1993;85:365–76. https://doi.org/10.1093/jnci/85.5.365
18. Whistance RN, Conroy T, Chie W, Costantini A, Sezer O, Koller M, et al. Clinical and psychometricvalidation of the EORTC QLQ-CR29 questionnaire module to assess health-related quality of life inpatients with colorectal cancer. Eur J Cancer 2009;45:3017–26. https://doi.org/10.1016/j.ejca.2009.08.014
19. Rabin R, de Charro F. EQ-5D: a measure of health status from the EuroQol Group. Ann Med2001;33:337–43. https://doi.org/10.3109/07853890109002087
20. Dolan P. Modeling valuations for EuroQol health states. Med Care 1997;35:1095–108. https://doi.org/10.1097/00005650-199711000-00002
21. Huang HQ, Brady MF, Cella D, Fleming G. Validation and reduction of FACT/GOG-Ntx subscalefor platinum/paclitaxel-induced neurologic symptoms: a gynecologic oncology group study.Int J Gynecol Cancer 2007;17:387–93. https://doi.org/10.1111/j.1525-1438.2007.00794.x
22. Osoba D, Rodrigues G, Myles J, Zee B, Pater J. Interpreting the significance of changes inhealth-related quality-of-life scores. J Clin Oncol 1998;16:139–44. https://doi.org/10.1200/JCO.1998.16.1.139
23. Pickard AS, Neary MP, Cella D. Estimation of minimally important differences in EQ-5D utility and VASscores in cancer. Health Qual Life Outcomes 2007;5:70. https://doi.org/10.1186/1477-7525-5-70
24. Paul J, Iveson T, Midgley R, Harkin A, Masterton M, Alexander L, Cassidy J. Choice ofrandomisation time-point in non-inferiority studies of reduced treatment duration: experiencefrom the SCOT study. Trials 2011;12:A30. https://doi.org/10.1186/1745-6215-12-S1-A30
25. Rubin DB. Multiple Imputation for Nonresponse in Surveys. New York, NY: John Wiley & Sons;1987. https://doi.org/10.1002/9780470316696
26. Qian W, Parmar MK, Sambrook RJ, Fayers PM, Girling DJ, Stephens RJ. Analysis of messylongitudinal data from a randomized clinical trial. MRC Lung Cancer Working Party. Stat Med2000;19:2657–74. https://doi.org/10.1002/1097-0258(20001015)19:19<2657::AID-SIM557>3.0.CO;2-3
27. Hochberg Y. A sharper Bonferroni procedure for multiple tests of significance. Biometrika1988;75:800–2. https://doi.org/10.1093/biomet/75.4.800
28. Demets DL. Futility approaches to interim monitoring by data monitoring committees. Clin Trials2006;3:522–9. https://doi.org/10.1177/1740774506073115
REFERENCES
NIHR Journals Library www.journalslibrary.nihr.ac.uk
66

29. André T, de Gramont A, Vernerey D, Chibaudel B, Bonnetain F, Tijeras-Raballand A, et al. Adjuvantfluorouracil, leucovorin, and oxaliplatin in stage II to III colon cancer: updated 10-year survival andoutcomes according to BRAF mutation and mismatch repair status of the MOSAIC study. J ClinOncol 2015;33:4176–87. https://doi.org/10.1200/JCO.2015.63.4238
30. National Institute for Health and Care Excellence (NICE). Guide to the Methods of TechnologyAppraisal. London: NICE; 2013.
31. Petrou S, Gray A. Economic evaluation alongside randomised controlled trials: design, conduct,analysis, and reporting. BMJ 2011;342:d1548. https://doi.org/10.1136/bmj.d1548
32. Billingham LJ, Abrams KR. Simultaneous analysis of quality of life and survival data. Stat MethodsMed Res 2002;11:25–48. https://doi.org/10.1191/0962280202sm269ra
33. Boyd KA, Briggs AH, Paul J, Iveson T, Midgely R, Harkin A, et al. Analysis of adverse events andhealth-related quality of life data for an economic evaluation of adjuvant chemotherapyincolorectal cancer: when can we stop collecting? Trials 2011;12:A41. https://doi.org/10.1186/1745-6215-12-S1-A41
34. Billingham LJ, Abrams KR, Jones DR. Methods for the analysis of quality-of-life and survival data inhealth technology assessment. Health Technol Assess 1999;3(10). https://doi.org/10.3310/hta3100
35. Joint Formulary Committee. British National Formulary 73 ed. London: BMJ Group andPharmaceutical Press; 2017.
36. Wong YN, Meropol NJ, Speier W, Sargent D, Goldberg RM, Beck JR. Cost implications of newtreatments for advanced colorectal cancer. Cancer 2009;115:2081–91. https://doi.org/10.1002/cncr.24246
37. NHS National Services Scotland Information Services Division. Scottish Health Service Costs 2016.Edinburgh: NHS National Services Scotland Information Services Division; 2016.
38. Lin DY, Feuer EJ, Etzioni R, Wax Y. Estimating medical costs from incomplete follow-up data.Biometrics 1997;53:419–34. https://doi.org/10.2307/2533947
39. Husereau D, Drummond M, Petrou S, Carswell C, Moher D, Greenberg D, et al. ConsolidatedHealth Economic Evaluation Reporting Standards (CHEERS) – explanation and elaboration: a reportof the ISPOR health economic evaluation publication guidelines good reporting practices task force.Value Health 2013;16:231–50. https://doi.org/10.1016/j.jval.2013.02.002
40. Briggs AH, Wonderling DE, Mooney CZ. Pulling cost-effectiveness analysis up by its bootstraps:a non-parametric approach to confidence interval estimation. Health Econ 1997;6:327–40.https://doi.org/10.1002/(SICI)1099-1050(199707)6:4<327::AID-HEC282>3.0.CO;2-W
41. Fenwick E, Claxton K, Sculpher M. Representing uncertainty: the role of cost-effectivenessacceptability curves. Health Econ 2001;10:779–87. https://doi.org/10.1002/hec.635
42. Tournigand C, André T, Bonnetain F, Chibaudel B, Lledo G, Hickish T, et al. Adjuvant therapy withfluorouracil and oxaliplatin in stage II and elderly patients (between ages 70 and 75 years) withcolon cancer: subgroup analyses of the Multicenter International Study of Oxaliplatin, Fluorouracil,and Leucovorin in the Adjuvant Treatment of Colon Cancer trial. J Clin Oncol 2012;30:3353–60.https://doi.org/10.1200/JCO.2012.42.5645
43. Sargent DJ, Marsoni S, Monges G, Thibodeau SN, Labianca R, Hamilton SR, et al. Defectivemismatch repair as a predictive marker for lack of efficacy of fluorouracil-based adjuvant therapyin colon cancer. J Clin Oncol 2010;28:3219–26. https://doi.org/10.1200/JCO.2009.27.1825
DOI: 10.3310/hta23640 HEALTH TECHNOLOGY ASSESSMENT 2019 VOL. 23 NO. 64
© Queen’s Printer and Controller of HMSO 2019. This work was produced by Iveson et al. under the terms of a commissioning contract issued by the Secretary of State for Healthand Social Care. This issue may be freely reproduced for the purposes of private research and study and extracts (or indeed, the full report) may be included in professionaljournals provided that suitable acknowledgement is made and the reproduction is not associated with any form of advertising. Applications for commercial reproduction shouldbe addressed to: NIHR Journals Library, National Institute for Health Research, Evaluation, Trials and Studies Coordinating Centre, Alpha House, University of Southampton SciencePark, Southampton SO16 7NS, UK.
67

44. Shi Q, Sobrero AF, Shields AF, Yoshino T, Paul J, Taieb J, et al. Prospective pooled analysis of sixphase III trials investigating duration of adjuvant oxaliplatin-based therapy (3 vs 6 months) forpatients with stage III colon cancer: the IDEA (International Duration Evaluation of Adjuvantchemotherapy) collaboration. J Clin Oncol 2017;35:LBA1. https://doi.org/10.1200/JCO.2017.35.15_suppl.LBA1
45. Chau I, Norman AR, Cunningham D, Tait D, Ross PJ, Iveson T, et al. A randomised comparisonbetween 6 months of bolus fluorouracil/leucovorin and 12 weeks of protracted venous infusionfluorouracil as adjuvant treatment in colorectal cancer. Ann Oncol 2005;16:549–57. https://doi.org/10.1093/annonc/mdi116
46. Twelves C, Wong A, Nowacki MP, Abt M, Burris H, Carrato A, et al. Capecitabine as adjuvanttreatment for stage III colon cancer. N Engl J Med 2005;352:2696–704. https://doi.org/10.1056/NEJMoa043116
47. Schmoll HJ, Cartwright T, Tabernero J, Nowacki MP, Figer A, Maroun J, et al. Phase III trial ofcapecitabine plus oxaliplatin as adjuvant therapy for stage III colon cancer: a planned safety analysisin 1,864 patients. J Clin Oncol 2007;25:102–9. https://doi.org/10.1200/JCO.2006.08.1075
48. Postma TJ, Aaronson NK, Heimans JJ, Muller MJ, Hildebrand JG, Delattre JY, et al. The developmentof an EORTC quality of life questionnaire to assess chemotherapy-induced peripheral neuropathy:the QLQ-CIPN20. Eur J Cancer 2005;41:1135–9.
49. Majithia N, Temkin SM, Ruddy KJ, Beutler AS, Hershman DL, Loprinzi CL. National CancerInstitute-supported chemotherapy-induced peripheral neuropathy trials: outcomes and lessons.Support Care Cancer 2016;24:1439–47. https://doi.org/10.1007/s00520-015-3063-4
50. Mols F, Beijers T, Lemmens V, van den Hurk CJ, Vreugdenhil G, van de Poll-Franse LV.Chemotherapy-induced neuropathy and its association with quality of life among 2- to 11-yearcolorectal cancer survivors: results from the population-based PROFILES registry. J Clin Oncol2013;31:2699–707. https://doi.org/10.1200/JCO.2013.49.1514
51. Sobrero A, Lonardi S, Rosati G, Di Bartolomeo M, Ronzoni M, Pella N, et al. FOLFOX or CAPOX instage II to III colon cancer: Efficacy Results of the Italian Three or Six Colon Adjuvant Trial. J ClinOncol 2018;36:1478–85. https://doi.org/10.1200/JCO.2017.76.2187
52. André T, Vernerey D, Mineur L, Bennouna J, Desrame J, Faroux R, et al. Three versus 6 monthsof oxaliplatin-based adjuvant chemotherapy for patients with stage III colon cancer: disease-freesurvival results from a randomized, open-label, International Duration Evaluation of Adjuvant (IDEA)France, Phase III Trial. J Clin Oncol 2018;36:1469–77. https://doi.org/10.1200/JCO.2017.76.0355
53. Yoshino T, Yamanaka T, Oki E, Kotaka M, Manaka D, Eto T, et al. Efficacy and long-termperipheral sensory neuropathy of 3 vs 6 months of oxaliplatin-based adjuvant chemotherapy forcolon cancer: The ACHIEVE Phase 3 Randomized Clinical Trial [published online ahead of printSeptember 12 2019]. JAMA Oncol 2019. https://doi.org/10.1001/jamaoncol.2019.2572
54. Souglakos J, Boukovinas I, Kakolyris S, Xynogalos S, Ziras N, Athanasiadis A, et al. Three versussix months adjuvant FOLFOX or CAPOX for high risk stage II and stage III colon cancer patients:the efficacy results of Hellenic Oncology Research Group (HORG) participation to the InternationalDuration Evaluation of Adjuvant chemotherapy (IDEA) project [published online ahead of printJune 22 2019]. Ann Oncol 2019. https://doi.org/10.1093/annonc/mdz193
55. Grothey A, Sobrero AF, Shields AF, Yoshino T, Paul J, Taieb J, et al. Duration of adjuvantchemotherapy for stage III colon cancer. N Engl J Med 2018;378:1177–88. https://doi.org/10.1056/NEJMoa1713709
56. Hooper R. The Bayesian interpretation of a P-value depends only weakly on statistical power inrealistic situations. J Clin Epidemiol 2009;62:1242–7. https://doi.org/10.1016/j.jclinepi.2009.02.004
REFERENCES
NIHR Journals Library www.journalslibrary.nihr.ac.uk
68

Appendix 1 Baseline characteristics ofanalysis subgroups
TABLE 15 Characteristics of patients assessed with NCI CTC AE
Characteristic
Randomised treatment group
3 months of treatment 6 months of treatment
Gender, n (%)
Female 166 (38.2) 165 (38.0)
Male 268 (61.8) 269 (62.0)
Total 434 (100) 434 (100)
Age at registration
Median (years) 63 65
IQR (years) 59–69 58–70
Range (years) 27–83 20–78
Total (n) 434 434
Performance status at randomisation, n (%)
0 276 (63.6) 263 (60.6)
1 158 (36.4) 171 (39.4)
Total 434 (100.0) 434 (100.0)
Disease site, n (%)
Colon 354 (81.6) 355 (81.8)
Rectum 80 (18.4) 79 (18.2)
Total 434 (100.0) 434 (100.0)
T stage, n (%)
0 0 (0.0) 1 (0.2)
1 11 (2.5) 10 (2.3)
2 43 (9.9) 39 (9.0)
3 246 (56.7) 250 (57.6)
4 134 (30.9) 134 (30.9)
Total 434 (100.0) 434 (100.0)
N stage, n (%)
0 58 (13.4) 56 (12.9)
1 250 (57.6) 255 (58.8)
2 126 (29.0) 123 (28.3)
Total 434 (100.0) 434 (100.0)
continued
DOI: 10.3310/hta23640 HEALTH TECHNOLOGY ASSESSMENT 2019 VOL. 23 NO. 64
© Queen’s Printer and Controller of HMSO 2019. This work was produced by Iveson et al. under the terms of a commissioning contract issued by the Secretary of State for Healthand Social Care. This issue may be freely reproduced for the purposes of private research and study and extracts (or indeed, the full report) may be included in professionaljournals provided that suitable acknowledgement is made and the reproduction is not associated with any form of advertising. Applications for commercial reproduction shouldbe addressed to: NIHR Journals Library, National Institute for Health Research, Evaluation, Trials and Studies Coordinating Centre, Alpha House, University of Southampton SciencePark, Southampton SO16 7NS, UK.
69

TABLE 15 Characteristics of patients assessed with NCI CTC AE (continued )
Characteristic
Randomised treatment group
3 months of treatment 6 months of treatment
Planned treatment, n (%)
FOLFOX 155 (35.7) 158 (36.4)
CAPOX 279 (64.3) 276 (63.6)
Total 434 (100.0) 434 (100.0)
If CAPOX planned, starting dose of capecitabine, n (%)
750mg/m2 5 (27.8) 5 (22.7)
800 mg/m2 0 (0.0) 0 (0.0)
1000mg/m2 13 (72.2) 17 (77.3)
Total 18 (100.0) 22 (100.0)
High-risk stage II, n (%)
No 377 (86.9) 378 (87.1)
Yes 57 (13.1) 56 (12.9)
Total 434 (100.0) 434 (100.0)
CAPOX, oxaliplatin and capecitabine; FOLFOX, oxaliplatin and 5FU.Reproduced from Iveson et al.16 © The Author(s). Published by Elsevier Ltd. This is an Open Access article under theCC BY 4.0 license (https://creativecommons.org/licenses/by/4.0/).
TABLE 16 Characteristics of patients assessed with EQ-5D
Characteristic
Randomised treatment group
3 months of treatment 6 months of treatment
Gender, n (%)
Female 361 (39.4) 363 (39.8)
Male 555 (60.6) 549 (60.2)
Total 916 (100.0) 912 (100.0)
Age at registration
Median (years) 64 65
IQR (years) 59–70 59–70
Range (years) 24–83 20–83
Total (n) 916 912
Performance status at randomisation, n (%)
0 595 (65.0) 581 (63.7)
1 321 (35.0) 331 (36.3)
Total 916 (100.0) 912 (100.0)
APPENDIX 1
NIHR Journals Library www.journalslibrary.nihr.ac.uk
70

TABLE 16 Characteristics of patients assessed with EQ-5D (continued )
Characteristic
Randomised treatment group
3 months of treatment 6 months of treatment
Disease site, n (%)
Colon 755 (82.4) 750 (82.2)
Rectum 161 (17.6) 162 (17.8)
Total 916 (100.0) 912 (100.0)
T stage, n (%)
0 0 (0.0) 1 (0.1)
1 22 (2.4) 25 (2.7)
2 84 (9.2) 80 (8.8)
3 527 (57.5) 516 (56.6)
4 282 (30.8) 290 (31.8)
X 1 (0.1) 0 (0.0)
Total 916 (100.0) 912 (100.0)
N stage, n (%)
0 140 (15.3) 141 (15.5)
1 519 (56.7) 517 (56.7)
2 257 (28.1) 254 (27.9)
Total 916 (100.0) 912 (100.0)
Planned treatment, n (%)
FOLFOX 292 (31.9) 297 (32.6)
CAPOX 624 (68.1) 615 (67.4)
Total 916 (100.0) 912 (100.0)
If CAPOX planned, starting dose of capecitabine, n (%)
750mg/m2 84 (22.3) 83 (22.4)
800 mg/m2 18 (4.8) 18 (4.9)
1000mg/m2 274 (72.9) 270 (72.8)
Total 376 (100.0) 371 (100.0)
High-risk stage II, n (%)
No 778 (84.9) 774 (84.9)
Yes 138 (15.1) 138 (15.1)
Total 916 (100.0) 912 (100.0)
CAPOX, oxaliplatin and capecitabine; FOLFOX, oxaliplatin and 5FU.Reproduced from Iveson et al.16 © The Author(s). Published by Elsevier Ltd. This is an Open Access article under theCC BY 4.0 license (https://creativecommons.org/licenses/by/4.0/).
DOI: 10.3310/hta23640 HEALTH TECHNOLOGY ASSESSMENT 2019 VOL. 23 NO. 64
© Queen’s Printer and Controller of HMSO 2019. This work was produced by Iveson et al. under the terms of a commissioning contract issued by the Secretary of State for Healthand Social Care. This issue may be freely reproduced for the purposes of private research and study and extracts (or indeed, the full report) may be included in professionaljournals provided that suitable acknowledgement is made and the reproduction is not associated with any form of advertising. Applications for commercial reproduction shouldbe addressed to: NIHR Journals Library, National Institute for Health Research, Evaluation, Trials and Studies Coordinating Centre, Alpha House, University of Southampton SciencePark, Southampton SO16 7NS, UK.
71

TABLE 17 Characteristics of patients assessed with EORTC QLQ-C30/CR29
Characteristic
Randomised treatment group
3 months of treatment 6 months of treatment
Gender, n (%)
Female 361 (39.4) 363 (39.8)
Male 555 (60.6) 550 (60.2)
Total 916 (100.0) 913 (100.0)
Age at registration
Median (years) 64 65
IQR (years) 59–70 59–70
Range (years) 24–83 30–83
Total (n) 916 913
Performance status at randomisation, n (%)
0 595 (65.0) 582 (63.7)
1 321 (35.0) 331 (36.3)
Total 916 (100.0) 913 (100.0)
Disease site, n (%)
Colon 755 (82.4) 751 (82.3)
Rectum 161 (17.6) 162 (17.7)
Total 916 (100.0) 913 (100.0)
T stage, n (%)
0 0 (0.0) 1 (0.1)
1 22 (2.4) 25 (2.7)
2 84 (9.2) 80 (8.8)
3 527 (57.5) 517 (56.6)
4 282 (30.8) 290 (31.8)
X 1 (0.1) 0 (0.0)
Total 916 (100.0) 913 (100.0)
N stage, n (%)
0 140 (15.3) 141 (15.4)
1 519 (56.7) 518 (56.7)
2 257 (28.1) 254 (27.8)
Total 916 (100.0) 913 (100.0)
Planned treatment, n (%)
FOLFOX 292 (31.9) 297 (32.5)
CAPOX 624 (68.1) 616 (67.5)
Total 916 (100.0) 913 (100.0)
APPENDIX 1
NIHR Journals Library www.journalslibrary.nihr.ac.uk
72
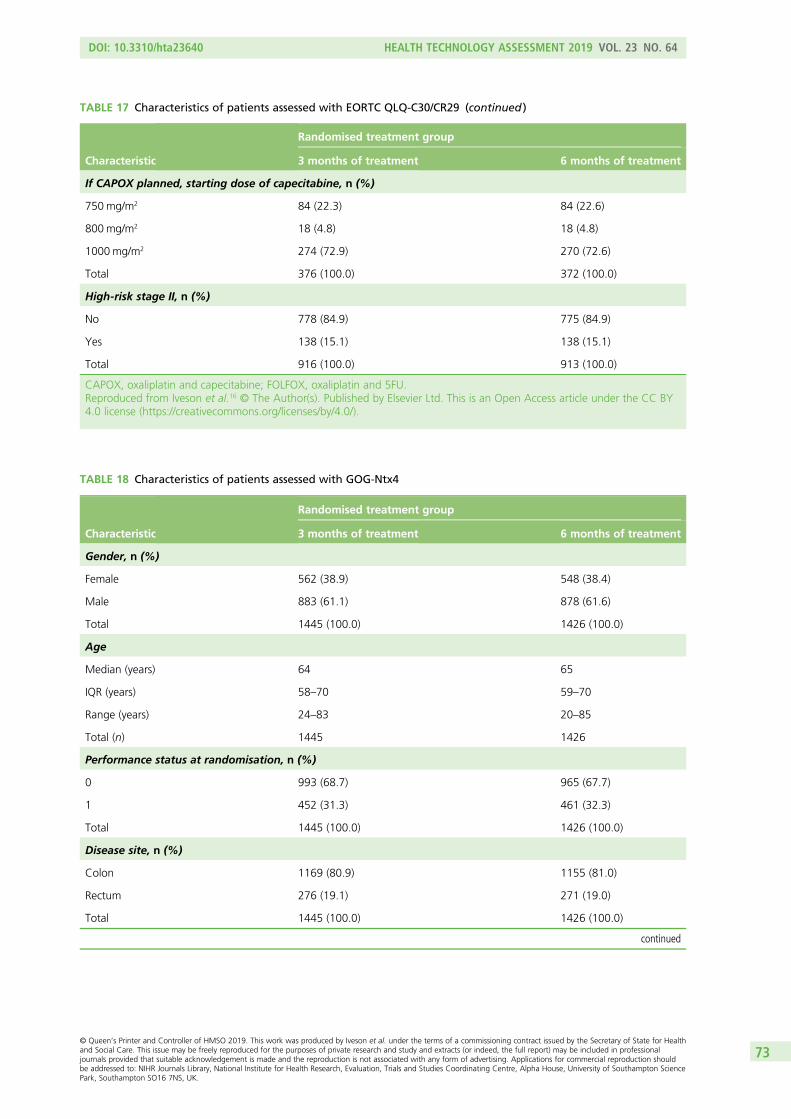
TABLE 17 Characteristics of patients assessed with EORTC QLQ-C30/CR29 (continued )
Characteristic
Randomised treatment group
3 months of treatment 6 months of treatment
If CAPOX planned, starting dose of capecitabine, n (%)
750mg/m2 84 (22.3) 84 (22.6)
800 mg/m2 18 (4.8) 18 (4.8)
1000mg/m2 274 (72.9) 270 (72.6)
Total 376 (100.0) 372 (100.0)
High-risk stage II, n (%)
No 778 (84.9) 775 (84.9)
Yes 138 (15.1) 138 (15.1)
Total 916 (100.0) 913 (100.0)
CAPOX, oxaliplatin and capecitabine; FOLFOX, oxaliplatin and 5FU.Reproduced from Iveson et al.16 © The Author(s). Published by Elsevier Ltd. This is an Open Access article under the CC BY4.0 license (https://creativecommons.org/licenses/by/4.0/).
TABLE 18 Characteristics of patients assessed with GOG-Ntx4
Characteristic
Randomised treatment group
3 months of treatment 6 months of treatment
Gender, n (%)
Female 562 (38.9) 548 (38.4)
Male 883 (61.1) 878 (61.6)
Total 1445 (100.0) 1426 (100.0)
Age
Median (years) 64 65
IQR (years) 58–70 59–70
Range (years) 24–83 20–85
Total (n) 1445 1426
Performance status at randomisation, n (%)
0 993 (68.7) 965 (67.7)
1 452 (31.3) 461 (32.3)
Total 1445 (100.0) 1426 (100.0)
Disease site, n (%)
Colon 1169 (80.9) 1155 (81.0)
Rectum 276 (19.1) 271 (19.0)
Total 1445 (100.0) 1426 (100.0)
continued
DOI: 10.3310/hta23640 HEALTH TECHNOLOGY ASSESSMENT 2019 VOL. 23 NO. 64
© Queen’s Printer and Controller of HMSO 2019. This work was produced by Iveson et al. under the terms of a commissioning contract issued by the Secretary of State for Healthand Social Care. This issue may be freely reproduced for the purposes of private research and study and extracts (or indeed, the full report) may be included in professionaljournals provided that suitable acknowledgement is made and the reproduction is not associated with any form of advertising. Applications for commercial reproduction shouldbe addressed to: NIHR Journals Library, National Institute for Health Research, Evaluation, Trials and Studies Coordinating Centre, Alpha House, University of Southampton SciencePark, Southampton SO16 7NS, UK.
73

TABLE 18 Characteristics of patients assessed with GOG-Ntx4 (continued )
Characteristic
Randomised treatment group
3 months of treatment 6 months of treatment
T stage, n (%)
0 0 (0.0) 1 (0.1)
1 35 (2.4) 42 (2.9)
2 133 (9.2) 126 (8.8)
3 831 (57.5) 806 (56.5)
4 445 (30.8) 451 (31.6)
X 1 (0.1) 0 (0.0)
Total 1445 (100.0) 1426 (100.0)
N stage, n (%)
0 232 (16.1) 230 (16.1)
1 830 (57.4) 816 (57.2)
2 383 (26.5) 380 (26.6)
Total 1445 (100.0) 1426 (100.0)
Planned treatment, n (%)
FOLFOX 467 (32.3) 458 (32.1)
CAPOX 978 (67.7) 968 (67.9)
Total 1445 (100.0) 1426 (100.0)
If CAPOX planned, starting dose of capecitabine, n (%)
750mg/m2 159 (21.8) 149 (20.6)
800 mg/m2 28 (3.8) 30 (4.1)
1000mg/m2 543 (74.4) 545 (75.3)
Total 730 (100.0) 724 (100.0)
High-risk stage II
No 1215 (84.1) 1199 (84.1)
Yes 230 (15.9) 227 (15.9)
Total 1445 (100.0) 1426 (100.0)
CAPOX, oxaliplatin and capecitabine; FOLFOX, oxaliplatin and 5FU.Reproduced from Iveson et al.16 © The Author(s). Published by Elsevier Ltd. This is an Open Access article under theCC BY 4.0 license (https://creativecommons.org/licenses/by/4.0/).
APPENDIX 1
NIHR Journals Library www.journalslibrary.nihr.ac.uk
74

Appendix 2 Reasons for missing quality of lifequestionnaires, examination of pattern of missingnessand sensitivity analysis
I t can be seen that the reasons are broadly similar between the treatment groups, the most commonreason being ‘other’. Examination of a random sample of the free text on the CRFs when the reason for
‘other’ was entered indicates that in the vast majority of cases this was an error of some sort (e.g. formwas not returned, a site error occurred, patient forgot). The high proportion of ‘not required’ for GOG-Ntx4is a result of administrative delay in implementing the amendment to extend the recording period forthe questionnaire.
TABLE 19 Reasons for missing questionnaires as recorded on study CRF
Missing questionnaires: reason
Treatment group
3 months 6 months
EORTC questionnaire, n (%)
Complete 6629 (81.4) 7420 (80.2)
Patient refused 175 (2.1) 168 (1.8)
Patient relapsed/evidence of new tumour 56 (0.7) 53 (0.6)
Patient unfit 33 (0.4) 46 (0.5)
Other 1233 (15.1) 1542 (16.7)
Not required 19 (0.2) 28 (0.3)
EQ-5D questionnaire, n (%)
Complete 8924 (76.2) 9684 (75.3)
Patient refused 256 (2.2) 273 (2.1)
Patient relapsed/evidence of new tumour 213 (1.8) 181 (1.4)
Patient unfit 73 (0.6) 89 (0.7)
Other 2204 (18.8) 2573 (20.0)
Not required 46 (0.4) 55 (0.4)
GOG-Ntx4 questionnaire, n (%)
Complete 9658 (64.4) 10,858 (65.6)
Patient refused 263 (1.8) 281 (1.7)
Patient relapsed/evidence of new tumour 190 (1.3) 187 (1.1)
Patient unfit 74 (0.5) 101 (0.6)
Other 2890 (19.3) 3255 (19.7)
Not required 1924 (12.8) 1871 (11.3)
DOI: 10.3310/hta23640 HEALTH TECHNOLOGY ASSESSMENT 2019 VOL. 23 NO. 64
© Queen’s Printer and Controller of HMSO 2019. This work was produced by Iveson et al. under the terms of a commissioning contract issued by the Secretary of State for Healthand Social Care. This issue may be freely reproduced for the purposes of private research and study and extracts (or indeed, the full report) may be included in professionaljournals provided that suitable acknowledgement is made and the reproduction is not associated with any form of advertising. Applications for commercial reproduction shouldbe addressed to: NIHR Journals Library, National Institute for Health Research, Evaluation, Trials and Studies Coordinating Centre, Alpha House, University of Southampton SciencePark, Southampton SO16 7NS, UK.
75

Table 20 shows the proportion of missing PRO questionnaires by baseline patient characteristics. It can beseen that the proportion is very similar for all baseline characteristics, with the difference in general beingvery small and never exceeding 5%.
Table 21 summarises the comparison of the three most important PRO end points at key time points. Thefirst column is taken from the imputation analysis as presented in the paper, the second column is basedon observed data and the last column is based on an imputation restricted to patients who completed abaseline questionnaire. This last analysis was carried out to ensure that the analysis set could not be influencedby a patient's subsequent experience on the study (e.g. patients who should have completed at baselinebut were missed and subsequently completed a follow-up form because they developed neurotoxicity areomitted from this analysis).
At all time points the mean differences are similar and consistent in terms of statistical significance.
TABLE 20 Missing questionnaires (yes/no) by baseline characteristics
Characteristic
EORTC missing, n (%) EQ-5D missing, n (%) GOG-Ntx4 missing, n (%)
No Yes No Yes No Yes
Gender
Female 5371 (79.8) 1362 (20.2) 7103 (74.9) 2376 (25.1) 7753 (64.4) 4286 (35.6)
Male 8678 (81.3) 1991 (18.7) 11,505 (76.2) 3587 (23.8) 12,763 (65.4) 6750 (34.6)
Age group (years)
≤ 50 1326 (81.3) 304 (18.7) 1715 (75.1) 570 (24.9) 1940 (65.4) 1026 (34.6)
≤ 70 9529 (80.9) 2250 (19.1) 12,666 (76.2) 3958 (23.8) 13,961 (65.0) 7503 (35.0)
> 70 3194 (80.0) 799 (20.0) 4227 (74.7) 1435 (25.3) 4615 (64.8) 2507 (35.2)
Performance status
0 9259 (80.6) 2222 (19.4) 12,190 (75.4) 3980 (24.6) 14,112 (65.4) 7451 (34.6)
1 4790 (80.9) 1131 (19.1) 6418 (76.4) 1983 (23.6) 6404 (64.1) 3585 (35.9)
T-stage
X/0/1 406 (77.3) 119 (22.7) 536 (74.5) 183 (25.5) 583 (63.9) 330 (36.1)
2 1278 (81.2) 296 (18.8) 1710 (76.8) 518 (23.2) 1888 (65.6) 991 (34.4)
3 8082 (81.7) 1811 (18.3) 10,783 (76.8) 3250 (23.2) 11,866 (65.7) 6200 (34.3)
4 4283 (79.2) 1127 (20.8) 5579 (73.5) 2012 (26.5) 6179 (63.7) 3515 (36.3)
N-stage
0 2121 (82.5) 451 (17.5) 3072 (77.2) 908 (22.8) 3566 (66.3) 1810 (33.7)
1 8004 (81.1) 1863 (18.9) 10,514 (76.2) 3287 (23.8) 11,724 (65.5) 6172 (34.5)
2 3924 (79.1) 1039 (20.9) 5022 (74.0) 1768 (26.0) 5226 (63.1) 3054 (36.9)
Treatment
FOLFOX 5479 (82.1) 1197 (17.9) 6935 (76.8) 2090 (23.2) 7897 (67.7) 3765 (32.3)
CAPOX 8570 (79.9) 2156 (20.1) 11,673 (75.1) 3873 (24.9) 12,619 (63.4) 7271 (36.6)
CAPOX, oxaliplatin and capecitabine; FOLFOX, oxaliplatin and 5FU.
APPENDIX 2
NIHR Journals Library www.journalslibrary.nihr.ac.uk
76

TABLE 21 Sensitivity analysis of PRO results
DifferenceImputed (as in manuscript),mean (SE)
Observed data only,mean (SE)
Imputed (restricted topatients who completedbaseline questionnaire),mean (SE)
GOG-Ntx4 questionnaire
Differencea at 6 months –1.99 (0.17)b –2.31 (0.35)b –2.16 (0.28)b
Difference at 12 months –2.48 (0.15)b –2.54 (0.23)b –2.30 (0.20)b
Difference at 5 years –2.07 (0.33)b –1.90 (0.42)b –1.90 (0.34)b
EORTC-QLQ-C30 global quality of life
Difference at 6 months 11.58 (1.00)b 12.00 (1.41)b 12.72 (1.82)b
Difference at 12 months 1.48 (0.85)c 1.57 (0.99)c 1.22 (0.86)c
EQ-5D Visual Analogue Scale
Difference at 6 months 9.80 (1.04)b 7.05 (1.52)b 7.36 (0.90)b
Difference at 12 months 1.45 (0.88)c 1.68 (0.96)c 1.31 (1.00)c
a Difference at 3–6 months.b p < 0.001.c p > 0.05.
DOI: 10.3310/hta23640 HEALTH TECHNOLOGY ASSESSMENT 2019 VOL. 23 NO. 64
© Queen’s Printer and Controller of HMSO 2019. This work was produced by Iveson et al. under the terms of a commissioning contract issued by the Secretary of State for Healthand Social Care. This issue may be freely reproduced for the purposes of private research and study and extracts (or indeed, the full report) may be included in professionaljournals provided that suitable acknowledgement is made and the reproduction is not associated with any form of advertising. Applications for commercial reproduction shouldbe addressed to: NIHR Journals Library, National Institute for Health Research, Evaluation, Trials and Studies Coordinating Centre, Alpha House, University of Southampton SciencePark, Southampton SO16 7NS, UK.
77


Appendix 3 Short Course Oncology Therapy siterecruitment and principal investigators
Site name Principal investigator(s) Total recruitment (n)
Beatson West of Scotland Cancer Centre Professor Jim Cassidy 141
Dr Ashita Waterson
Royal United Hospital Bath Dr Gareth Rees 111
Dr Louise Medley
Dr Emma De Winton
Addenbrookes Hospital Dr Charles Wilson 97
Royal Cornwall Hospital Dr Richard Ellis 94
Royal Surrey County Hospital Dr Gary Middleton 93
Dr Sharadah Essapen
Castle Hill Hospital Dr Amandeep Dhadda 91
Mount Vernon Hospital Dr Rob Hughes 89
Bristol Oncology Centre Dr Stephen Falk 85
Queen’s Hospital Dr Sherif Raouf 83
Southampton General Hospital Dr Timothy Iveson 81
Western General Hospital Dr Lesley Dawson 80
Christie Hospital NHS Trust Dr Mark Saunders 77
Salisbury District Hospital Dr Timothy Iveson 77
Dr Alaaeldin Shablak
Velindre NHS Trust Hospital Dr Alison Brewster 76
St Bartholomews Hospital Dr David Propper 74
Queen Alexandra Hospital Dr Ann O’Callaghan 73
Sjællands Universites Hospital, Næstved Dr Neils Henrik Holländer 70
Princess Alexandra Hospital Dr John Bridgewater 69
Royal Marsden Hospital (Sutton) Professor David Cunningham 67
Leicester Royal Infirmary Professor Will Steward 59
Professor Anne Thomas
Worcester Royal Hospital Dr David Farrugia 59
Dr Mark Churn
Singleton Hospital Professor John Wagstaff 57
Birmingham Heartlands Hospital Dr Ian Geh 55
Dr Shobhit Baijal
Maidstone and Tunbridge Wells NHS Trust Dr Mark Hill 55
Royal Shrewsbury Hospitals NHS Trust Dr Saif Awwad 54
Dr Abel Zachariah
DOI: 10.3310/hta23640 HEALTH TECHNOLOGY ASSESSMENT 2019 VOL. 23 NO. 64
© Queen’s Printer and Controller of HMSO 2019. This work was produced by Iveson et al. under the terms of a commissioning contract issued by the Secretary of State for Healthand Social Care. This issue may be freely reproduced for the purposes of private research and study and extracts (or indeed, the full report) may be included in professionaljournals provided that suitable acknowledgement is made and the reproduction is not associated with any form of advertising. Applications for commercial reproduction shouldbe addressed to: NIHR Journals Library, National Institute for Health Research, Evaluation, Trials and Studies Coordinating Centre, Alpha House, University of Southampton SciencePark, Southampton SO16 7NS, UK.
79

Site name Principal investigator(s) Total recruitment (n)
Northampton General Hospital NHS Trust Dr Kinnari Patel 53
Dr Craig Macmillan
Dr Roshan Agarwal
Russells Hall Hospital Professor David Ferry 51
Dr Simon Grumett
Lincoln County Hospital Dr Tom Sheehan 50
Dr Zuzana Stokes
Fife Health Board Dr Catriona Mclean 48
King Edward VII Hospital Dr Marcia Hall 48
Dr Maher Hadaki
Royal Hampshire County Hospital Dr Virginia Hall 48
Dr Sanjay Raj
Dr David Nolan
Sunderland Royal Hospital Dr Ashraf Azzabi 48
West Suffolk Hospital Dr Anne Margaret Moody 48
Hammersmith Hospital Dr Charles Lowdell 47
Churchill Hospital Dr Andrew Weaver 46
Aarhus University Hospital Dr René Krøjgaard Olesen 45
Yeovil District Hospital Dr Stephen Falk 43
Dr Julie Walther
Dr Erica Beaumont
Dr Matthew Sephton
Kettering General Hospital Dr Craig Macmillan 42
Dr Guy Faust
Dr Roshan Agarwal
Crosshouse Hospital Dr Jeffery White 41
Musgrove Park Hospital Dr Julie Walther 41
Dr Clare Barlow
Worthing Hospital Dr Andrew Webb 41
Hinchingbrooke Hospital Dr Cheryl Palmer 40
Great Western Hospital Dr Claire Hobbs 39
Dr Sarah Lowndes
Hospital Universitari Vall D Hebron Dr Elena Elez Meelez 39
Monklands District General Hospital Dr Ashita Waterston 39
Dr Clinton Ali
Dr Anne Mckillop
Wycombe Hospital Dr Andrew Weaver 39
Aalborg Hospital Dr Jorgen Hansen 38
Dr Mette Yilmaz
APPENDIX 3
NIHR Journals Library www.journalslibrary.nihr.ac.uk
80

Site name Principal investigator(s) Total recruitment (n)
Ipswich Hospital Dr Rubin Soomal 38
Dr Liz Sherwin
Pilgrim Hospital Dr Tom Sheehan 38
Dr Zuzana Stokes
Raigmore Hospital Dr David Whillis 38
Dr Neil Mcphail
St James’s University Hospital Dr Daniel Swinson 38
Stepping Hill Hospital Dr Jurjees Hasan 38
Weston Park Hospital NHS Trust Dr Simon Pledge 38
Withybush General Hospital Dr Vallipuram Vigneswaran 38
Belfast City Hospital Dr Richard Wilson 37
Glan Clwyd Hospital Dr Simon Gollins 37
Guy’s and St Thomas’ NHS Trust Dr Nicholas Maisey 37
Poole Hospital NHS Trust Dr Tamas Hickish 37
Dr Amelie Harle
Royal Bournemouth Hospital Dr Tamas Hickish 37
Wrexham Maelor Hospital Dr Simon Gollins 37
Hillerød Hospital Dr Svend Erik Nielsen 36
Queen Elizabeth Hospital – King’s Lynn Dr Athar Ahmad 36
Dr Gail Horan
St George’s Hospital Dr Fiona Lofts 36
University College London Hospital Dr John Bridgewater 36
York Hospital Dr Kim Last 36
Nottingham University Hospital NHS Trust Dr Eric Bessell 35
Dr Vanessa Potter
Dr Georgina Walker
Royal Berkshire Hospital Dr James Gildersleve 35
Wexham Park Hospital Dr Marcia Hall 35
Dr Maher Hadaki
South Tyneside District Hospital Dr Shraf Azzabi 34
Broomfield Hospital Professor Saad Tahir 33
Dr Gopalakrishnan Srinivasan
Eastbourne District General Dr Fiona Mckinna 33
ICO L’Hospitalet Dr Ramon Salazar 33
Dr Gemma Soler
Torbay Hospital Dr Nangi Lo 33
Conquest Hospital Dr Timothy Sevitt 32
DOI: 10.3310/hta23640 HEALTH TECHNOLOGY ASSESSMENT 2019 VOL. 23 NO. 64
© Queen’s Printer and Controller of HMSO 2019. This work was produced by Iveson et al. under the terms of a commissioning contract issued by the Secretary of State for Healthand Social Care. This issue may be freely reproduced for the purposes of private research and study and extracts (or indeed, the full report) may be included in professionaljournals provided that suitable acknowledgement is made and the reproduction is not associated with any form of advertising. Applications for commercial reproduction shouldbe addressed to: NIHR Journals Library, National Institute for Health Research, Evaluation, Trials and Studies Coordinating Centre, Alpha House, University of Southampton SciencePark, Southampton SO16 7NS, UK.
81
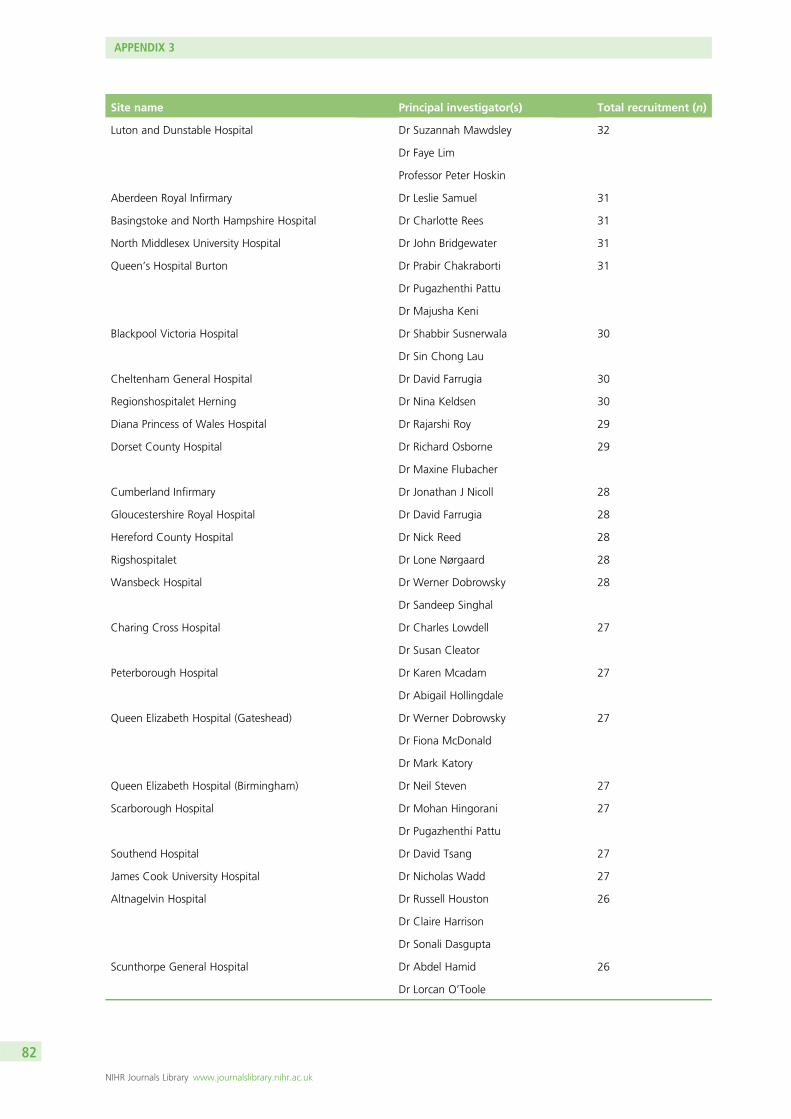
Site name Principal investigator(s) Total recruitment (n)
Luton and Dunstable Hospital Dr Suzannah Mawdsley 32
Dr Faye Lim
Professor Peter Hoskin
Aberdeen Royal Infirmary Dr Leslie Samuel 31
Basingstoke and North Hampshire Hospital Dr Charlotte Rees 31
North Middlesex University Hospital Dr John Bridgewater 31
Queen’s Hospital Burton Dr Prabir Chakraborti 31
Dr Pugazhenthi Pattu
Dr Majusha Keni
Blackpool Victoria Hospital Dr Shabbir Susnerwala 30
Dr Sin Chong Lau
Cheltenham General Hospital Dr David Farrugia 30
Regionshospitalet Herning Dr Nina Keldsen 30
Diana Princess of Wales Hospital Dr Rajarshi Roy 29
Dorset County Hospital Dr Richard Osborne 29
Dr Maxine Flubacher
Cumberland Infirmary Dr Jonathan J Nicoll 28
Gloucestershire Royal Hospital Dr David Farrugia 28
Hereford County Hospital Dr Nick Reed 28
Rigshospitalet Dr Lone Nørgaard 28
Wansbeck Hospital Dr Werner Dobrowsky 28
Dr Sandeep Singhal
Charing Cross Hospital Dr Charles Lowdell 27
Dr Susan Cleator
Peterborough Hospital Dr Karen Mcadam 27
Dr Abigail Hollingdale
Queen Elizabeth Hospital (Gateshead) Dr Werner Dobrowsky 27
Dr Fiona McDonald
Dr Mark Katory
Queen Elizabeth Hospital (Birmingham) Dr Neil Steven 27
Scarborough Hospital Dr Mohan Hingorani 27
Dr Pugazhenthi Pattu
Southend Hospital Dr David Tsang 27
James Cook University Hospital Dr Nicholas Wadd 27
Altnagelvin Hospital Dr Russell Houston 26
Dr Claire Harrison
Dr Sonali Dasgupta
Scunthorpe General Hospital Dr Abdel Hamid 26
Dr Lorcan O’Toole
APPENDIX 3
NIHR Journals Library www.journalslibrary.nihr.ac.uk
82

Site name Principal investigator(s) Total recruitment (n)
Good Hope Hospital Dr John Glaholm 25
Dr Shobhit Baijal
Royal Sussex County Hospital Dr Andrew Webb 25
Hospital Donostia Dr Adelaida-Lacasta Munoa 24
New Cross Hospital Dr Mark Churn 24
Dr Simon Grummet
University Hospital of North Staffordshire Dr Fawzi Adab 24
Countess of Chester Hospital Dr Adrian Moss 23
Dr Shaker Abdallah
Dr Dale Vimalachandran
University Hospital of Lewisham Professor George Mikhael 23
Dr Jessica Brady
Royal Derby Hospital Dr Rajendra Kulkarni 23
Medway Maritime Hospital Dr Jeff Summers 22
Dr Christos Mikropoulos
Royal Preston Hospital Dr Shabbir Susnerwala 22
Dr Deborah Williamson
University Hospital of North Durham Dr Fareeda Coxon 22
Complejo Hospitalario Universitario de Santiago Dr Rafael Lopez 21
Forth Valley Royal Hospital Dr Ghazia Shaikh 21
Dr Saranya Kakumanu
Dr Stephen Harrow
Dr Adnan Shaukat
Dr Aisha Tufail
Dr Dawn Storey
Kent and Canterbury Hospital Professor Roger James 21
Dr Julia Hall
Dr Rakesh Raman
Basildon Hospital Dr David Tsang 20
Clatterbridge Centre for Oncology Dr David Smith 20
Dr Julie O’Hagan
Freeman Hospital Dr Fareeda Coxon 20
Stoke Mandeville Hospital Dr Andrew Weaver 20
Darlington Memorial Hospital Dr Fareeda Coxon 19
Harrogate District Hospital Dr Kim Last 19
Hospital Del Mar Dr Joaquim Bellmunt 19
Queen Elizabeth Hospital (London) Dr Nicholas Maisey 19
Dr Asad Qureshi
Royal Marsden Hospital (London) Professor David Cunningham 19
DOI: 10.3310/hta23640 HEALTH TECHNOLOGY ASSESSMENT 2019 VOL. 23 NO. 64
© Queen’s Printer and Controller of HMSO 2019. This work was produced by Iveson et al. under the terms of a commissioning contract issued by the Secretary of State for Healthand Social Care. This issue may be freely reproduced for the purposes of private research and study and extracts (or indeed, the full report) may be included in professionaljournals provided that suitable acknowledgement is made and the reproduction is not associated with any form of advertising. Applications for commercial reproduction shouldbe addressed to: NIHR Journals Library, National Institute for Health Research, Evaluation, Trials and Studies Coordinating Centre, Alpha House, University of Southampton SciencePark, Southampton SO16 7NS, UK.
83

Site name Principal investigator(s) Total recruitment (n)
Sjællands Universites Hospital, Roskilde Dr Jim Stenfatt Larsen 19
St Helens and Knowsley NHS Trust Dr Ernest Marshall 19
Karolinska University Hospital Dr Gisela Naucler 18
Dr Jan-Erik Frödin
Lister Hospital Dr Rob Hughes 18
St Mary’s Hospital (Low) Dr Christopher Baughan 18
Dr Harish Reddy
Glangwili General Hospital Dr Margaret Wilkins 18
Dr Thi Mau-Don Phan
William Harvey Hospital Professor Roger James 18
Dr Julia Hall
Bronglais General Hospital Dr Alan Axford 17
Dr Sajid Durrani
Dr Elin Jones
Darent Valley Hospital Dr Andrew Gaya 17
Dr Hazif Al Gurafi
Dr Riyaz Nazeerul Haq Shah
Hairmyres Hospital Dr Grainne Dunn 17
Kidderminster Hospital Dr Mark Churn 17
The Royal Oldham Hospital Dr Saifee Mullamitha 17
Ayr Hospital Dr Jeffery White 16
Craigavon Area Hospital Dr Richard Park 16
Esbjerg Hospital Dr Brita Bjerregaard 16
King’s Mill Hospital Dr Ivo Hennig 16
Dr Eleanor James
Dr Eliot Chadwick
Dr Christina Lopezesccola
Warrington and Halton Hospitals NHS Trust Dr Adrian Moss 16
Dr Amy Ford
Herlev Hospital Dr Kirsten Vistisen 15
Hospital Arnau De Villanova Lleida Dr Antonia Salud 15
Macclesfield District General Hospital Dr Catherine Mcbain 15
Dr Ganesh Radhakrishna
Bradford Royal Infirmary Dr Chris Bradley 14
Dr Andrew Conn
North West London Hospitals NHS Trust Dr Nicola Anyamene 14
Royal Free Hospital Dr Astrid Mayer 14
Sønderborg Hospital Dr Jurij Bogovic 14
University Hospital of North Tees Dr David Wilson 14
APPENDIX 3
NIHR Journals Library www.journalslibrary.nihr.ac.uk
84

Site name Principal investigator(s) Total recruitment (n)
Bendigo Hospital Dr Robert Blum 13
Bishop Auckland General Hospital Dr Nick Wadd 13
Dr Fareeda Coxon
Central Hospital Vasteras Dr Henry Letocha 13
Dr Andrzej Piwowar
City Hospital Trust Dr Daniel Rea 13
Dr Pankaj Punia
Manor Hospital Dr Andrew Hartley 13
Dr Victoria Kunene
Royal Hobart Hospital Dr Ray Lowenthal 13
Dr David Boadle
Royal Albert Edward Infirmary Dr Gregory Wilson 13
Dr Elena Takeuchi
Dr Francisca Elena Marti
Weston General Hospital Dr Marjorie Tomlinson 13
Dr Reuben West
Austin Hospital Dr Niall Tebbutt 12
Bankstown – Lidcombe Hospital Dr Ray Asghari 12
Nambour General Hospital Dr Michelle Cronk 12
Queen Elizabeth The Queen Mother Hospital Professor Roger James 12
Dr Julia Hall
Bedford Hospital NHS Trust Professor Robert Thomas 11
Hospital Universitario De Canarias Dr Marta Llanos 11
Hospital Clinico Universitario De Valencia Dr Andres Cervantes 11
Royal Marsden Hospital (Kingston) Dr David Cunningham 11
Uppsala University Hospital Dr Bengt Glimelius 11
West Cumberland Hospital Dr Jonathan J Nicoll 11
West Middlesex University Hospitals Dr Pippa Riddle 11
Hospital Clinic I Provincial De Barcelona Dr Cristina Nadal 10
Dr Estela Pineda
North Devon District Hospital Dr Mark Napier 10
Sandwell General Hospital Dr Daniel Rea 10
Dr Pankaj Punia
Southport and Formby District General Hospital Dr Arthur Sun Myint 10
Dr Nasim Ali
St Mary’s Hospital London Dr Susan Cleator 10
The Tweed Hospital Professor Ehtesham Abdi 10
Ysbyty Gwynedd Hospital Dr Nick Stuart 10
Dr Catherine Bale
DOI: 10.3310/hta23640 HEALTH TECHNOLOGY ASSESSMENT 2019 VOL. 23 NO. 64
© Queen’s Printer and Controller of HMSO 2019. This work was produced by Iveson et al. under the terms of a commissioning contract issued by the Secretary of State for Healthand Social Care. This issue may be freely reproduced for the purposes of private research and study and extracts (or indeed, the full report) may be included in professionaljournals provided that suitable acknowledgement is made and the reproduction is not associated with any form of advertising. Applications for commercial reproduction shouldbe addressed to: NIHR Journals Library, National Institute for Health Research, Evaluation, Trials and Studies Coordinating Centre, Alpha House, University of Southampton SciencePark, Southampton SO16 7NS, UK.
85

Site name Principal investigator(s) Total recruitment (n)
Ballarat Hospital Dr Geoff Chong 9
Canberra Hospital Professor Desmond Yip 9
Centrallasarettet Vaxjo Dr Eva Fernebro 9
Dr Ulrika Palenius
Complejo Hospitalario Universitario De Albacete Dr Carmen Alonso Lopez 9
Hospital Universitario Marques De Valdecilla Dr Fernando Rivera-Herrero 9
St John of God Hospital Bunbury Dr Martin Buck 9
Airedale General Hospital Dr Andrew Conn 8
Aintree University Hospitals Dr David Smith 8
Dr Julie Hagan
Alfred Hospital Dr Andrew Haydon 8
Auckland Hospital Dr George Laking 8
Concord Repatriation General Hospital Professor Philip Beale 8
Flinders Medical Centre Dr Chris Karapetis 8
Hospital Universitario Madrid Norte Sanchinarro Dr Antonio Cubillo 8
North Tyneside General Hospital Dr Philip Atherton 8
Royal Devon and Exeter Hospital Dr Melanie Osborne 8
Dr Mark Napier
County Hospital Ryhov Dr Helga Hagman 7
Hospital La Fe Dr Jorge Aparicio 7
Hospital Virgen De La Arrixaca Dr Miguel Marin Vera 7
Inverclyde Royal Hospital Dr Stephen Harrow 7
Dr Dawn Storey
Royal Lancaster Infirmary Dr David Fyfe 7
Dr David Eaton
Royal Brisbane and Women’s Hospital Dr Matthew Burge 7
Whittington Hospital Dr Daniel Hochhauser 7
Dr Pauline Leonard
University Hospital of Hartlepool Dr David Wilson 7
University Hospital Linköping Dr Maria Albertsson 7
Cabrini Hospital Dr Andrew Haydon 6
Calderdale and Huddersfield NHS Foundation Trust Dr Jo Dent 6
Dumfries and Galloway Royal Infirmary Dr Lesley Dawson 6
Hospital Miguel Servet Dr Antonio Anton 6
Hospital De Txagorritxu Dr Severina Dominguez 6
Leighton Hospital Dr Chan Ton 6
Dr Michael Braun
APPENDIX 3
NIHR Journals Library www.journalslibrary.nihr.ac.uk
86

Site name Principal investigator(s) Total recruitment (n)
Milton Keynes General Hospital Dr Jill Stewart 6
Dr Gerard Andrade
Dr Somnath Mukherjee
Prince of Wales Hospital Professor David Goldstein 6
Queen Elizabeth Hospital (Australia) Professor Tim Price 6
Royal North Shore Hospital Dr Alex Guminski 6
Associate Professor Nick Pavlakis
St Vincent’s Hospital Dr Eva Segelov 6
Essex County Hospital Dr Bruce Sizer 5
Falu Hospital Dr Ake Berglund 5
Pinderfields General Hospital Dr Gireesh Kumaran 5
Dr Konstantinos Kamposioras
Campbelltown Hospital Dr Lorraine Chantrill 4
Christchurch Hospital Dr Mark Jeffery 4
Furness General Hospital Dr Alison Birtle 4
Dr David Eaton
Illawarra Cancer Centre (Wollongong Hospital) Dr Morteza Aghmesheh 4
Kalmar County Hospital Dr Charlotte Bratthall 4
Nevil Hall Hospital Dr Nayyer Iqbal 4
Dr Mohammed Harb
Dr Keith Yinn
Nepean Cancer Care Centre Dr Jenny Shannon 4
Norrlands University Hospital Dr Birgitta Lindh 4
Princess Alexandra Hospital (Australia) Dr Warren Joubert 4
Royal Darwin Hospital Dr Narayan Karanth 4
St John of God Hospital Subiaco Dr Siobhan Ng 4
Dr Tom Van Hagen
Tamworth Base Hospital Dr Mathew George 4
Antrim Area Hospital Dr Colin Purcell 3
St Richard’s Hospital Dr Suhail Baluch 3
Dr Ann O’Callaghan
Dr Yasser Haba
Wellington Hospital Dr Anne O’Donnell 3
Ballarat Oncology and Haematology Services Dr George Kannourakis 2
Coffs Harbour Health Campus Dr Karen Briscoe 2
Gosford Hospital Dr Susan Tiley 2
Hallands Hospital Dr Lotta Lundgren 2
Royal Perth Hospital Dr David Ransom 2
University Hospital of Skåne Dr Margareta Heby 2
DOI: 10.3310/hta23640 HEALTH TECHNOLOGY ASSESSMENT 2019 VOL. 23 NO. 64
© Queen’s Printer and Controller of HMSO 2019. This work was produced by Iveson et al. under the terms of a commissioning contract issued by the Secretary of State for Healthand Social Care. This issue may be freely reproduced for the purposes of private research and study and extracts (or indeed, the full report) may be included in professionaljournals provided that suitable acknowledgement is made and the reproduction is not associated with any form of advertising. Applications for commercial reproduction shouldbe addressed to: NIHR Journals Library, National Institute for Health Research, Evaluation, Trials and Studies Coordinating Centre, Alpha House, University of Southampton SciencePark, Southampton SO16 7NS, UK.
87

Site name Principal investigator(s) Total recruitment (n)
Armidale Hospital Associate Professor Nick Pavlakis 1
Dunedin Hospital Dr Chris Jackson 1
Hospital De Cruces Dr Guillermo Lopez Vivanco 1
ICO Del Hospital Josep Trueta Dr Bernardo Queralt 1
Royal Liverpool University Hospital Dr David Smith 1
Sundsvall Härnösand County Hospital Dr Petra Flygare 1
APPENDIX 3
NIHR Journals Library www.journalslibrary.nihr.ac.uk
88


EMEHS&DRHTAPGfARPHRPart of the NIHR Journals Librarywww.journalslibrary.nihr.ac.uk
This report presents independent research funded by the National Institute for Health Research (NIHR). The views expressed are those of the author(s) and not necessarily those of the NHS, the NIHR or the Department of Health and Social Care
Published by the NIHR Journals Library