3-MONTH REPORT 2018€¦ · the gross margin developed slightly positively. It increased to 50.6 %...
10
3-MONTH REPORT 2018
Transcript of 3-MONTH REPORT 2018€¦ · the gross margin developed slightly positively. It increased to 50.6 %...
3-MONTH REPORT 2018

43
GROUP KEY FIGURES JANUARY - MARCH 2016/2017/2018
Key Figures
in € m* OI 2016 QI 2017 QI 2018Changes to
previous year
Sales revenues 22.4 36.3 44.9 24 %
Incoming orders 23.5 60.4 46.1 -24 %
Gross results 11.0 18.0 22.7 26 %
Gross profit margin 49.1 % 49.6 % 50.6 % 1.0 Pp.
Full costs for research and development 3.4 4.0 4.5 13 %
Research and development ratio 15.2 % 11.0 % 10.0 % -1.0 Pp.
EBITDA 4.0 10.0 14.0 40 %
EBIT 2.4 8.0 10.8 35 %
EBT 2.2 7.9 10.8 37 %
Net income 1.6 5.7 8.1 42 %
Weighted average number of shares 3,241,363 3,226,407 3,209,620 -1 %
Result per share (€) 0.51 1.78 2.52 42 %
Cash flow from operating activities 0.8 4.2 -1.1 -126 %
Cash flow from investing activities -2 -2.5 -3.1 24 %
Free Cash flow -1.2 1.7 -4.2 -347 %
in € m* 12/31/2016 12/31/2017 03/31/2018Changes to
previous year
Total assets 90.4 117.7 124.8 6 %
Long-term assets 43.9 45.9 46.4 1 %
Equity 50 65.6 73.7 12 %
Liabilities 40.4 52.1 51.1 -2 %
Equity ratio 55.3 % 55.7 % 59.1 % 3.4 Pp.
Net cash 8.8 25.0 20.0 -20 %
Working Capital 18.6 19.8 32.3 63 %
Number of employees for the fiscal year (full time equivalents) 457 504 552 10 %
Share price (XETRA) in € 60.37 195.05 173.00 -11 %
Number of shares in circulation 3,215,247 3,211,136 3,211,136 0 %
Market capitalization 194.1 626.3 555.5 -11 %
*unless otherwise stated
THREE-MONTH REPORT 2018: ¼ Incoming orders: Euro 46.1 million (previous year: Euro 60.4 million, -24 %)
¼ Sales: Euro 44.9 million (previous year: Euro 36.3 million, +24 %)
¼ EBIT: Euro 10.8 million (previous year: Euro 8.0 million, +35 %)
¼ EBT: Euro 10.8 million (previous year: Euro 7.9 million, +37 %)
¼Operating cash flow: Euro -1.1 million (previous year: Euro 4.2 million, -126 %)
¼ Cash flow from investing activities: Euro -3.1 million (previous year: Euro -2.5 million, +24 %)
¼ Free cash flow: Euro -4.2 million (previous year: Euro 1.7 million, -347 %)
Dear Ladies and Gentlemen,
In an as expected more quiet market environment than last year, Basler group had a very positive start into the first three months of the new fiscal year 2018. A good level of incoming orders and strong sales led to a further expansion of the market position as well as to very high profitability.
As foreseen, last year’s extraordinarily strong momentum of the capital goods markets for the electronics industry was not repeated. Moreover, the successfully implemented measures for a capacity expansion led to a high delivery capacity and subsequently to a balanced ratio between incoming orders and sales. In total, incoming orders were on a good level, however, clearly below the previous year’s.
BUSINESS DEVELOPMENTFor the first two months of 2018, the VDMA (Verband Deutscher Maschinen- und Anlagenbau, German Engineering Federation) reported a sales growth amounting to 6 % for the German manufacturers of image processing components. According to the VDMA (Verband Deutscher Maschinen- und Anlagenbau, German Engineering Federation) incoming orders in the industry reduced by 5 % in the same period.
In comparison to the market, in the first three months of 2018, the Basler group’s sales increased by 24 % and thus again gained market shares
Product Launches
In the first quarter, Basler launched a camera series onto the market which was especially developed for the medical & life sciences sector. The so-called Basler MED ace series offers high performance CMOS sensor technology providing up to 164 pictures per second and up to 20 megapixel resolution. Unique features address special demands in the capital goods markets for medical and life sciences. Additionally, Basler’s new DIN EN ISO 13485:2016 certification offers customers a conformity with the internally accepted quality standard of the medical industry.
5 6
-24 %Order entry to previous year
Keyfact
+24 %Sales revenues to previous year
Keyfact
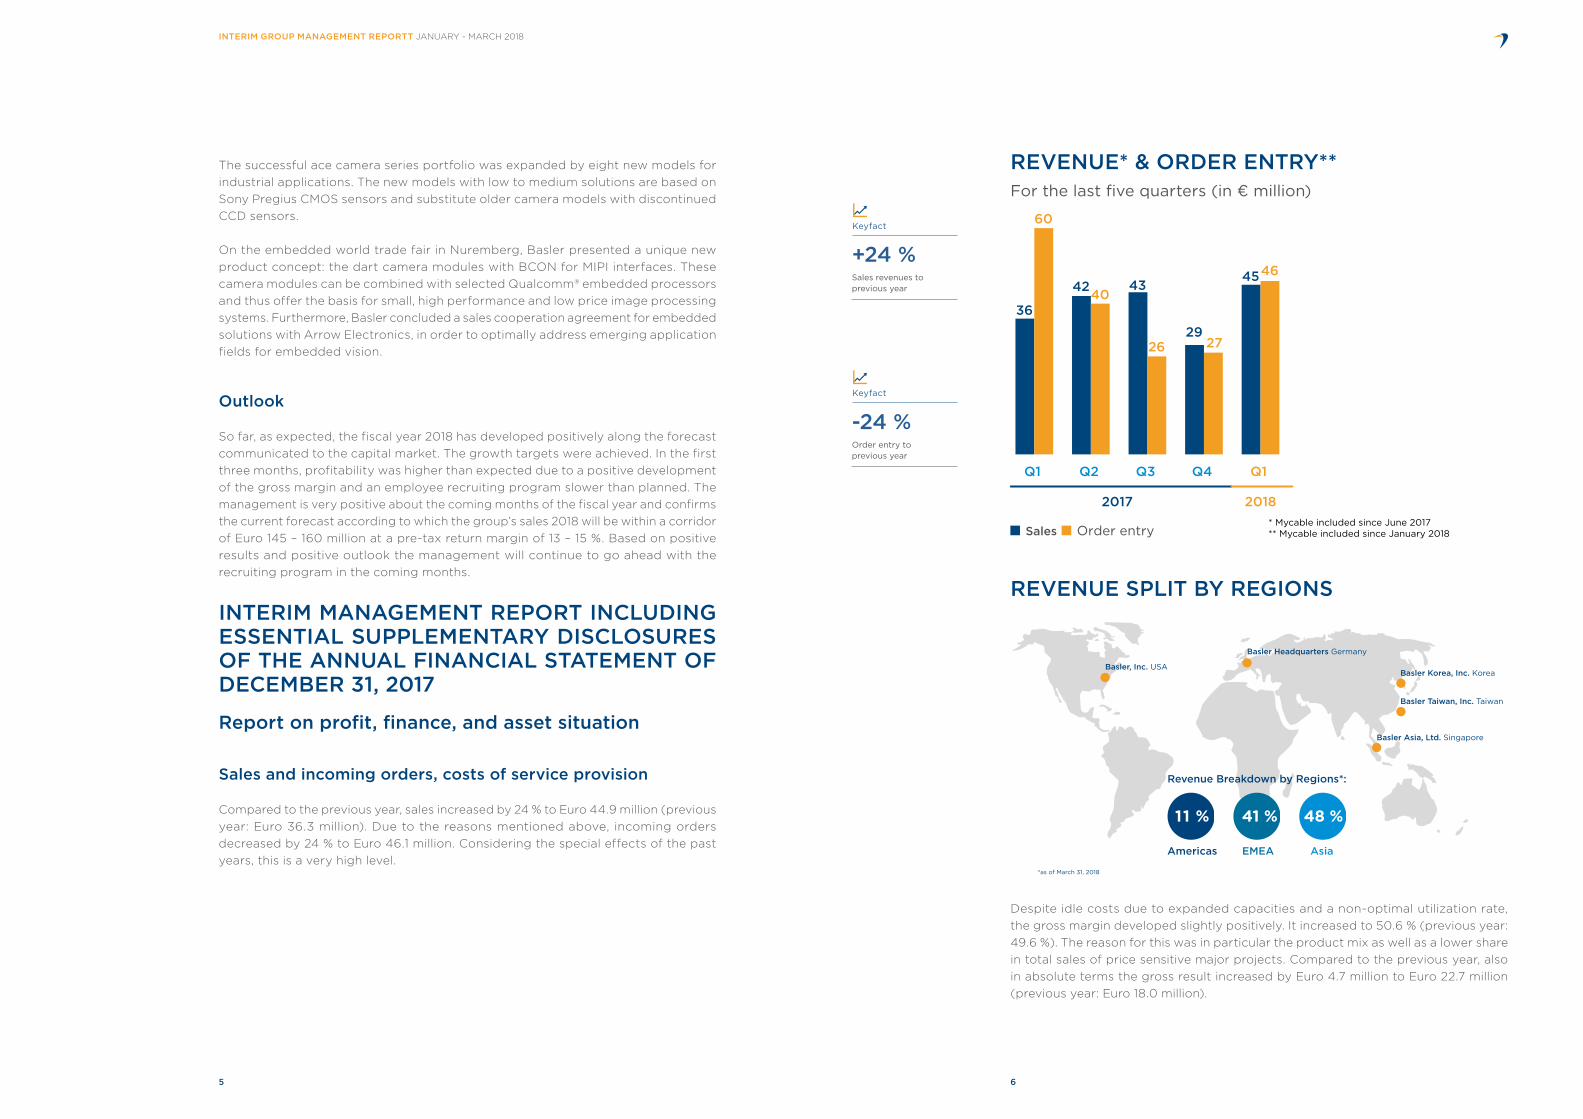
REVENUE* & ORDER ENTRY**For the last five quarters (in € million)
Sales Order entry
2017 2018
Q1 Q2 Q3 Q4 Q1
36
60
424043
2629
27
4546
* Mycable included since June 2017** Mycable included since January 2018
REVENUE SPLIT BY REGIONS
Basler Headquarters Germany
Basler, Inc. USABasler Korea, Inc. Korea
Basler Taiwan, Inc. Taiwan
Basler Asia, Ltd. Singapore
Revenue Breakdown by Regions*:
*as of March 31, 2018
AsiaEMEAAmericas
11 % 41 % 48 %
Despite idle costs due to expanded capacities and a non-optimal utilization rate, the gross margin developed slightly positively. It increased to 50.6 % (previous year: 49.6 %). The reason for this was in particular the product mix as well as a lower share in total sales of price sensitive major projects. Compared to the previous year, also in absolute terms the gross result increased by Euro 4.7 million to Euro 22.7 million (previous year: Euro 18.0 million).
INTERIM GROUP MANAGEMENT REPORTT JANUARY - MARCH 2018
The successful ace camera series portfolio was expanded by eight new models for industrial applications. The new models with low to medium solutions are based on Sony Pregius CMOS sensors and substitute older camera models with discontinued CCD sensors.
On the embedded world trade fair in Nuremberg, Basler presented a unique new product concept: the dart camera modules with BCON for MIPI interfaces. These camera modules can be combined with selected Qualcomm® embedded processors and thus offer the basis for small, high performance and low price image processing systems. Furthermore, Basler concluded a sales cooperation agreement for embedded solutions with Arrow Electronics, in order to optimally address emerging application fields for embedded vision.
Outlook
So far, as expected, the fiscal year 2018 has developed positively along the forecast communicated to the capital market. The growth targets were achieved. In the first three months, profitability was higher than expected due to a positive development of the gross margin and an employee recruiting program slower than planned. The management is very positive about the coming months of the fiscal year and confirms the current forecast according to which the group’s sales 2018 will be within a corridor of Euro 145 – 160 million at a pre-tax return margin of 13 – 15 %. Based on positive results and positive outlook the management will continue to go ahead with the recruiting program in the coming months.
INTERIM MANAGEMENT REPORT INCLUDING ESSENTIAL SUPPLEMENTARY DISCLOSURES OF THE ANNUAL FINANCIAL STATEMENT OF DECEMBER 31, 2017
Report on profit, finance, and asset situation
Sales and incoming orders, costs of service provision
Compared to the previous year, sales increased by 24 % to Euro 44.9 million (previous year: Euro 36.3 million). Due to the reasons mentioned above, incoming orders decreased by 24 % to Euro 46.1 million. Considering the special effects of the past years, this is a very high level.
7 8
At the end of the first quarter 2018, two capitalized developments were found to be no longer valid. They were written-off in an amount of Euro 400 thousand.
Equity amounted to Euro 73.7 million (Dec. 31, 2017: Euro 65.6 million), thus the equity ratio was 59.1 % on March 31, 2018, compared to 55.7 % on December 31, 2017.
Cash flow The operating cash flow amounted to Euro -1.1 million (previous year: Euro 4.2 million). The main reason for this relatively weak operating cash flow is the increase in receivables. The significant increase in sales at the beginning of the year led to an increase in receivables by approximately Euro 11.5 million. The cash flow from investing activities nearly increased in line with sales by 24 % to Euro -3.1 million (previous year: Euro -2.5 million).
In total, the free cash flow achieved a level of Euro -4.2 million (previous year: Euro 1.7 million).
Thus, liquid assets decreased to Euro 31.0 million on the reporting period closing date. The net cash position amounted to Euro 20.0 million on the reporting date (Dec. 31, 2017: Euro 25.0 million).
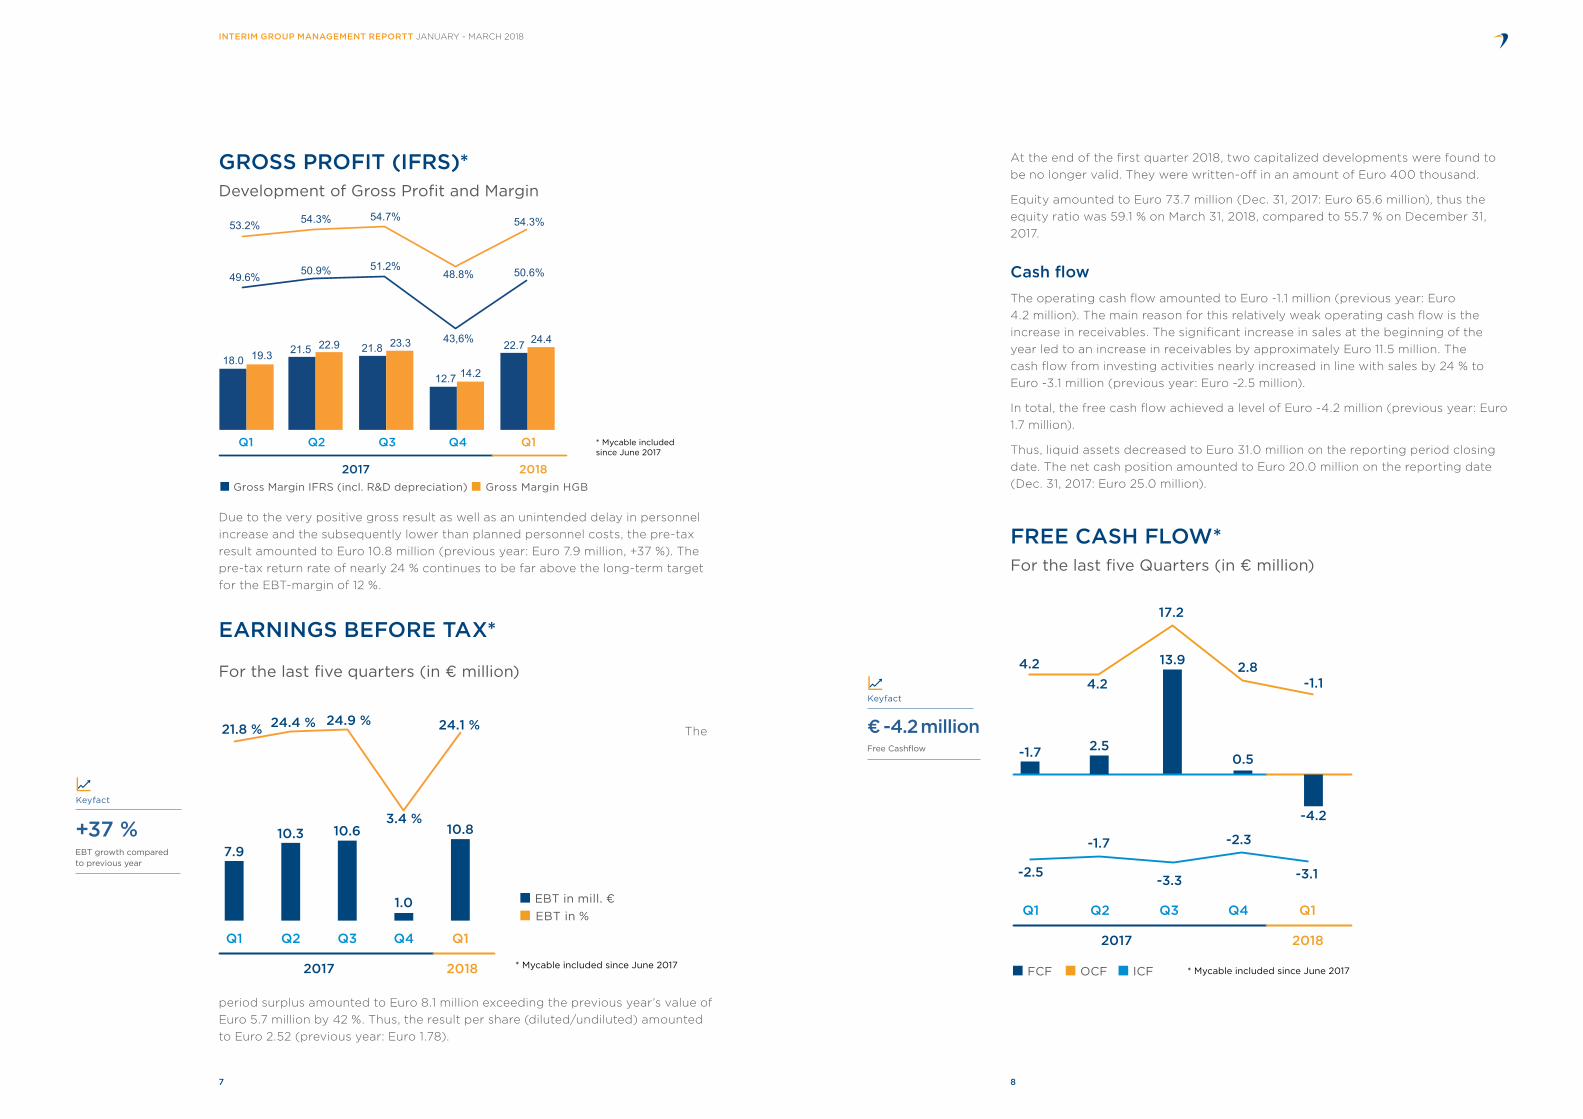
FREE CASH FLOW*For the last five Quarters (in € million)
2.84.2
17.2
-1.1
-2.5
-1.7
-3.3
-2.3
-3.1
4.2
2017 2018
Q1 Q2
-1.7
Q3
0.5
Q4
13.9
Q1
-4.2
2.5
FCF OCF ICF * Mycable included since June 2017
GROSS PROFIT (IFRS)*Development of Gross Profit and Margin
Gross Margin IFRS (incl. R&D depreciation) Gross Margin HGB
Q1
2017 2018
Q1 Q2 Q3 Q4
49.6%
18.0 19.3 21.5 21.8 23.3
12.7 14.2
22.7 24.422.9
50.9% 51.2%
43,6%
50.6%
53.2% 54.3% 54.7%
48.8%
54.3%
* Mycable includedsince June 2017
Due to the very positive gross result as well as an unintended delay in personnel increase and the subsequently lower than planned personnel costs, the pre-tax result amounted to Euro 10.8 million (previous year: Euro 7.9 million, +37 %). The pre-tax return rate of nearly 24 % continues to be far above the long-term target for the EBT-margin of 12 %.
EARNINGS BEFORE TAX*
For the last five quarters (in € million)
EBT in mill. € EBT in %
24.1 %
3.4 %
24.9 %24.4 %
2017 2018
Q1
7.9
Q2
10.3
Q3
10.6
Q4
1.0
Q1
10.8
21.8 %
* Mycable included since June 2017
The
period surplus amounted to Euro 8.1 million exceeding the previous year’s value of Euro 5.7 million by 42 %. Thus, the result per share (diluted/undiluted) amounted to Euro 2.52 (previous year: Euro 1.78).
INTERIM GROUP MANAGEMENT REPORTT JANUARY - MARCH 2018
€ -4.2 million Free Cashflow
Keyfact
+37 %EBT growth compared to previous year
Keyfact
9 10
€ 195.00Opening price 01/02/2018
Keyfact
€ 173.00Closing price 03/31/2018
Keyfact
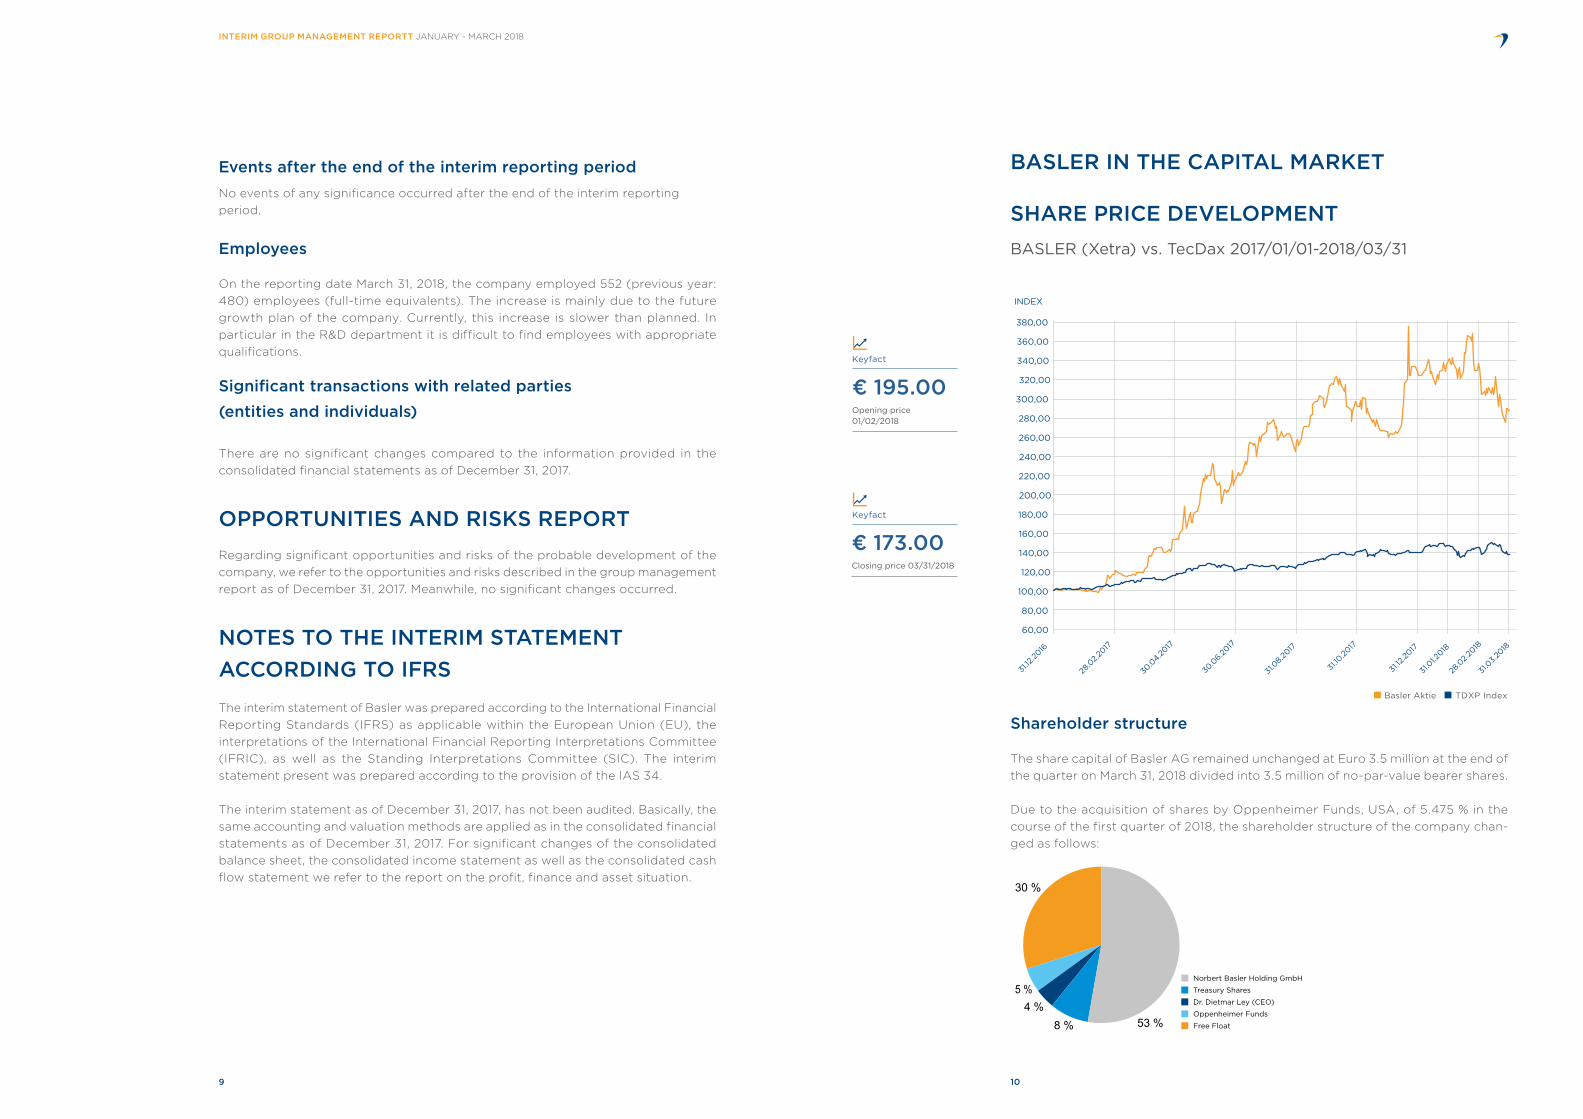
BASLER IN THE CAPITAL MARKET
SHARE PRICE DEVELOPMENTBASLER (Xetra) vs. TecDax 2017/01/01-2018/03/31
INDEX
30.0
4.2017
28.0
2.2017
30.0
6.2017
31.12
.2016
60,00
80,00
100,00
120,00
140,00
160,00
180,00
200,00
220,00
240,00
260,00
280,00
300,00
320,00
340,00
360,00
380,00
31.12
.2017
31.0
1.2018
28.0
2.2018
31.0
3.2018
31.10
.2017
31.0
8.2017
Basler Aktie TDXP Index
Shareholder structure
The share capital of Basler AG remained unchanged at Euro 3.5 million at the end of the quarter on March 31, 2018 divided into 3.5 million of no-par-value bearer shares.
Due to the acquisition of shares by Oppenheimer Funds, USA, of 5.475 % in the course of the first quarter of 2018, the shareholder structure of the company chan-ged as follows:
53 %8 %4 %
5 %
30 %
Treasury Shares
Norbert Basler Holding GmbH
Dr. Dietmar Ley (CEO)
Oppenheimer Funds
Free Float
Events after the end of the interim reporting periodNo events of any significance occurred after the end of the interim reporting period.
Employees
On the reporting date March 31, 2018, the company employed 552 (previous year: 480) employees (full-time equivalents). The increase is mainly due to the future growth plan of the company. Currently, this increase is slower than planned. In particular in the R&D department it is difficult to find employees with appropriate qualifications.
Significant transactions with related parties (entities and individuals)
There are no significant changes compared to the information provided in the consolidated financial statements as of December 31, 2017.
OPPORTUNITIES AND RISKS REPORTRegarding significant opportunities and risks of the probable development of the company, we refer to the opportunities and risks described in the group management report as of December 31, 2017. Meanwhile, no significant changes occurred.
NOTES TO THE INTERIM STATEMENT ACCORDING TO IFRS
The interim statement of Basler was prepared according to the International Financial Reporting Standards (IFRS) as applicable within the European Union (EU), the interpretations of the International Financial Reporting Interpretations Committee (IFRIC), as well as the Standing Interpretations Committee (SIC). The interim statement present was prepared according to the provision of the IAS 34.
The interim statement as of December 31, 2017, has not been audited. Basically, the same accounting and valuation methods are applied as in the consolidated financial statements as of December 31, 2017. For significant changes of the consolidated balance sheet, the consolidated income statement as well as the consolidated cash flow statement we refer to the report on the profit, finance and asset situation.
INTERIM GROUP MANAGEMENT REPORTT JANUARY - MARCH 2018

11 12
The general meeting of June 04, 2014, authorized the company to buy back own shares amounting to a total of up to 10 % of the share capital of the corporation existing at the time the resolution was adopted. The authorization is valid until June 03, 2019. The shares can be used for all purposes provided for in the authorization of the general meeting of June 04, 2014. When acquiring own shares via the stock exchange, the price paid per share (without considering incidental purchase costs) must not differ by more than 10 % from the share price of the company for shares with same conditions as determined on the trading day by the opening auction for XETRA trade on the Frankfurt/Main stock exchange.
GERMAN CORPORATE GOVERNANCE CODEThe current declaration of the management board and the supervisory board pursuant to § 161 of the German Stock Corporation Act (AktG) regarding the German Corporate Governance Code was made continually available to the shareholders on the company’s website at www.baslerweb.com/Investoren/Corporate-Governance. On April 17, 2018, an intra-annual supplement was made to item 5.4.1 also available on mentioned above website.
DECLARATION OF THE LEGAL REPRESENTATIVESWe affirm to the best of our knowledge that the interim consolidated financial state-ments, in accordance with the accounting principles applicable to interim reporting, provide a true and fair view of the group‘s asset, financial, and earnings situation and that the group‘s interim management report represents a true and fair picture of the course of business, including the operating result, and the group‘s financial situation as well as describing the essential opportunities and risks concomitant with the expected development of the group during the remainder of the fiscal year.
The management board
Dr. Dietmar Ley John P. Jennings Arndt Bake Hardy MehlCEO CCO CMO CFO/COO
Shareholder structure
12/31/2017 Number of shares
03/31/2018 Number of shares
Supervisory BoardNorbert Basler - -Prof. Dr. Eckart Kottkamp - -Horst W. Garbrecht - -Prof. Dr. Mirja Steinkamp - -Management BoardDr. Dietmar Ley 125,794 125,794John P. Jennings 5,500 4,500Arndt Bake 700 700Hardy Mehl 800 1,000
General meeting
On May 7, 2018, the annual general meeting of Basler AG will take place in Hamburg. The agenda for the general meeting was published in the Federal Gazette on March 28, 2018 and is since then accessible on Basler AG’s website together with all other documents of the general meeting. One of the items on the agenda is the distribution of the dividend. For fiscal year 2017, the supervisory board and the management board will propose to the general meeting to distribute a dividend amounting to Euro 2.02 per share. For 3.2 million dividend bearing shares the sum to be distributed amounts to Euro 6.5 million (previous year: Euro 2.4 million). Thus, the distribution ration for fiscal year 2017 corresponds to the company’s dividend policy to distribute 30 % of the net profit.
Pursuant to Section 1, no. 1, sent. 1 of the One-Third-Participation Act (Drittel-beteiligungsgesetz), employees of a stock corporation have a right of participation in the supervisory board if the company generally employs more than 500 employees. The company has exceeded the threshold at the beginning of the year. On February 28, 2018, Mrs. Dorothea Brandes and Mr. Dr. Marco Grimm were elected by the employees as employee representatives to the supervisory board. The term of office of both representatives starts with the day of the general meeting on May 7, 2018.
Because of this innovation a complete new election of ordinary members of the supervisory board is required at this year’s general meeting.
Share buyback program
The management board and the supervisory board of Basler AG decided on April 21, 2016, to buy back additional own shares. In February 2017, the company ultimately bought back non-par bearer shares on the capital market and currently holds 8.3 % (288,864 pieces) own shares.
INTERIM GROUP MANAGEMENT REPORTT JANUARY - MARCH 2018
13 14
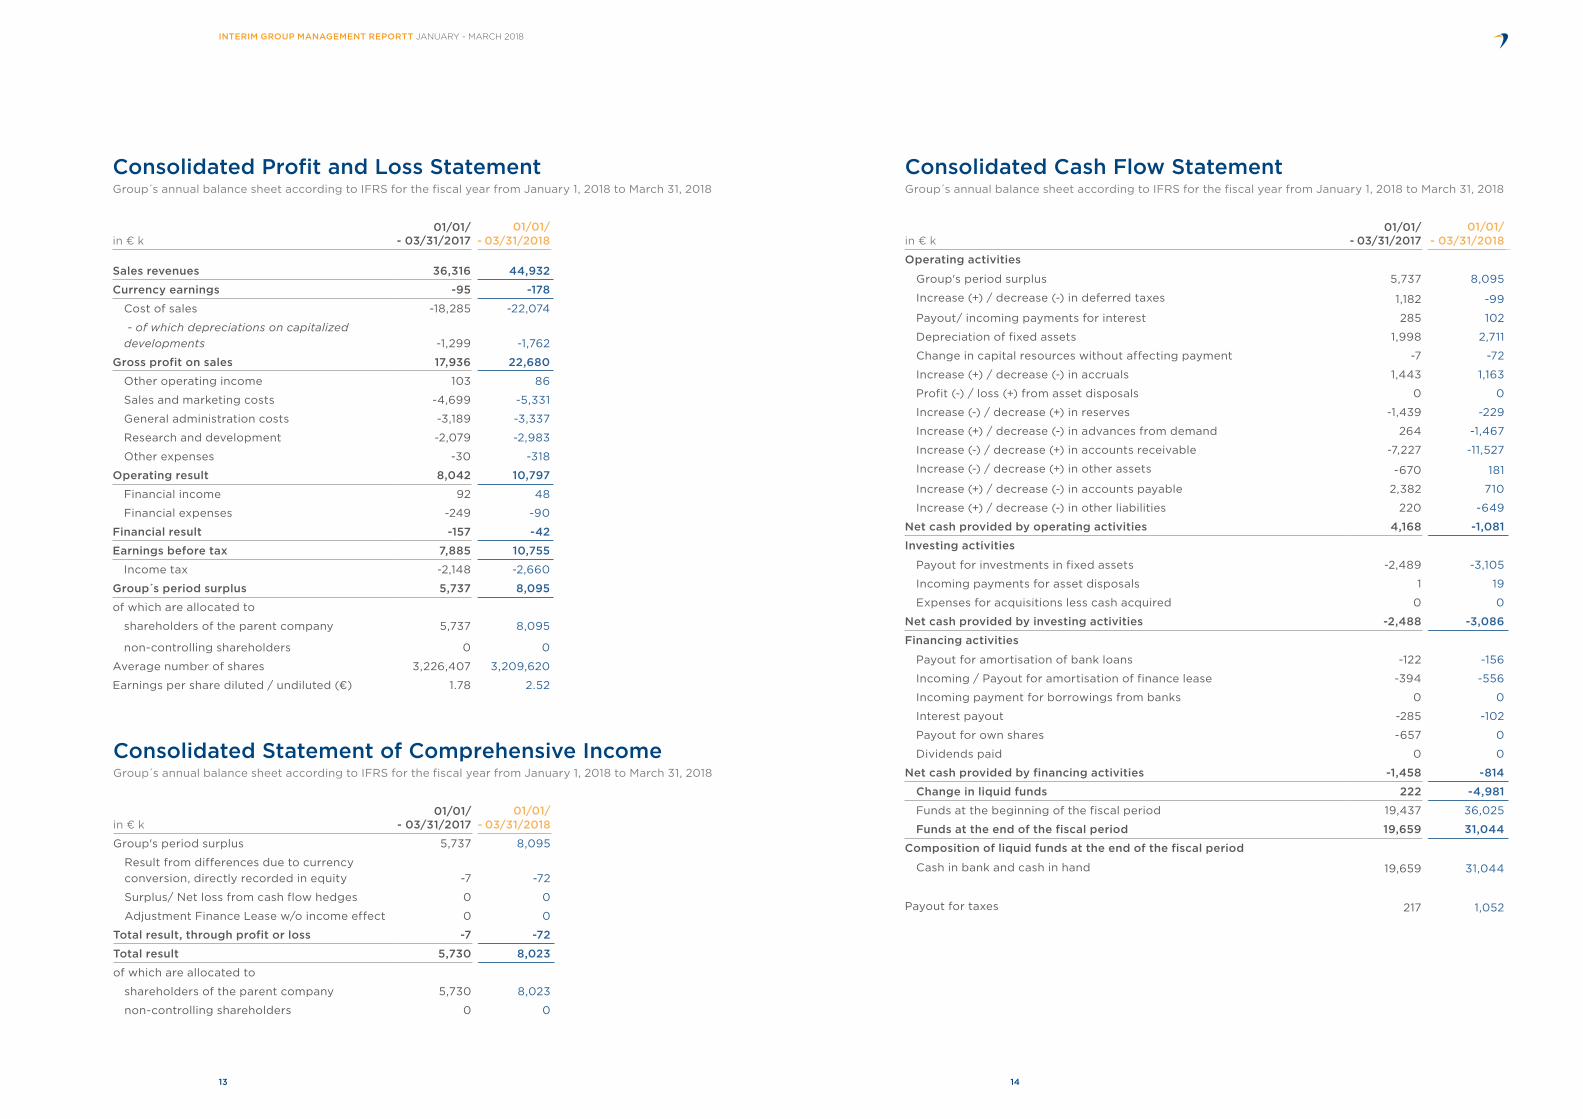
Consolidated Profit and Loss Statement Group s annual balance sheet according to IFRS for the fiscal year from January 1, 2018 to March 31, 2018
in € k01/01/
- 03/31/201701/01/
- 03/31/2018
Sales revenues 36,316 44,932
Currency earnings -95 -178
Cost of sales -18,285 -22,074
- of which depreciations on capitalized developments -1,299 -1,762
Gross profit on sales 17,936 22,680
Other operating income 103 86
Sales and marketing costs -4,699 -5,331
General administration costs -3,189 -3,337
Research and development -2,079 -2,983
Other expenses -30 -318
Operating result 8,042 10,797
Financial income 92 48
Financial expenses -249 -90
Financial result -157 -42
Earnings before tax 7,885 10,755
Income tax -2,148 -2,660
Group s period surplus 5,737 8,095
of which are allocated to
shareholders of the parent company 5,737 8,095
non-controlling shareholders 0 0
Average number of shares 3,226,407 3,209,620
Earnings per share diluted / undiluted (€) 1.78 2.52
Consolidated Statement of Comprehensive IncomeGroup s annual balance sheet according to IFRS for the fiscal year from January 1, 2018 to March 31, 2018
in € k01/01/
- 03/31/201701/01/
- 03/31/2018
Group's period surplus 5,737 8,095
Result from differences due to currency conversion, directly recorded in equity -7 -72
Surplus/ Net loss from cash flow hedges 0 0
Adjustment Finance Lease w/o income effect 0 0
Total result, through profit or loss -7 -72
Total result 5,730 8,023
of which are allocated to
shareholders of the parent company 5,730 8,023
non-controlling shareholders 0 0
INTERIM GROUP MANAGEMENT REPORTT JANUARY - MARCH 2018
Consolidated Cash Flow StatementGroup s annual balance sheet according to IFRS for the fiscal year from January 1, 2018 to March 31, 2018
in € k01/01/
- 03/31/201701/01/
- 03/31/2018
Operating activities
Group's period surplus 5,737 8,095
Increase (+) / decrease (-) in deferred taxes 1,182 -99
Payout/ incoming payments for interest 285 102
Depreciation of fixed assets 1,998 2,711
Change in capital resources without affecting payment -7 -72
Increase (+) / decrease (-) in accruals 1,443 1,163
Profit (-) / loss (+) from asset disposals 0 0
Increase (-) / decrease (+) in reserves -1,439 -229
Increase (+) / decrease (-) in advances from demand 264 -1,467
Increase (-) / decrease (+) in accounts receivable -7,227 -11,527
Increase (-) / decrease (+) in other assets -670 181
Increase (+) / decrease (-) in accounts payable 2,382 710
Increase (+) / decrease (-) in other liabilities 220 -649
Net cash provided by operating activities 4,168 -1,081
Investing activities
Payout for investments in fixed assets -2,489 -3,105
Incoming payments for asset disposals 1 19
Expenses for acquisitions less cash acquired 0 0
Net cash provided by investing activities -2,488 -3,086
Financing activities
Payout for amortisation of bank loans -122 -156
Incoming / Payout for amortisation of finance lease -394 -556
Incoming payment for borrowings from banks 0 0
Interest payout -285 -102
Payout for own shares -657 0
Dividends paid 0 0
Net cash provided by financing activities -1,458 -814
Change in liquid funds 222 -4,981
Funds at the beginning of the fiscal period 19,437 36,025
Funds at the end of the fiscal period 19,659 31,044
Composition of liquid funds at the end of the fiscal period
Cash in bank and cash in hand 19,659 31,044
Payout for taxes 217 1,052
15 16
INTERIM GROUP MANAGEMENT REPORTT JANUARY - MARCH 2018
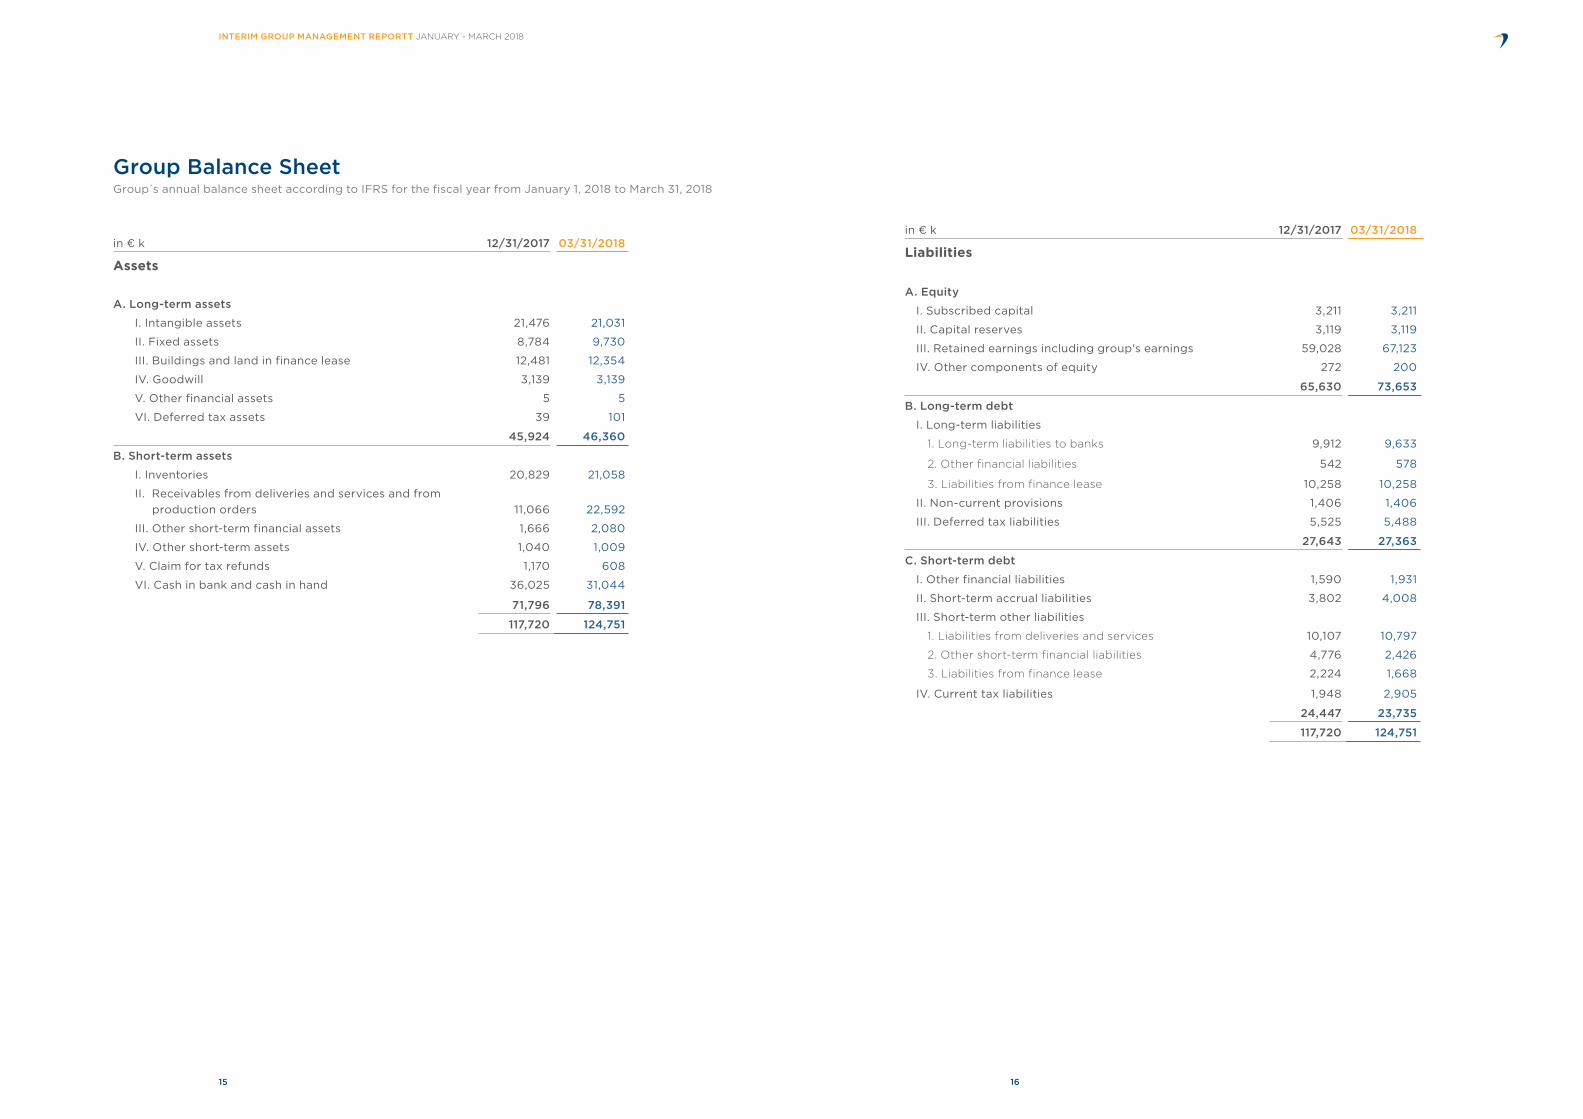
in € k 12/31/2017 03/31/2018
Liabilities
A. Equity
I. Subscribed capital 3,211 3,211
II. Capital reserves 3,119 3,119
III. Retained earnings including group's earnings 59,028 67,123
IV. Other components of equity 272 200
65,630 73,653
B. Long-term debt
I. Long-term liabilities
1. Long-term liabilities to banks 9,912 9,633
2. Other financial liabilities 542 578
3. Liabilities from finance lease 10,258 10,258
II. Non-current provisions 1,406 1,406
III. Deferred tax liabilities 5,525 5,488
27,643 27,363
C. Short-term debt
I. Other financial liabilities 1,590 1,931
II. Short-term accrual liabilities 3,802 4,008
III. Short-term other liabilities
1. Liabilities from deliveries and services 10,107 10,797
2. Other short-term financial liabilities 4,776 2,426
3. Liabilities from finance lease 2,224 1,668
IV. Current tax liabilities 1,948 2,905
24,447 23,735
117,720 124,751
Group Balance SheetGroup s annual balance sheet according to IFRS for the fiscal year from January 1, 2018 to March 31, 2018
in € k 12/31/2017 03/31/2018
Assets
A. Long-term assets
I. Intangible assets 21,476 21,031
II. Fixed assets 8,784 9,730
III. Buildings and land in finance lease 12,481 12,354
IV. Goodwill 3,139 3,139
V. Other financial assets 5 5
VI. Deferred tax assets 39 101
45,924 46,360
B. Short-term assets
I. Inventories 20,829 21,058
II. Receivables from deliveries and services and from production orders 11,066 22,592
III. Other short-term financial assets 1,666 2,080
IV. Other short-term assets 1,040 1,009
V. Claim for tax refunds 1,170 608
VI. Cash in bank and cash in hand 36,025 31,044
71,796 78,391
117,720 124,751

17 18
INTERIM GROUP MANAGEMENT REPORTT JANUARY - MARCH 2018
Consolidated Statement of Changes in EquityGroup s annual balance sheet according to IFRS for the fiscal year from January 1, 2018 to March 31, 2018
Other components of equity
in € k
Sub-scribed capital
Capital reserve
Retained earnings
incl. group's earnings
Differen-ces due to currency
conversion
Reserves for cash
flow hedges
Sum of other components of
equity Total
Shareholders´ equity as of 01/01/2017 3,215 2,443 43,648 710 0 710 50,016
Total result 5,737 -7 -7 5,730
Share salesback 0 0
Share buyback -10 -647 -657
Shareholders´ equity as of 03/31/2017 3,205 2,443 48,738 703 0 703 55,089
Total result 676 11,837 -431 -431 12,082
Share salesback 831 831
Share buyback 6 -7 -1
Dividend outpayment* -2,371 -2,371
Shareholders´ equity as of 12/31/2017 3,211 3,119 59,028 272 0 272 65,630
Total result 8,095 -72 -72 8,023
Share salesback 0
Share buyback 0
Shareholders´ equity as of 03/31/2018 3,211 3,119 67,123 200 0 200 73,653
* 0,74 € per share
EVENTS 2018IR-Events
Date Event Venue
05/07/2018 Shareholders‘ meeting 2018 Hamburg, Germany
08/13/2018 Publication 6-month report 2018 Ahrensburg, Germany
11/05/2018 Publication 9-month report 2018 Ahrensburg, Germany
11/26 - 28/2018Deutsches Eigenkapitalforum 2018(Germany equity forum)
Frankfurt am Main, Germany
BASLER AG An der Strusbek 60-62 22926 Ahrensburg Germany Tel. +49 4102 463 0 Fax +49 4102 463 109 [email protected]
baslerweb.com
BASLER, INC. 855 Springdale Drive, Suite 203 Exton, PA 19341 USA Tel. +1 610 280 0171 Fax +1 610 280 7608 [email protected]
BASLER ASIA PTE. LTD. 35 Marsiling Industrial Estate Road 3 #05-06 Singapore 739257 Tel. +65 6367 1355 Fax +65 6367 1255 [email protected]
BASLER VISION TECHNOLOGIES TAIWAN INC. No. 21, Sianjheng 8th St. Jhubei City, Hsinchu County 30268 Taiwan/R.O.C. Tel. +886 3 558 3955 Fax +886 3 558 3956 [email protected]