3 May 2011 Asia Equities Daily Focus Periodicalimg.jrjimg.cn/2011/05/20110504152417139.pdf · 3 May...
44
Asia Pan-Asia Strategy 3 May 2011 Asia Equities Daily Focus Today's research headlines Asian Edition Deutsche Bank AG/Hong Kong All prices are those current at the end of the previous trading session unless otherwise indicated. Prices are sourced from local exchanges via Reuters, Bloomberg and other vendors. Data is sourced from Deutsche Bank and subject companies. Deutsche Bank does and seeks to do business with companies covered in its research reports. Thus, investors should be aware that the firm may have a conflict of interest that could affect the objectivity of this report. Investors should consider this report as only a single factor in making their investment decision. DISCLOSURES AND ANALYST CERTIFICATIONS ARE LOCATED IN APPENDIX 1. MICA(P) 007/05/2010 Periodical Asian Index Closings EQUITIES Close 1D Chg %Chg SHSZ300 3192.72 0.98 2.06 HSCEI 13208.71 -0.84 4.07 HSI 23720.81 -0.36 2.98 TWSE 9007.87 -0.36 0.39 KOSPI 2228.96 1.67 8.68 FSSTI 3179.86 -0.16 -0.32 KLCI 1534.95 -0.02 1.06 SENSEX 18998.02 -0.72 -7.37 NIFTY 5701.30 -0.84 -7.06 SET 1093.56 0.11 5.89 JCI 3849.30 0.78 3.94 PCOMP 4326.76 0.17 2.99 ASX200 4825.30 0.04 1.69 FOREX (vs US$) Close 1D Chg YTD %Chg Rmb 6.49 -0.01 1.76 HK$ 7.77 0.01 0.09 NT$ 28.57 0.15 2.57 Won 1065.23 0.59 5.70 S$ 1.22 0.21 5.04 M$ 2.96 -0.07 3.39 Rupee 44.34 -0.26 0.83 Baht 29.90 -0.07 0.54 Rupiah 8543.00 0.23 5.30 Peso 42.62 0.28 2.78 A$ 1.10 -0.14 7.07 Source: Bloomberg Finance LP Latest Commodity Prices COMMODITIES Close 1D %Chg YTD %Chg West Texas 113.70 -0.20 24.43 Brent 124.88 -0.63 32.43 CRB 368.17 -0.65 10.63 Copper 418.25 0.41 -5.79 Gold (Spot) 1554.28 -0.60 9.40 Alum. (LME) 2767.50 0.86 12.05 Baltic Dry 1269.00 0.79 -28.43 Source: Bloomberg Finance LP DB CORPORATE ACCESS DB Access Asia Conference 2011 - Singapore 5/23 - 26 DB Access Taiwan Conference 2011 - Taipei 11/7 - 8 DB Access Korea Conference 2011 - Seoul 11/10 - 11 DB Access Indonesia Conference 2011 - Jakarta 11/29 - 12/1 Research Team Carissa Szeto Equity Focus (+852) 2203 6171 [email protected] Ching-Li Teo, CFA Equity Focus (+852) 2203 6206 [email protected] Company Global Markets Research Nodita_ TOP STORIES Digital China (0861.HK),HKD14.86 Buy Price Target HKD19.00 A re-rating story; Initiating with Buy Lorraine Kuo Page 7 China Macro Strategy Update Positive macro outlook intact Jun Ma Page 8 ESTIMATE & TARGET PRICE CHANGES Esprit Holdings Ltd (0330.HK),HKD32.30 Buy Price Target HKD49.30 Cutting target price on weak wholesale; maintaining Buy Anne Ling Page 9 Lianhua Supermarket (0980.HK),HKD31.60 Hold Price Target HKD32.70 Investing in food safety system for future growth; Hold Anne Ling Page 10 Taiwan Cement (1101.TW),TWD41.95 Buy Price Target TWD45.00 Growth momentum continues; raising price target to NT$45 Yvonne Tsai Page 11 HDS (069960.KS),KRW166,500. 00 Buy Price Target KRW198,000.00 SSS growth to accelerate in 2Q11; maintaining Buy Jihyun Song Page 12 Hyundai Mobis (012330.KS),KRW366,000. 00 Buy Price Target KRW470,000.00 1Q11 results strong; target price raised to W470,000 Sanjeev Rana Page 13 STRATEGY/ECONOMICS Asia Economics Daily Mixed news on inflation in April Michael Spencer Page 14 Global Commodities Daily Gas prices not dangerous yet Adam Sieminski Page 18
Transcript of 3 May 2011 Asia Equities Daily Focus Periodicalimg.jrjimg.cn/2011/05/20110504152417139.pdf · 3 May...
Asia Pan-Asia Strategy
3 May 2011
Asia Equities Daily Focus Today's research headlines Asian Edition
Deutsche Bank AG/Hong Kong
All prices are those current at the end of the previous trading session unless otherwise indicated. Prices are sourced from local exchanges via Reuters, Bloomberg and other vendors. Data is sourced from Deutsche Bank and subject companies. Deutsche Bank does and seeks to do business with companies covered in its research reports. Thus, investors should be aware that the firm may have a conflict of interest that could affect the objectivity of this report. Investors should consider this report as only a single factor in making their investment decision. DISCLOSURES AND ANALYST CERTIFICATIONS ARE LOCATED IN APPENDIX 1. MICA(P) 007/05/2010
Periodical
Asian Index Closings EQUITIES Close 1D Chg %Chg
SHSZ300 3192.72 0.98 2.06 HSCEI 13208.71 -0.84 4.07 HSI 23720.81 -0.36 2.98 TWSE 9007.87 -0.36 0.39 KOSPI 2228.96 1.67 8.68 FSSTI 3179.86 -0.16 -0.32 KLCI 1534.95 -0.02 1.06 SENSEX 18998.02 -0.72 -7.37 NIFTY 5701.30 -0.84 -7.06 SET 1093.56 0.11 5.89 JCI 3849.30 0.78 3.94 PCOMP 4326.76 0.17 2.99 ASX200 4825.30 0.04 1.69 FOREX (vs US$) Close 1D Chg YTD %Chg Rmb 6.49 -0.01 1.76 HK$ 7.77 0.01 0.09 NT$ 28.57 0.15 2.57 Won 1065.23 0.59 5.70 S$ 1.22 0.21 5.04 M$ 2.96 -0.07 3.39 Rupee 44.34 -0.26 0.83 Baht 29.90 -0.07 0.54 Rupiah 8543.00 0.23 5.30 Peso 42.62 0.28 2.78 A$ 1.10 -0.14 7.07
Source: Bloomberg Finance LP
Latest Commodity Prices COMMODITIES Close 1D %Chg YTD %Chg West Texas 113.70 -0.20 24.43 Brent 124.88 -0.63 32.43 CRB 368.17 -0.65 10.63 Copper 418.25 0.41 -5.79 Gold (Spot) 1554.28 -0.60 9.40 Alum. (LME) 2767.50 0.86 12.05 Baltic Dry 1269.00 0.79 -28.43
Source: Bloomberg Finance LP
DB CORPORATE ACCESS DB Access Asia Conference 2011 - Singapore 5/23 - 26 DB Access Taiwan Conference 2011 - Taipei 11/7 - 8 DB Access Korea Conference 2011 - Seoul 11/10 - 11 DB Access Indonesia Conference 2011 - Jakarta 11/29 - 12/1
Research Team
Carissa Szeto Equity Focus (+852) 2203 6171 [email protected] Ching-Li Teo, CFA Equity Focus (+852) 2203 6206 [email protected]
Co
mp
any
Glo
bal
Mar
kets
Res
earc
h
Nodita_ 1. 2.
TOP STORIES Digital China (0861.HK),HKD14.86 Buy Price Target HKD19.00
A re-rating story; Initiating with Buy Lorraine Kuo Page 7
China Macro Strategy Update Positive macro outlook intact Jun Ma Page 8
ESTIMATE & TARGET PRICE CHANGES
Esprit Holdings Ltd (0330.HK),HKD32.30 Buy Price Target HKD49.30
Cutting target price on weak wholesale; maintaining Buy
Anne LingPage 9
Lianhua Supermarket (0980.HK),HKD31.60 Hold Price Target HKD32.70
Investing in food safety system for future growth; Hold
Anne LingPage 10
Taiwan Cement (1101.TW),TWD41.95 Buy Price Target TWD45.00
Growth momentum continues; raising price target to NT$45
Yvonne TsaiPage 11
HDS (069960.KS),KRW166,500.00 Buy Price Target KRW198,000.00
SSS growth to accelerate in 2Q11; maintaining Buy
Jihyun Song
Page 12
Hyundai Mobis (012330.KS),KRW366,000.00 Buy Price Target KRW470,000.00
1Q11 results strong; target price raised to W470,000
Sanjeev Rana
Page 13
STRATEGY/ECONOMICS
Asia Economics Daily Mixed news on inflation in April Michael Spencer Page 14
Global Commodities Daily Gas prices not dangerous yet Adam
Sieminski Page 18
3 May 2011 Strategy Asia Equities Daily Focus
Page 2 Deutsche Bank AG/Hong Kong
ADDITIONAL RESEARCH DB CONFERENCE/CORPORATE DAY
AsiaInfo-Linkage (ASIA.OQ),USD18.90 Buy Price Target USD24.75
1Q11 Preview Eva LeungPage 20 DB Access Asia Conference 2011 - Singapore 5/23 - 26
DB Access Taiwan Conference 2011 - Taipei 11/7 - 8 DB Access Korea Conference 2011 - Seoul 11/10 - 11
China Shenhua Energy (1088.HK),HKD36.25 Buy Price Target HKD40.00
1Q results in line with DB forecasts James KanPage 21
DB Access Indonesia Conference 2011 - Jakarta 11/29 - 2/1 1
NDRs Dongfang Electric
(1072.HK),HKD25.55 Buy Price Target HKD32.00
Record 1Q performance; Buy Michael TongPage 22 DBS Group Holdings (DBS SP) - SG 5/3
PT Bank Tabungan Negara (Persero), Tbk (BBTN IJ) - SG 5/3 - 4, HK 5/5 - 6 Sands China (1928 HK) - HK 5/4 Indofood CBP Sukes Makmur (ICBP IJ) & PT Indofood Sukses Makmur (INDF IJ) - HK 5/18 - 19 PT Adaro Energy Tbk (ADRO IJ) - HK 5/23
Little Sheep Group Limited (0968.HK),HKD5.00 Buy Price Target HKD6.15
Resume trading on 3 May; consideration yet to be announced
Anne Ling
Page 23LG Chem (051910 KS) - HK 5/23 - 24 H TC Corporation (2498 TT) - SG 6/21 - 22, HK 6/23 - 24
DB ANALYST/SALES ROADSHOWS
Korean autos Carmakers' domestic sales up 3%, global sales up 11% YoY
Sanjeev RanaPage 24
AirAsia (AIRA.KL) AirAsia to implement fuel surcharge from 3 May 2011
Michelle Foong Page 25
Soozhana Choi: Commodities - HK 5/5 - 6 KC Kao: Buy Selective PC Stocks: Neutralize on Smartphone - SG 6/21, HK 6/23
DB INTERNATIONAL PRODUCT Asian Palm Oil Industry Demand strength to offset near-term
price weakness Eltricia Foong
Page 26ROADSHOWS
Bank of India (BOI.BO),INR421.65 Hold Price Target INR460.00
Asset quality not out of woods, pension costs impact profit
Manish ShuklaPage 27
Fedex Corp. (FDX US) - HK 5/5, SG 5/6 Diageo (DGE LN) - HK 5/9, SG 5/10, PEK 5/11 Tom Ernst: Cloud Computing & Software - KL 5/18, HK 5/19, PEK 5/20, SG 5/23 Indiabulls Real Estate
(INRL.BO),INR125.75 Buy Price Target INR290.00
Weak 4Q despite robust execution Abhay Shanbhag Page 28
Marico Limited (MRCO.BO),INR136.45 Buy Price Target INR150.00
Strong operational numbers clouded by one offs. Maintain buy
Visa Inc. (V US) - PEK 5/23, HK 5/24 L'Oreal (OR EP) - PEK 5/23, SHA 5/24 Daimler AG (DAI GR) - HK 5/26 Equinix, Inc (EQIX US) - HK 5/27
Gaurav Bhatia
Page 29
Sun Pharma (SUN.BO),INR465.30 Hold Price Target INR430.00
Concerns on promoter diversifying into power are unwarranted
Justin Yageman: Transportation & Shipping - SG 5/30, HK 5/31, PEK 6/2 SEL 6/3 RWE AG (RWE GR) - PEK 6/30, SG 7/1
Abhay Shanbhag Page 30
Adaro Energy (ADRO.JK),IDR2,225.00 Buy Price Target IDR4,000.00
Encouraging 1Q'11 results, improving QoQ margins
Cherie Khoeng
Page 31
Bank Mandiri (BMRI.JK),IDR7,350.00 Buy Price Target IDR8,400.00
Gain from Garuda loan recoveries Raymond Kosasih Page 32
Gudang Garam (GGRM.JK) IDR40,600 Buy Price Target IDR43,500
Strong 1Q11 results with net profit up 19% YoY
Reggy Susanto
Page 33
Indofood CBP (ICBP.JK),IDR5,300.00 Buy Price Target IDR7,000.00
Strong 1Q11 results with margins bottoming
Reggy Susanto
Page 34
Multistrada Arah Sarana (MASA.JK),IDR350.00 Hold NA
NicholasNugroho
1Q11 earnings ahead of consensus Page 35
3 May 2011 Strategy Asia Equities Daily Focus
Deutsche Bank AG/Hong Kong Page 3
Summarecon (SMRA.JK),IDR1,260.00 Buy Price Target IDR1,400.00
1Q11 results below expectations Fiky Silvia
Page 36
Telecommunications Major cellular result round-up - XL gains share
Raymond Kosasih Page 37
Unilever Indonesia (UNVR.JK) IDR15,300 Hold NA
Weak 1Q with profit up 3% YoY and P&G not raising prices
Heriyanto Irawan Page 38
Banco de Oro (BDO.PS),PHP54.50 Hold Price Target PHP58.00
1Q11 up 18%, led by trading gains; Opex grows just +4%
Rafael Garchitorena Page 39
Bank of Phil Islands (BPI.PS),PHP58.55 Hold Price Target PHP58.00
1Q11 net profit slightly behind; but loans +13%, NIMs expand
Rafael Garchitorena Page 40
GLOBAL RESEARCH JS Group (5938.T),¥1,998 Buy Price Target ¥2,200 FY3/16 OP guidance is ¥240bn in
medium-term business plan Yoji Otani
Page 41
The notes and reports contained in this Daily are all excerpts of previously published documents. Please refer to the published notes on our web site for details on risks, valuations and earnings changes
3 May 2011 Strategy Asia Equities Daily Focus
Page 4 Deutsche Bank AG/Hong Kong
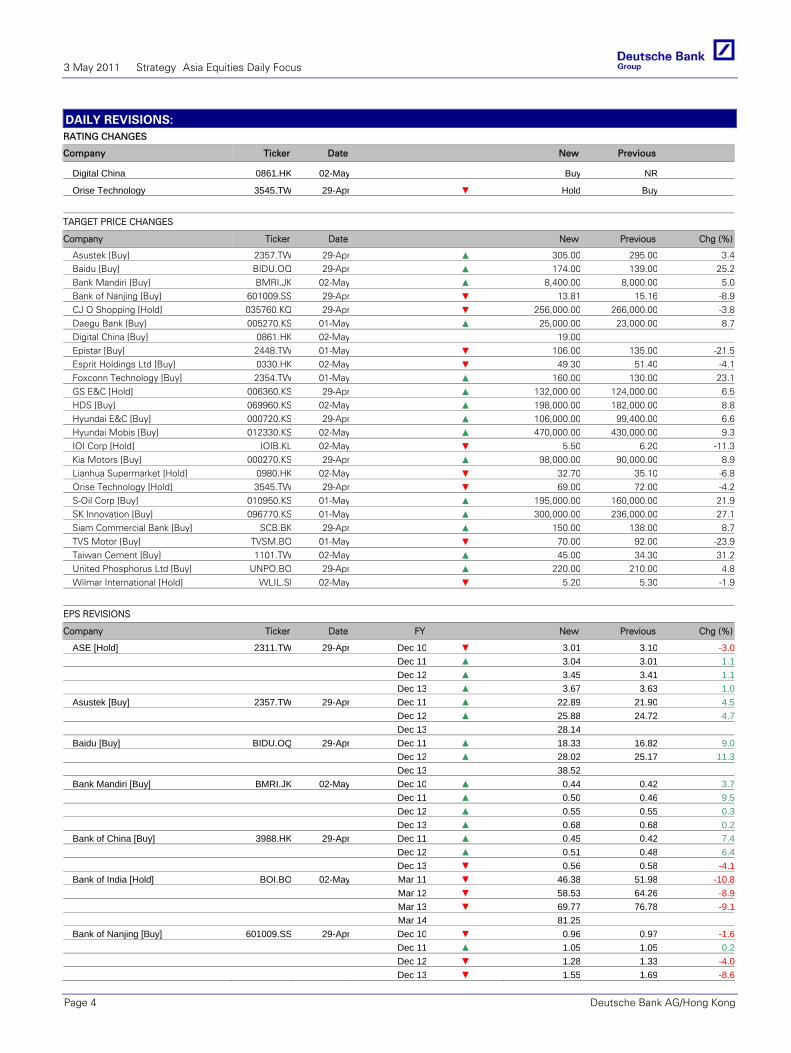
DAILY REVISIONS: RATING CHANGES
Company Ticker Date New Previous
Digital China 0861.HK 02-May Buy NR
Orise Technology 3545.TW 29-Apr ▼ Hold Buy
TARGET PRICE CHANGES
Company Ticker Date New Previous Chg (%)
Asustek [Buy] 2357.TW 29-Apr ▲ 305.00 295.00 3.4Baidu [Buy] BIDU.OQ 29-Apr ▲ 174.00 139.00 25.2Bank Mandiri [Buy] BMRI.JK 02-May ▲ 8,400.00 8,000.00 5.0Bank of Nanjing [Buy] 601009.SS 29-Apr ▼ 13.81 15.16 -8.9CJ O Shopping [Hold] 035760.KQ 29-Apr ▼ 256,000.00 266,000.00 -3.8Daegu Bank [Buy] 005270.KS 01-May ▲ 25,000.00 23,000.00 8.7Digital China [Buy] 0861.HK 02-May 19.00 Epistar [Buy] 2448.TW 01-May ▼ 106.00 135.00 -21.5Esprit Holdings Ltd [Buy] 0330.HK 02-May ▼ 49.30 51.40 -4.1Foxconn Technology [Buy] 2354.TW 01-May ▲ 160.00 130.00 23.1GS E&C [Hold] 006360.KS 29-Apr ▲ 132,000.00 124,000.00 6.5HDS [Buy] 069960.KS 02-May ▲ 198,000.00 182,000.00 8.8Hyundai E&C [Buy] 000720.KS 29-Apr ▲ 106,000.00 99,400.00 6.6Hyundai Mobis [Buy] 012330.KS 02-May ▲ 470,000.00 430,000.00 9.3IOI Corp [Hold] IOIB.KL 02-May ▼ 5.50 6.20 -11.3Kia Motors [Buy] 000270.KS 29-Apr ▲ 98,000.00 90,000.00 8.9Lianhua Supermarket [Hold] 0980.HK 02-May ▼ 32.70 35.10 -6.8Orise Technology [Hold] 3545.TW 29-Apr ▼ 69.00 72.00 -4.2S-Oil Corp [Buy] 010950.KS 01-May ▲ 195,000.00 160,000.00 21.9SK Innovation [Buy] 096770.KS 01-May ▲ 300,000.00 236,000.00 27.1Siam Commercial Bank [Buy] SCB.BK 29-Apr ▲ 150.00 138.00 8.7TVS Motor [Buy] TVSM.BO 01-May ▼ 70.00 92.00 -23.9Taiwan Cement [Buy] 1101.TW 02-May ▲ 45.00 34.30 31.2United Phosphorus Ltd [Buy] UNPO.BO 29-Apr ▲ 220.00 210.00 4.8Wilmar International [Hold] WLIL.SI 02-May ▼ 5.20 5.30 -1.9
EPS REVISIONS
Company Ticker Date FY New Previous Chg (%)
ASE [Hold] 2311.TW 29-Apr Dec 10 ▼ 3.01 3.10 -3.0 Dec 11 ▲ 3.04 3.01 1.1 Dec 12 ▲ 3.45 3.41 1.1 Dec 13 ▲ 3.67 3.63 1.0Asustek [Buy] 2357.TW 29-Apr Dec 11 ▲ 22.89 21.90 4.5 Dec 12 ▲ 25.88 24.72 4.7 Dec 13 28.14 Baidu [Buy] BIDU.OQ 29-Apr Dec 11 ▲ 18.33 16.82 9.0 Dec 12 ▲ 28.02 25.17 11.3 Dec 13 38.52 Bank Mandiri [Buy] BMRI.JK 02-May Dec 10 ▲ 0.44 0.42 3.7 Dec 11 ▲ 0.50 0.46 9.5 Dec 12 ▲ 0.55 0.55 0.3 Dec 13 ▲ 0.68 0.68 0.2Bank of China [Buy] 3988.HK 29-Apr Dec 11 ▲ 0.45 0.42 7.4 Dec 12 ▲ 0.51 0.48 6.4 Dec 13 ▼ 0.56 0.58 -4.1Bank of India [Hold] BOI.BO 02-May Mar 11 ▼ 46.38 51.98 -10.8 Mar 12 ▼ 58.53 64.26 -8.9 Mar 13 ▼ 69.77 76.78 -9.1 Mar 14 81.25 Bank of Nanjing [Buy] 601009.SS 29-Apr Dec 10 ▼ 0.96 0.97 -1.6 Dec 11 ▲ 1.05 1.05 0.2 Dec 12 ▼ 1.28 1.33 -4.0 Dec 13 ▼ 1.55 1.69 -8.6
3 May 2011 Strategy Asia Equities Daily Focus
Deutsche Bank AG/Hong Kong Page 5
DAILY REVISIONS: Company Ticker Date New Previous Chg (%)
Bank of Ningbo [Sell] 002142.SZ 29-Apr Dec 11 ▼ 0.97 0.98 -1.2 Dec 12 ▲ 1.23 1.19 3.3 Dec 13 ▼ 1.53 1.56 -2.3CJ O Shopping [Hold] 035760.KQ 29-Apr Dec 10 ▼ 8,588.16 9,217.37 -6.8 Dec 11 ▼ 15,764.72 18,558.95 -15.1 Dec 12 ▼ 17,116.30 21,313.83 -19.7 Dec 13 19,111.26 China Construction Bank [Buy] 0939.HK 29-Apr Dec 11 ▲ 0.65 0.62 5.5 Dec 12 ▼ 0.74 0.74 -0.1 Dec 13 ▲ 0.85 0.78 7.9China Minsheng [Hold] 1988.HK 29-Apr Dec 11 ▲ 0.78 0.67 16.1 Dec 12 ▲ 0.80 0.69 16.6 Dec 13 ▲ 0.92 0.75 22.0DBS Group Holdings Ltd [Buy] DBSM.SI 29-Apr Dec 11 ▼ 1.33 1.38 -3.1 Dec 12 ▼ 1.51 1.53 -1.2 Dec 13 ▲ 1.70 1.69 0.8Daegu Bank [Buy] 005270.KS 01-May Dec 10 0.00 nm Dec 11 0.00 nm Dec 12 0.00 nm Dec 13 0.00 Digital China [Buy] 0861.HK 02-May Mar 09 0.86 Mar 10 0.84 Mar 11 0.93 Mar 12 1.16 Dongfang Electric [Buy] 1072.HK 02-May Dec 10 ▼ 1.30 1.39 -6.6 Dec 11 ▼ 1.61 1.70 -5.2 Dec 12 ▲ 1.74 1.74 0.2 Dec 13 1.75 Epistar [Buy] 2448.TW 01-May Dec 11 ▼ 4.33 6.38 -32.1 Dec 12 ▼ 6.97 8.31 -16.1 Dec 13 8.26 Esprit Holdings Ltd [Buy] 0330.HK 02-May Jun 11 ▼ 2.80 2.89 -3.0 Jun 12 ▼ 3.07 3.29 -6.4 Jun 13 ▼ 3.55 3.75 -5.4Foxconn Technology [Buy] 2354.TW 01-May Dec 10 ▲ 6.84 6.48 5.6 Dec 11 ▲ 9.30 8.58 8.4 Dec 12 ▲ 10.94 9.83 11.4 Dec 13 12.62 GS E&C [Hold] 006360.KS 29-Apr Dec 10 ▼ 8,220.31 8,666.52 -5.1 Dec 11 ▼ 8,858.99 9,165.60 -3.3 Dec 12 ▼ 10,376.63 10,909.24 -4.9 Dec 13 12,200.83 Golden Agri-Resources [Buy] GAGR.SI 02-May Dec 10 ▲ 0.03 0.03 15.1 Dec 11 ▲ 0.04 0.04 0.0 Dec 12 ▲ 0.04 0.04 0.0 Dec 13 0.04 HDS [Buy] 069960.KS 02-May Dec 11 ▲ 14,151.67 13,662.34 3.6 Dec 12 ▲ 16,918.17 16,104.40 5.1 Dec 13 ▲ 19,401.09 18,382.69 5.5Hyundai E&C [Buy] 000720.KS 29-Apr Dec 10 ▼ 4,859.41 5,006.78 -2.9 Dec 11 ▲ 6,470.42 6,436.49 0.5 Dec 12 ▼ 7,747.77 7,852.20 -1.3 Dec 13 ▼ 9,366.84 9,458.62 -1.0Hyundai Mobis [Buy] 012330.KS 02-May Dec 11 ▲ 34,002.73 33,298.77 2.1 Dec 12 ▲ 36,988.31 35,999.63 2.7 Dec 13 41,779.60 IOI Corp [Hold] IOIB.KL 02-May Jun 13 ▲ 0.40 0.37 8.0Industrial Bank [Buy] 601166.SS 29-Apr Dec 11 ▲ 3.66 3.38 8.2 Dec 12 ▲ 4.38 3.91 12.1 Dec 13 ▲ 5.18 4.48 15.5
3 May 2011 Strategy Asia Equities Daily Focus
Page 6 Deutsche Bank AG/Hong Kong
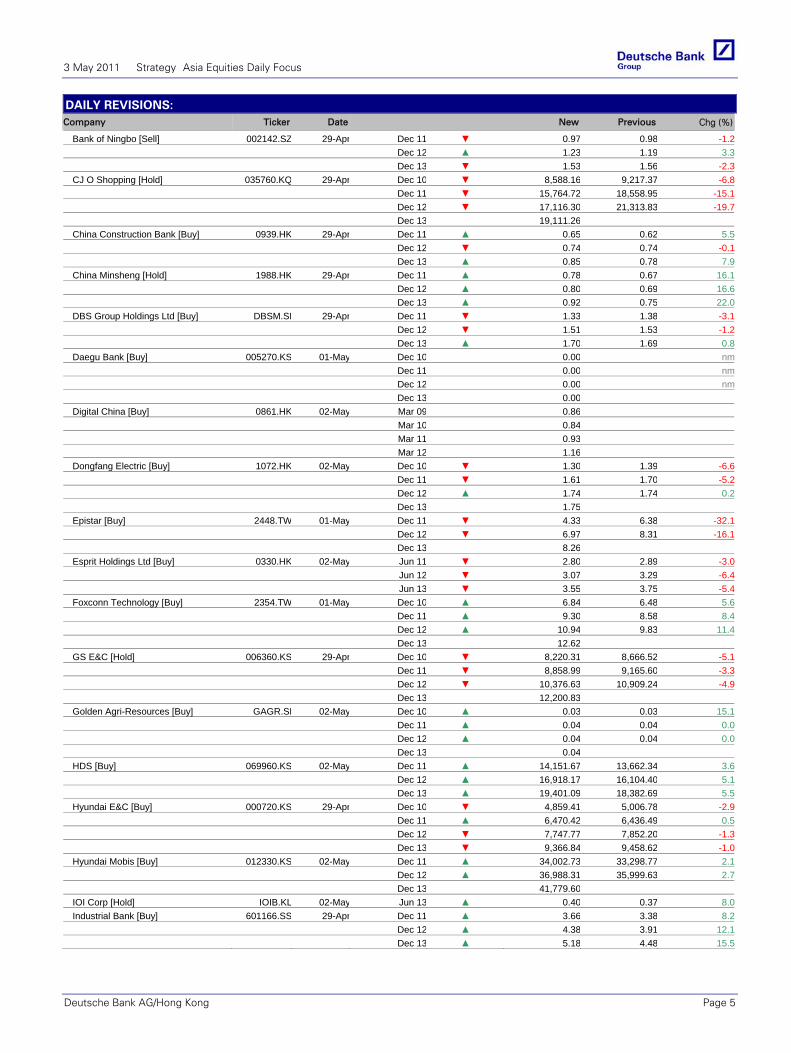
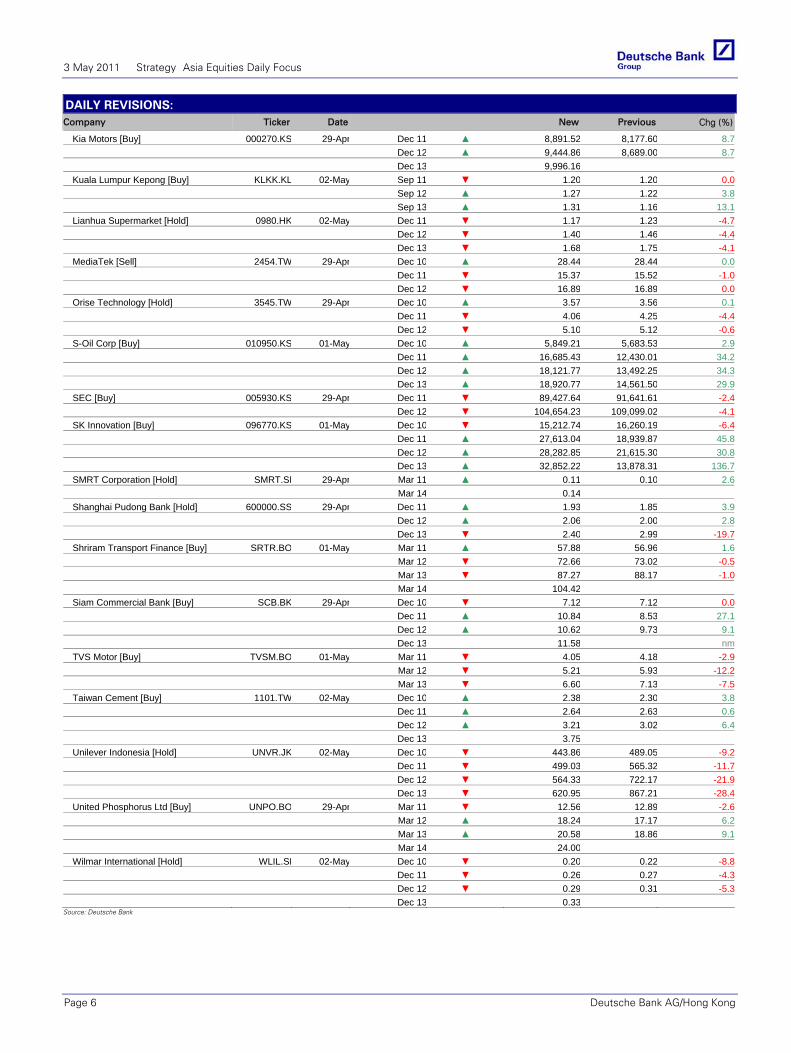
DAILY REVISIONS: Company Ticker Date New Previous Chg (%)
Kia Motors [Buy] 000270.KS 29-Apr Dec 11 ▲ 8,891.52 8,177.60 8.7 Dec 12 ▲ 9,444.86 8,689.00 8.7 Dec 13 9,996.16 Kuala Lumpur Kepong [Buy] KLKK.KL 02-May Sep 11 ▼ 1.20 1.20 0.0 Sep 12 ▲ 1.27 1.22 3.8 Sep 13 ▲ 1.31 1.16 13.1Lianhua Supermarket [Hold] 0980.HK 02-May Dec 11 ▼ 1.17 1.23 -4.7 Dec 12 ▼ 1.40 1.46 -4.4 Dec 13 ▼ 1.68 1.75 -4.1MediaTek [Sell] 2454.TW 29-Apr Dec 10 ▲ 28.44 28.44 0.0 Dec 11 ▼ 15.37 15.52 -1.0 Dec 12 ▼ 16.89 16.89 0.0Orise Technology [Hold] 3545.TW 29-Apr Dec 10 ▲ 3.57 3.56 0.1 Dec 11 ▼ 4.06 4.25 -4.4 Dec 12 ▼ 5.10 5.12 -0.6S-Oil Corp [Buy] 010950.KS 01-May Dec 10 ▲ 5,849.21 5,683.53 2.9 Dec 11 ▲ 16,685.43 12,430.01 34.2 Dec 12 ▲ 18,121.77 13,492.25 34.3 Dec 13 ▲ 18,920.77 14,561.50 29.9SEC [Buy] 005930.KS 29-Apr Dec 11 ▼ 89,427.64 91,641.61 -2.4 Dec 12 ▼ 104,654.23 109,099.02 -4.1SK Innovation [Buy] 096770.KS 01-May Dec 10 ▼ 15,212.74 16,260.19 -6.4 Dec 11 ▲ 27,613.04 18,939.87 45.8 Dec 12 ▲ 28,282.85 21,615.30 30.8 Dec 13 ▲ 32,852.22 13,878.31 136.7SMRT Corporation [Hold] SMRT.SI 29-Apr Mar 11 ▲ 0.11 0.10 2.6 Mar 14 0.14 Shanghai Pudong Bank [Hold] 600000.SS 29-Apr Dec 11 ▲ 1.93 1.85 3.9 Dec 12 ▲ 2.06 2.00 2.8 Dec 13 ▼ 2.40 2.99 -19.7Shriram Transport Finance [Buy] SRTR.BO 01-May Mar 11 ▲ 57.88 56.96 1.6 Mar 12 ▼ 72.66 73.02 -0.5 Mar 13 ▼ 87.27 88.17 -1.0 Mar 14 104.42 Siam Commercial Bank [Buy] SCB.BK 29-Apr Dec 10 ▼ 7.12 7.12 0.0 Dec 11 ▲ 10.84 8.53 27.1 Dec 12 ▲ 10.62 9.73 9.1 Dec 13 11.58 nmTVS Motor [Buy] TVSM.BO 01-May Mar 11 ▼ 4.05 4.18 -2.9 Mar 12 ▼ 5.21 5.93 -12.2 Mar 13 ▼ 6.60 7.13 -7.5Taiwan Cement [Buy] 1101.TW 02-May Dec 10 ▲ 2.38 2.30 3.8 Dec 11 ▲ 2.64 2.63 0.6 Dec 12 ▲ 3.21 3.02 6.4 Dec 13 3.75 Unilever Indonesia [Hold] UNVR.JK 02-May Dec 10 ▼ 443.86 489.05 -9.2 Dec 11 ▼ 499.03 565.32 -11.7 Dec 12 ▼ 564.33 722.17 -21.9 Dec 13 ▼ 620.95 867.21 -28.4United Phosphorus Ltd [Buy] UNPO.BO 29-Apr Mar 11 ▼ 12.56 12.89 -2.6 Mar 12 ▲ 18.24 17.17 6.2 Mar 13 ▲ 20.58 18.86 9.1 Mar 14 24.00 Wilmar International [Hold] WLIL.SI 02-May Dec 10 ▼ 0.20 0.22 -8.8 Dec 11 ▼ 0.26 0.27 -4.3 Dec 12 ▼ 0.29 0.31 -5.3 Dec 13 0.33
Source: Deutsche Bank
Asia China Technology Hardware & Equipment
3 May 2011
Digital China Reuters: 0861.HK Bloomberg: 861 HK Exchange: HKG Ticker: 0861
A re-rating story; Initiating with Buy Lorraine Kuo Research Analyst (+852) 2203 5926 [email protected]
Eva Leung, CFA Research Analyst (+852) 2203 6190 [email protected]
Digital China’s structural change and re-rating story; initiating with Buy Digital China (DC), a leading IT distributor in China, is reaping the rewards of efforts in the IT services industry. While its channel business offers a sustainable earnings stream, its IT services business should grow rapidly by tapping into increased IT spending in China. We expect OP income (OPI) from IT services to grow at a 55% CAGR in FY10-13 and account for 45% of DC’s total OPI. DC’s income and profit mix shift could trigger a re-rating of its stock valuation. We initiate coverage with Buy and a HK$19 target price, implying ~28% upside.
Forecasts and ratios
Year End Mar 31 2008A 2009A 2010E 2011E 2012E
Sales (HKDm) 42,326.3 50,178.3 56,192.7 66,929.7 80,326.8
EBIT (HKDm) 436.0 544.6 705.0 867.8 1,067.4
EBITDA (HKDm) 521.3 629.3 819.1 987.6 1,189.1
DB EPS FD(HKD) 0.67 0.86 0.84 0.93 1.16
DPS (net) (HKD) 0.15 0.28 0.28 0.30 0.38
ROE (%) 22.3 23.4 19.2 18.6 20.0
EV/EBITDA (x) 7.7 3.6 16.6 13.0 10.0
PER (x) 6.6 4.1 17.7 16.0 12.8Source: Deutsche Bank estimates, company data
1 DB EPS is fully diluted and excludes non-recurring items 2 Multiples and yields calculations use average historical prices for past years and spot prices for current and future years, except P/B which uses the year end close
Deutsche Bank AG/Hong Kong
Coverage Change
Buy Price at 27 Apr 2011 (HKD) 14.86Price target - 12mth (HKD) 19.0052-week range (HKD) 16.96 - 10.58HANG SENG INDEX 23,721
Price/price relative
4
8
12
16
20
4/09
7/09
10/09 1/1
04/1
07/1
010
/10 1/11
Digital China
HANG SENG INDEX (Rebased)
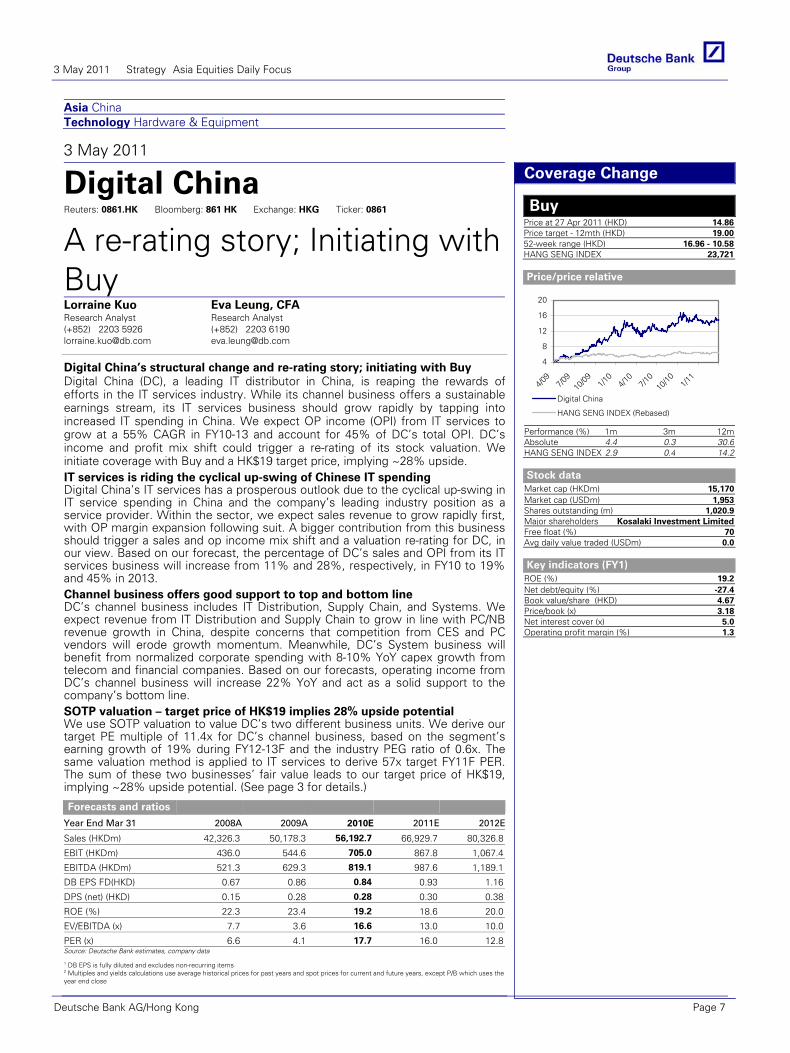
Performance (%) 1m 3m 12mAbsolute 4.4 0.3 30.6HANG SENG INDEX 2.9 0.4 14.2
Stock data
Market cap (HKDm) 15,170Market cap (USDm) 1,953Shares outstanding (m) 1,020.9Major shareholders Kosalaki Investment Limited Free float (%) 70Avg daily value traded (USDm) 0.0
Key indicators (FY1)
ROE (%) 19.2Net debt/equity (%) -27.4Book value/share (HKD) 4.67Price/book (x) 3.18Net interest cover (x) 5.0Operating profit margin (%) 1.3
IT services is riding the cyclical up-swing of Chinese IT spending Digital China’s IT services has a prosperous outlook due to the cyclical up-swing in IT service spending in China and the company’s leading industry position as a service provider. Within the sector, we expect sales revenue to grow rapidly first, with OP margin expansion following suit. A bigger contribution from this business should trigger a sales and op income mix shift and a valuation re-rating for DC, in our view. Based on our forecast, the percentage of DC’s sales and OPI from its IT services business will increase from 11% and 28%, respectively, in FY10 to 19% and 45% in 2013. Channel business offers good support to top and bottom line DC’s channel business includes IT Distribution, Supply Chain, and Systems. We expect revenue from IT Distribution and Supply Chain to grow in line with PC/NB revenue growth in China, despite concerns that competition from CES and PC vendors will erode growth momentum. Meanwhile, DC’s System business will benefit from normalized corporate spending with 8-10% YoY capex growth from telecom and financial companies. Based on our forecasts, operating income from DC’s channel business will increase 22% YoY and act as a solid support to the company’s bottom line. SOTP valuation – target price of HK$19 implies 28% upside potential We use SOTP valuation to value DC’s two different business units. We derive our target PE multiple of 11.4x for DC’s channel business, based on the segment’s earning growth of 19% during FY12-13F and the industry PEG ratio of 0.6x. The same valuation method is applied to IT services to derive 57x target FY11F PER. The sum of these two businesses’ fair value leads to our target price of HK$19, implying ~28% upside potential. (See page 3 for details.)
3 May 2011 Strategy Asia Equities Daily Focus
Deutsche Bank AG/Hong Kong Page 7
Asia Hong Kong Strategy Update
2 May 2011
China Macro Strategy Update
Positive macro outlook intact
Jun Ma, Ph.D Chief Economist (+852) 2203 8308 [email protected]
Wenjie Lu Research Analyst (+852) 2203 6187 [email protected]
In this note, we comment on a number of macro indicators, including the PMI reports and forthcoming CPI, as well as the renewed market concerns over further policy tightening. Our view is that the positive macro trend -- growth moderating to a healthier pace and inflation pressure easing -- remains intact, and aggressive monetary policy tightening will likely become increasingly unnecessary and unlikely.
1) PMIs show easing inflationary pressure for second consecutive month The official manufacturing PMI (reported on 1 May) and the HSBC PMI (reported on 29 April) showed that the input price indices fell in April for the second consecutive month. The input price index of the official PMI report fell 2.1ppts to 66.2 in April, while the input price index of the HSBC report declined 5.2ppts to 62.4. These data points indicate easing inflationary pressure from raw materials and components, at least on a sequential basis. In the official report, the aggregate PMI fell 0.5ppt to 52.9 in April, while the HSBC PMI increased 0.1ppt to 51.8. We think the overall PMI picture points to a steady growth outlook. The figures remain consistent with our view that qoq GDP growth is now in the range of 8-9% and yoy GDP growth will likely decelerate to 8.5-9% in the second half of this year. These growth rates are healthy as they would help mitigate the risk of overheating and should justify less policy tightening in the second half of this year. At the sector level, the strongest official PMI readings are from electric machinery (57.8), cement (57.4), universal equipment (57.3) and paper (56.3), while the weaker readings are seen in oil processing (44.7), transport equipment (49) and chemical materials (48.9).
2) We expect mom and yoy declines in CPI inflation in April Another important data point to note is that the daily agriculture price index fell 9% to 180 at end-April from 197 at the beginning of February. Part of the decline reflected a significant drop in vegetable prices in recent weeks. Historically, the food index in CPI has shown a one-to-one correlation with the daily agriculture price index after a lag. This implies a significant mom decline in the food index of the CPI in April, as this food index continued to rise in February and fell only 0.9% mom in March. We expect the food index to fall by at least 2% in April, leading to a mom decline of 0.4% in headline CPI. On a yoy basis, CPI inflation should decline to 4.9% in April from 5.4% in March. This is the first time in nine months that CPI inflation has declined in both mom and yoy terms.
3 May 2011 Strategy Asia Equities Daily Focus
Page 8 Deutsche Bank AG/Hong Kong
Asia Hong Kong Consumer Retail/Wholesale Trade
2 May 2011
Esprit Holdings Ltd Reuters: 0330.HK Bloomberg: 330 HK Exchange: HKG Ticker: 0330
Cutting target price on weak wholesale; maintaining BuyAnne Ling Research Analyst (+852) 2203 6177 [email protected]
3Q11 wholesale performance weaker than expected The trend shows that the business is close to bottoming out. Retail performance has been stable and is showing signs of bottoming, with flat SSSG. We maintain our Buy rating despite lowering our EPS forecast for FY11-13 by 3-6% and target price to HK$49.3 because we believe the current share price reflects market expectations that the brand is unlikely to recover. However, we believe that any small improvement in rebranding in 1H12 would result in an improvement in valuation. We thus maintain our Buy rating on Esprit.
Forecasts and ratios
Year End Jun 30 2009A 2010A 2011E 2012E 2013E
Sales (HKDm) 34,485.0 33,734.0 34,267.3 37,107.2 40,160.4
EBITDA (HKDm) 6,505.0 5,766.0 5,464.8 5,992.7 6,872.3
Reported NPAT (HKDm) 4,745.0 4,226.0 3,645.2 4,012.3 4,646.2
Reported EPS FD(HKD) 3.81 3.34 2.80 3.07 3.55
DB EPS FD(HKD) 3.81 2.95 2.80 3.07 3.55
OLD DB EPS FD(HKD) 3.81 2.95 2.89 3.29 3.75
% Change 0.0% 0.0% -3.0% -6.4% -5.4%
DB EPS growth (%) -26.9 -22.6 -5.1 9.9 15.5
PER (x) 13.3 18.0 11.5 10.5 9.1
EV/EBITDA (x) 9.0 10.9 6.5 5.8 5.0
DPS (net) (HKD) 2.84 1.40 1.70 1.87 2.16
Yield (net) (%) 5.6 2.6 5.3 5.8 6.7Source: Deutsche Bank estimates, company data
1 DB EPS is fully diluted and excludes non-recurring items 2 Multiples and yields calculations use average historical prices for past years and spot prices for current and future years, except P/B which uses the year end close
Deutsche Bank AG/Hong Kong
Forecast Change
Buy Price at 29 Apr 2011 (HKD) 32.30Price target - 12mth (HKD) 49.3052-week range (HKD) 56.70 - 32.30HANG SENG INDEX 23,721
Key changes
Price target 51.40 to 49.30 -4.1%Sales (FYE) 33,993 to 34,267 0.8%Op prof margin (FYE) 13.9 to 13.3 -3.9%Net profit (FYE) 3,761.6 to 3,645.2 -3.1%
Price/price relative
30
40
50
60
70
80
4/09 7/09 10/09 1/10 4/10 7/10 10/10 1/11Esprit Holdings Ltd
HANG SENG INDEX (Rebased)
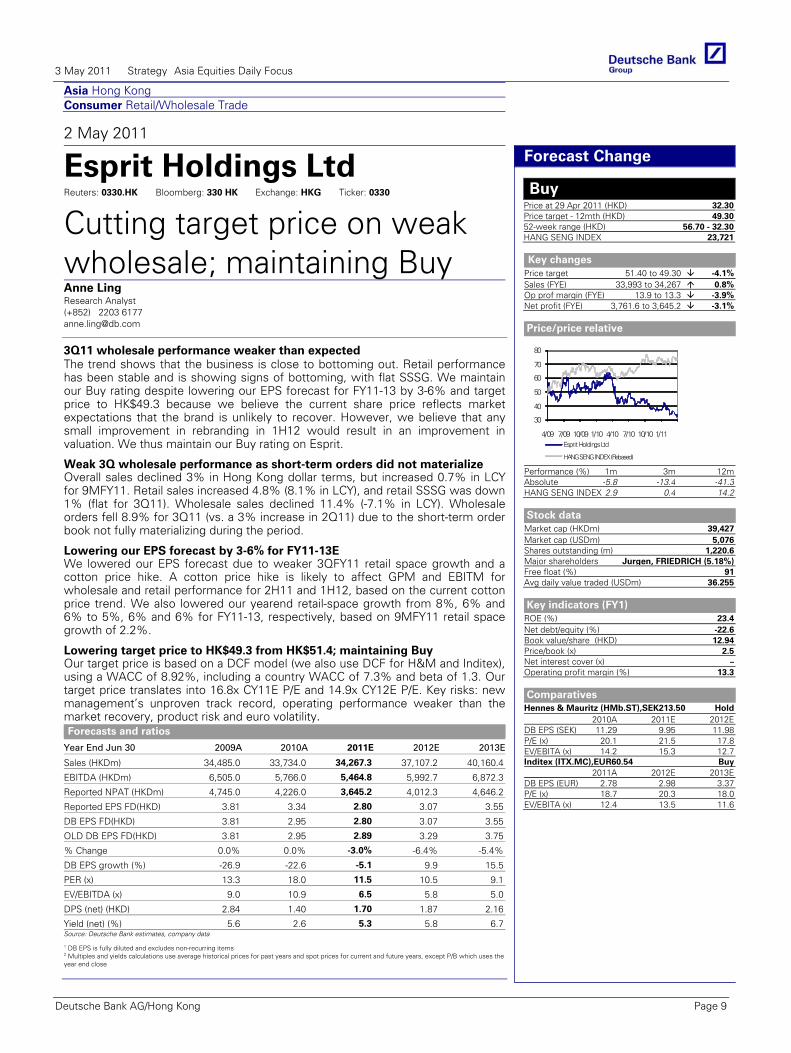
Performance (%) 1m 3m 12mAbsolute -5.8 -13.4 -41.3HANG SENG INDEX 2.9 0.4 14.2
Stock data
Market cap (HKDm) 39,427Market cap (USDm) 5,076Shares outstanding (m) 1,220.6Major shareholders Jurgen, FRIEDRICH (5.18%)Free float (%) 91Avg daily value traded (USDm) 36.255
Key indicators (FY1)
ROE (%) 23.4Net debt/equity (%) -22.6Book value/share (HKD) 12.94Price/book (x) 2.5Net interest cover (x) –Operating profit margin (%) 13.3
Comparatives
Hennes & Mauritz (HMb.ST),SEK213.50 Hold2010A 2011E 2012E
DB EPS (SEK) 11.29 9.95 11.98P/E (x) 20.1 21.5 17.8EV/EBITA (x) 14.2 15.3 12.7Inditex (ITX.MC),EUR60.54 Buy
2011A 2012E 2013EDB EPS (EUR) 2.78 2.98 3.37P/E (x) 18.7 20.3 18.0EV/EBITA (x) 12.4 13.5 11.6
Weak 3Q wholesale performance as short-term orders did not materialize Overall sales declined 3% in Hong Kong dollar terms, but increased 0.7% in LCY for 9MFY11. Retail sales increased 4.8% (8.1% in LCY), and retail SSSG was down 1% (flat for 3Q11). Wholesale sales declined 11.4% (-7.1% in LCY). Wholesale orders fell 8.9% for 3Q11 (vs. a 3% increase in 2Q11) due to the short-term order book not fully materializing during the period.
Lowering our EPS forecast by 3-6% for FY11-13E We lowered our EPS forecast due to weaker 3QFY11 retail space growth and a cotton price hike. A cotton price hike is likely to affect GPM and EBITM for wholesale and retail performance for 2H11 and 1H12, based on the current cotton price trend. We also lowered our yearend retail-space growth from 8%, 6% and 6% to 5%, 6% and 6% for FY11-13, respectively, based on 9MFY11 retail space growth of 2.2%.
Lowering target price to HK$49.3 from HK$51.4; maintaining Buy Our target price is based on a DCF model (we also use DCF for H&M and Inditex), using a WACC of 8.92%, including a country WACC of 7.3% and beta of 1.3. Our target price translates into 16.8x CY11E P/E and 14.9x CY12E P/E. Key risks: new management’s unproven track record, operating performance weaker than the market recovery, product risk and euro volatility.
3 May 2011 Strategy Asia Equities Daily Focus
Deutsche Bank AG/Hong Kong Page 9
Asia China Consumer Retail/Wholesale Trade
2 May 2011
Lianhua Supermarket Reuters: 0980.HK Bloomberg: 980 HK Exchange: HKG Ticker: 0980
Investing in food safety system for future growth; HoldAnne Ling Research Analyst (+852) 2203 6177 [email protected]
Mabel Wong, CFA Research Analyst (+852) 2203 6178 [email protected]
Target price revised from HK$35.1 to HK$32.7 1Q11 performance was in line with our expectations, with SSS growth of 8.7% and a net increase of 36 stores. However, we have lowered our target price from HK$35.1 to HK$32.7 due to EPS revision by 4-5% for FY11-13E as we expect Lianhua Supermarket (LH) to increase its investment in food safety. As the revised target price offers less than 15% potential upside, we maintain our Hold rating.
Forecasts and ratios
Year End Dec 31 2009A 2010A 2011E 2012E 2013E
Sales (CNYm) 24,017.7 25,887.4 28,077.9 31,104.2 34,398.8
EBITDA (CNYm) 950.8 1,123.2 1,323.9 1,536.6 1,823.3
Reported NPAT (CNYm) 506.8 622.6 726.7 869.0 1,044.3
Reported EPS FD(CNY) 0.81 1.00 1.17 1.40 1.68
DB EPS FD(CNY) 0.81 1.00 1.17 1.40 1.68
OLD DB EPS FD(CNY) 0.81 1.00 1.23 1.46 1.75
% Change 0.0% 0.0% -4.7% -4.4% -4.1%
DB EPS growth (%) 23.0 22.8 16.7 19.6 20.2
PER (x) 14.3 25.6 22.6 18.9 15.7
EV/EBITDA (x) 0.0 6.5 5.0 3.3 1.8
DPS (net) (CNY) 0.28 0.28 0.49 0.59 0.71
Yield (net) (%) 2.4 1.1 1.9 2.2 2.7Source: Deutsche Bank estimates, company data
1 DB EPS is fully diluted and excludes non-recurring items 2 Multiples and yields calculations use average historical prices for past years and spot prices for current and future years, except P/B which uses the year end close
Deutsche Bank AG/Hong Kong
Forecast Change
Hold Price at 29 Apr 2011 (HKD) 31.60Price target - 12mth (HKD) 32.7052-week range (HKD) 39.15 - 25.00HANG SENG INDEX 23,721
Key changes
Price target 35.10 to 32.70 -6.8%Op prof margin (FYE) 2.8 to 2.5 -7.7%Net profit (FYE) 762.3 to 726.7 -4.7%
Price/price relative
0
10
20
30
40
4/09 7/09 10/09 1/10 4/10 7/10 10/10 1/11Lianhua Supermarket
HANG SENG INDEX (Rebased)
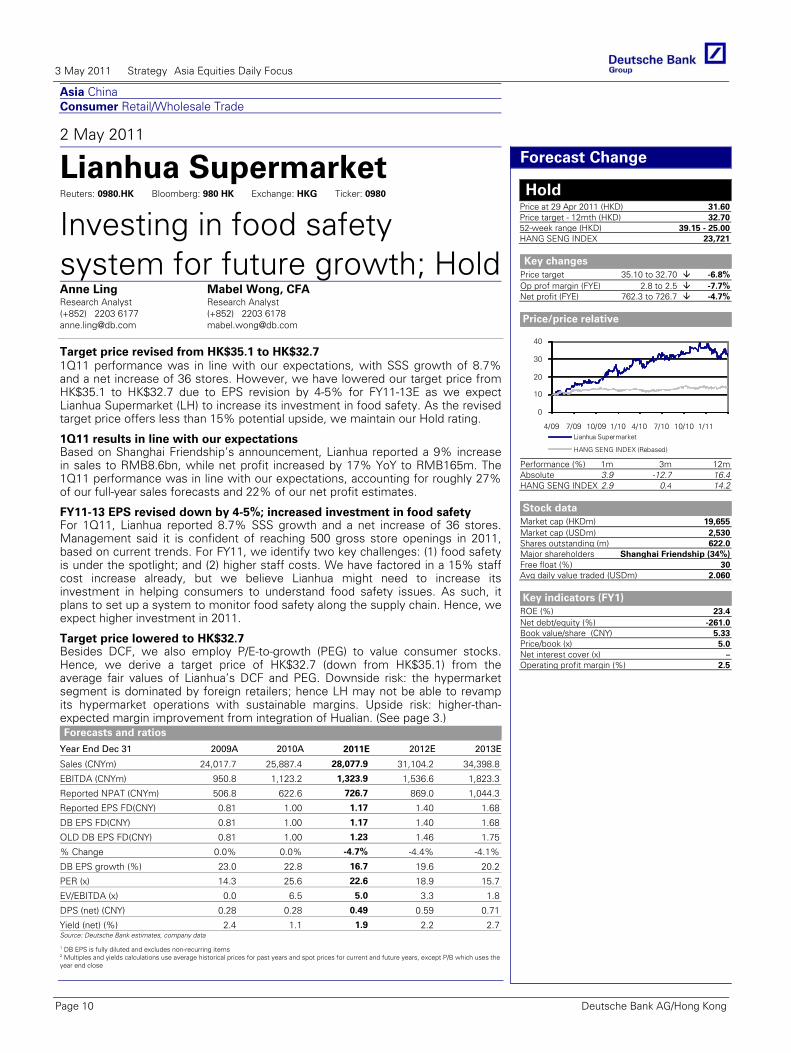
Performance (%) 1m 3m 12mAbsolute 3.9 -12.7 16.4HANG SENG INDEX 2.9 0.4 14.2
Stock data
Market cap (HKDm) 19,655Market cap (USDm) 2,530Shares outstanding (m) 622.0Major shareholders Shanghai Friendship (34%)Free float (%) 30Avg daily value traded (USDm) 2.060
Key indicators (FY1)
ROE (%) 23.4Net debt/equity (%) -261.0Book value/share (CNY) 5.33Price/book (x) 5.0Net interest cover (x) –Operating profit margin (%) 2.5
1Q11 results in line with our expectations Based on Shanghai Friendship’s announcement, Lianhua reported a 9% increase in sales to RMB8.6bn, while net profit increased by 17% YoY to RMB165m. The 1Q11 performance was in line with our expectations, accounting for roughly 27% of our full-year sales forecasts and 22% of our net profit estimates.
FY11-13 EPS revised down by 4-5%; increased investment in food safety For 1Q11, Lianhua reported 8.7% SSS growth and a net increase of 36 stores. Management said it is confident of reaching 500 gross store openings in 2011, based on current trends. For FY11, we identify two key challenges: (1) food safety is under the spotlight; and (2) higher staff costs. We have factored in a 15% staff cost increase already, but we believe Lianhua might need to increase its investment in helping consumers to understand food safety issues. As such, it plans to set up a system to monitor food safety along the supply chain. Hence, we expect higher investment in 2011.
Target price lowered to HK$32.7 Besides DCF, we also employ P/E-to-growth (PEG) to value consumer stocks. Hence, we derive a target price of HK$32.7 (down from HK$35.1) from the average fair values of Lianhua’s DCF and PEG. Downside risk: the hypermarket segment is dominated by foreign retailers; hence LH may not be able to revamp its hypermarket operations with sustainable margins. Upside risk: higher-than-expected margin improvement from integration of Hualian. (See page 3.)
3 May 2011 Strategy Asia Equities Daily Focus
Page 10 Deutsche Bank AG/Hong Kong
Asia Taiwan Resources Construction Materials
2 May 2011
Taiwan Cement Reuters: 1101.TW Bloomberg: 1101 TT Exchange: TAI Ticker: 1101
Growth momentum continues; raising price target to NT$45Yvonne Tsai Research Analyst (+886) 2 2192 2824 [email protected]
James Kan Research Analyst (+852) 2203 6146 [email protected]
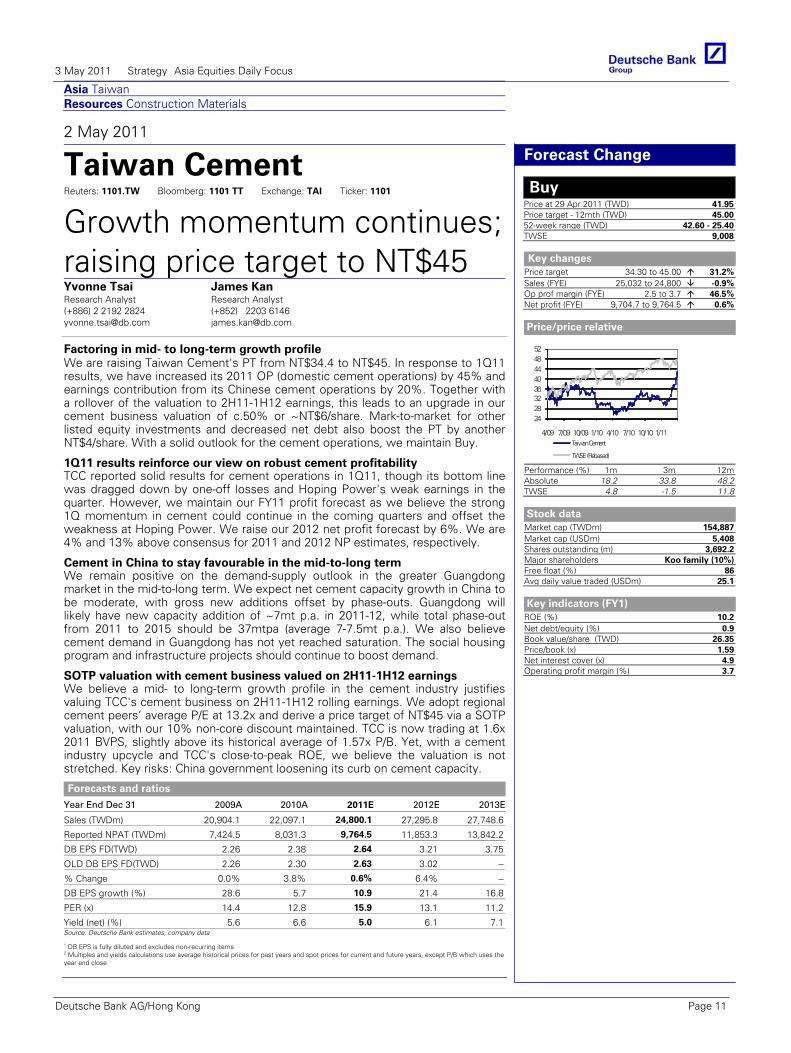
Factoring in mid- to long-term growth profile We are raising Taiwan Cement's PT from NT$34.4 to NT$45. In response to 1Q11 results, we have increased its 2011 OP (domestic cement operations) by 45% and earnings contribution from its Chinese cement operations by 20%. Together with a rollover of the valuation to 2H11-1H12 earnings, this leads to an upgrade in our cement business valuation of c.50% or ~NT$6/share. Mark-to-market for other listed equity investments and decreased net debt also boost the PT by another NT$4/share. With a solid outlook for the cement operations, we maintain Buy.
Forecasts and ratios
Year End Dec 31 2009A 2010A 2011E 2012E 2013E
Sales (TWDm) 20,904.1 22,097.1 24,800.1 27,295.8 27,748.6
Reported NPAT (TWDm) 7,424.5 8,031.3 9,764.5 11,853.3 13,842.2
DB EPS FD(TWD) 2.26 2.38 2.64 3.21 3.75
OLD DB EPS FD(TWD) 2.26 2.30 2.63 3.02 –
% Change 0.0% 3.8% 0.6% 6.4% –
DB EPS growth (%) 28.6 5.7 10.9 21.4 16.8
PER (x) 14.4 12.8 15.9 13.1 11.2
Yield (net) (%) 5.6 6.6 5.0 6.1 7.1Source: Deutsche Bank estimates, company data
1 DB EPS is fully diluted and excludes non-recurring items 2 Multiples and yields calculations use average historical prices for past years and spot prices for current and future years, except P/B which uses the year end close
Deutsche Bank AG/Hong Kong
Forecast Change
Buy Price at 29 Apr 2011 (TWD) 41.95Price target - 12mth (TWD) 45.0052-week range (TWD) 42.60 - 25.40TWSE 9,008
Key changes
Price target 34.30 to 45.00 31.2%Sales (FYE) 25,032 to 24,800 -0.9%Op prof margin (FYE) 2.5 to 3.7 46.5%Net profit (FYE) 9,704.7 to 9,764.5 0.6%
Price/price relative
2428323640444852
4/09 7/09 10/09 1/10 4/10 7/10 10/10 1/11Taiwan Cement
TWSE (Rebased)
Performance (%) 1m 3m 12mAbsolute 18.2 33.8 48.2TWSE 4.8 -1.5 11.8
Stock data
Market cap (TWDm) 154,887Market cap (USDm) 5,408Shares outstanding (m) 3,692.2Major shareholders Koo family (10%)Free float (%) 86Avg daily value traded (USDm) 25.1
Key indicators (FY1)
ROE (%) 10.2Net debt/equity (%) 0.9Book value/share (TWD) 26.35Price/book (x) 1.59Net interest cover (x) 4.9Operating profit margin (%) 3.7
1Q11 results reinforce our view on robust cement profitability TCC reported solid results for cement operations in 1Q11, though its bottom line was dragged down by one-off losses and Hoping Power's weak earnings in the quarter. However, we maintain our FY11 profit forecast as we believe the strong 1Q momentum in cement could continue in the coming quarters and offset the weakness at Hoping Power. We raise our 2012 net profit forecast by 6%. We are 4% and 13% above consensus for 2011 and 2012 NP estimates, respectively.
Cement in China to stay favourable in the mid-to-long term We remain positive on the demand-supply outlook in the greater Guangdong market in the mid-to-long term. We expect net cement capacity growth in China to be moderate, with gross new additions offset by phase-outs. Guangdong will likely have new capacity addition of ~7mt p.a. in 2011-12, while total phase-out from 2011 to 2015 should be 37mtpa (average 7-7.5mt p.a.). We also believe cement demand in Guangdong has not yet reached saturation. The social housing program and infrastructure projects should continue to boost demand.
SOTP valuation with cement business valued on 2H11-1H12 earnings We believe a mid- to long-term growth profile in the cement industry justifies valuing TCC's cement business on 2H11-1H12 rolling earnings. We adopt regional cement peers’ average P/E at 13.2x and derive a price target of NT$45 via a SOTP valuation, with our 10% non-core discount maintained. TCC is now trading at 1.6x 2011 BVPS, slightly above its historical average of 1.57x P/B. Yet, with a cement industry upcycle and TCC's close-to-peak ROE, we believe the valuation is not stretched. Key risks: China government loosening its curb on cement capacity.
3 May 2011 Strategy Asia Equities Daily Focus
Deutsche Bank AG/Hong Kong Page 11
Asia Korea, Republic of Consumer Retail/Wholesale Trade
2 May 2011
HDS Reuters: 069960.KS Bloomberg: 069960 KP Exchange: KSC Ticker: 069960
SSS growth to accelerate in 2Q11; maintaining BuyJihyun Song Research Analyst (+82) 2 316 8906 [email protected]
Jeremy Kim Research Associate (+82) 2 316 8902 [email protected]
Reiterating Buy We reiterate our Buy rating on HDS as one of our top picks in the Korean consumer sector. 1) We retain our bullish view on department store market growth, which is likely to remain strong on the back of growing consumer demand for high-end products. 2) We see fewer downside risks for department stores than discount stores, which focus on price cuts and aggressive promotion activities. 3) We expect HDS's new store openings to continue to upgrade its growth profile until 2015.
Forecasts and ratios
Year End Dec 31 2009A 2010A 2011E 2012E 2013E
Sales (KRWbn) 839 866 1,002 1,166 1,255
EBITDA (KRWbn) 226 252 300 365 420
Reported NPAT (KRWbn) 239.0 291.7 320.9 383.6 440.0
DB EPS FD(KRW) 11,511 11,733 14,152 16,918 19,401
DB EPS growth (%) – 1.9 20.6 19.5 14.7
PER (x) 7.9 9.9 11.8 9.8 8.6
EV/EBITDA (x) 6.9 7.3 8.8 6.6 4.8
DPS (net) (KRW) 600 600 600 700 750
Yield (net) (%) 0.7 0.5 0.4 0.4 0.5Source: Deutsche Bank estimates, company data
1 DB EPS is fully diluted and excludes non-recurring items 2 Multiples and yields calculations use average historical prices for past years and spot prices for current and future years, except P/B which uses the year end close
Deutsche Bank AG/Hong Kong
Company Update
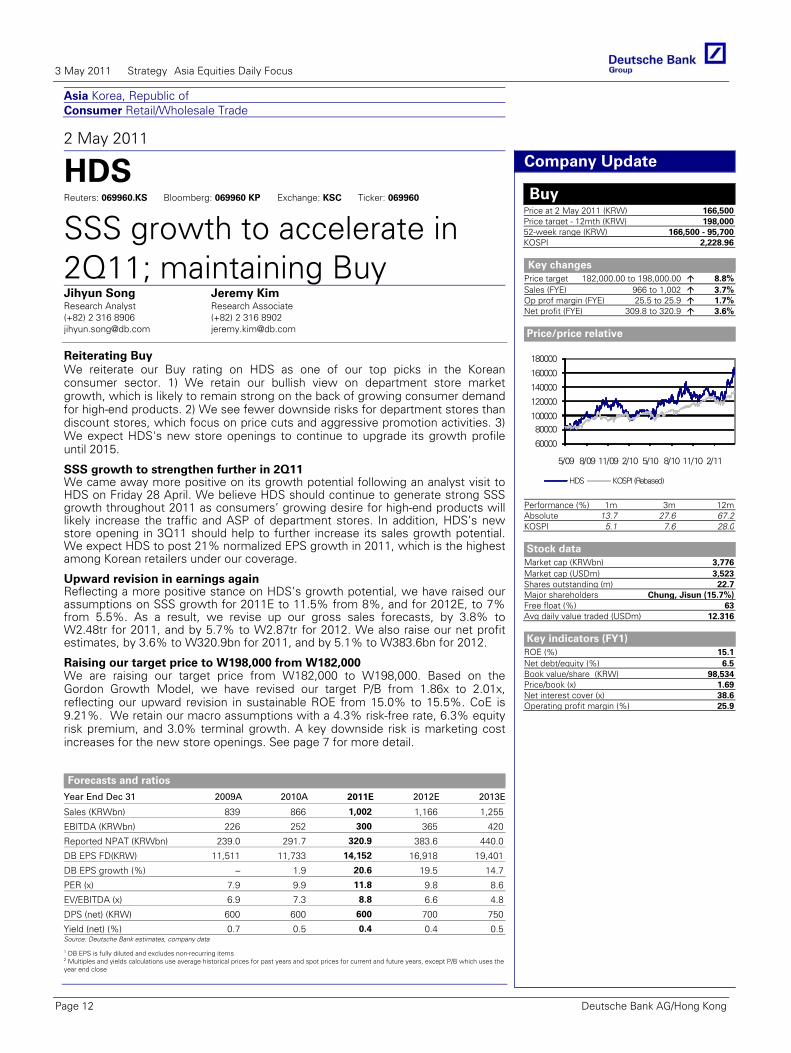
Buy Price at 2 May 2011 (KRW) 166,500Price target - 12mth (KRW) 198,00052-week range (KRW) 166,500 - 95,700KOSPI 2,228.96
Key changes
Price target 182,000.00 to 198,000.00 8.8%Sales (FYE) 966 to 1,002 3.7%Op prof margin (FYE) 25.5 to 25.9 1.7%Net profit (FYE) 309.8 to 320.9 3.6%
Price/price relative
60000
80000100000
120000
140000
160000
180000
5/09 8/09 11/09 2/10 5/10 8/10 11/10 2/11
HDS KOSPI (Rebased)
Performance (%) 1m 3m 12mAbsolute 13.7 27.6 67.2KOSPI 5.1 7.6 28.0
Stock data
Market cap (KRWbn) 3,776Market cap (USDm) 3,523Shares outstanding (m) 22.7Major shareholders Chung, Jisun (15.7%)Free float (%) 63Avg daily value traded (USDm) 12.316
Key indicators (FY1)
ROE (%) 15.1Net debt/equity (%) 6.5Book value/share (KRW) 98,534Price/book (x) 1.69Net interest cover (x) 38.6Operating profit margin (%) 25.9
Glo
bal
Mar
kets
Res
earc
h
SSS growth to strengthen further in 2Q11 We came away more positive on its growth potential following an analyst visit to HDS on Friday 28 April. We believe HDS should continue to generate strong SSS growth throughout 2011 as consumers’ growing desire for high-end products will likely increase the traffic and ASP of department stores. In addition, HDS’s new store opening in 3Q11 should help to further increase its sales growth potential. We expect HDS to post 21% normalized EPS growth in 2011, which is the highest among Korean retailers under our coverage.
Upward revision in earnings again Reflecting a more positive stance on HDS’s growth potential, we have raised our assumptions on SSS growth for 2011E to 11.5% from 8%, and for 2012E, to 7% from 5.5%. As a result, we revise up our gross sales forecasts, by 3.8% to W2.48tr for 2011, and by 5.7% to W2.87tr for 2012. We also raise our net profit estimates, by 3.6% to W320.9bn for 2011, and by 5.1% to W383.6bn for 2012.
Raising our target price to W198,000 from W182,000 We are raising our target price from W182,000 to W198,000. Based on the Gordon Growth Model, we have revised our target P/B from 1.86x to 2.01x, reflecting our upward revision in sustainable ROE from 15.0% to 15.5%. CoE is 9.21%. We retain our macro assumptions with a 4.3% risk-free rate, 6.3% equity risk premium, and 3.0% terminal growth. A key downside risk is marketing cost increases for the new store openings. See page 7 for more detail.
3 May 2011 Strategy Asia Equities Daily Focus
Page 12 Deutsche Bank AG/Hong Kong
Asia Korea, Republic of Automobiles & Components
2 May 2011
Hyundai Mobis Reuters: 012330.KS Bloomberg: 012330 KS Exchange: KSC Ticker: 012330
1Q11 results strong; target price raised to W470,000Sanjeev Rana Research Analyst (+82) 2 316 8910 [email protected]
We remain positive on the structural growth story; target raised to W470,000 We maintain our positive view on Mobis’ long-term structural growth story based on Hyundai/Kia’s rising sales globally and strong after-service parts revenue. Its high margin core parts business (30% of the total revenue) continues to deliver solid growth and should grow even faster in the years ahead with an increase in the sourcing of core parts by Hyundai/Kia from Mobis for their new models. New supply contracts from overseas automakers later this year should be another catalyst for the share price. Maintain Buy with a revised target price of W470,000.
Forecasts and ratios
Year End Dec 31 2009A 2010A 2011E 2012E 2013E
Reported NPAT (KRWbn) 1,615.2 2,424.3 3,228.2 3,600.6 4,067.0
DB EPS FD (KRW) 16,583 24,890 34,003 36,988 41,780
PER (x) 7.1 8.4 10.8 9.9 8.8Source: Deutsche Bank estimates, company data
1 DB EPS is fully diluted and excludes non-recurring items 2 Multiples and yields calculations use average historical prices for past years and spot prices for current and future years, except P/B which uses the year end close
Deutsche Bank AG/Hong Kong
Results
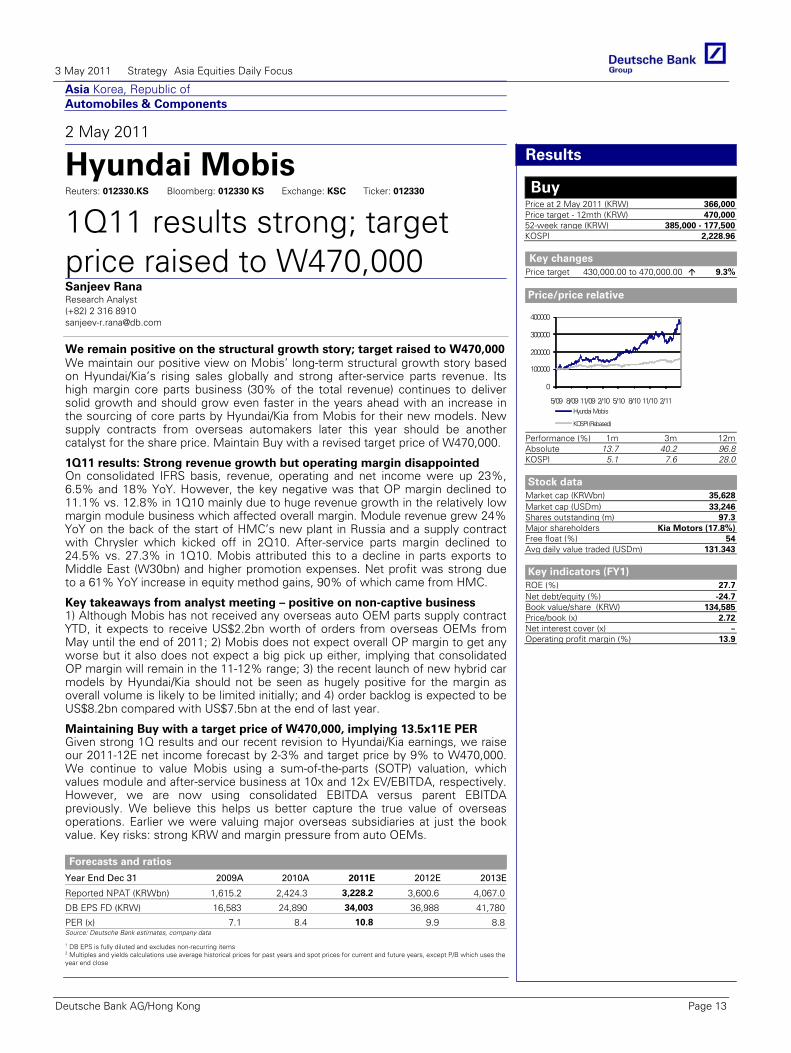
Buy Price at 2 May 2011 (KRW) 366,000Price target - 12mth (KRW) 470,00052-week range (KRW) 385,000 - 177,500KOSPI 2,228.96
Key changes
Price target 430,000.00 to 470,000.00 9.3%
Price/price relative
0
100000
200000
300000
400000
5/09 8/09 11/09 2/10 5/10 8/10 11/10 2/11Hyundai Mobis
KOSPI (Rebased)
Performance (%) 1m 3m 12mAbsolute 13.7 40.2 96.8KOSPI 5.1 7.6 28.0
Stock data
Market cap (KRWbn) 35,628Market cap (USDm) 33,246Shares outstanding (m) 97.3Major shareholders Kia Motors (17.8%)Free float (%) 54Avg daily value traded (USDm) 131.343
Key indicators (FY1)
ROE (%) 27.7Net debt/equity (%) -24.7Book value/share (KRW) 134,585Price/book (x) 2.72Net interest cover (x) –Operating profit margin (%) 13.9
1Q11 results: Strong revenue growth but operating margin disappointed On consolidated IFRS basis, revenue, operating and net income were up 23%, 6.5% and 18% YoY. However, the key negative was that OP margin declined to 11.1% vs. 12.8% in 1Q10 mainly due to huge revenue growth in the relatively low margin module business which affected overall margin. Module revenue grew 24% YoY on the back of the start of HMC’s new plant in Russia and a supply contract with Chrysler which kicked off in 2Q10. After-service parts margin declined to 24.5% vs. 27.3% in 1Q10. Mobis attributed this to a decline in parts exports to Middle East (W30bn) and higher promotion expenses. Net profit was strong due to a 61% YoY increase in equity method gains, 90% of which came from HMC.
Key takeaways from analyst meeting – positive on non-captive business 1) Although Mobis has not received any overseas auto OEM parts supply contract YTD, it expects to receive US$2.2bn worth of orders from overseas OEMs from May until the end of 2011; 2) Mobis does not expect overall OP margin to get any worse but it also does not expect a big pick up either, implying that consolidated OP margin will remain in the 11-12% range; 3) the recent launch of new hybrid car models by Hyundai/Kia should not be seen as hugely positive for the margin as overall volume is likely to be limited initially; and 4) order backlog is expected to be US$8.2bn compared with US$7.5bn at the end of last year.
Maintaining Buy with a target price of W470,000, implying 13.5x11E PER Given strong 1Q results and our recent revision to Hyundai/Kia earnings, we raise our 2011-12E net income forecast by 2-3% and target price by 9% to W470,000. We continue to value Mobis using a sum-of-the-parts (SOTP) valuation, which values module and after-service business at 10x and 12x EV/EBITDA, respectively. However, we are now using consolidated EBITDA versus parent EBITDA previously. We believe this helps us better capture the true value of overseas operations. Earlier we were valuing major overseas subsidiaries at just the book value. Key risks: strong KRW and margin pressure from auto OEMs.
3 May 2011 Strategy Asia Equities Daily Focus
Deutsche Bank AG/Hong Kong Page 13
Asia
2 May 2011
Asia Economics Daily
Mixed news on inflation in April
Deutsche Bank AG/Hong Kong
Michael Spencer, Ph.D Chief Economist, Asia (+852) 2203 8303 [email protected]
Jun Ma, Ph.D Chief Economist, Greater China (+852) 2203 8308 [email protected]
Taimur Baig, Ph.D Chief Economist, India (+65) 6423 8681 [email protected]
Juliana Lee Senior Economist (+852) 2203 8312 [email protected]
Kaushik Das Economist (+91) 22 6658 4909 [email protected]
Mac
ro
Eco
no
mic
s
HIGHLIGHTS
Indonesia - Inflation eases further in April, led by lower food prices; Trade surplus narrows to USD1.8bn in March, on high import growth
India - Trade deficit narrows to USD 5.6bn on lower imports growth South Korea - Inflation surprise to the downside in April; Exports rise by 26.6%yoy in April, above expectations Thailand - Inflation reached 4% mark in April, well above expectations Sri Lanka - CPI inflation touches 9.8%yoy in April, rate hike ahead; Exports growth eases to 36.8%yoy in February, well
below our expectation UPCOMING RELEASES
Hong Kong – Retail sales (vol) (Mar) DB forecast 14.5% (5.1% in Feb) India – We expect the RBI to raise policy rates by 25bps in response to rising inflation.
NEWS IN BRIEF
INDONESIA CPI inflation (Apr). Lower food prices brought headline CPI inflation down further in April, to 6.2%yoy from 6.7% in March, well below our (6.7%) as well as consensus (6.4%) forecasts. Food inflation slowed for the third straight month to 11.1% from a peak of 16.2% in January-2011. But core inflation edged up to 4.6% from 4.5% suggesting still robust demand-side pressures. Inflation was stable in the transportation (2.93% vs. 2.90%), housing (4.72% vs. 4.61%) and education (3.91% vs. 3.84%) categories. Today's data show that inflation is returning to a stable state for now as administrative prices remain frozen. When and as petrol, LPG, electricity, toll, and transportation tariffs are adjusted, inflation would rise by another 200bps, in our view. This risk plus the rising core inflation should keep Bank Indonesia on alert, but we don’t expect them to act aggressively unless it appears that inflation is at risk of getting out of control. Hence, we expect a continued moderate pace of rate hikes. We expect BI to pause this month but see the central bank hiking rates by 25bps next month. External trade (Mar). Export growth slowed to 27.5%yoy in March from 29.1% in February. This was better than our as well as consensus expectations of 22.5% and 25.4% respectively. Oil exports rose 36.9%, up from 20.1% in February, reflecting rising international oil prices. On the other hand, non-oil exports growth slowed to 25.6% in March, from 31.3% in February. Meanwhile, imports outpaced expectations, expanding by 32.0% in March up from 23.7% in February, suggesting buoyant domestic demand. This brought down the trade surplus to USD1.8bn from USD2.7bn in February. We expect rising international energy/commodity prices and strong demand from G2 countries as well as other emerging nations will continue to support export growth in the months ahead.
3 May 2011 Strategy Asia Equities Daily Focus
Page 14 Deutsche Bank AG/Hong Kong
INDIA External trade (Mar). As expected, export growth slowed to 43.9%yoy in March, from 49.7% in February. With import growth also moderating -- to 17.3% from 21.2% in February -- the trade deficit narrowed to USD5.6bn in March from USD8.1bn in February. Within imports, non-oil imports growth slowed to 21.0% in March from. 31.0% in February. However, reflecting mostly higher prices we think, oil imports increased sharply to 8.2%yoy in March against a decline of 0.3% in February.
SOUTH KOREA CPI inflation (Apr). After reaching a 29-month high of 4.7%yoy in March, CPI inflation eased to 4.2% in April and was below the consensus (4.6%) as well as our (4.4%) expectation. By category, this downward surprise was led by lower food prices, which slowed to 7.6% in April down sharply from 10.9% in March. Also, transport inflation eased somewhat last month, to 7.0% from 7.9% in March. In contrast, housing inflation rose to 4.3% in April, up from 4.1% and 3.7% respectively in the last two months. So core inflation, which excludes volatile food and energy components, slowed to 3.2% in April from 3.3% in March. Although we see a modest slowdown in inflation ahead we still expect it to stay above the 4% mark for the coming few months primed by high energy/commodity and housing costs. Given that inflation has already breached the central bank’s target and growth momentum seems intact, we expect the BoK to deliver 25bps rate hike in its policy meeting next week. But for rest of the year beyond that we expect only one more 25bps rate hike as debt concerns weigh on policy and the won is expected to appreciate further.
External trade (Apr). Exports rose by 26.6%yoy in April, albeit slightly lower than 28.9% (revised) growth reported in March but above the consensus (23.7%) as well as our (20.0%) forecasts. The slowdown was led by volatile vessel exports, which fell 20.2% in April, following 67% growth in March. On the other hand, electric/electronics (7.5% in Apr vs. 6.9% in Mar), steel (39.7% vs. 39.1%) and chemical products (29.3% vs. 28.5%) all witnessed strong growth during April. By destination, exports to China and Europe, slowed to 9.3% and 4.5% respectively in April, from 18.1% and 23.6% in March. However, exports to Japan and US rose at a faster pace of 70.1% and 23.0% during the month vs. 53.8% and 14.4% in March. It’s hard to see an impact from Japan’s earthquake in these data. With imports rising at a relatively slower pace of 23.7% in April vs. 27.3% in March, the trade surplus widened from USD2.8bn to USD5.8bn in April. We expect strong demand from G2 and regional countries will continue to drive high exports growth ahead, also we see high import bill led by rising international oil prices
THAILAND CPI inflation (Apr). Headline inflation rose to a 30-month high of 4.0%yoy in April, up sharply from 3.1% reported in March and was significantly higher than our (3.5%) as well as consensus (3.2%) expectations. Unlike Korea and Indonesia, food inflation in Thailand rose in April, to 8.6% from 5.9% in March, reflecting higher prices in vegetables (20.6%) and meat/poultry/fish (8.9%). In the non-food segment, transport inflation remained broadly stable at 2.5%, while housing inflation slowed from 1.2% to 0.6% in April. Meanwhile, reflecting robust expansion in domestic demand, the core inflation rate rose in April, to 2.1% from 1.6% in March. This upside surprise further cements our view of another 25bps rate hike at the next MPC and two more thereafter as inflationary pressure rises amid sustained growth..
SRI LANKA CPI inflation (Apr). Headline inflation rose to a 29-month high of 9.8%yoy in April, 120bps higher than March's reading and was broadly in line with our expectation of 9.9%. Almost all sub-segments reported an acceleration in inflation in April. Food inflation rose 14.3% in April up from 13.9% in March, due to the unfortunate flooding incident in Sri Lanka in early 2011 as well as a sharp spike in global food prices. Also, transport and housing inflation jumped to 5.3% and 6.8% respectively in April, from 2.4% and 3.6% in March. We expect CPI inflation to rise to double-digits in the coming months as the ongoing surge in international food/fuel inflation continue to put pressure on the overall price index. Given rising inflation pressure and strong growth momentum we expect the CBSL to deliver 100bps rate hike in rest of the year with the first 25bps hike to be expected in June.
External trade (Feb). As base effect drops out from the data, export growth slowed to 36.8%yoy in February, sharply down from 72.4% in January and was weaker than our forecast of 55.0%. Industrial (45.4% in Feb vs. 92.5% in Jan), Agri (11.6% vs. 28.9%) and minerals (13.6% vs. 49.5%) exports all witnessed slowdown in growth during February. With imports rising by 27.0% in February vs. 21.3% in January, the trade deficit narrowed from USD0.7bn to USD0.4bn in April.
3 May 2011 Strategy Asia Equities Daily Focus
Deutsche Bank AG/Hong Kong Page 15
FINANCIAL MARKETS
Today's % chg vs Today's abs chg vs Today's bps chg vs Today's bps chg vsClosing prev day Closing prev day Closing prev day Closing prev day
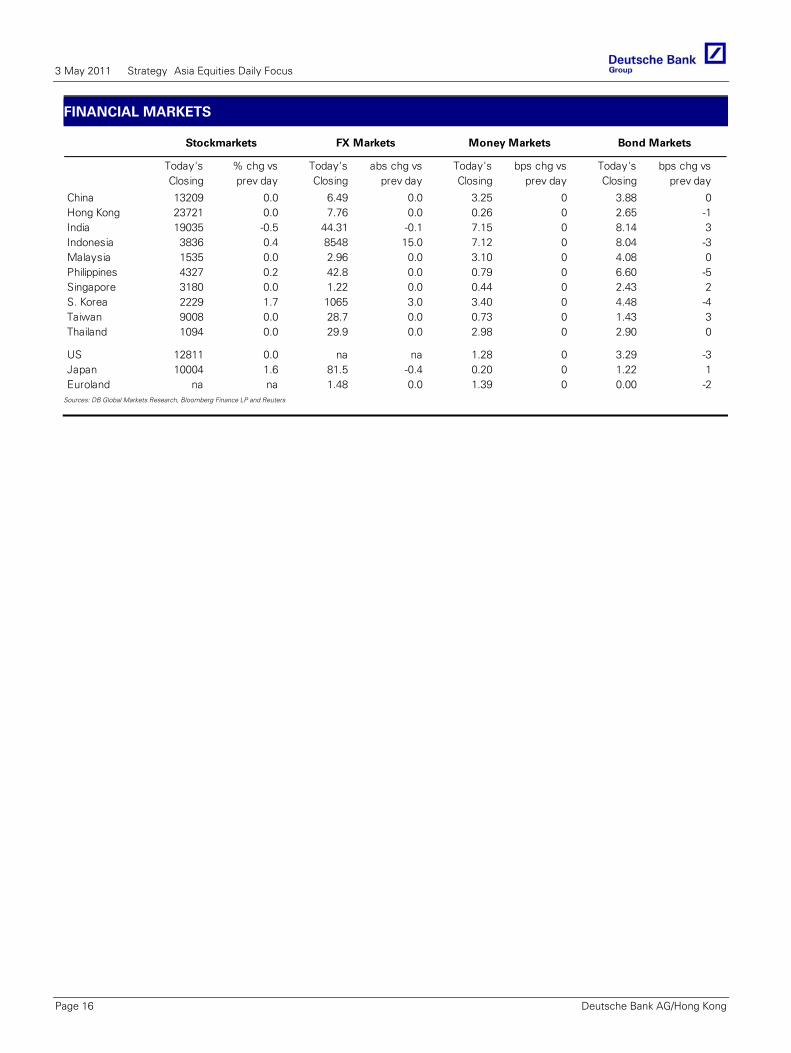
China 13209 0.0 6.49 0.0 3.25 0 3.88 0Hong Kong 23721 0.0 7.76 0.0 0.26 0 2.65 -1India 19035 -0.5 44.31 -0.1 7.15 0 8.14 3Indonesia 3836 0.4 8548 15.0 7.12 0 8.04 -3Malaysia 1535 0.0 2.96 0.0 3.10 0 4.08 0Philippines 4327 0.2 42.8 0.0 0.79 0 6.60 -5Singapore 3180 0.0 1.22 0.0 0.44 0 2.43 2S. Korea 2229 1.7 1065 3.0 3.40 0 4.48 -4Taiwan 9008 0.0 28.7 0.0 0.73 0 1.43 3Thailand 1094 0.0 29.9 0.0 2.98 0 2.90 0
US 12811 0.0 na na 1.28 0 3.29 -3Japan 10004 1.6 81.5 -0.4 0.20 0 1.22 1Euroland na na 1.48 0.0 1.39 0 0.00 -2
Stockmarkets FX Markets Money Markets Bond Markets
Sources: DB Global Markets Research, Bloomberg Finance LP and Reuters
3 May 2011 Strategy Asia Equities Daily Focus
Page 16 Deutsche Bank AG/Hong Kong
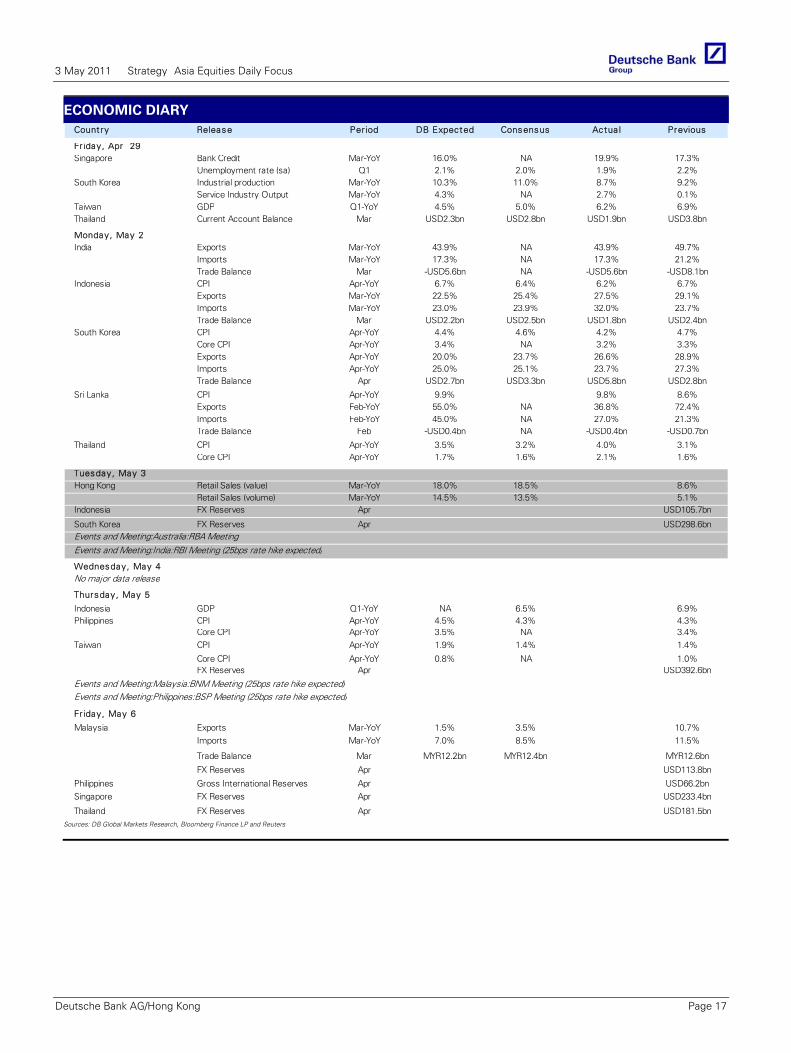
ECONOMIC DIARY Country Release Period DB Expected Consensus Actua l Previous
Fr iday, Apr 29Singapore Bank Credit Mar-YoY 16.0% NA 19.9% 17.3%
Unemployment rate (sa) Q1 2.1% 2.0% 1.9% 2.2%South Korea Industrial production Mar-YoY 10.3% 11.0% 8.7% 9.2%
Service Industry Output Mar-YoY 4.3% NA 2.7% 0.1%Taiwan GDP Q1-YoY 4.5% 5.0% 6.2% 6.9%Thailand Current Account Balance Mar USD2.3bn USD2.8bn USD1.9bn USD3.8bn
Monday, May 2India Exports Mar-YoY 43.9% NA 43.9% 49.7%
Imports Mar-YoY 17.3% NA 17.3% 21.2%Trade Balance Mar -USD5.6bn NA -USD5.6bn -USD8.1bn
Indonesia CPI Apr-YoY 6.7% 6.4% 6.2% 6.7%Exports Mar-YoY 22.5% 25.4% 27.5% 29.1%Imports Mar-YoY 23.0% 23.9% 32.0% 23.7%Trade Balance Mar USD2.2bn USD2.5bn USD1.8bn USD2.4bn
South Korea CPI Apr-YoY 4.4% 4.6% 4.2% 4.7%Core CPI Apr-YoY 3.4% NA 3.2% 3.3%Exports Apr-YoY 20.0% 23.7% 26.6% 28.9%Imports Apr-YoY 25.0% 25.1% 23.7% 27.3%Trade Balance Apr USD2.7bn USD3.3bn USD5.8bn USD2.8bn
Sri Lanka CPI Apr-YoY 9.9% 9.8% 8.6%Exports Feb-YoY 55.0% NA 36.8% 72.4%Imports Feb-YoY 45.0% NA 27.0% 21.3%Trade Balance Feb -USD0.4bn NA -USD0.4bn -USD0.7bn
Thailand CPI Apr-YoY 3.5% 3.2% 4.0% 3.1%Core CPI Apr-YoY 1.7% 1.6% 2.1% 1.6%
Tuesday, May 3Hong Kong Retail Sales (value) Mar-YoY 18.0% 18.5% 8.6%
Retail Sales (volume) Mar-YoY 14.5% 13.5% 5.1%Indonesia FX Reserves Apr USD105.7bn
South Korea FX Reserves Apr USD298.6bnEvents and Meeting:Australia:RBA MeetingEvents and Meeting:India:RBI Meeting (25bps rate hike expected)
Wednesday, May 4No major data release
Thursday, May 5
Indonesia GDP Q1-YoY NA 6.5% 6.9%Philippines CPI Apr-YoY 4.5% 4.3% 4.3%
Core CPI Apr-YoY 3.5% NA 3.4%Taiwan CPI Apr-YoY 1.9% 1.4% 1.4%
Core CPI Apr-YoY 0.8% NA 1.0%FX Reserves Apr USD392.6bn
Events and Meeting:Malaysia:BNM Meeting (25bps rate hike expected)Events and Meeting:Philippines:BSP Meeting (25bps rate hike expected)
Fr iday, May 6
Malaysia Exports Mar-YoY 1.5% 3.5% 10.7%Imports Mar-YoY 7.0% 8.5% 11.5%
Trade Balance Mar MYR12.2bn MYR12.4bn MYR12.6bn
FX Reserves Apr USD113.8bn
Philippines Gross International Reserves Apr USD66.2bnSingapore FX Reserves Apr USD233.4bn
Thailand FX Reserves Apr USD181.5bnSources: DB Global Markets Research, Bloomberg Finance LP and Reuters
3 May 2011 Strategy Asia Equities Daily Focus
Deutsche Bank AG/Hong Kong Page 17
Global
2 May 2011
Global Commodities DailyGas prices not dangerous yet
Deutsche Bank AG/London
Co
mm
od
itie
s
The Day Ahead
Time(EST) Country Event Previous Market View
03:55 Germany PMI Manufacturing (Apr) 61.7
04:00 EZ PMI Manufacturing (Apr) 57.7 57.7
10:00 US ISM Manufacturing (Apr) 61.2 59.6
16:00 US USDA crop progress report
21:00 China China Non-manufacturing PMI (Apr) 60.2
Overview
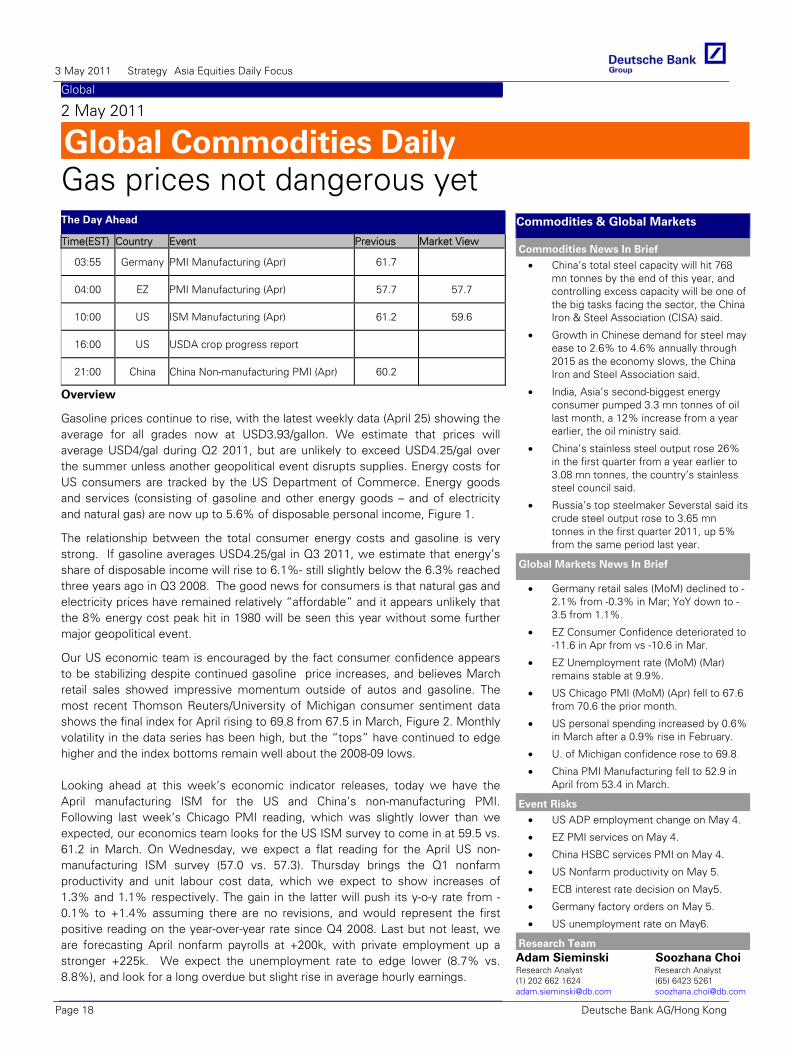
Gasoline prices continue to rise, with the latest weekly data (April 25) showing the average for all grades now at USD3.93/gallon. We estimate that prices will average USD4/gal during Q2 2011, but are unlikely to exceed USD4.25/gal over the summer unless another geopolitical event disrupts supplies. Energy costs for US consumers are tracked by the US Department of Commerce. Energy goods and services (consisting of gasoline and other energy goods – and of electricity and natural gas) are now up to 5.6% of disposable personal income, Figure 1.
The relationship between the total consumer energy costs and gasoline is very strong. If gasoline averages USD4.25/gal in Q3 2011, we estimate that energy’s share of disposable income will rise to 6.1%- still slightly below the 6.3% reached three years ago in Q3 2008. The good news for consumers is that natural gas and electricity prices have remained relatively “affordable” and it appears unlikely that the 8% energy cost peak hit in 1980 will be seen this year without some further major geopolitical event.
Our US economic team is encouraged by the fact consumer confidence appears to be stabilizing despite continued gasoline price increases, and believes March retail sales showed impressive momentum outside of autos and gasoline. The most recent Thomson Reuters/University of Michigan consumer sentiment data shows the final index for April rising to 69.8 from 67.5 in March, Figure 2. Monthly volatility in the data series has been high, but the “tops” have continued to edge higher and the index bottoms remain well about the 2008-09 lows.
Looking ahead at this week’s economic indicator releases, today we have the April manufacturing ISM for the US and China’s non-manufacturing PMI. Following last week’s Chicago PMI reading, which was slightly lower than we expected, our economics team looks for the US ISM survey to come in at 59.5 vs. 61.2 in March. On Wednesday, we expect a flat reading for the April US non-manufacturing ISM survey (57.0 vs. 57.3). Thursday brings the Q1 nonfarm productivity and unit labour cost data, which we expect to show increases of 1.3% and 1.1% respectively. The gain in the latter will push its y-o-y rate from -0.1% to +1.4% assuming there are no revisions, and would represent the first positive reading on the year-over-year rate since Q4 2008. Last but not least, we are forecasting April nonfarm payrolls at +200k, with private employment up a stronger +225k. We expect the unemployment rate to edge lower (8.7% vs. 8.8%), and look for a long overdue but slight rise in average hourly earnings.
Commodities & Global Markets
Commodities News In Brief
• China’s total steel capacity will hit 768 mn tonnes by the end of this year, and controlling excess capacity will be one of the big tasks facing the sector, the China Iron & Steel Association (CISA) said.
• Growth in Chinese demand for steel may ease to 2.6% to 4.6% annually through 2015 as the economy slows, the China Iron and Steel Association said.
• India, Asia’s second-biggest energy consumer pumped 3.3 mn tonnes of oil last month, a 12% increase from a year earlier, the oil ministry said.
• China’s stainless steel output rose 26% in the first quarter from a year earlier to 3.08 mn tonnes, the country’s stainless steel council said.
• Russia’s top steelmaker Severstal said its crude steel output rose to 3.65 mn tonnes in the first quarter 2011, up 5% from the same period last year.
Global Markets News In Brief
• Germany retail sales (MoM) declined to -2.1% from -0.3% in Mar; YoY down to -3.5 from 1.1%.
• EZ Consumer Confidence deteriorated to -11.6 in Apr from vs -10.6 in Mar.
• EZ Unemployment rate (MoM) (Mar) remains stable at 9.9%.
• US Chicago PMI (MoM) (Apr) fell to 67.6 from 70.6 the prior month.
• US personal spending increased by 0.6% in March after a 0.9% rise in February.
• U. of Michigan confidence rose to 69.8.
• China PMI Manufacturing fell to 52.9 in April from 53.4 in March.
Event Risks
• US ADP employment change on May 4.
• EZ PMI services on May 4.
• China HSBC services PMI on May 4.
• US Nonfarm productivity on May 5.
• ECB interest rate decision on May5.
• Germany factory orders on May 5.
• US unemployment rate on May6.
Research Team Adam Sieminski Soozhana Choi Research Analyst Research Analyst (1) 202 662 1624 (65) 6423 5261 [email protected] [email protected]
3 May 2011 Strategy Asia Equities Daily Focus
Page 18 Deutsche Bank AG/Hong Kong
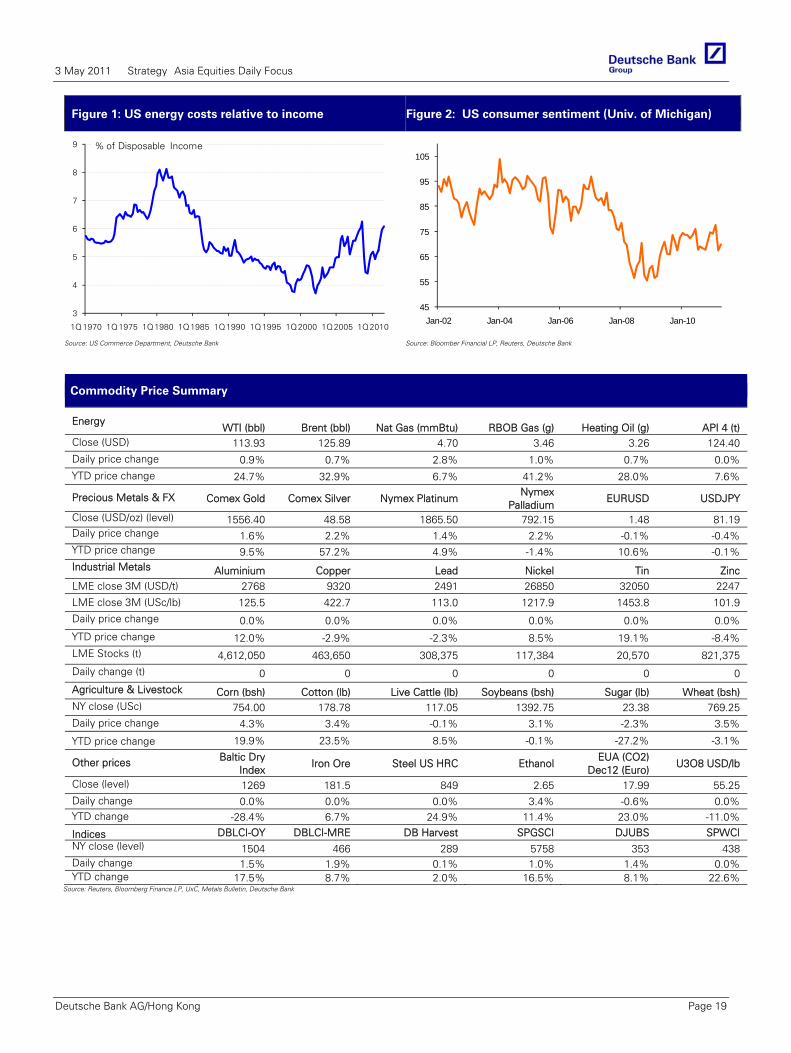
Figure 1: US energy costs relative to income Figure 2: US consumer sentiment (Univ. of Michigan)
3
4
5
6
7
8
9
1Q 1970 1Q 1975 1Q 1980 1Q 1985 1Q 1990 1Q 1995 1Q 2000 1Q 2005 1Q 2010
% of Disposable Income
45
55
65
75
85
95
105
Jan-02 Jan-04 Jan-06 Jan-08 Jan-10
Source: US Commerce Department, Deutsche Bank
Source: Bloomber Financial LP, Reuters, Deutsche Bank
Commodity Price Summary
Energy WTI (bbl) Brent (bbl) Nat Gas (mmBtu) RBOB Gas (g) Heating Oil (g) API 4 (t)
Close (USD) 113.93 125.89 4.70 3.46 3.26 124.40 Daily price change 0.9% 0.7% 2.8% 1.0% 0.7% 0.0% YTD price change 24.7% 32.9% 6.7% 41.2% 28.0% 7.6%
Precious Metals & FX Comex Gold Comex Silver Nymex Platinum Nymex
Palladium EURUSD USDJPY
Close (USD/oz) (level) 1556.40 48.58 1865.50 792.15 1.48 81.19 Daily price change 1.6% 2.2% 1.4% 2.2% -0.1% -0.4% YTD price change 9.5% 57.2% 4.9% -1.4% 10.6% -0.1% Industrial Metals Aluminium Copper Lead Nickel Tin Zinc LME close 3M (USD/t) 2768 9320 2491 26850 32050 2247
LME close 3M (USc/lb) 125.5 422.7 113.0 1217.9 1453.8 101.9
Daily price change 0.0% 0.0% 0.0% 0.0% 0.0% 0.0%
YTD price change 12.0% -2.9% -2.3% 8.5% 19.1% -8.4% LME Stocks (t) 4,612,050 463,650 308,375 117,384 20,570 821,375
Daily change (t) 0 0 0 0 0 0
Agriculture & Livestock Corn (bsh) Cotton (lb) Live Cattle (lb) Soybeans (bsh) Sugar (lb) Wheat (bsh) NY close (USc) 754.00 178.78 117.05 1392.75 23.38 769.25 Daily price change 4.3% 3.4% -0.1% 3.1% -2.3% 3.5%
YTD price change 19.9% 23.5% 8.5% -0.1% -27.2% -3.1%
Other prices Baltic Dry Index
Iron Ore Steel US HRC Ethanol EUA (CO2)
Dec12 (Euro) U3O8 USD/lb
Close (level) 1269 181.5 849 2.65 17.99 55.25 Daily change 0.0% 0.0% 0.0% 3.4% -0.6% 0.0% YTD change -28.4% 6.7% 24.9% 11.4% 23.0% -11.0%
Indices DBLCI-OY DBLCI-MRE DB Harvest SPGSCI DJUBS SPWCI NY close (level) 1504 466 289 5758 353 438 Daily change 1.5% 1.9% 0.1% 1.0% 1.4% 0.0% YTD change 17.5% 8.7% 2.0% 16.5% 8.1% 22.6%
Source: Reuters, Bloomberg Finance LP, UxC, Metals Bulletin, Deutsche Bank
3 May 2011 Strategy Asia Equities Daily Focus
Deutsche Bank AG/Hong Kong Page 19
Asia ChinaTechnology Software & Services
02 May 2011 - 08:47:21 PM HKT
COMPANY ALERT Results
AsiaInfo-Linkage Buy
1Q11 Preview
Reuters:ASIA.OQ Exchange:NMS Ticker:ASIA
Price (USD) 18.90
Price target (USD) 24.75
52-week range (USD) 28.41 - 15.91
Market cap (USDm) 1,403
Shares outstanding (m) 74.2
Net debt/equity (%) -25.8
Book value/share (USD) 12.42
Price/book (x) 1.5
FYE 12/31 2009A 2010E 2011E
Sales (US-Dm)
249 367 499
Net Profit(USDm)
35.9 56.8 57.6
DB EPS(USD)
1.07 1.23 1.49
PER (x) 17.2 15.4 12.6
Yield (net)(%)
0.0 0.0 0.0
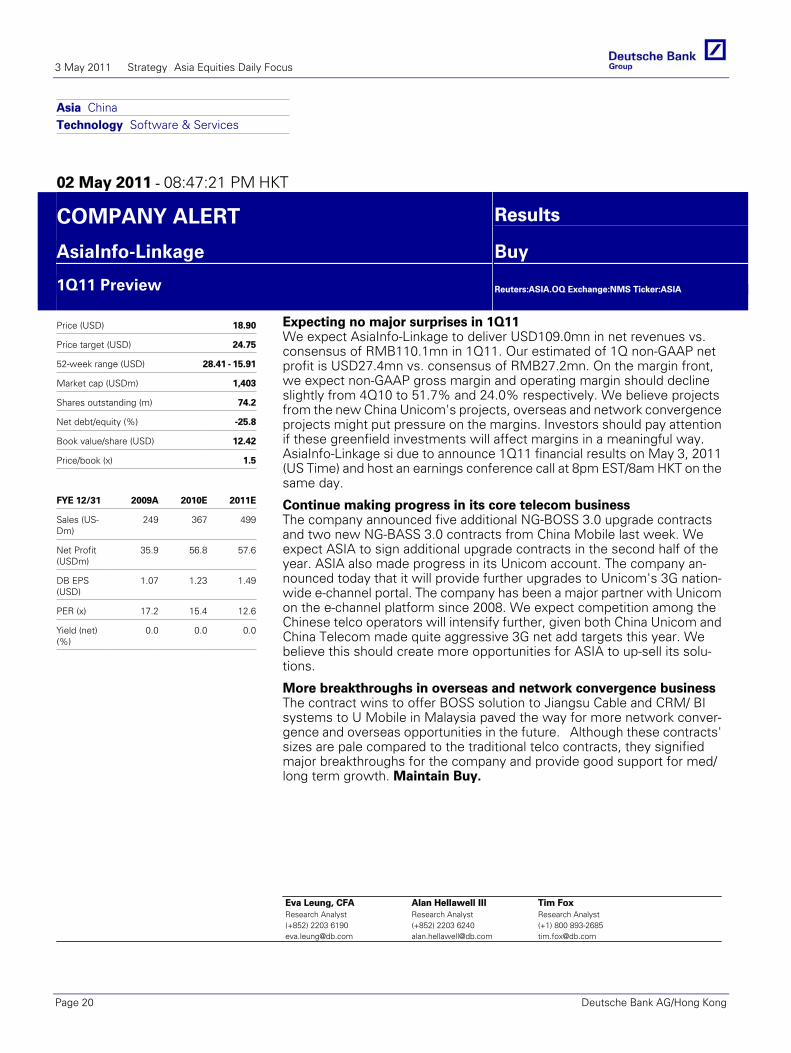
Expecting no major surprises in 1Q11We expect AsiaInfo-Linkage to deliver USD109.0mn in net revenues vs.consensus of RMB110.1mn in 1Q11. Our estimated of 1Q non-GAAP netprofit is USD27.4mn vs. consensus of RMB27.2mn. On the margin front,we expect non-GAAP gross margin and operating margin should declineslightly from 4Q10 to 51.7% and 24.0% respectively. We believe projectsfrom the new China Unicom's projects, overseas and network convergenceprojects might put pressure on the margins. Investors should pay attentionif these greenfield investments will affect margins in a meaningful way.AsiaInfo-Linkage si due to announce 1Q11 financial results on May 3, 2011(US Time) and host an earnings conference call at 8pm EST/8am HKT on thesame day.
Continue making progress in its core telecom businessThe company announced five additional NG-BOSS 3.0 upgrade contractsand two new NG-BASS 3.0 contracts from China Mobile last week. Weexpect ASIA to sign additional upgrade contracts in the second half of theyear. ASIA also made progress in its Unicom account. The company an-nounced today that it will provide further upgrades to Unicom's 3G nation-wide e-channel portal. The company has been a major partner with Unicomon the e-channel platform since 2008. We expect competition among theChinese telco operators will intensify further, given both China Unicom andChina Telecom made quite aggressive 3G net add targets this year. Webelieve this should create more opportunities for ASIA to up-sell its solu-tions.
More breakthroughs in overseas and network convergence businessThe contract wins to offer BOSS solution to Jiangsu Cable and CRM/ BIsystems to U Mobile in Malaysia paved the way for more network conver-gence and overseas opportunities in the future. Although these contracts'sizes are pale compared to the traditional telco contracts, they signifiedmajor breakthroughs for the company and provide good support for med/long term growth. Maintain Buy.
Eva Leung, CFAResearch Analyst(+852) 2203 [email protected]
Alan Hellawell IIIResearch Analyst(+852) 2203 [email protected]
Tim FoxResearch Analyst(+1) 800 [email protected]
3 May 2011 Strategy Asia Equities Daily Focus
Page 20 Deutsche Bank AG/Hong Kong
Co
mp
any Asia China
Resources Metals & Mining
02 May 2011 - 02:45:55 PM HKT
COMPANY ALERT Company Update
China Shenhua Energy Buy
1Q results in line with DB forecasts
Reuters:1088.HK Exchange:HKG Ticker:1088
Price (HKD) 36.25
Price target (HKD) 40.00
52-week range (HKD) 37.65 - 27.55
Market cap (USDm) 92,823
Shares outstanding (m) 19,890.0
Net debt/equity (%) -1.4
Book value/share (CNY) 9.92
Price/book (x) 3.1
FYE 12/31 2009A 2010E 2011E
Sales(CNYm)
121,312 152,063 190,339
Net Profit(CNYm)
31,706.0 37,198.6 44,270.6
DB EPS(CNY)
1.59 1.87 2.23
PER (x) 15.2 16.2 13.6
Yield (net)(%)
2.2 2.1 2.4
Source: Deutsche Bank
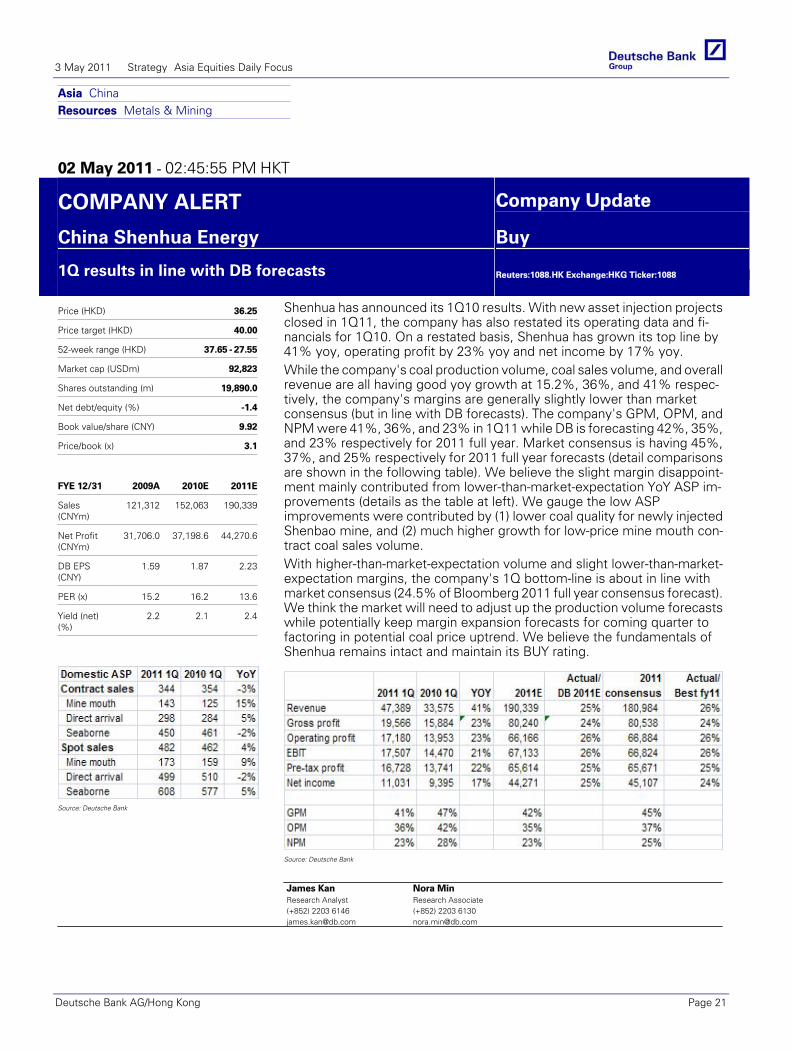
Shenhua has announced its 1Q10 results. With new asset injection projectsclosed in 1Q11, the company has also restated its operating data and fi-nancials for 1Q10. On a restated basis, Shenhua has grown its top line by41% yoy, operating profit by 23% yoy and net income by 17% yoy.While the company's coal production volume, coal sales volume, and overallrevenue are all having good yoy growth at 15.2%, 36%, and 41% respec-tively, the company's margins are generally slightly lower than marketconsensus (but in line with DB forecasts). The company's GPM, OPM, andNPM were 41%, 36%, and 23% in 1Q11 while DB is forecasting 42%, 35%,and 23% respectively for 2011 full year. Market consensus is having 45%,37%, and 25% respectively for 2011 full year forecasts (detail comparisonsare shown in the following table). We believe the slight margin disappoint-ment mainly contributed from lower-than-market-expectation YoY ASP im-provements (details as the table at left). We gauge the low ASPimprovements were contributed by (1) lower coal quality for newly injectedShenbao mine, and (2) much higher growth for low-price mine mouth con-tract coal sales volume.With higher-than-market-expectation volume and slight lower-than-market-expectation margins, the company's 1Q bottom-line is about in line withmarket consensus (24.5% of Bloomberg 2011 full year consensus forecast).We think the market will need to adjust up the production volume forecastswhile potentially keep margin expansion forecasts for coming quarter tofactoring in potential coal price uptrend. We believe the fundamentals ofShenhua remains intact and maintain its BUY rating.
Source: Deutsche Bank
James KanResearch Analyst(+852) 2203 [email protected]
Nora MinResearch Associate(+852) 2203 [email protected]
3 May 2011 Strategy Asia Equities Daily Focus
Deutsche Bank AG/Hong Kong Page 21
Asia ChinaIndustrials Manufacturing
02 May 2011 - 08:59:53 PM HKT
COMPANY ALERT Results
Dongfang Electric Buy
Record 1Q performance; Buy
Reuters:1072.HK Exchange:HKG Ticker:1072
Price (HKD) 25.55
Price target (HKD) 32.00
52-week range (HKD) 42.95 - 22.50
Market cap (USDm) 6,591
Shares outstanding (m) 2,003.9
Net debt/equity (%) -118.2
Book value/share (CNY) 6.99
Price/book (x) 3.1
FYE 12/31 2010A 2011E 2012E
Sales(CNYm)
37,604 44,897 47,411
Net Profit(CNYm)
2,600.5 3,225.4 3,489.4
DB EPS(CNY)
1.30 1.61 1.74
PER (x) 18.8 13.3 12.3
Yield (net)(%)
0.5 0.8 0.8
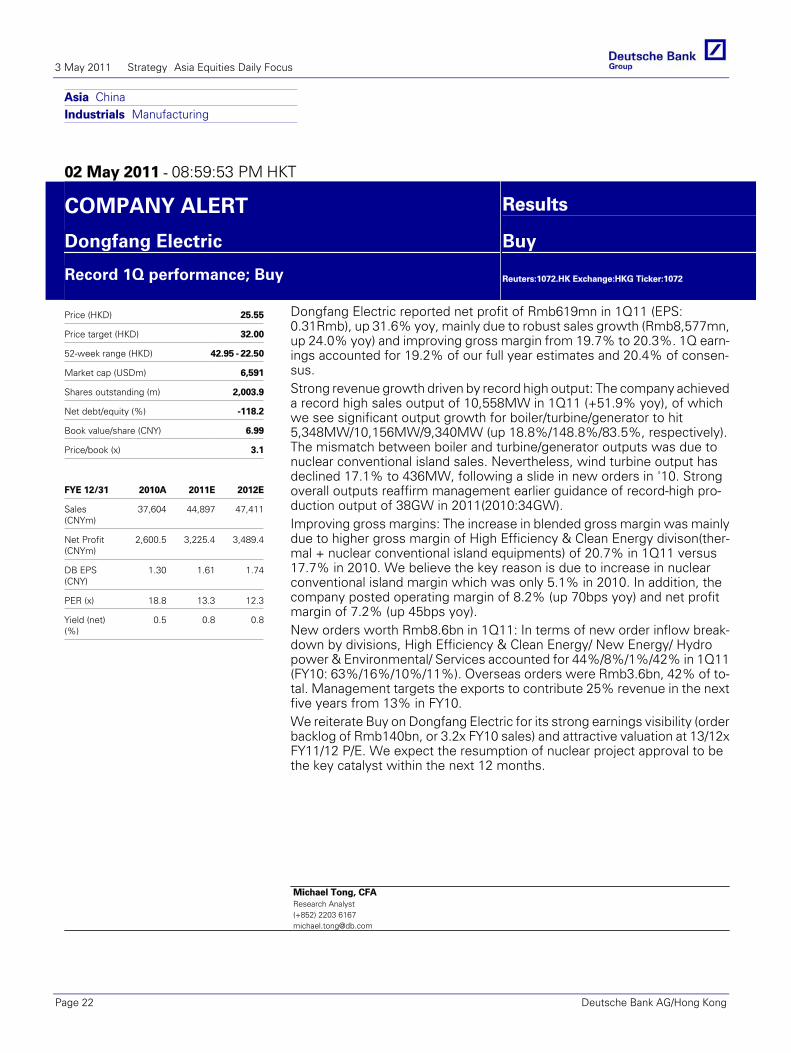
Dongfang Electric reported net profit of Rmb619mn in 1Q11 (EPS:0.31Rmb), up 31.6% yoy, mainly due to robust sales growth (Rmb8,577mn,up 24.0% yoy) and improving gross margin from 19.7% to 20.3%. 1Q earn-ings accounted for 19.2% of our full year estimates and 20.4% of consen-sus.Strong revenue growth driven by record high output: The company achieveda record high sales output of 10,558MW in 1Q11 (+51.9% yoy), of whichwe see significant output growth for boiler/turbine/generator to hit5,348MW/10,156MW/9,340MW (up 18.8%/148.8%/83.5%, respectively).The mismatch between boiler and turbine/generator outputs was due tonuclear conventional island sales. Nevertheless, wind turbine output hasdeclined 17.1% to 436MW, following a slide in new orders in '10. Strongoverall outputs reaffirm management earlier guidance of record-high pro-duction output of 38GW in 2011(2010:34GW).Improving gross margins: The increase in blended gross margin was mainlydue to higher gross margin of High Efficiency & Clean Energy divison(ther-mal + nuclear conventional island equipments) of 20.7% in 1Q11 versus17.7% in 2010. We believe the key reason is due to increase in nuclearconventional island margin which was only 5.1% in 2010. In addition, thecompany posted operating margin of 8.2% (up 70bps yoy) and net profitmargin of 7.2% (up 45bps yoy).New orders worth Rmb8.6bn in 1Q11: In terms of new order inflow break-down by divisions, High Efficiency & Clean Energy/ New Energy/ Hydropower & Environmental/ Services accounted for 44%/8%/1%/42% in 1Q11(FY10: 63%/16%/10%/11%). Overseas orders were Rmb3.6bn, 42% of to-tal. Management targets the exports to contribute 25% revenue in the nextfive years from 13% in FY10.We reiterate Buy on Dongfang Electric for its strong earnings visibility (orderbacklog of Rmb140bn, or 3.2x FY10 sales) and attractive valuation at 13/12xFY11/12 P/E. We expect the resumption of nuclear project approval to bethe key catalyst within the next 12 months.
Michael Tong, CFAResearch Analyst(+852) 2203 [email protected]
3 May 2011 Strategy Asia Equities Daily Focus
Page 22 Deutsche Bank AG/Hong Kong
Asia ChinaConsumer Hotels/Leisure/Gaming
02 May 2011 - 05:51:16 PM HKT
COMPANY ALERT Company Update
Little Sheep Group Limited Buy
Resume trading on 3 May; consideration yet to be an‐nounced
Reuters:0968.HK Exchange:HSI Ticker:0968
Price (HKD) 5.00
Price target (HKD) 6.15
52-week range (HKD) 5.50 ‐ 4.17
Market cap (USDm) 545
Shares outstanding (m) 1,029.8
Net debt/equity (%) ‐11.0
Book value/share (CNY) 1.21
Price/book (x) 3.4
FYE 12/31 2010A 2011E 2012E
Sales(CNYm)
1,926 2,413 2,978
Net Profit(CNYm)
187.8 226.3 274.6
DB EPS(CNY)
0.18 0.22 0.26
PER (x) 21.9 19.3 15.9
Yield (net)(%)
1.7 1.9 2.3
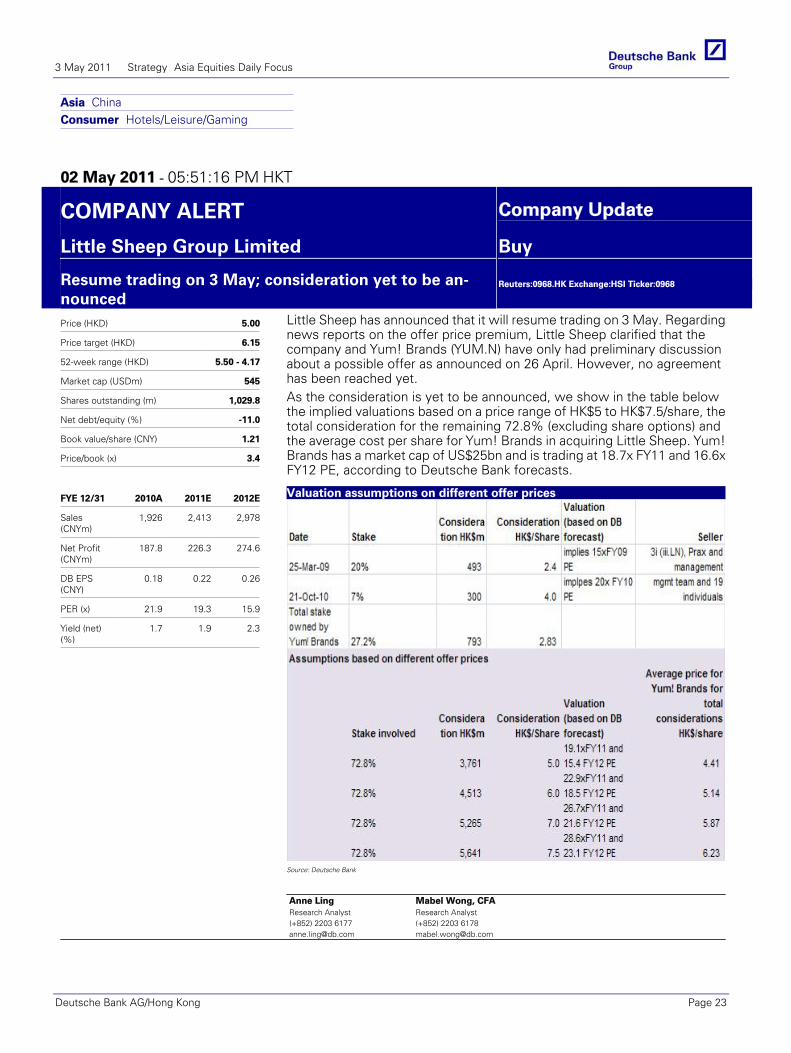
Little Sheep has announced that it will resume trading on 3 May. Regardingnews reports on the offer price premium, Little Sheep clarified that thecompany and Yum! Brands (YUM.N) have only had preliminary discussionabout a possible offer as announced on 26 April. However, no agreementhas been reached yet.As the consideration is yet to be announced, we show in the table belowthe implied valuations based on a price range of HK$5 to HK$7.5/share, thetotal consideration for the remaining 72.8% (excluding share options) andthe average cost per share for Yum! Brands in acquiring Little Sheep. Yum!Brands has a market cap of US$25bn and is trading at 18.7x FY11 and 16.6xFY12 PE, according to Deutsche Bank forecasts.
Valuation assumptions on different offer prices
Source: Deutsche Bank
Anne LingResearch Analyst(+852) 2203 [email protected]
Mabel Wong, CFAResearch Analyst(+852) 2203 [email protected]
3 May 2011 Strategy Asia Equities Daily Focus
Deutsche Bank AG/Hong Kong Page 23
Asia Korea, Republic of Automobiles & Components
2 May 2011
Korean autos Carmakers' domestic sales up 3%, global sales up 11% YoYSanjeev Rana Research Analyst (+82) 2 316 8910 [email protected]
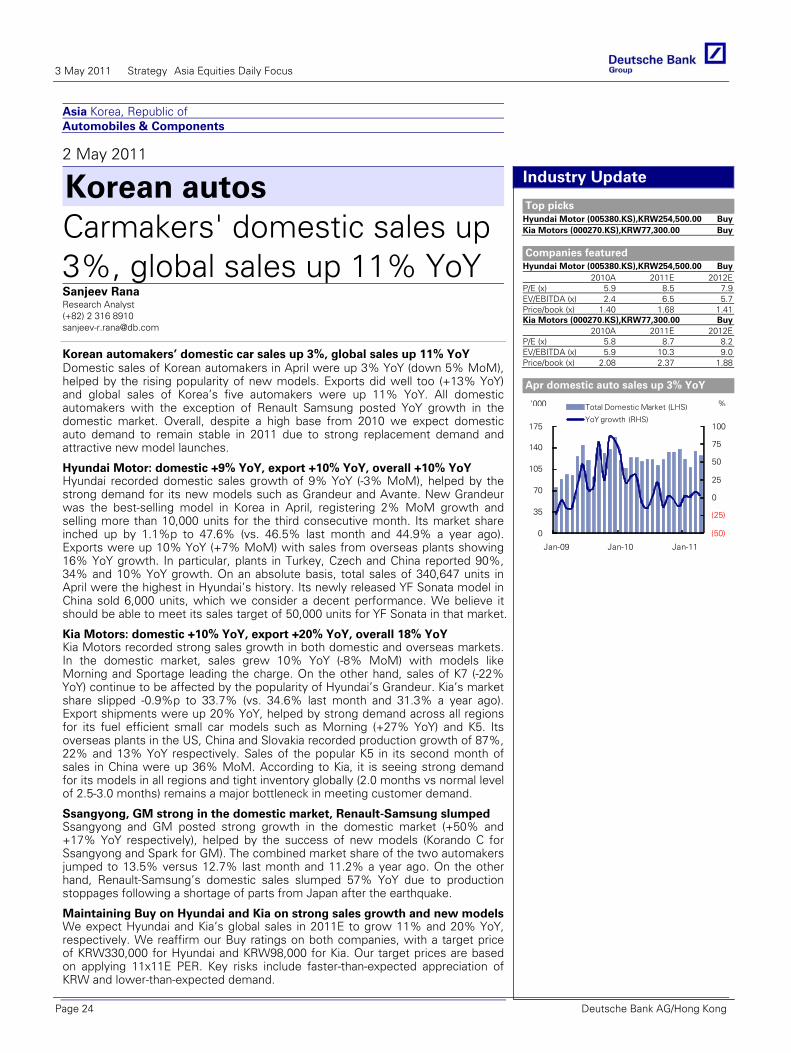
Korean automakers’ domestic car sales up 3%, global sales up 11% YoY Domestic sales of Korean automakers in April were up 3% YoY (down 5% MoM), helped by the rising popularity of new models. Exports did well too (+13% YoY) and global sales of Korea’s five automakers were up 11% YoY. All domestic automakers with the exception of Renault Samsung posted YoY growth in the domestic market. Overall, despite a high base from 2010 we expect domestic auto demand to remain stable in 2011 due to strong replacement demand and attractive new model launches.
Deutsche Bank AG/Hong Kong
Industry Update
Top picks Hyundai Motor (005380.KS),KRW254,500.00 BuyKia Motors (000270.KS),KRW77,300.00 Buy
Companies featured
Hyundai Motor (005380.KS),KRW254,500.00 Buy2010A 2011E 2012E
P/E (x) 5.9 8.5 7.9EV/EBITDA (x) 2.4 6.5 5.7Price/book (x) 1.40 1.68 1.41Kia Motors (000270.KS),KRW77,300.00 Buy
2010A 2011E 2012EP/E (x) 5.8 8.7 8.2EV/EBITDA (x) 5.9 10.3 9.0Price/book (x) 2.08 2.37 1.88
Apr domestic auto sales up 3% YoY
(50)
(25)
0
25
50
75
100
0
35
70
105
140
175
Jan-09 Jan-10 Jan-11
Total Domestic Market (LHS)
YoY growth (RHS)
'000 %
Glo
bal
Mar
kets
Res
earc
h
Hyundai Motor: domestic +9% YoY, export +10% YoY, overall +10% YoY Hyundai recorded domestic sales growth of 9% YoY (-3% MoM), helped by the strong demand for its new models such as Grandeur and Avante. New Grandeur was the best-selling model in Korea in April, registering 2% MoM growth and selling more than 10,000 units for the third consecutive month. Its market share inched up by 1.1%p to 47.6% (vs. 46.5% last month and 44.9% a year ago). Exports were up 10% YoY (+7% MoM) with sales from overseas plants showing 16% YoY growth. In particular, plants in Turkey, Czech and China reported 90%, 34% and 10% YoY growth. On an absolute basis, total sales of 340,647 units in April were the highest in Hyundai’s history. Its newly released YF Sonata model in China sold 6,000 units, which we consider a decent performance. We believe it should be able to meet its sales target of 50,000 units for YF Sonata in that market.
Kia Motors: domestic +10% YoY, export +20% YoY, overall 18% YoY Kia Motors recorded strong sales growth in both domestic and overseas markets. In the domestic market, sales grew 10% YoY (-8% MoM) with models like Morning and Sportage leading the charge. On the other hand, sales of K7 (-22% YoY) continue to be affected by the popularity of Hyundai’s Grandeur. Kia’s market share slipped -0.9%p to 33.7% (vs. 34.6% last month and 31.3% a year ago). Export shipments were up 20% YoY, helped by strong demand across all regions for its fuel efficient small car models such as Morning (+27% YoY) and K5. Its overseas plants in the US, China and Slovakia recorded production growth of 87%, 22% and 13% YoY respectively. Sales of the popular K5 in its second month of sales in China were up 36% MoM. According to Kia, it is seeing strong demand for its models in all regions and tight inventory globally (2.0 months vs normal level of 2.5-3.0 months) remains a major bottleneck in meeting customer demand.
Ssangyong, GM strong in the domestic market, Renault-Samsung slumped Ssangyong and GM posted strong growth in the domestic market (+50% and +17% YoY respectively), helped by the success of new models (Korando C for Ssangyong and Spark for GM). The combined market share of the two automakers jumped to 13.5% versus 12.7% last month and 11.2% a year ago. On the other hand, Renault-Samsung’s domestic sales slumped 57% YoY due to production stoppages following a shortage of parts from Japan after the earthquake.
Maintaining Buy on Hyundai and Kia on strong sales growth and new models We expect Hyundai and Kia’s global sales in 2011E to grow 11% and 20% YoY, respectively. We reaffirm our Buy ratings on both companies, with a target price of KRW330,000 for Hyundai and KRW98,000 for Kia. Our target prices are based on applying 11x11E PER. Key risks include faster-than-expected appreciation of KRW and lower-than-expected demand.
3 May 2011 Strategy Asia Equities Daily Focus
Page 24 Deutsche Bank AG/Hong Kong
Asia ASEAN MalaysiaTransportation Air
02 May 2011 - 06:24:42 PM GMT
COMPANY ALERT Company Update
AirAsia Buy
AirAsia to implement fuel surcharge from 3 May 2011
Reuters:AIRA.KL Exchange:KLS Ticker:AIRA
Price (MYR) 2.87
Price target (MYR) 3.02
52-week range (MYR) 3.04 - 1.11
Market cap (USDm) 2,679
Shares outstanding (m) 2,765.4
Net debt/equity (%) 153.2
Book value/share (MYR) 1.60
Price/book (x) 1.8
FYE 12/31 2010A 2011E 2012E
Sales(MYRm)
3,993 4,650 5,315
Net Profit(MYRm)
1,066.9 791.0 964.9
DB EPS(MYR)
0.29 0.24 0.30
PER (x) 5.9 11.8 9.5
Yield (net)(%)
0.0 0.0 0.0
AirAsia announced that the company will be reintroducing fuel surchargesbeginning 3 May 2011 for all domestic and international routes. The rein-troduction of fuel surcharge is to offset the escalating jet fuel price, whichhas exceeded USD$140 per barrel. All domestic flights and internationalflights under two hours will be imposed with a RM10 fuel surcharge oneway, RM20 (one way) for flights between two and three hours and RM30(one way) for flights above three hours. Meanwhile, long-haul affiliate AirA-sia X will impose fuel surcharge ranging from RM50 to RM90 per waydepending on destination.AirAsia abolished fuel surcharge in November2008. (Source:Press Statement)
DB View: Although fuel surcharge is a bad news to consumers, we are ofthe view that financially, the implementation of fuel surcharge is positive forAirAsia as it should help ease margin pressure from the high jetfuel costs.The fuel surcharge accounts for 5-16% of DB FY11E average fare. Whilethe consumer base for LCCs are known to be more price sensitive, wemaintain our view that AirAsia will be able to sustain a 78% load factor andcarry 9% more passenger in FY11E. Besides the 20-30% cost savings (vsfull service carriers), we believe low cost carriers (LCCs) now appeal not justto budget travel but consumers from all walks of life due to better routeconnectivity and more flight frequencies. We also note that in 2008, despitethe implementation of fuel surcharge, there was no negative impact to de-mand. Instead, AirAisa saw a 22% YoY increase in passengers carried onthe back of a 29% YoY increase in capacity. AirAsia has hedged 21% of itsfuel requirements up to 2Q11 at an average of US$92/bbl of fixed swap WTI.Our sensitivity analysis suggests that every 1ppt increase in load factor willincrease DBe FY11 NP ex EI by 8.2% while every US$1/bbl increase in jet-fuel will lead to a 2.1% decline in DBe FY11 NP ex EI.Maintain Buy on AirAsia. Currently trading at 8.4x FY11E adjusted EV/EBIT-DAR, the stock offers a 21% 2-year (FY11-13E) EBITDA CAGR (vs peeraverage of 9.4%). Strong quarterly earnings and news flow from the detailsof the listing of its associates are key catalysts. Key risks: 1) volatile fuelprices, 2) irrational price competition in the industry and 3) delay in the listingof its associates.
Michelle FoongResearch Analyst(+60) 3 2053 [email protected]
3 May 2011 Strategy Asia Equities Daily Focus
Deutsche Bank AG/Hong Kong Page 25
Asia ASEAN Malaysia Consumer
2 May 2011
Asian Palm Oil Industry Demand strength to offset near-term price weaknessEltricia Foong, CFA Research Analyst (+60) 3 2053 6760 [email protected]
Remain positive on long-term fundamentals We are still positive on palm oil's long-term fundamentals as limited new planting should restrict future supply growth. However, we expect short-term weakness in the CPO price due to strong recovery in production. We like upstream producers that could cushion a softer price via stronger output growth. GAR, KLK and AALI are our preferred picks. YTD CPO price is RM3,550/MT, while our assumptions remain unchanged at RM3,300/MT and RM3,200/MT for 2011 and 2012, respectively. We introduce a 2013 price assumption of RM3,400/MT.
Deutsche Bank AG/Hong Kong
Forecast Change
Top picks Golden Agri-Resources (GAGR.SI),SGD0.66 BuyKuala Lumpur Kepong (KLKK.KL),MYR21.12 BuyAstra Agro Lestari (AALI.JK),IDR23,150.00 Buy
Companies featured
Golden Agri-Resources (GAGR.SI),SGD0.66 Buy2010A 2011E 2012E
P/E (x) 13.7 13.6 13.0EV/EBITDA (x) 10.2 9.5 9.1Price/book (x) 1.0 0.9 0.8Kuala Lumpur Kepong (KLKK.KL),MYR21.12 Buy
2010A 2011E 2012EP/E (x) 17.2 17.5 16.6EV/EBITDA (x) 11.8 11.8 11.3Price/book (x) 3.0 3.4 3.1Astra Agro Lestari (AALI.JK),IDR23,150.00 Buy
2010A 2011E 2012EP/E (x) 17.7 12.2 9.9EV/EBITDA (x) 10.4 7.3 5.8Price/book (x) 5.72 4.34 3.65Sime Darby Bhd (SIME.KL),MYR9.02 Hold
2010A 2011E 2012EP/E (x) 70.2 16.6 14.0EV/EBITDA (x) 18.7 10.6 9.3Price/book (x) 2.4 2.5 2.3IOI Corp (IOIB.KL),MYR5.29 Hold
2010A 2011E 2012EP/E (x) 17.1 15.0 14.1EV/EBITDA (x) 12.2 10.6 10.1Price/book (x) 3.0 2.8 2.5Wilmar International (WLIL.SI),SGD5.27 Hold
2010A 2011E 2012EP/E (x) 22.9 16.8 14.7EV/EBITDA (x) 23.0 15.8 14.3Price/book (x) 2.2 2.1 1.9
Change in target price
New TP Old TP RatingGAR 0.90 0.90 BuyKLK 25.40 25.40 BuyAALI 32,150 32,150 BuyIOI 5.50 6.20 HoldSime 9.20 9.20 HoldWilmar 5.20 5.30 Hold
Moving into high production period We expect palm oil production to rise until 3Q11. Apart from a recovery in the biological yield cycle, productivity should also improve in more favourable weather conditions. Production growth in Indonesia is likely to be higher this year due to the maturity of young areas planted in 2007/08. However, in the longer run, we expect production growth to be affected by the limited new planting that occurred in 2009, leading to a slower pace of growth in supply for 2013. We project global stock usage for palm oil to rise to 16.1% in 2012 before falling to 15.5% in 2013.
Tight supply condition in the oilseeds market We believe a number of temporary factors have contributed to the soybean price weakness, including a better-than-expected harvest in Brazil and softer demand in China due to government intervention. However, we expect the supply conditions to remain tight in 2011 due to lower US production and additional demand from the biofuel industry. We also expect China to resume stockpiling activities ahead of the festive season in 3Q. Meanwhile, weaker crop prospects for rapeseed should lead to an increase in global dependence on soybean.
Accumulate high-growth names on price weakness in the near term Although we expect CPO price to weaken on strong recovery in production, a widening price discount to soybean oil should stimulate demand for palm oil. Meanwhile, strong output growth should help cushion a softer CPO price. We like upstream players such as GAR, KLK and AALI, which could deliver above-average production growth. We expect these three upstream producers to chalk up annual output growth of 9-12% for 2011-12 (vs. 6-8% industry average), underpinned by higher mature acreage and yield. AALI trades at what we see as an undemanding valuation of 12x PER while GAR’s valuation looks supported at 13x PER. We believe KLK’s premium valuation is justified by a strong management track record, a balanced mix of plantation assets in Indonesia and Malaysia and a relatively rich valuation of the Malaysian market. We have Buys on GAR, KLK and AALI, which we regard as high-growth names; we would see them as particularly attractive for investors to accumulate on any price weakness in the near term. Wilmar should benefit from stronger CPO supply and a wider price discount; thus, we expect a higher contribution from its palm refining business. Although the oilseeds division should return to the black, overall performance will likely remain lacklustre due to poor crushing margins and government intervention in China. The current 16x PER mid-cycle valuation appears fair. We maintain Hold on Wilmar. Due to relatively lower output growth and diversification into non-plantation businesses, we retain Hold ratings on IOI and Sime. We value these stocks on PER; key risks include palm production recovery, weather conditions, planting delays, demand rationing. This report changes ratings, price targets, and/or estimates for one or more companies under coverage. For details on these changes, see pages 12-13.
3 May 2011 Strategy Asia Equities Daily Focus
Page 26 Deutsche Bank AG/Hong Kong
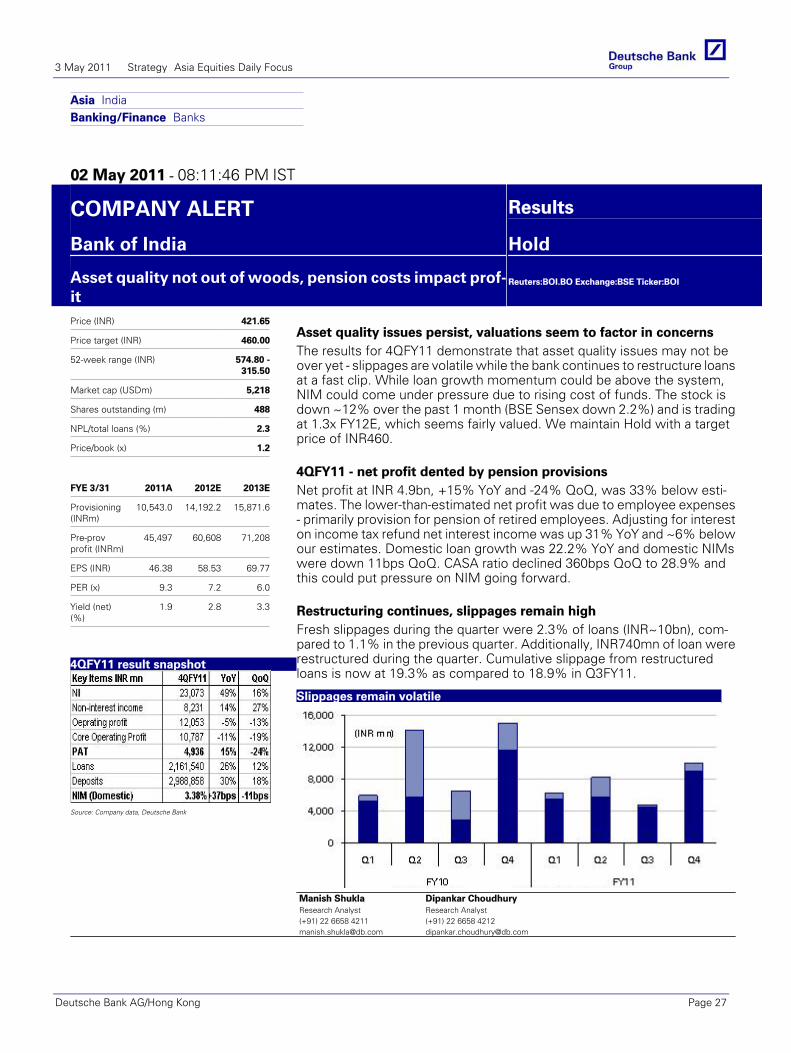
Asia IndiaBanking/Finance Banks
02 May 2011 - 08:11:46 PM IST
COMPANY ALERT Results
Bank of India Hold
Asset quality not out of woods, pension costs impact prof‐it
Reuters:BOI.BO Exchange:BSE Ticker:BOI
Price (INR) 421.65
Price target (INR) 460.00
52-week range (INR) 574.80 ‐315.50
Market cap (USDm) 5,218
Shares outstanding (m) 488
NPL/total loans (%) 2.3
Price/book (x) 1.2
FYE 3/31 2011A 2012E 2013E
Provisioning(INRm)
10,543.0 14,192.2 15,871.6
Pre-provprofit (INRm)
45,497 60,608 71,208
EPS (INR) 46.38 58.53 69.77
PER (x) 9.3 7.2 6.0
Yield (net)(%)
1.9 2.8 3.3
4QFY11 result snapshot
Source: Company data, Deutsche Bank
Asset quality issues persist, valuations seem to factor in concernsThe results for 4QFY11 demonstrate that asset quality issues may not beover yet - slippages are volatile while the bank continues to restructure loansat a fast clip. While loan growth momentum could be above the system,NIM could come under pressure due to rising cost of funds. The stock isdown ~12% over the past 1 month (BSE Sensex down 2.2%) and is tradingat 1.3x FY12E, which seems fairly valued. We maintain Hold with a targetprice of INR460.
4QFY11 ‐ net profit dented by pension provisionsNet profit at INR 4.9bn, +15% YoY and -24% QoQ, was 33% below esti-mates. The lower-than-estimated net profit was due to employee expenses- primarily provision for pension of retired employees. Adjusting for intereston income tax refund net interest income was up 31% YoY and ~6% belowour estimates. Domestic loan growth was 22.2% YoY and domestic NIMswere down 11bps QoQ. CASA ratio declined 360bps QoQ to 28.9% andthis could put pressure on NIM going forward.
Restructuring continues, slippages remain highFresh slippages during the quarter were 2.3% of loans (INR~10bn), com-pared to 1.1% in the previous quarter. Additionally, INR740mn of loan wererestructured during the quarter. Cumulative slippage from restructuredloans is now at 19.3% as compared to 18.9% in Q3FY11.
Slippages remain volatile
Source: Company data, Deutsche Bank
Manish ShuklaResearch Analyst(+91) 22 6658 [email protected]
Dipankar ChoudhuryResearch Analyst(+91) 22 6658 [email protected]
3 May 2011 Strategy Asia Equities Daily Focus
Deutsche Bank AG/Hong Kong Page 27
Asia IndiaProperty Property
02 May 2011 - 03:51:07 PM IST
COMPANY ALERT Results
Indiabulls Real Estate Buy
Weak 4Q despite robust execution
Reuters:INRL.BO Exchange:BSE Ticker:INRL
Price (INR) 125.00
Price target (INR) 290.00
52-week range (INR) 212.15 -103.15
Market cap (USDm) 1,134
Shares outstanding (m) 401.1
Net debt/equity (%) -60.0
Book value/share (INR) 245.55
Price/book (x) 0.5
FYE 3/31 2010A 2011E 2012E
Sales (INRm) 1,294 9,532 12,827
Net Profit(INRm)
-240.0 2,463.0 3,199.4
DB EPS(INR)
-0.60 6.14 7.98
PER (x) – 20.4 15.7
Yield (net) 0.5 0.8 1.6
Lower volumes, but higher pricesindicate better product mix
Source: Company, Deutsche Bank
Weak 4Q: Revenue and PAT grew qoq by 54% and -53% respectively. Ex-cluding the demerged Indiabulls Wholesale Services in current 4Q; rev-enues, EBITDA and PAT grew by 34%, -31% and -85% respectively. Withlow-margin projects in Tier-II cities flowing into P&L, RM/ revenues spikedby ~1120bp and EBITDA margin halved to 17.3%. It now seems to becharging most of its interest expense through the P&L - interest expense(of INR 0.46bn) was annualized ~10% of its average non-project specificdebt of INR 18.5bn for 4Q.
Robust execution continues: (1) Robust execution across geographies,with more projects (Ahmedabad, Madurai, etc) crossing revenue recogni-tion threshold. We believe that high-margin Mumbai residential project (atLower Parel) will cross revenue recognition threshold in next 2-3 quartersdriving profits. However as these are held by IPIT (Singapore listed asso-ciate), they will flow-in as Associates. (2) Post seasonally strong 3Q(2.27msf), presales declined to 1.18msf. Despite limited pre-sales fromhigh-end Lower Parel, average realisation rose 24% to INR 4,746/sf. (3)Leasing of office space at Lower Parel remains lackluster - 0.2msf in 4Q.Thus 0.85msf of 2.45msf completed space is vacant with another 0.85msfto be delivered by Jun'11e. (4) With 0.65msf of deliveries in 3Q, Area UnderDevelopment and Under Construction has been largely flat at ~60msf and17msf respectively. (5) While debtors increased ~INR 1.9bn qoq, they re-mained at ~3m of annualized revenue for the quarter. Net debt and netgearing were maintained at ~INR 12bn and 18% respectively. (6) Demergerof IPL is online for Sept'11e completion - board approval in 3Q & stockexchange approval in 4Q. (7) Robust execution at IPL continues - (a) debtdraw down of INR 21bn (INR 7.25bn in 3Q) (b) achieves financial closure ofP-II of Amravati (1350MW).
IBREL: Trend in interims
Source: Company, Deutsche BankAbhay ShanbhagResearch Analyst(+91) 22 6658 [email protected]
Mayank KankariaResearch Associate(+91) 22 6658 [email protected]
3 May 2011 Strategy Asia Equities Daily Focus
Page 28 Deutsche Bank AG/Hong Kong
Co
mp
any Asia India
Consumer Retail/Wholesale Trade
02 May 2011 - 04:10:26 PM IST
Glo
bal
Mar
kets
Res
earc
h
COMPANY ALERT Results
Marico Limited Buy
Strong operational numbers clouded by one offs. Maintainbuy
Reuters:MRCO.BO Exchange:BSE Ticker:MRCO
Price (INR) 139.70
Price target (INR) 150.00
52-week range (INR) 147.55 -100.55
Market cap (USDm) 1,924
Shares outstanding (m) 609.3
Net debt/equity (%) 15.7
Book value/share (INR) 15.11
Price/book (x) 9.2
FYE 3/31 2010A 2011E 2012E
Sales (INRm) 26,608 32,250 38,148
Net Profit(INRm)
2,316.9 3,158.7 3,990.7
DB EPS(INR)
3.96 5.18 6.55
PER (x) 22.5 26.9 21.3
Yield (net)(%)
0.7 0.5 0.5
Marico reported strong operational numbers with 29% sales growth,19% PBT (ex-non-recurring) in line with our estimates.
Key highlights of the 4 Quarter results -* Volume growth in parachute of 5% for rigid packs (1% overall vs 1%DB estimate) despite 32% price hike. The market share for coconut oil busi-ness increased from 52.4% in 3QFY11 to 52.6% in 4QFY11.* 14% volume growth in Saffola (vs 13% DBe)* 21% volume growth in other hair oil business (vs 15% DBe)* Gross Margins down 680 bps YoY but up 202 bps QoQ due to veryhigh gross margins in 4QFY10 where there was little below the line activity.In line with other FMCG companies, ad expense is cut by 25% YoY.
Details of non recurring expense not booked under exceptionalitems)
Note (1) INR 313.2mn Kaya revenue should be added for like to like com-parison. This revenue has been classified as advances from customers nowwhereas it used to be booked as revenue earlier.
Note (2) INR 30.94mn additional depreciation charged for Kaya businessequipments due to change in estimated life of the equipment.
Note (3) INR 95.3mn additional amortization charged for intangibles itemsso as to for Kaya business and goodwill due to International acqusitions
Note (4) INR 11 mn charged in 4QFY10 for CNO provision (excise duty pro-vision on coconut oil packs below 200 ml) to be stripped out from otherexpense in 4QFY10 as this year there was no provision made.We maintain buy with a TP of INR 150. We await more clarity during con-ference call scheduled at 6:00 pm IST
Source: Deutsche Bank, company data
Gaurav BhatiaResearch Associate(+91) 22 6658 [email protected]
Harrish ZaveriResearch Analyst(+91) 22 6658 [email protected]
3 May 2011 Strategy Asia Equities Daily Focus
Deutsche Bank AG/Hong Kong Page 29
Asia IndiaHealth Care Pharmaceuticals/Biotechnolo‐gy
02 May 2011 - 09:48:35 AM IST
COMPANY ALERT Breaking News
Sun Pharma Hold
Concerns on promoter diversifying into power are unwar‐ranted
Reuters:SUN.BO Exchange:BSE Ticker:SUN
Price (INR) 465.10
Price target (INR) 430.00
52‐week range (INR) 499.70 ‐305.65
Market cap (USDm) 10,893
Shares outstanding (m) 1,035.6
Net debt/equity (%) ‐36.8
Book value/share (INR) 90.88
Price/book (x) 5.1
FYE 3/31 2010A 2011E 2012E
Sales (INRm) 40,086 57,120 73,416
Net Profit(INRm)
12,763.8 17,269.3 21,972.6
DB EPS(INR)
12.47 16.68 21.22
PER (x) 21.9 27.9 21.9
Yield (net)(%)
1.0 0.8 1.0
Promoters investing into power: Press (Economic Times, 2 May'11) re‐ports that the promoters of Sun are proposing to diversify into power bysetting up a 1000MW power plant at a cost of ~INR 50bn (~USD 1.1bn).
Concerns seem unwarranted ‐ (a) Sun has a clear growth strategy: Sunhas been the best performing India Pharma company in last 2 decades witha clear focus on 2 key markets (India and US), on chronic therapies (CNS,cardiovascular, diabetes) in India and niche differentiated products in US(controlled substances, dermatologicals, etc) and focus on costs.Despite its war‐chest (~USD 800m), Sun could not focus on acquisitionsdue to limited management bandwidth and focus on other issues (com‐pleting Taro acquisition & addressing US FDA quality issues at Caraco, itsUS listed subsidiary). In Apr'10, it roped in Mr Kal Sundaram (ex CEO of GSKIndia) as CEO. In Sept'10, it finally acquired Taro. Caraco now seems on adefinite path of addressing its US FDA issues. With the constraints beingaddressed, we believe that Sun will now clearly focus on acquisitions.On 11 Apr'11, Sun announced a JV with Merck (MSD) for development ofdifferentiated brands for emerging markets. This was followed up on 26Apr'11 by Sun entering into a co‐marketing deal for 2 branded oral anti‐diabetes drugs (sitagliptin, sitagliptin + metformin) in India. Sun will sourcethese patent protected drugs in India from MSD and sell in its own brandnames. With new product launch in Indian market expected to be difficultin next 2‐3 years (post the tightening patent regime), we believe that inli‐censing deals like these will drive growth in the medium‐term.
(b) Significant cash with promoters: Promoter group holds ~64% stakein Sun (mkt cap of ~USD 10bn) on which they receive USD 40m+ as divi‐dend. With Sun not requiring any equity infusion, we believe that thepromoter family would have significant cash.
(c) Ability to maintain arms length relationships: Despite being in similarbusiness, Sun was able to keep an arm's length relationships with Caraco(its listed pharma subsidiary in US). It is the only India Pharma company thatentirely demerged its basic R&D company (as SPARC) allowing sharehold‐ers to hold either of the 2 companies with no relationship between them.SPARC was significantly capitalised during demerger (May'07) to enable itto chart its independent course.Abhay ShanbhagResearch Analyst(+91) 22 6658 [email protected]
Mayank KankariaResearch Associate(+91) 22 6658 [email protected]
3 May 2011 Strategy Asia Equities Daily Focus
Page 30 Deutsche Bank AG/Hong Kong
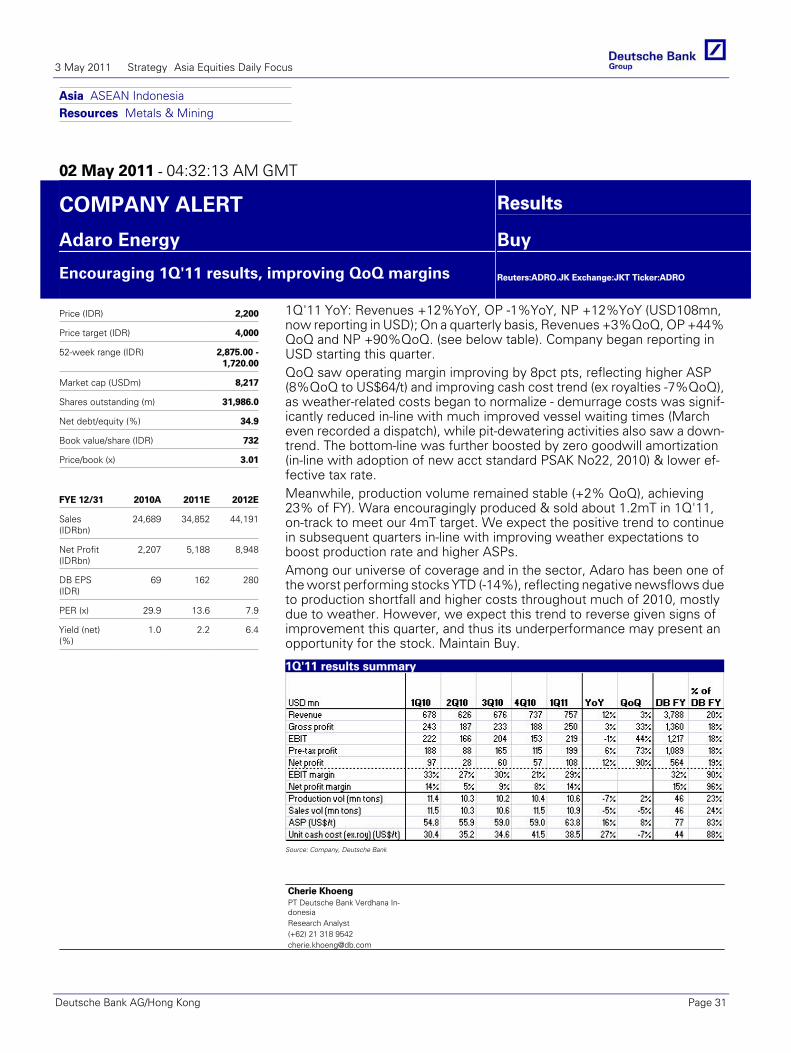
Asia ASEAN IndonesiaResources Metals & Mining
02 May 2011 - 04:32:13 AM GMT
COMPANY ALERT Results
Adaro Energy Buy
Encouraging 1Q'11 results, improving QoQ margins
Reuters:ADRO.JK Exchange:JKT Ticker:ADRO
Price (IDR) 2,200
Price target (IDR) 4,000
52-week range (IDR) 2,875.00 -1,720.00
Market cap (USDm) 8,217
Shares outstanding (m) 31,986.0
Net debt/equity (%) 34.9
Book value/share (IDR) 732
Price/book (x) 3.01
FYE 12/31 2010A 2011E 2012E
Sales(IDRbn)
24,689 34,852 44,191
Net Profit(IDRbn)
2,207 5,188 8,948
DB EPS(IDR)
69 162 280
PER (x) 29.9 13.6 7.9
Yield (net)(%)
1.0 2.2 6.4
1Q'11 YoY: Revenues +12%YoY, OP -1%YoY, NP +12%YoY (USD108mn,now reporting in USD); On a quarterly basis, Revenues +3%QoQ, OP +44%QoQ and NP +90%QoQ. (see below table). Company began reporting inUSD starting this quarter.QoQ saw operating margin improving by 8pct pts, reflecting higher ASP(8%QoQ to US$64/t) and improving cash cost trend (ex royalties -7%QoQ),as weather-related costs began to normalize - demurrage costs was signif-icantly reduced in-line with much improved vessel waiting times (Marcheven recorded a dispatch), while pit-dewatering activities also saw a down-trend. The bottom-line was further boosted by zero goodwill amortization(in-line with adoption of new acct standard PSAK No22, 2010) & lower ef-fective tax rate.Meanwhile, production volume remained stable (+2% QoQ), achieving23% of FY). Wara encouragingly produced & sold about 1.2mT in 1Q'11,on-track to meet our 4mT target. We expect the positive trend to continuein subsequent quarters in-line with improving weather expectations toboost production rate and higher ASPs.Among our universe of coverage and in the sector, Adaro has been one ofthe worst performing stocks YTD (-14%), reflecting negative newsflows dueto production shortfall and higher costs throughout much of 2010, mostlydue to weather. However, we expect this trend to reverse given signs ofimprovement this quarter, and thus its underperformance may present anopportunity for the stock. Maintain Buy.
1Q'11 results summary
Source: Company, Deutsche Bank
Cherie KhoengPT Deutsche Bank Verdhana In-donesiaResearch Analyst(+62) 21 318 [email protected]
3 May 2011 Strategy Asia Equities Daily Focus
Deutsche Bank AG/Hong Kong Page 31
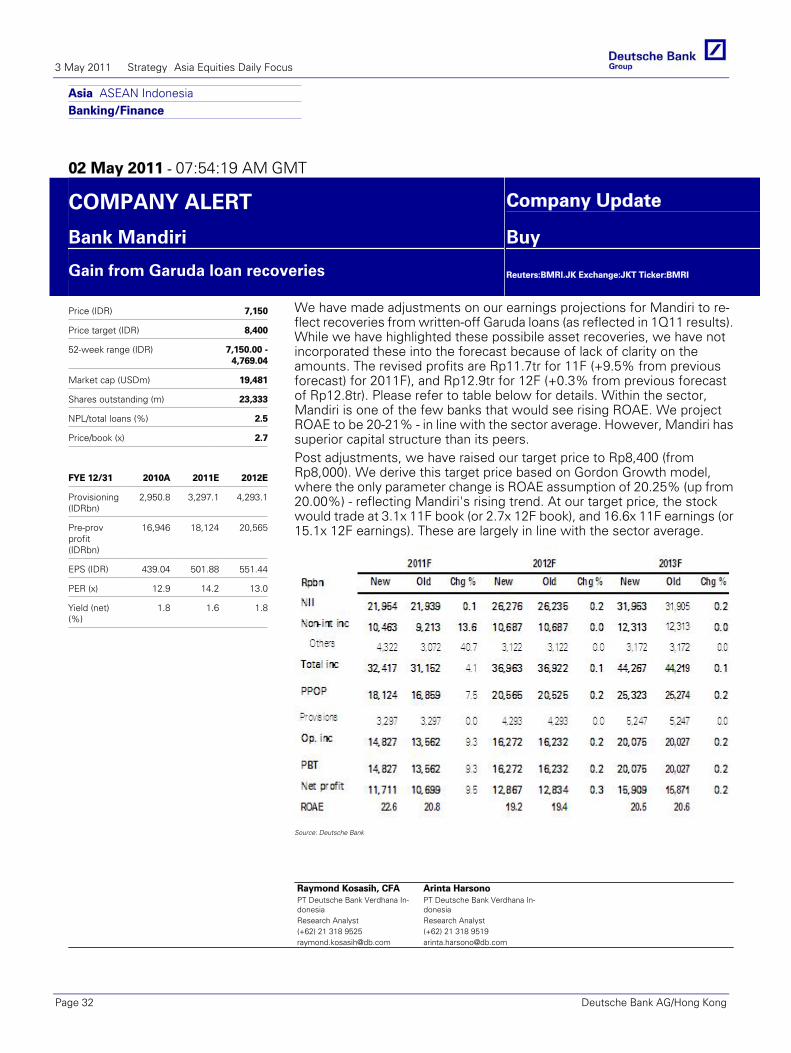
Asia ASEAN IndonesiaBanking/Finance
02 May 2011 - 07:54:19 AM GMT
COMPANY ALERT Company Update
Bank Mandiri Buy
Gain from Garuda loan recoveries
Reuters:BMRI.JK Exchange:JKT Ticker:BMRI
Price (IDR) 7,150
Price target (IDR) 8,400
52-week range (IDR) 7,150.00 -4,769.04
Market cap (USDm) 19,481
Shares outstanding (m) 23,333
NPL/total loans (%) 2.5
Price/book (x) 2.7
FYE 12/31 2010A 2011E 2012E
Provisioning(IDRbn)
2,950.8 3,297.1 4,293.1
Pre-provprofit(IDRbn)
16,946 18,124 20,565
EPS (IDR) 439.04 501.88 551.44
PER (x) 12.9 14.2 13.0
Yield (net)(%)
1.8 1.6 1.8
We have made adjustments on our earnings projections for Mandiri to re-flect recoveries from written-off Garuda loans (as reflected in 1Q11 results).While we have highlighted these possibile asset recoveries, we have notincorporated these into the forecast because of lack of clarity on theamounts. The revised profits are Rp11.7tr for 11F (+9.5% from previousforecast) for 2011F), and Rp12.9tr for 12F (+0.3% from previous forecastof Rp12.8tr). Please refer to table below for details. Within the sector,Mandiri is one of the few banks that would see rising ROAE. We projectROAE to be 20-21% - in line with the sector average. However, Mandiri hassuperior capital structure than its peers.Post adjustments, we have raised our target price to Rp8,400 (fromRp8,000). We derive this target price based on Gordon Growth model,where the only parameter change is ROAE assumption of 20.25% (up from20.00%) - reflecting Mandiri's rising trend. At our target price, the stockwould trade at 3.1x 11F book (or 2.7x 12F book), and 16.6x 11F earnings (or15.1x 12F earnings). These are largely in line with the sector average.
Source: Deutsche Bank
Raymond Kosasih, CFAPT Deutsche Bank Verdhana In-donesiaResearch Analyst(+62) 21 318 [email protected]
Arinta HarsonoPT Deutsche Bank Verdhana In-donesiaResearch Analyst(+62) 21 318 [email protected]
3 May 2011 Strategy Asia Equities Daily Focus
Page 32 Deutsche Bank AG/Hong Kong
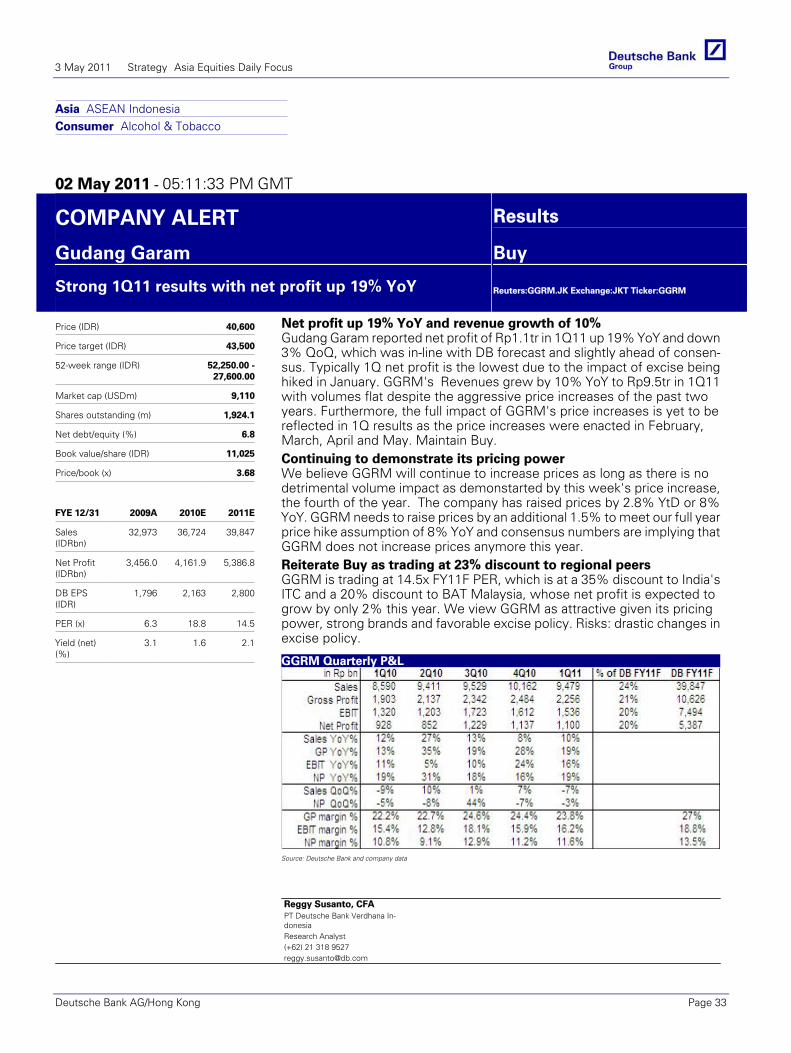
Asia ASEAN IndonesiaConsumer Alcohol & Tobacco
02 May 2011 - 05:11:33 PM GMT
COMPANY ALERT Results
Gudang Garam Buy
Strong 1Q11 results with net profit up 19% YoY
Reuters:GGRM.JK Exchange:JKT Ticker:GGRM
Price (IDR) 40,600
Price target (IDR) 43,500
52-week range (IDR) 52,250.00 -27,600.00
Market cap (USDm) 9,110
Shares outstanding (m) 1,924.1
Net debt/equity (%) 6.8
Book value/share (IDR) 11,025
Price/book (x) 3.68
FYE 12/31 2009A 2010E 2011E
Sales(IDRbn)
32,973 36,724 39,847
Net Profit(IDRbn)
3,456.0 4,161.9 5,386.8
DB EPS(IDR)
1,796 2,163 2,800
PER (x) 6.3 18.8 14.5
Yield (net)(%)
3.1 1.6 2.1
Net profit up 19% YoY and revenue growth of 10%Gudang Garam reported net profit of Rp1.1tr in 1Q11 up 19% YoY and down3% QoQ, which was in-line with DB forecast and slightly ahead of consen-sus. Typically 1Q net profit is the lowest due to the impact of excise beinghiked in January. GGRM's Revenues grew by 10% YoY to Rp9.5tr in 1Q11with volumes flat despite the aggressive price increases of the past twoyears. Furthermore, the full impact of GGRM's price increases is yet to bereflected in 1Q results as the price increases were enacted in February,March, April and May. Maintain Buy.Continuing to demonstrate its pricing powerWe believe GGRM will continue to increase prices as long as there is nodetrimental volume impact as demonstarted by this week's price increase,the fourth of the year. The company has raised prices by 2.8% YtD or 8%YoY. GGRM needs to raise prices by an additional 1.5% to meet our full yearprice hike assumption of 8% YoY and consensus numbers are implying thatGGRM does not increase prices anymore this year.Reiterate Buy as trading at 23% discount to regional peersGGRM is trading at 14.5x FY11F PER, which is at a 35% discount to India'sITC and a 20% discount to BAT Malaysia, whose net profit is expected togrow by only 2% this year. We view GGRM as attractive given its pricingpower, strong brands and favorable excise policy. Risks: drastic changes inexcise policy.
GGRM Quarterly P&L
Source: Deutsche Bank and company data
Reggy Susanto, CFAPT Deutsche Bank Verdhana In-donesiaResearch Analyst(+62) 21 318 [email protected]
3 May 2011 Strategy Asia Equities Daily Focus
Deutsche Bank AG/Hong Kong Page 33
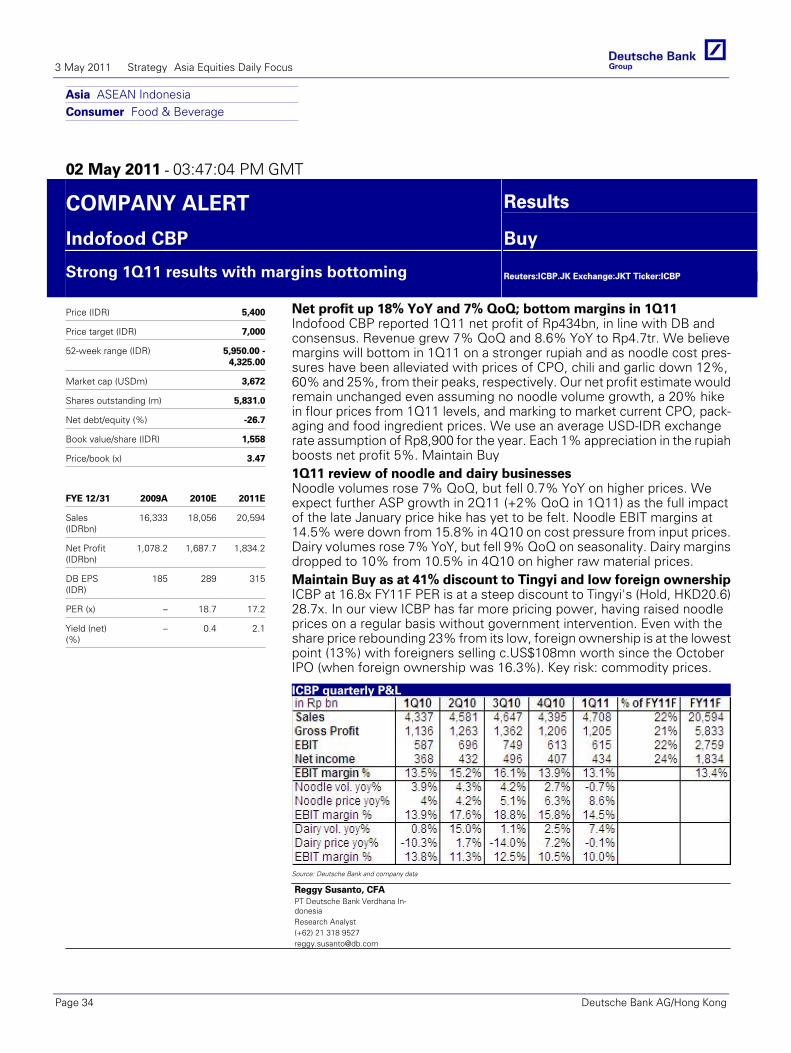
Asia ASEAN IndonesiaConsumer Food & Beverage
02 May 2011 - 03:47:04 PM GMT
COMPANY ALERT Results
Indofood CBP Buy
Strong 1Q11 results with margins bottoming
Reuters:ICBP.JK Exchange:JKT Ticker:ICBP
Price (IDR) 5,400
Price target (IDR) 7,000
52-week range (IDR) 5,950.00 -4,325.00
Market cap (USDm) 3,672
Shares outstanding (m) 5,831.0
Net debt/equity (%) -26.7
Book value/share (IDR) 1,558
Price/book (x) 3.47
FYE 12/31 2009A 2010E 2011E
Sales(IDRbn)
16,333 18,056 20,594
Net Profit(IDRbn)
1,078.2 1,687.7 1,834.2
DB EPS(IDR)
185 289 315
PER (x) – 18.7 17.2
Yield (net)(%)
– 0.4 2.1
Net profit up 18% YoY and 7% QoQ; bottom margins in 1Q11Indofood CBP reported 1Q11 net profit of Rp434bn, in line with DB andconsensus. Revenue grew 7% QoQ and 8.6% YoY to Rp4.7tr. We believemargins will bottom in 1Q11 on a stronger rupiah and as noodle cost pres-sures have been alleviated with prices of CPO, chili and garlic down 12%,60% and 25%, from their peaks, respectively. Our net profit estimate wouldremain unchanged even assuming no noodle volume growth, a 20% hikein flour prices from 1Q11 levels, and marking to market current CPO, pack-aging and food ingredient prices. We use an average USD-IDR exchangerate assumption of Rp8,900 for the year. Each 1% appreciation in the rupiahboosts net profit 5%. Maintain Buy1Q11 review of noodle and dairy businessesNoodle volumes rose 7% QoQ, but fell 0.7% YoY on higher prices. Weexpect further ASP growth in 2Q11 (+2% QoQ in 1Q11) as the full impactof the late January price hike has yet to be felt. Noodle EBIT margins at14.5% were down from 15.8% in 4Q10 on cost pressure from input prices.Dairy volumes rose 7% YoY, but fell 9% QoQ on seasonality. Dairy marginsdropped to 10% from 10.5% in 4Q10 on higher raw material prices.Maintain Buy as at 41% discount to Tingyi and low foreign ownershipICBP at 16.8x FY11F PER is at a steep discount to Tingyi's (Hold, HKD20.6)28.7x. In our view ICBP has far more pricing power, having raised noodleprices on a regular basis without government intervention. Even with theshare price rebounding 23% from its low, foreign ownership is at the lowestpoint (13%) with foreigners selling c.US$108mn worth since the OctoberIPO (when foreign ownership was 16.3%). Key risk: commodity prices.
ICBP quarterly P&L
Source: Deutsche Bank and company data
Reggy Susanto, CFAPT Deutsche Bank Verdhana In-donesiaResearch Analyst(+62) 21 318 [email protected]
3 May 2011 Strategy Asia Equities Daily Focus
Page 34 Deutsche Bank AG/Hong Kong
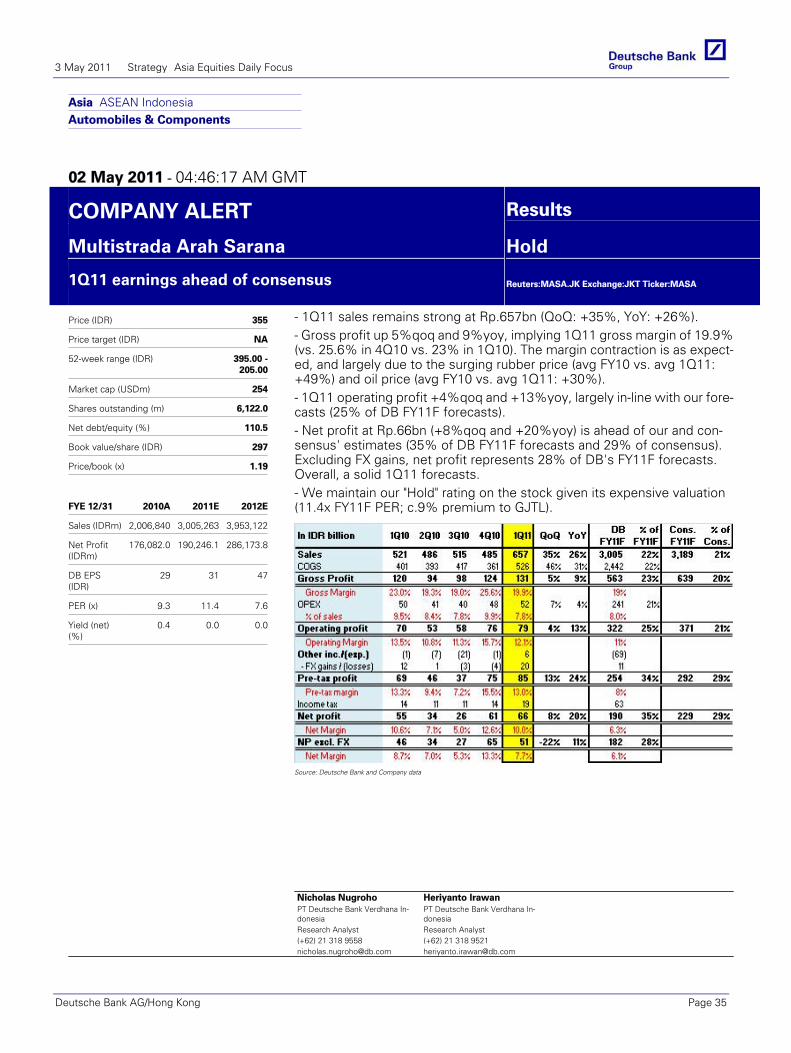
Asia ASEAN IndonesiaAutomobiles & Components
02 May 2011 - 04:46:17 AM GMT
COMPANY ALERT Results
Multistrada Arah Sarana Hold
1Q11 earnings ahead of consensus
Reuters:MASA.JK Exchange:JKT Ticker:MASA
Price (IDR) 355
Price target (IDR) NA
52-week range (IDR) 395.00 -205.00
Market cap (USDm) 254
Shares outstanding (m) 6,122.0
Net debt/equity (%) 110.5
Book value/share (IDR) 297
Price/book (x) 1.19
FYE 12/31 2010A 2011E 2012E
Sales (IDRm) 2,006,840 3,005,263 3,953,122
Net Profit(IDRm)
176,082.0 190,246.1 286,173.8
DB EPS(IDR)
29 31 47
PER (x) 9.3 11.4 7.6
Yield (net)(%)
0.4 0.0 0.0
- 1Q11 sales remains strong at Rp.657bn (QoQ: +35%, YoY: +26%).- Gross profit up 5%qoq and 9%yoy, implying 1Q11 gross margin of 19.9%(vs. 25.6% in 4Q10 vs. 23% in 1Q10). The margin contraction is as expect-ed, and largely due to the surging rubber price (avg FY10 vs. avg 1Q11:+49%) and oil price (avg FY10 vs. avg 1Q11: +30%).- 1Q11 operating profit +4%qoq and +13%yoy, largely in-line with our fore-casts (25% of DB FY11F forecasts).- Net profit at Rp.66bn (+8%qoq and +20%yoy) is ahead of our and con-sensus' estimates (35% of DB FY11F forecasts and 29% of consensus).Excluding FX gains, net profit represents 28% of DB's FY11F forecasts.Overall, a solid 1Q11 forecasts.- We maintain our "Hold" rating on the stock given its expensive valuation(11.4x FY11F PER; c.9% premium to GJTL).
Source: Deutsche Bank and Company data
Nicholas NugrohoPT Deutsche Bank Verdhana In-donesiaResearch Analyst(+62) 21 318 [email protected]
Heriyanto IrawanPT Deutsche Bank Verdhana In-donesiaResearch Analyst(+62) 21 318 [email protected]
3 May 2011 Strategy Asia Equities Daily Focus
Deutsche Bank AG/Hong Kong Page 35
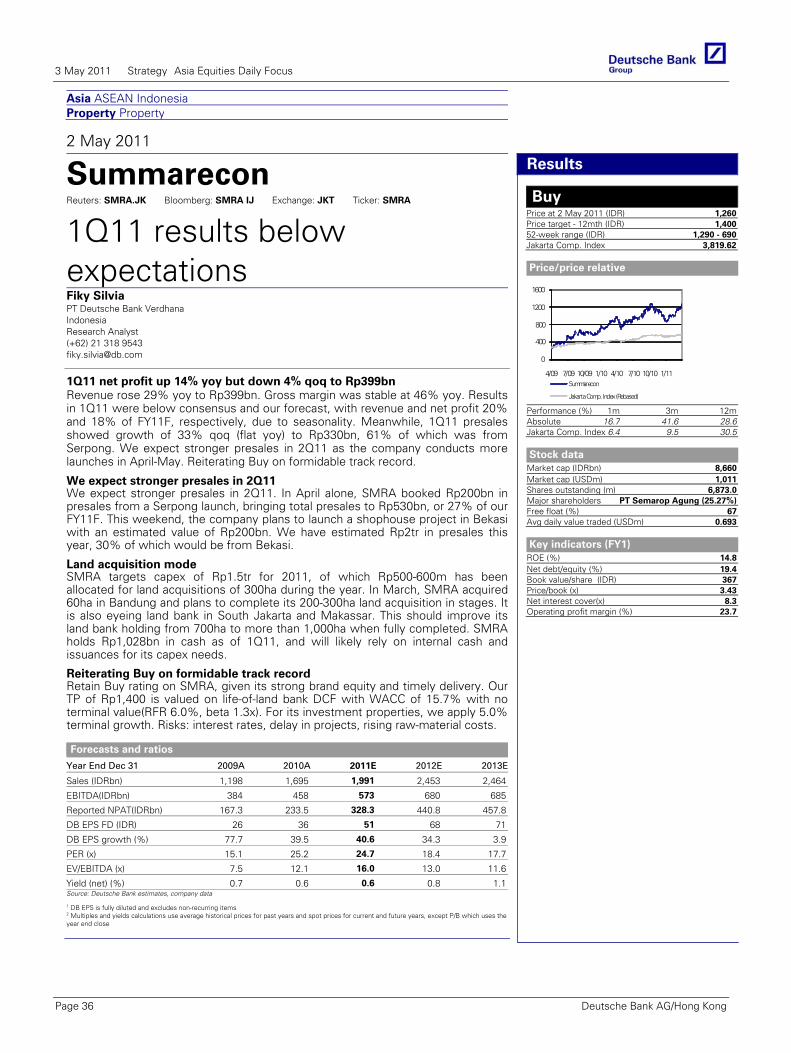
Asia ASEAN Indonesia Property Property
2 May 2011
Summarecon Reuters: SMRA.JK Bloomberg: SMRA IJ Exchange: JKT Ticker: SMRA
1Q11 results below expectationsFiky Silvia PT Deutsche Bank Verdhana Indonesia Research Analyst (+62) 21 318 9543 [email protected]
1Q11 net profit up 14% yoy but down 4% qoq to Rp399bn Revenue rose 29% yoy to Rp399bn. Gross margin was stable at 46% yoy. Results in 1Q11 were below consensus and our forecast, with revenue and net profit 20% and 18% of FY11F, respectively, due to seasonality. Meanwhile, 1Q11 presales showed growth of 33% qoq (flat yoy) to Rp330bn, 61% of which was from Serpong. We expect stronger presales in 2Q11 as the company conducts more launches in April-May. Reiterating Buy on formidable track record.
Forecasts and ratios
Year End Dec 31 2009A 2010A 2011E 2012E 2013E
Sales (IDRbn) 1,198 1,695 1,991 2,453 2,464
EBITDA(IDRbn) 384 458 573 680 685
Reported NPAT(IDRbn) 167.3 233.5 328.3 440.8 457.8
DB EPS FD (IDR) 26 36 51 68 71
DB EPS growth (%) 77.7 39.5 40.6 34.3 3.9
PER (x) 15.1 25.2 24.7 18.4 17.7
EV/EBITDA (x) 7.5 12.1 16.0 13.0 11.6
Yield (net) (%) 0.7 0.6 0.6 0.8 1.1Source: Deutsche Bank estimates, company data
1 DB EPS is fully diluted and excludes non-recurring items 2 Multiples and yields calculations use average historical prices for past years and spot prices for current and future years, except P/B which uses the year end close
Deutsche Bank AG/Hong Kong
Results
Buy Price at 2 May 2011 (IDR) 1,260Price target - 12mth (IDR) 1,40052-week range (IDR) 1,290 - 690Jakarta Comp. Index 3,819.62
Price/price relative
0
400
800
1200
1600
4/09 7/09 10/09 1/10 4/10 7/10 10/10 1/11Summarecon
Jakarta Comp. Index (Rebased)
Performance (%) 1m 3m 12mAbsolute 16.7 41.6 28.6Jakarta Comp. Index 6.4 9.5 30.5
Stock data
Market cap (IDRbn) 8,660Market cap (USDm) 1,011Shares outstanding (m) 6,873.0Major shareholders PT Semarop Agung (25.27%)Free float (%) 67Avg daily value traded (USDm) 0.693
Key indicators (FY1)
ROE (%) 14.8Net debt/equity (%) 19.4Book value/share (IDR) 367Price/book (x) 3.43Net interest cover(x) 8.3Operating profit margin (%) 23.7
We expect stronger presales in 2Q11 We expect stronger presales in 2Q11. In April alone, SMRA booked Rp200bn in presales from a Serpong launch, bringing total presales to Rp530bn, or 27% of our FY11F. This weekend, the company plans to launch a shophouse project in Bekasi with an estimated value of Rp200bn. We have estimated Rp2tr in presales this year, 30% of which would be from Bekasi.
Land acquisition mode SMRA targets capex of Rp1.5tr for 2011, of which Rp500-600m has been allocated for land acquisitions of 300ha during the year. In March, SMRA acquired 60ha in Bandung and plans to complete its 200-300ha land acquisition in stages. It is also eyeing land bank in South Jakarta and Makassar. This should improve its land bank holding from 700ha to more than 1,000ha when fully completed. SMRA holds Rp1,028bn in cash as of 1Q11, and will likely rely on internal cash and issuances for its capex needs.
Reiterating Buy on formidable track record Retain Buy rating on SMRA, given its strong brand equity and timely delivery. Our TP of Rp1,400 is valued on life-of-land bank DCF with WACC of 15.7% with no terminal value(RFR 6.0%, beta 1.3x). For its investment properties, we apply 5.0% terminal growth. Risks: interest rates, delay in projects, rising raw-material costs.
3 May 2011 Strategy Asia Equities Daily Focus
Page 36 Deutsche Bank AG/Hong Kong
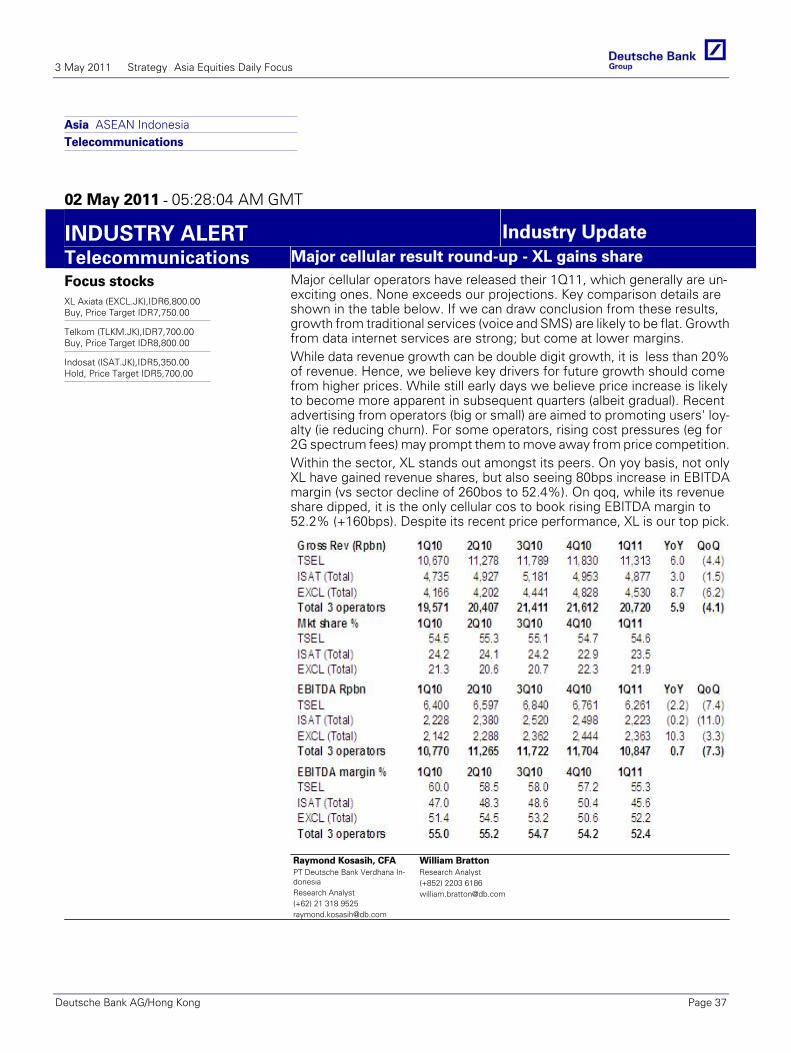
Co
mp
any Asia ASEAN Indonesia
Telecommunications
02 May 2011 - 05:28:04 AM GMT
INDUSTRY ALERT Industry UpdateTelecommunications Major cellular result round-up - XL gains share
Focus stocksXL Axiata (EXCL.JK),IDR6,800.00Buy, Price Target IDR7,750.00
Telkom (TLKM.JK),IDR7,700.00Buy, Price Target IDR8,800.00
Indosat (ISAT.JK),IDR5,350.00Hold, Price Target IDR5,700.00
Major cellular operators have released their 1Q11, which generally are un-exciting ones. None exceeds our projections. Key comparison details areshown in the table below. If we can draw conclusion from these results,growth from traditional services (voice and SMS) are likely to be flat. Growthfrom data internet services are strong; but come at lower margins.While data revenue growth can be double digit growth, it is less than 20%of revenue. Hence, we believe key drivers for future growth should comefrom higher prices. While still early days we believe price increase is likelyto become more apparent in subsequent quarters (albeit gradual). Recentadvertising from operators (big or small) are aimed to promoting users' loy-alty (ie reducing churn). For some operators, rising cost pressures (eg for2G spectrum fees) may prompt them to move away from price competition.Within the sector, XL stands out amongst its peers. On yoy basis, not onlyXL have gained revenue shares, but also seeing 80bps increase in EBITDAmargin (vs sector decline of 260bos to 52.4%). On qoq, while its revenueshare dipped, it is the only cellular cos to book rising EBITDA margin to52.2% (+160bps). Despite its recent price performance, XL is our top pick.
Source: Deutsche Bank and company dataRaymond Kosasih, CFAPT Deutsche Bank Verdhana In-donesiaResearch Analyst(+62) 21 318 [email protected]
William BrattonResearch Analyst(+852) 2203 [email protected]
3 May 2011 Strategy Asia Equities Daily Focus
Deutsche Bank AG/Hong Kong Page 37
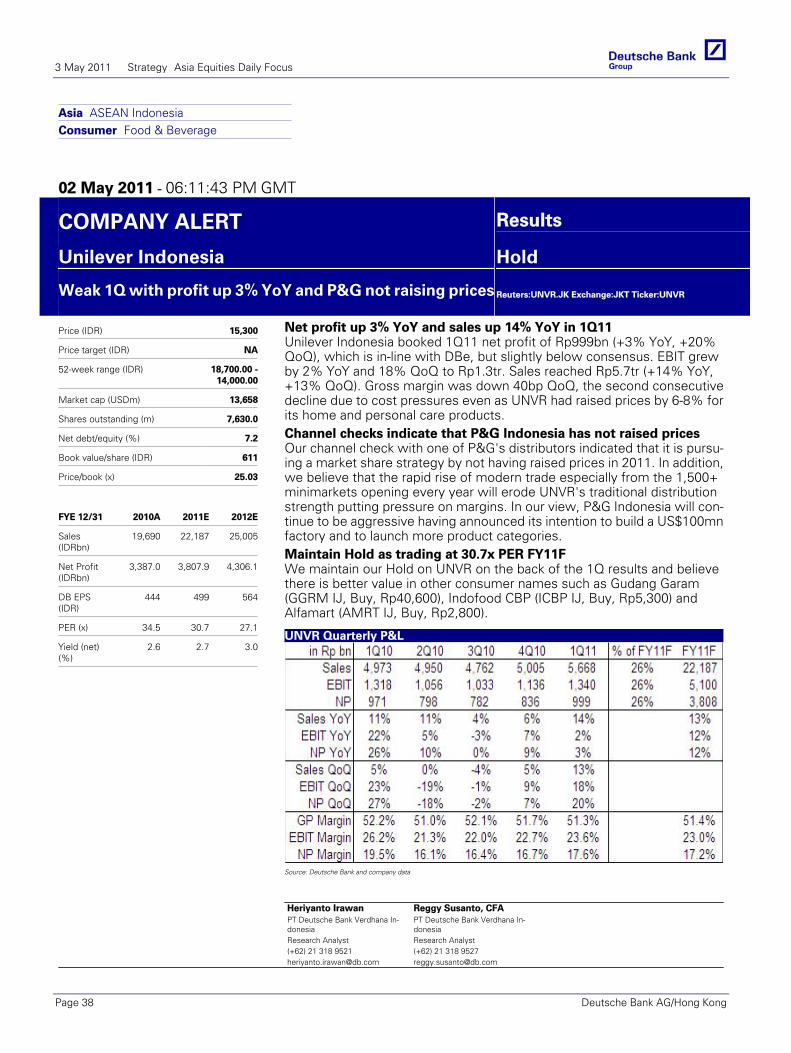
Asia ASEAN IndonesiaConsumer Food & Beverage
02 May 2011 - 06:11:43 PM GMT
COMPANY ALERT Results
Unilever Indonesia Hold
Weak 1Q with profit up 3% YoY and P&G not raising prices
Reuters:UNVR.JK Exchange:JKT Ticker:UNVR
Price (IDR) 15,300
Price target (IDR) NA
52-week range (IDR) 18,700.00 -14,000.00
Market cap (USDm) 13,658
Shares outstanding (m) 7,630.0
Net debt/equity (%) 7.2
Book value/share (IDR) 611
Price/book (x) 25.03
FYE 12/31 2010A 2011E 2012E
Sales(IDRbn)
19,690 22,187 25,005
Net Profit(IDRbn)
3,387.0 3,807.9 4,306.1
DB EPS(IDR)
444 499 564
PER (x) 34.5 30.7 27.1
Yield (net)(%)
2.6 2.7 3.0
Net profit up 3% YoY and sales up 14% YoY in 1Q11Unilever Indonesia booked 1Q11 net profit of Rp999bn (+3% YoY, +20%QoQ), which is in-line with DBe, but slightly below consensus. EBIT grewby 2% YoY and 18% QoQ to Rp1.3tr. Sales reached Rp5.7tr (+14% YoY,+13% QoQ). Gross margin was down 40bp QoQ, the second consecutivedecline due to cost pressures even as UNVR had raised prices by 6-8% forits home and personal care products.Channel checks indicate that P&G Indonesia has not raised pricesOur channel check with one of P&G's distributors indicated that it is pursu-ing a market share strategy by not having raised prices in 2011. In addition,we believe that the rapid rise of modern trade especially from the 1,500+minimarkets opening every year will erode UNVR's traditional distributionstrength putting pressure on margins. In our view, P&G Indonesia will con-tinue to be aggressive having announced its intention to build a US$100mnfactory and to launch more product categories.Maintain Hold as trading at 30.7x PER FY11FWe maintain our Hold on UNVR on the back of the 1Q results and believethere is better value in other consumer names such as Gudang Garam(GGRM IJ, Buy, Rp40,600), Indofood CBP (ICBP IJ, Buy, Rp5,300) andAlfamart (AMRT IJ, Buy, Rp2,800).
UNVR Quarterly P&L
Source: Deutsche Bank and company data
Heriyanto IrawanPT Deutsche Bank Verdhana In-donesiaResearch Analyst(+62) 21 318 [email protected]
Reggy Susanto, CFAPT Deutsche Bank Verdhana In-donesiaResearch Analyst(+62) 21 318 [email protected]
3 May 2011 Strategy Asia Equities Daily Focus
Page 38 Deutsche Bank AG/Hong Kong
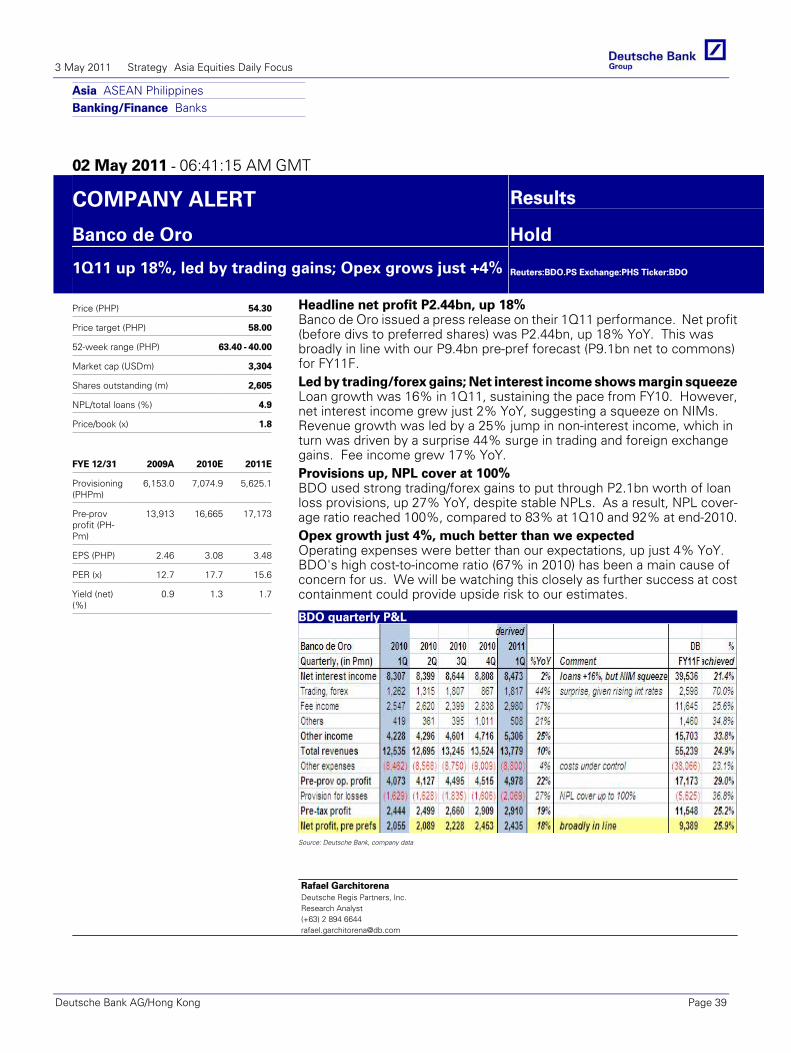
Asia ASEAN PhilippinesBanking/Finance Banks
02 May 2011 - 06:41:15 AM GMT
COMPANY ALERT Results
Banco de Oro Hold
1Q11 up 18%, led by trading gains; Opex grows just +4%
Reuters:BDO.PS Exchange:PHS Ticker:BDO
Price (PHP) 54.30
Price target (PHP) 58.00
52-week range (PHP) 63.40 - 40.00
Market cap (USDm) 3,304
Shares outstanding (m) 2,605
NPL/total loans (%) 4.9
Price/book (x) 1.8
FYE 12/31 2009A 2010E 2011E
Provisioning(PHPm)
6,153.0 7,074.9 5,625.1
Pre-provprofit (PH-Pm)
13,913 16,665 17,173
EPS (PHP) 2.46 3.08 3.48
PER (x) 12.7 17.7 15.6
Yield (net)(%)
0.9 1.3 1.7
Headline net profit P2.44bn, up 18%Banco de Oro issued a press release on their 1Q11 performance. Net profit(before divs to preferred shares) was P2.44bn, up 18% YoY. This wasbroadly in line with our P9.4bn pre-pref forecast (P9.1bn net to commons)for FY11F.Led by trading/forex gains; Net interest income shows margin squeezeLoan growth was 16% in 1Q11, sustaining the pace from FY10. However,net interest income grew just 2% YoY, suggesting a squeeze on NIMs.Revenue growth was led by a 25% jump in non-interest income, which inturn was driven by a surprise 44% surge in trading and foreign exchangegains. Fee income grew 17% YoY.Provisions up, NPL cover at 100%BDO used strong trading/forex gains to put through P2.1bn worth of loanloss provisions, up 27% YoY, despite stable NPLs. As a result, NPL cover-age ratio reached 100%, compared to 83% at 1Q10 and 92% at end-2010.Opex growth just 4%, much better than we expectedOperating expenses were better than our expectations, up just 4% YoY.BDO's high cost-to-income ratio (67% in 2010) has been a main cause ofconcern for us. We will be watching this closely as further success at costcontainment could provide upside risk to our estimates.
BDO quarterly P&L
Source: Deutsche Bank, company data
Rafael GarchitorenaDeutsche Regis Partners, Inc.Research Analyst(+63) 2 894 [email protected]
3 May 2011 Strategy Asia Equities Daily Focus
Deutsche Bank AG/Hong Kong Page 39
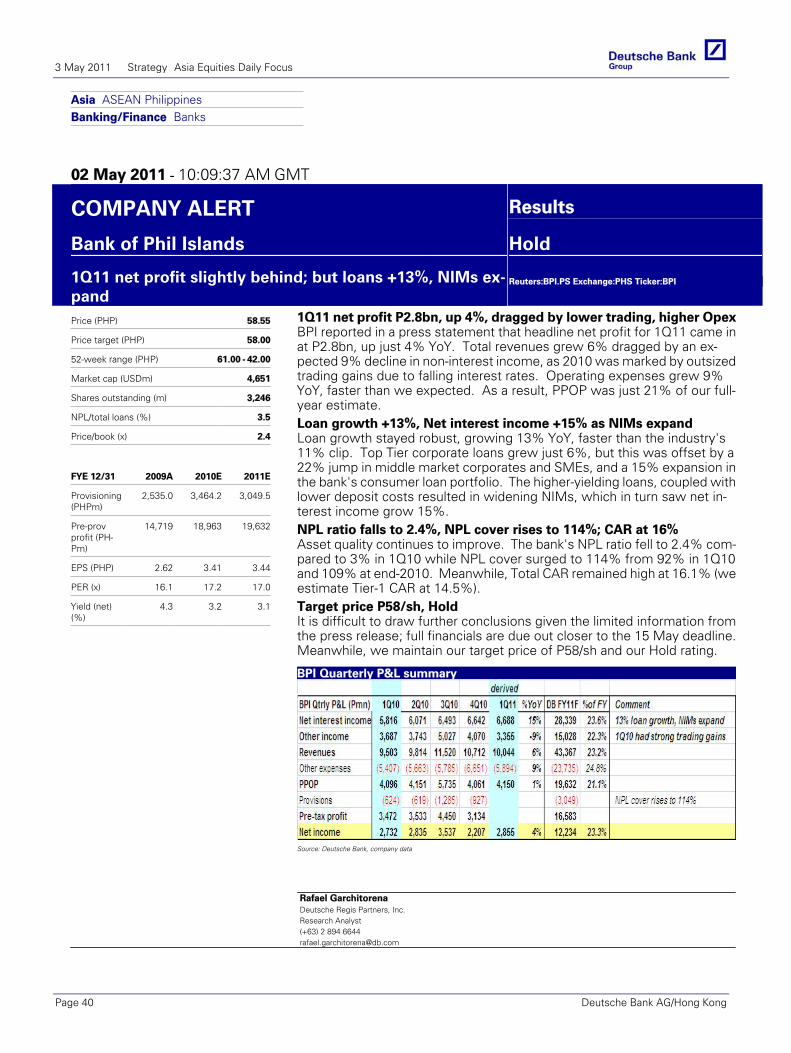
Co
mp
any Asia ASEAN Philippines
Banking/Finance Banks
02 May 2011 - 10:09:37 AM GMT
Glo
bal
Mar
kets
Res
earc
h
COMPANY ALERT Results
Bank of Phil Islands Hold
1Q11 net profit slightly behind; but loans +13%, NIMs ex‐pand
Reuters:BPI.PS Exchange:PHS Ticker:BPI
Price (PHP) 58.55
Price target (PHP) 58.00
52-week range (PHP) 61.00 ‐ 42.00
Market cap (USDm) 4,651
Shares outstanding (m) 3,246
NPL/total loans (%) 3.5
Price/book (x) 2.4
FYE 12/31 2009A 2010E 2011E
Provisioning(PHPm)
2,535.0 3,464.2 3,049.5
Pre-provprofit (PH-Pm)
14,719 18,963 19,632
EPS (PHP) 2.62 3.41 3.44
PER (x) 16.1 17.2 17.0
Yield (net)(%)
4.3 3.2 3.1
1Q11 net profit P2.8bn, up 4%, dragged by lower trading, higher OpexBPI reported in a press statement that headline net profit for 1Q11 came inat P2.8bn, up just 4% YoY. Total revenues grew 6% dragged by an ex-pected 9% decline in non-interest income, as 2010 was marked by outsizedtrading gains due to falling interest rates. Operating expenses grew 9%YoY, faster than we expected. As a result, PPOP was just 21% of our full-year estimate.Loan growth +13%, Net interest income +15% as NIMs expandLoan growth stayed robust, growing 13% YoY, faster than the industry's11% clip. Top Tier corporate loans grew just 6%, but this was offset by a22% jump in middle market corporates and SMEs, and a 15% expansion inthe bank's consumer loan portfolio. The higher-yielding loans, coupled withlower deposit costs resulted in widening NIMs, which in turn saw net in-terest income grow 15%.NPL ratio falls to 2.4%, NPL cover rises to 114%; CAR at 16%Asset quality continues to improve. The bank's NPL ratio fell to 2.4% com-pared to 3% in 1Q10 while NPL cover surged to 114% from 92% in 1Q10and 109% at end-2010. Meanwhile, Total CAR remained high at 16.1% (weestimate Tier-1 CAR at 14.5%).Target price P58/sh, HoldIt is difficult to draw further conclusions given the limited information fromthe press release; full financials are due out closer to the 15 May deadline.Meanwhile, we maintain our target price of P58/sh and our Hold rating.
BPI Quarterly P&L summary
Source: Deutsche Bank, company data
Rafael GarchitorenaDeutsche Regis Partners, Inc.Research Analyst(+63) 2 894 [email protected]
3 May 2011 Strategy Asia Equities Daily Focus
Page 40 Deutsche Bank AG/Hong Kong
Japan Household Equipment
02 May 2011 - 08:55:16 PM JST
COMPANY ALERT Results
JS Group Buy
FY3/16 OP guidance is ¥240bn in medium-term businessplan
Reuters:5938.T Exchange:TYO Ticker:5938
Price (¥) 1,998
Price target - 12mth (¥) 2,200
52-week range (¥) 2,172 - 1,446
Market cap (¥bn) 566
Shares outstanding (m) 283
Foreign shareholding ratio (%) 25.5
TOPIX 852
FYE 3/31 2011A 2012E 2013E
Sales (¥bn) 1,214.9 1,218.0 1,244.0
OP (¥bn) 40.4 63.0 75.0
RP (¥bn) 39.2 62.5 74.5
NP (¥bn) 15.8 23.6 31.0
EPS (¥) 56 83 110
P/E (x) 31.6 24.0 18.2
No guidance announced for FY3/12JS Group announced its FY3/11 results. The results contained no surprisessince the company lowered its guidance earlier. JS Group did not discloseFY3/12 guidance but we think this has already been discounted. Based onthe results briefing held the same day, we think it unnecessary to substan-tially change our FY3/12 estimates (OP: ¥63bn).Except cost cuttings, no direction seen in medium-term business planJS Group also released its medium-term business plan ending FY3/16.Guidance targets sales of ¥3trn, OP margin of 8%, and ROE of at least 8%.The company is looking to achieve cost cuttings of ¥110bn in the first threeyears while targeting OP of ¥120bn (¥49bn in FY3/11) for its existing do-mestic business segments. While management clarified the specifics of thecost cutting at the briefing, it did not disclose plans for growth areas in-cluding overseas.Maintaining Buy ratingThe stock performed firmly after the earthquake, but has weakened some-what from profit taking in the past few weeks. We think this is due touncertainties over the medium-term business plan and guidance for FY3/12.We expect the stock to perform strongly now that today's announcementhas cleared up these uncertainties.
Yoji Otani, CMAResearch Analyst(+81) 3 [email protected]
Akiko Komine, CMAResearch Analyst(+81) 3 [email protected]
3 May 2011 Strategy Asia Equities Daily Focus
Deutsche Bank AG/Hong Kong Page 41
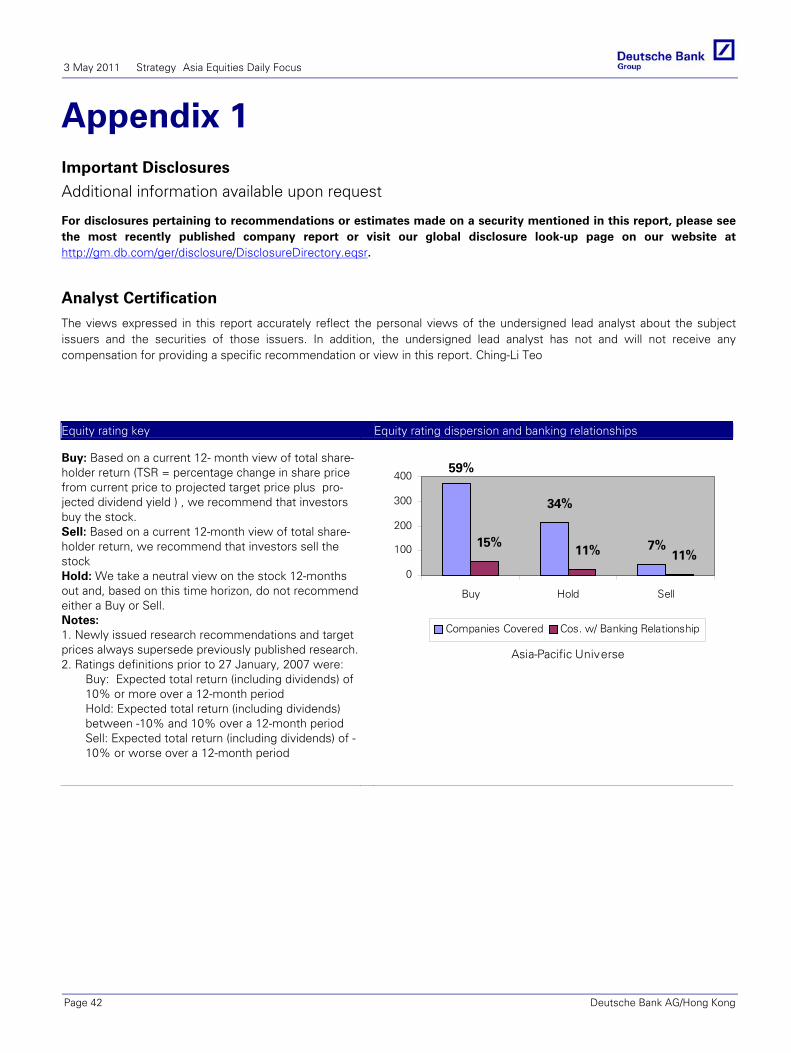
3 May 2011 Strategy Asia Equities Daily Focus
Appendix 1 Important Disclosures
Additional information available upon request
For disclosures pertaining to recommendations or estimates made on a security mentioned in this report, please see the most recently published company report or visit our global disclosure look-up page on our website at http://gm.db.com/ger/disclosure/DisclosureDirectory.eqsr.
Analyst Certification
The views expressed in this report accurately reflect the personal views of the undersigned lead analyst about the subject issuers and the securities of those issuers. In addition, the undersigned lead analyst has not and will not receive any compensation for providing a specific recommendation or view in this report. Ching-Li Teo
Equity rating key Equity rating dispersion and banking relationships Buy: Based on a current 12- month view of total share-holder return (TSR = percentage change in share price from current price to projected target price plus pro-jected dividend yield ) , we recommend that investors buy the stock. Sell: Based on a current 12-month view of total share-holder return, we recommend that investors sell the stock Hold: We take a neutral view on the stock 12-months out and, based on this time horizon, do not recommend either a Buy or Sell. Notes: 1. Newly issued research recommendations and target prices always supersede previously published research.2. Ratings definitions prior to 27 January, 2007 were:
Buy: Expected total return (including dividends) of 10% or more over a 12-month period Hold: Expected total return (including dividends) between -10% and 10% over a 12-month period Sell: Expected total return (including dividends) of -10% or worse over a 12-month period
7%
34%
59%
11%11%15%
0
100
200
300
400
Buy Hold Sell
Asia-Pacific Universe
Companies Covered Cos. w/ Banking Relationship
Page 42 Deutsche Bank AG/Hong Kong
3 May 2011 Strategy Asia Equities Daily Focus
Deutsche Bank AG/Hong Kong Page 43
Regulatory Disclosures
1. Important Additional Conflict Disclosures
Aside from within this report, important conflict disclosures can also be found at https://gm.db.com/equities under the "Disclosures Lookup" and "Legal" tabs. Investors are strongly encouraged to review this information before investing.
2. Short-Term Trade Ideas
Deutsche Bank equity research analysts sometimes have shorter-term trade ideas (known as SOLAR ideas) that are consistent or inconsistent with Deutsche Bank's existing longer term ratings. These trade ideas can be found at the SOLAR link at http://gm.db.com.
3. Country-Specific Disclosures
Australia: This research, and any access to it, is intended only for "wholesale clients" within the meaning of the Australian Corporations Act. Brazil: The views expressed above accurately reflect personal views of the authors about the subject company(ies) and its(their) securities, including in relation to Deutsche Bank. The compensation of the equity research analyst(s) is indirectly affected by revenues deriving from the business and financial transactions of Deutsche Bank. EU countries: Disclosures relating to our obligations under MiFiD can be found at http://globalmarkets.db.com/riskdisclosures. Japan: Disclosures under the Financial Instruments and Exchange Law: Company name - Deutsche Securities Inc. Registration number - Registered as a financial instruments dealer by the Head of the Kanto Local Finance Bureau (Kinsho) No. 117. Member of associations: JSDA, The Financial Futures Association of Japan. Commissions and risks involved in stock transactions - for stock transactions, we charge stock commissions and consumption tax by multiplying the transaction amount by the commission rate agreed with each customer. Stock transactions can lead to losses as a result of share price fluctuations and other factors. Transactions in foreign stocks can lead to additional losses stemming from foreign exchange fluctuations. "Moody's", "Standard & Poor's", and "Fitch" mentioned in this report are not registered credit rating agencies in Japan unless “Japan” is specifically designated in the name of the entity . New Zealand: This research is not intended for, and should not be given to, "members of the public" within the meaning of the New Zealand Securities Market Act 1988. Russia: This information, interpretation and opinions submitted herein are not in the context of, and do not constitute, any appraisal or evaluation activity requiring a license in the Russian Federation.
Deutsche Bank AG/Hong Kong
North American locations
Deutsche Bank Securities Inc. 60 Wall Street New York, NY 10005 Tel: (212) 250 2500
Deutsche Bank Securities Inc. One International Place 12th Floor Boston, MA 02110 United States of America Tel: (1) 617 217 6100
Deutsche Bank Securities Inc. 222 South Riverside Plaza 30th Floor Chicago, IL 60606 Tel: (312) 537-3758
Deutsche Bank Securities Inc. 3033 East First Avenue Suite 303, Third Floor Denver, CO 80206 Tel: (303) 394 6800
Deutsche Bank Securities Inc. 1735 Market Street 24th Floor Philadelphia, PA 19103 Tel: (215) 854 1546
Deutsche Bank Securities Inc. 101 California Street 46th Floor San Francisco, CA 94111 Tel: (415) 617 2800
Deutsche Bank Securities Inc. 700 Louisiana Street Houston, TX 77002 Tel: (832) 239-4600
International locations
Deutsche Bank Securities Inc. Deutsche Bank AG London Deutsche Bank AG Deutsche Bank AG 60 Wall Street 1 Great Winchester Street Große Gallusstraße 10-14 Deutsche Bank Place New York, NY 10005 London EC2N 2EQ 60272 Frankfurt am Main Level 16
United States of America United Kingdom Germany Corner of Hunter & Phillip Streets Tel: (1) 212 250 2500 Tel: (44) 20 7545 8000 Tel: (49) 69 910 00 Sydney, NSW 2000
Australia Tel: (61) 2 8258 1234
Deutsche Securities Inc. Deutsche Bank AG Level 55 2-11-1 Nagatacho Cheung Kong Center Sanno Park Tower 2 Queen's Road Central Chiyoda-ku, Tokyo 100-6171 Hong Kong Japan Tel: (852) 2203 8888 Tel: (81) 3 5156 6701
Global Disclaimer The information and opinions in this report were prepared by Deutsche Bank AG or one of its affiliates (collectively "Deutsche Bank"). The information herein is believed to be reliable and has been obtained from public sources believed to be reliable. Deutsche Bank makes no representation as to the accuracy or completeness of such information.
Deutsche Bank may engage in securities transactions, on a proprietary basis or otherwise, in a manner inconsistent with the view taken in this research report. In addition, others within Deutsche Bank, including strategists and sales staff, may take a view that is inconsistent with that taken in this research report.
Opinions, estimates and projections in this report constitute the current judgement of the author as of the date of this report. They do not necessarily reflect the opinions of Deutsche Bank and are subject to change without notice. Deutsche Bank has no obligation to update, modify or amend this report or to otherwise notify a recipient thereof in the event that any opinion, forecast or estimate set forth herein, changes or subsequently becomes inaccurate. Prices and availability of financial instruments are subject to change without notice. This report is provided for informational purposes only. It is not an offer or a solicitation of an offer to buy or sell any financial instruments or to participate in any particular trading strategy. Target prices are inherently imprecise and a product of the analyst judgement.
As a result of Deutsche Bank’s recent acquisition of BHF-Bank AG, a security may be covered by more than one analyst within the Deutsche Bank group. Each of these analysts may use differing methodologies to value the security; as a result, the recommendations may differ and the price targets and estimates of each may vary widely.
Deutsche Bank has instituted a new policy whereby analysts may choose not to set or maintain a target price of certain issuers under coverage with a Hold rating. In particular, this will typically occur for "Hold" rated stocks having a market cap smaller than most other companies in its sector or region. We believe that such policy will allow us to make best use of our resources. Please visit our website at http://gm.db.com to determine the target price of any stock.
The financial instruments discussed in this report may not be suitable for all investors and investors must make their own informed investment decisions. Stock transactions can lead to losses as a result of price fluctuations and other factors. If a financial instrument is denominated in a currency other than an investor's currency, a change in exchange rates may adversely affect the investment. Past performance is not necessarily indicative of future results. Deutsche Bank may with respect to securities covered by this report, sell to or buy from customers on a principal basis, and consider this report in deciding to trade on a proprietary basis.
Unless governing law provides otherwise, all transactions should be executed through the Deutsche Bank entity in the investor's home jurisdiction. In the U.S. this report is approved and/or distributed by Deutsche Bank Securities Inc., a member of the NYSE, the NASD, NFA and SIPC. In Germany this report is approved and/or communicated by Deutsche Bank AG Frankfurt authorized by the BaFin. In the United Kingdom this report is approved and/or communicated by Deutsche Bank AG London, a member of the London Stock Exchange and regulated by the Financial Services Authority for the conduct of investment business in the UK and authorized by the BaFin. This report is distributed in Hong Kong by Deutsche Bank AG, Hong Kong Branch, in Korea by Deutsche Securities Korea Co. This report is distributed in Singapore by Deutsche Bank AG, Singapore Branch, and recipients in Singapore of this report are to contact Deutsche Bank AG, Singapore Branch in respect of any matters arising from, or in connection with, this report. Where this report is issued or promulgated in Singapore to a person who is not an accredited investor, expert investor or institutional investor (as defined in the applicable Singapore laws and regulations), Deutsche Bank AG, Singapore Branch accepts legal responsibility to such person for the contents of this report. In Japan this report is approved and/or distributed by Deutsche Securities Inc. The information contained in this report does not constitute the provision of investment advice. In Australia, retail clients should obtain a copy of a Product Disclosure Statement (PDS) relating to any financial product referred to in this report and consider the PDS before making any decision about whether to acquire the product. Deutsche Bank AG Johannesburg is incorporated in the Federal Republic of Germany (Branch Register Number in South Africa: 1998/003298/10). Additional information relative to securities, other financial products or issuers discussed in this report is available upon request. This report may not be reproduced, distributed or published by any person for any purpose without Deutsche Bank's prior written consent. Please cite source when quoting.
Copyright © 2011 Deutsche Bank AG