3 June 2013 - Collège de France
48
3 June 2013
Transcript of 3 June 2013 - Collège de France
3 June 2013

•! Motivation – why Arctic pollution?
•! Long-range transport of pollution from mid-latitudes
•! Local Arctic pollution
•! Conclusions & perspectives
Outline

AMAP, 2011
Arctic Pollution – what is it?
Aerosols
Ozone POPs
Aerosols=sulphate(SO4), nitrate (NO3),
black carbon, sea-salt, dust, smoke etc.
Ozone=O3 (formed from NOx, VOCs, CO, CH4) POPs=persistent organic pollutants (e.g. DDT)
PAHs=Polycyclic Aromatic Hydrocarbons (e.g. anthracene)
Heavy metals: mercury (Hg), etc.
POPs,
PAHs, Hg
POPs, PAHs, Hg
Aerosols Aerosols Ozone
POPs, PAHs, Hg
POPs, PAHs, Hg
AIR
LAND
OCEAN

AMAP, 2011
Arctic Pollution – what is it?
Aerosols
Ozone POPs
Aerosols=sulphate(SO4), nitrate (NO3),
black carbon, sea-salt, dust, smoke etc.
Ozone=O3 (formed from NOx, VOCs, CO, CH4) POPs=persistent organic pollutants (e.g. DDT)
PAHs=Poly Aromatic Hydrocarbons
Heavy metals, mercury (Hg)
POPs,
PAHs, Hg
POPs, PAHs, Hg
Aerosols Aerosols Ozone
POPs, PAHs, Hg
POPs, PAHs, Hg
AIR
LAND
OCEAN
Focus in this presentation on:
Air Pollution (aerosols and ozone)
Talk tomorrow on toxic substances (Aurelien
Dommergue) …. plus others

PIOMAS data
89 ensembles from 36 CMIP5
models run with RCP8.5
•! Observations show much faster disappearance
of Arctic summer sea-ice (2020-2030) than IPCC
models (2040-2060)
•! Why? Atmosphere-ice-ocean feedbacks –
possibly representation of Arctic clouds and
aerosol-cloud interactions
•! Implications for Arctic shipping & exploitation
of resources (local pollution)
Overland and Wang, GRL
(2013)
-27.8% per decade
Air Pollution - Motivation: Sea-ice decline
Sept. Sea-ice Volume

The Arctic is Earth"s fastest-warming region#
as climate models predicted
http://data.giss.nasa.gov/gistemp/
!""!#!""$%&''()*%&+,%-./0.,)1(,.%
%&'2/)*+.3%4.*)56.%12%789$#7889%
Air Pollution - Motivation: Arctic Amplifcation
CO2 + warming pollutants (ozone, black carbon) + methane

Motivating questions:
What is the contribution of pollutants (ozone and aerosols)
and methane to Arctic climate change? A lot of interest in mitigating short-lived pollutants (also climate forcers), e.g. UNEP, Climate & Clean Air Coalition (http://www.unep.org/ccac/), Arctic Council AMAP Expert
Group on Black Carbon & Ozone
To what extent will Arctic warming lead to new local sources
of Arctic pollution (e.g. shipping, oil/gas extraction) that can
impact climate, regional air quality & ecosystems
(deposition)?

Ozone Sources & Impacts
Impacts (even at low concentrations):
•! Human health (> 35 ppbv)
•! Vegetation (crops) (8hr ave > 40 ppbv)
•! Climate (poss. 25% surface temp. warming)

Aerosol Sources

Aerosol Impacts

•! Observations
•! Transport pathways & pollution origins (past, present, ….)
•! Pollution processing during transport ….
Long-range Transport of Pollution to the Arctic

:;6.,<=>.,.%=>.,.%1>.%3'2=%?,2/%*)31%
=+'1.,%>)3%/.*1.@%)=)<A%)%B'.%@(31A%C,)<%
+'%D2*2,A%)'@A%=>.'%=.1A%E*)DF%2,%@),F%
E,2='A%+3%@+31,+E(1.@%26.,%1>.%+'*)'@%+D.%+'%
)%*)<.,%GH%
I2,@.'3F+J*@A%&K%;KA%LD+.'D.A%7$$M%
HN+,1<%+D.H%,.02,13%E<%I)'3.'%)'@%I2,@.'3F+J*@%
Courtesy A Stohl (NILU)

Arctic Pollution – Arctic Haze
Pictures: A.-C. Engvall (NILU)

Arctic Haze
”Arctic Haze” first observed in
the 1950s by pilots (perhaps
earlier)
Few pollution sources within the
Arctic itself, Arctic remote from
major pollution sources
! Long-range transport
Removal processes are slow or
absent (scavenging by rainout,
photochemical processes)
Shaw (1995): BAMS 76, 2403-2413

Winter:
anthropogenic
pollution (Europe, Asia)
Summer: higher
latitude sources
important (e.g. fires
in Siberia, Alaska/
Canada)
AMAP, 2006

Arctic Haze: maximum pollution in winter & early spring (surface sites)
AMAP, 2006
Barrow
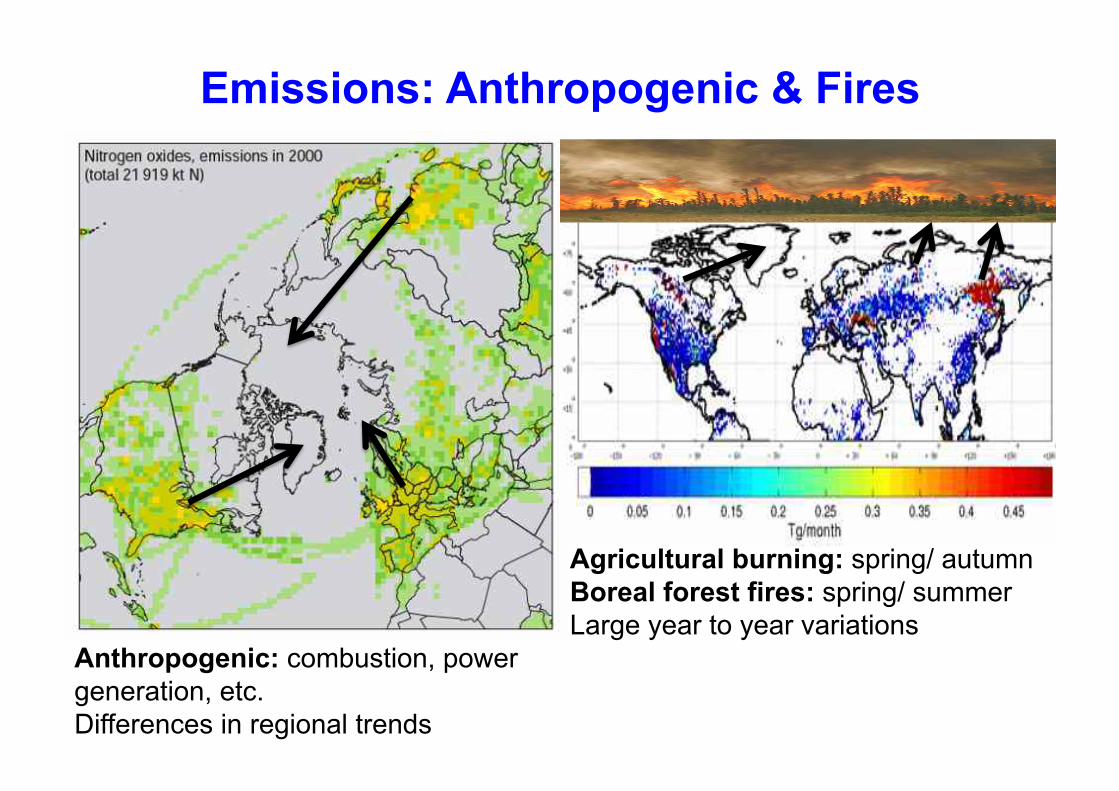
Emissions: Anthropogenic & Fires
Agricultural burning: spring/ autumn
Boreal forest fires: spring/ summer
Large year to year variations
Anthropogenic: combustion, power
generation, etc.
Differences in regional trends

18
Spring: transport of agricultural fire plumes
Stohl et al., ACP, 2007

Pollution Event: Svalbard
New records measured for practically all
observed compounds (carbon monoxide,
aerosols, etc.) (surface)
Stohl et al. (2007)
April May

6000
5000
4000
3000
2000
1000
Alt
itu
de (
m)
50403020100
Particle Volume (µm3cm
-3)
0.80.60.40.2
Organic Fraction
2008/04/21
Spring 2008
Decoupling
between PBL and
free troposphere
Higher
concentrations
aloft (4-7km) ?
NOAA/P3 ARCPAC
aircraft data
(POLARCAT)
courtesy Chuck
Brock et al./NOAA
Spring 2008: Boreal fire plumes
superimposed on sulfate haze "background"

Aerosol distributions (CALIPSO) - April 2008
5-7 km 0-2 km
532 nm aerosol scattering ratio – Ancellet et al. (in prep.)
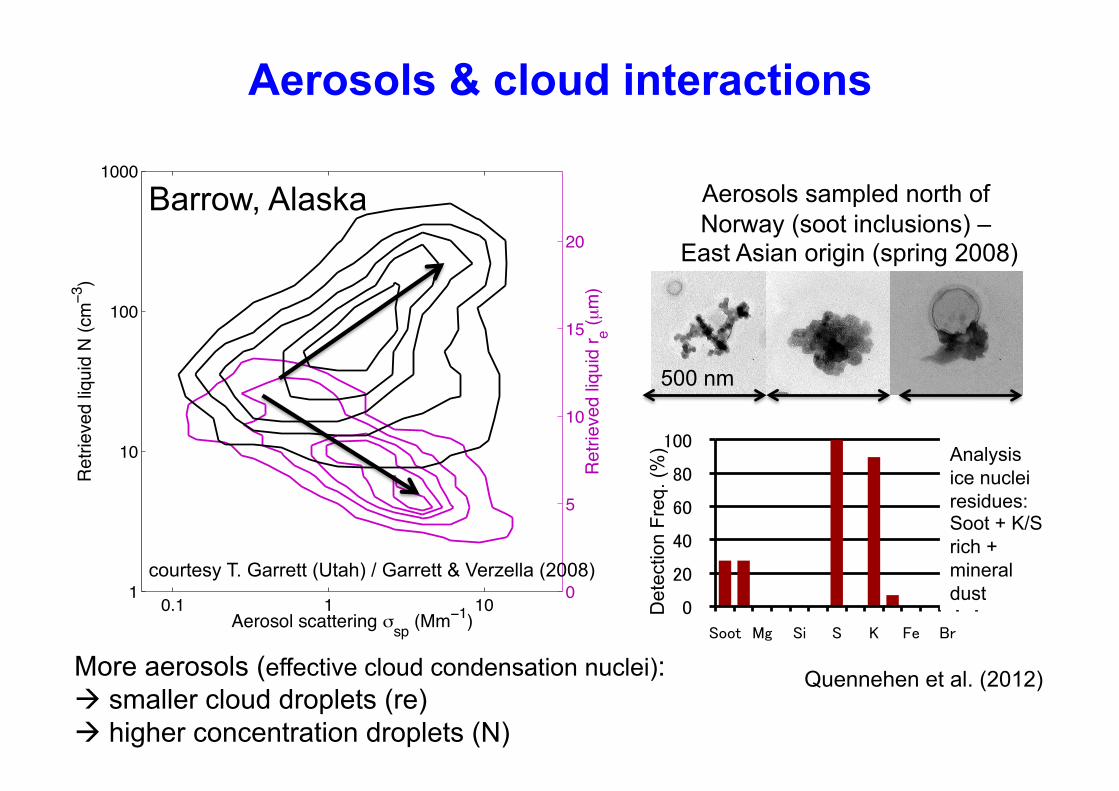
Aerosols & cloud interactions%
!"#$%$&'%()**"#+,-'!%.'/01
!23
4"*#+"5"6'&+78+6'#"'/!13
9:2 2 299
;
29
2;
<9
4"*#+"5"6'&+78+6'='/(1!>3
' ' '
2
29
299
2999
courtesy T. Garrett (Utah) / Garrett & Verzella (2008)
!"!
#!"!
$!"!
%!"!
&!"!
'!!"!
())*!+,! (-! (! .! /0! 12!
Dete
ction F
req. (%
) Analysis
ice nuclei
residues: Soot + K/S
rich +
mineral
dust
Aerosols sampled north of
Norway (soot inclusions) – East Asian origin (spring 2008)
500 nm
More aerosols (effective cloud condensation nuclei):
!! smaller cloud droplets (re)
! higher concentration droplets (N)
Barrow, Alaska
Quennehen et al. (2012)

WRF-chem model simulations
Thomas et al. (2013)
Summer:
Pollution transport from North America to
Greenland
4 July – 7 July 2008
CO plumes uplifted from
1-2km to 8km by
synoptic fronts
Aerosols lost by washout in summer
Fire
Anthropogenic

! ozone production during long-range
transport to the Arctic (summer 2008)
Thomas et al., ACP, 2013.
CO emissions ozone increase over Greenland ATR-42 Flight
Long-range
transport
(4 days)
Regional model simulated significant ozone production in plumes - up to 50
ppbv - during transport to the Arctic (mainly anthropogenic + fires, in this
case) ! summer ozone max. over Greenland (Summit)
mol km-2 hr-1 ppbv
1 July 2008 5 July 2008
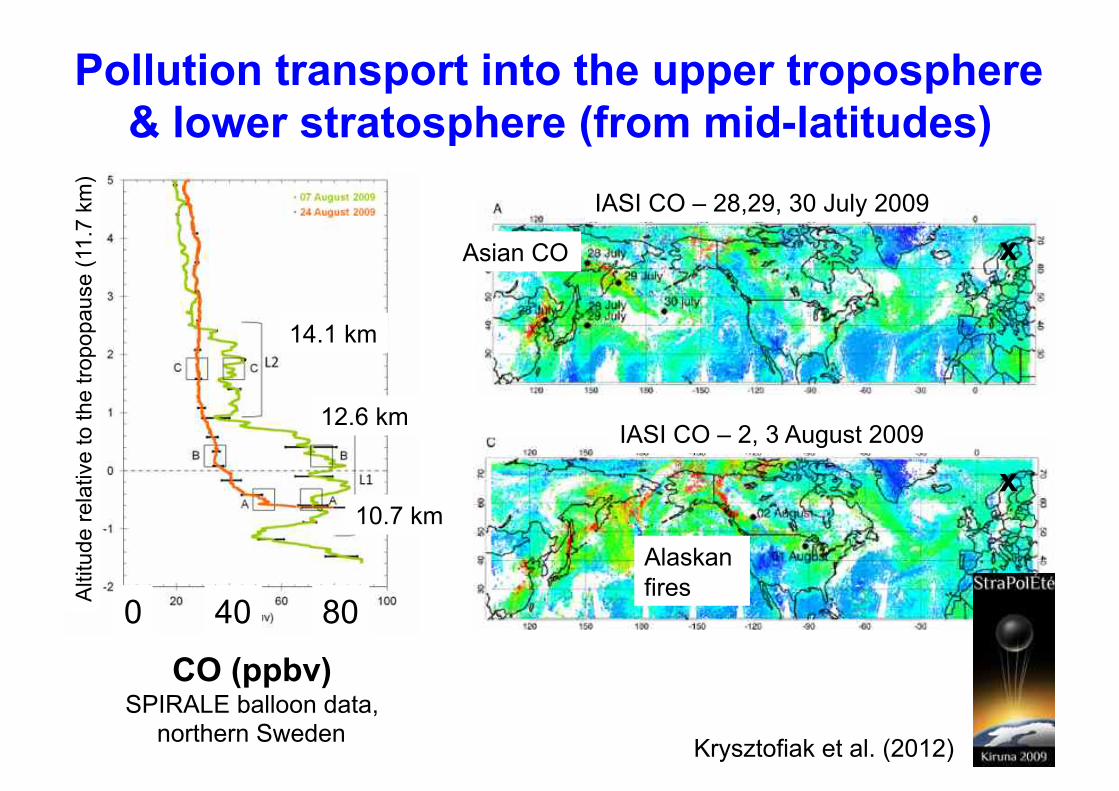
Pollution transport into the upper troposphere
& lower stratosphere (from mid-latitudes)
Krysztofiak et al. (2012)
x
x
Altitude r
ela
tive to the tro
popause (
11.7
km
)
10.7 km
12.6 km
14.1 km
CO (ppbv) SPIRALE balloon data,
northern Sweden
80 40 0
IASI CO – 28,29, 30 July 2009
IASI CO – 2, 3 August 2009
Asian CO
Alaskan
fires

Lee et al. (2013)
black carbon
carbon monoxide
IPCC AR5
models
Models have problems simulating
seasonal of pollutants:
CO: emissions or lifetime during transport
(photochemistry)
Black carbon: large variability – some
recent improvements (washout, …), but ..
Black carbon (Barrow/Alaska)
Improved w/ no precip in cold ice
clouds (< -15C) + warm drizzle
Browse et al. (2012)

Past changes from ice cores
Black
carbon (in precip.)
Significant increases in black
carbon (BC) between 1900-1960
(anthropogenic origin), declined
then increasing again?
Sulphate aerosol increased from
1900 up to mid-1990s, rapid
decline recently …
Data from Greenland – mainly
influenced by emissions from
North America
McConnell et al. (2007)
x
Ice core D4
1800 1900 2000
Non sea-salt
sulphate

Lee et al. (2013)
IPCC CMIP5 simulations:
Deposition fluxes of black carbon (top)
generally simulated better than black
carbon snow concentrations (bottom)
Modelled trends not very good from
1950 onwards ! emissions?, ageing
or loss processes?
BC deposition fluxes - Greenland
BC snow concentrations - Greenland
IPCC AR5
models

courtesy C. Granier/I. Bouarar (LATMOS)
1900 1960 2010
Trends in anthropogenic emissions?
Is this the whole story for the Arctic?
MaCCity CO emissions

•! Shipping
•! Resource extraction (oil/gas/minerals)
•! Associated infrastructure and urbanization
•! Arctic – natural emissions, specific chemistry, meteorology …
Local Sources of Pollution:
Currently low (?) but likely to increase …

Oil/gas
Minerals
Fisheries
+
Tourism
Shipping
Source of
pollutants:
Shipping:
NOx,VOCs,
black
carbon, SO2
Oil/gas:
VOCs, CO,
CH4, black
carbon, ….
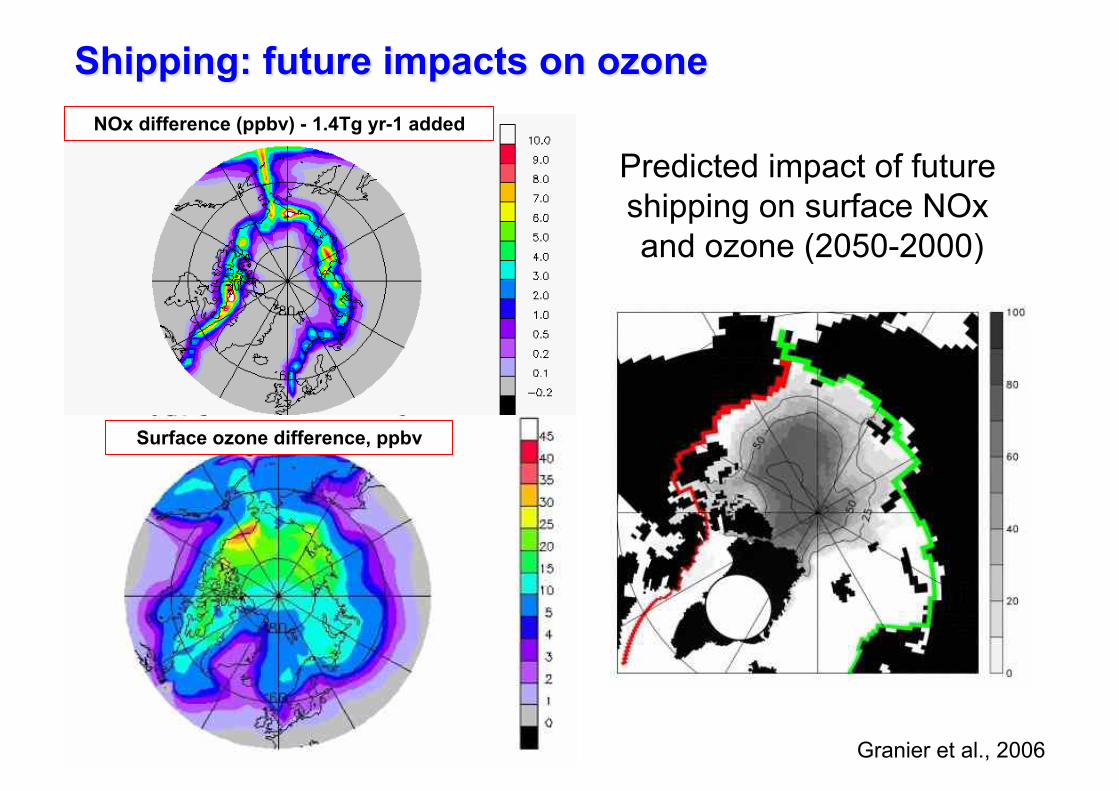
Predicted impact of future
shipping on surface NOx
and ozone (2050-2000)
NOx difference (ppbv) - 1.4Tg yr-1 added
Granier et al., 2006
Surface ozone difference, ppbv

Surface ozone in Barrow, Alaska
Model: present-day
Observations Model with Arctic ships (2050)
Granier et al., 2006
WHO 8hr Air Quality Threshold
May August

Impact of cruise ships on black carbon
(present-day)
Observed summertime black carbon with & without
cruise ships in harbour (Spitzbergen)
Black
carbon
daytime
Particles
(60nm
size bin)
ozone
Eckhardt et al., (2013, ACPD)

Radiative Forcing (RF) 2004-2030 in the Arctic from shipping for HIGH and
Max. Feasible Reduction (MFR) emission scenarios
•! Proposed regulation of SO2 ship emissions could lead to significant
warming from reduced sulphate (spring)
•! Ozone dominates forcing during Arctic summer/spring (HIGH scenario)
•! Forcing due to atmospheric BC and deposition on snow/ice significant in
Arctic spring (summer)
ozone
Dalsoren et al. (2013)
seasons
soot
sulphate

Normalized Net Forcing (Atmospheric Direct RF (BC) and BC-Snow/Ice
RF) due to emissions from Arctic Council Nations, latitude bands, and global
and within-Arctic shipping (NCAR climate model)
AMAP BC Report:
Near Arctic black carbon emissions have
much higher impact on Arctic climate

Many uncertainties about ship emissions
Little data in Arctic
about factors impacting
ship emissions
E.g. ships emit more
soot at low engine
loads (speeds) – ships
not tuned to operate in these conditions
Arctic? Ships likely to
travel more slowly …
Lack et al. (2012)

Cross-Polar Sea Routes (2050, September)
Based on sea-ice predictions from 7 climate models (RCP8.5)
Smith and
Stephenson, PNAS, 2013
New Polar
Class ships !
sailing directly across Pole?
Future emission scenarios?

Baseline (2000-2014)-Mid-century (2045-2059):
Green - newly formed maritime access to Type A (light icebreaker) vessels. Red - lost winter road potential for 2,000 kg ground vehicles.
Climate change: increased maritime access but
reduced land access ! shifting transport patterns?
Stephenson
et al. (2011)
Implications
for transport,
urbanization, industrial
development,
etc. ??
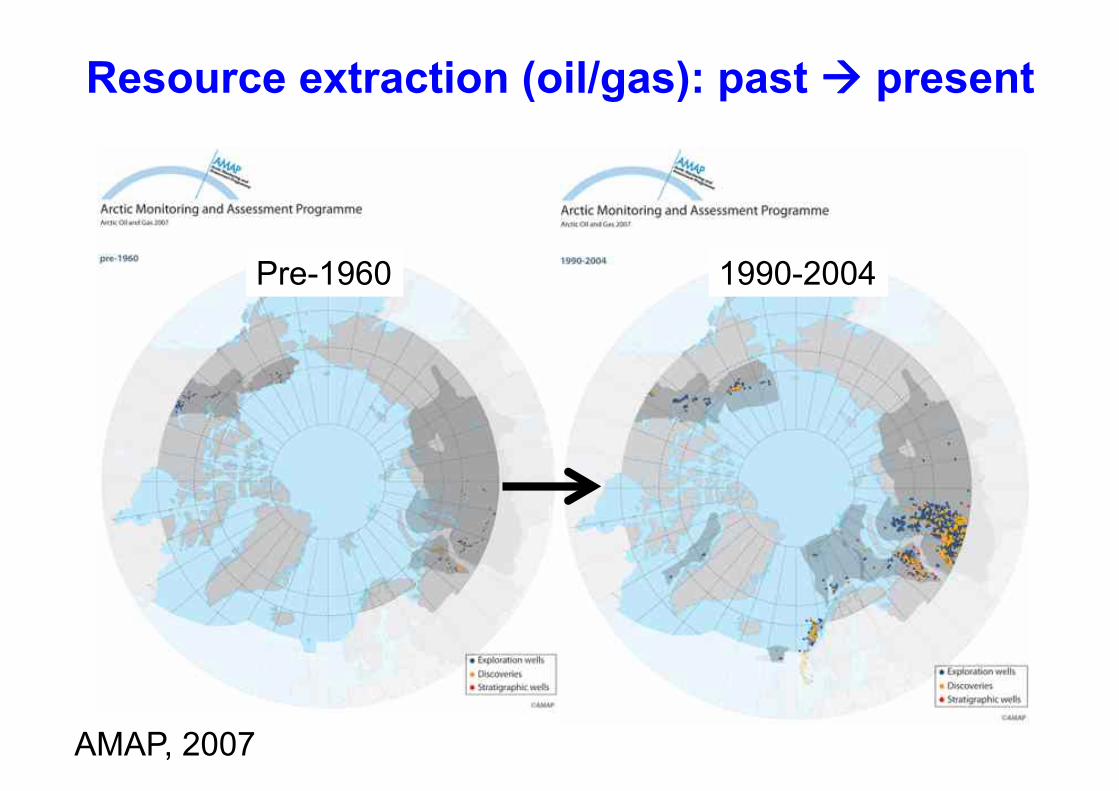
Resource extraction (oil/gas): past ! present
Pre-1960 1990-2004
AMAP, 2007

Resource extraction (oil/gas/mining) present ! future?
Very large
uncertainties
about pollutant emissions from
these sources

ECLIPSE emissions: 2008-2010
Black carbon: present-day domestic & flaring emissions
Stohl et al., ACPD (2013)
Improved oil/gas flaring
emissions + seasonal cycle in
domestic emissions (ECLIPSE-EU
project)
Significant local source of
black carbon to the Arctic (flaring alone: 40-50% surface Arctic BC)
Improves modelled seasonal
cycle ….
Zeppelin, Svalbard
black carbon

Metal Smelting: Russia
Copper smelting is
large source of sulphur,
heavy metals etc.
Already very polluted
Poorly quantified local
source …

2010 2050
+ shipping,
resource extraction,
urbanization, ….
Future Arctic emissions?
Asia still increasing

Impacts: nitrogen deposition to ecosystems?

Natural system: Arctic specific processes in lower
troposphere (response to climate change?)
Natural aerosols:
sulphate, sea-salt, organics,
Halogens from snow/
ice (act as oxidants)
Snow emissions
(e.g. NOx)
Dust, fires, …..
courtesy OASIS project
Methane: hydrates,
wetlands, …

•! Long-range transport - important in the past (reasons for trends
not clear) - likely to continue into future (Asian emissions)
•! Local sources of pollution in Arctic not well quantified (already
important) - likely to increase in the future (scenarios uncertain)
•! Natural emissions (processes) – Arctic specific environment – need to understand interactions with local emissions especially in
the context of a changing climate
Conclusions & Perspectives