2Q17 Earnings Presentation - d1io3yog0oux5.cloudfront.net · We define Adjusted EBITDA as net...
21
August 02, 2017 2Q17 Earnings Presentation
Transcript of 2Q17 Earnings Presentation - d1io3yog0oux5.cloudfront.net · We define Adjusted EBITDA as net...

August 02, 2017
2Q17 Earnings Presentation
Important DisclosuresForward-Looking Statements
This presentation contains projections and other forward-looking statements within the meaning of Section 27A of the Securities Act of 1933 and Section 21E of the Securities Exchange Act
of 1934. These projections and statements reflect the Company’s current views with respect to future events and financial performance as of this date. No assurances can be given,
however, that these events will occur or that these projections will be achieved, and actual results could differ materially from those projected as a result of certain factors. For a summary
of events that may affect the accuracy of these projections and forward-looking statements, see “Risk Factors” in our Form 10-K for the year ended December 31, 2016 filed with the
Securities and Exchange Commission (the “SEC”).
SUPPLEMENTAL NON-GAAP FINANCIAL MEASURES
This presentation includes non-GAAP measures, such as Adjusted EBITDA, Adjusted Income, Adjusted Income per diluted share, Adjusted G&A and other measures identified as non-GAAP.
Adjusted EBITDA is a supplemental non-GAAP financial measure that is used by management and external users of our financial statements, such as industry analysts, investors, lenders and
rating agencies. We define Adjusted EBITDA as net income (loss) before interest expense, income taxes, depreciation, depletion and amortization, exploration expense, (gains) losses on
derivative instruments excluding net cash receipts (payments) on settled derivative instruments and premiums paid for put options that settled during the period, impairment of oil and
natural gas properties, non-cash equity based compensation, asset retirement obligation accretion expense, other income, gains and losses from the sale of assets and other non-cash
operating items. Adjusted EBITDA is not a measure of net income as determined by United States generally accepted accounting principles (‘‘GAAP’’).
Management believes Adjusted EBITDA is useful because it allows it to more effectively evaluate our operating performance and compare the results of our operations from period to
period and against our peers without regard to our financing methods or capital structure. We exclude the items listed above from net income in arriving at Adjusted EBITDA because these
amounts can vary substantially from company to company within our industry depending upon accounting methods and book values of assets, capital structures and the method by which
the assets were acquired. Adjusted EBITDA should not be considered as an alternative to, or more meaningful than, net income as determined in accordance with GAAP or as an indicator of
our operating performance or liquidity. Certain items excluded from Adjusted EBITDA are significant components in understanding and assessing a company’s financial performance, such as
a company’s cost of capital and tax structure, as well as the historic costs of depreciable assets, none of which are components of Adjusted EBITDA. Our presentation of Adjusted EBITDA
should not be construed as an inference that our results will be unaffected by unusual or non-recurring items.
We believe that the non-GAAP measure of Adjusted income available to common shareholders (“Adjusted Income”) and Adjusted Income per diluted share are useful to investors because
they provide readers with a meaningful measure of our profitability before recording certain items whose timing or amount cannot be reasonably determined. These measures exclude the
net of tax effects of certain non-recurring items and non-cash valuation adjustments, which are detailed in the reconciliation provided below. Prior to being tax-effected and excluded, the
amounts reflected in the determination of Adjusted income and Adjusted income per diluted share below were computed in accordance with GAAP.
Adjusted general and administrative expense (“Adjusted G&A”) is a supplemental non-GAAP financial measure that excludes certain non-recurring expenses and non-cash valuation
adjustments related to incentive compensation plans. We believe that the non-GAAP measure of Adjusted G&A is useful to investors because it provides readers with a meaningful measure
of our recurring G&A expense and provides for greater comparability period-over-period. The Appendix table details all adjustments to G&A on a GAAP basis to arrive at Adjusted G&A.
For a reconciliation of non-GAAP measures to their most directly comparable GAAP measure, please see schedules included in the Appendix.
2
Important DisclosuresReserve-Related Disclosures
Cautionary Note to U.S. Investors: The Securities and Exchange Commission (“SEC”) prohibits oil and gas companies, in their filings with the SEC, from disclosing estimates of oil or gasresources other than “reserves,” as that term is defined by the SEC. This presentation discloses estimates of quantities of oil and gas using certain terms, such as “resource potential,” “netrecoverable resource potential,” “resource base,” “estimated ultimate recovery,” “EUR” or other descriptions of volumes of reserves, which terms include quantities of oil and gas that maynot meet the SEC’s definitions of proved, probable and possible reserves, and which the SEC’s guidelines strictly prohibit the Company from including in filings with the SEC. These estimatesare by their nature more speculative than estimates of proved reserves and accordingly are subject to substantially greater risk of being recovered by the Company. U.S. investors are urgedto consider closely the disclosures in the Company’s periodic filings with the SEC. Such filings are available from the Company at 1401 Enclave Pkwy, Ste 600, Houston, TX 77077, Attention:Investor Relations, and the Company’s website at www.callon.com. These filings also can be obtained from the SEC by calling 1-800-SEC-0330.
The SEC permits oil and gas companies, in their filings with the SEC, to disclose only proved, probable and possible reserves that meet the SEC’s definitions for such terms, and price and costsensitivities for such reserves, and prohibits disclosure of resources that do not constitute such reserves. The Company uses the terms “estimated ultimate recovery” (or “EUR”) that theSEC’s rules may prohibit the Company from including in filings with the SEC. These estimates are by their nature more speculative than estimates of proved, probable and possible reserves,and accordingly are subject to substantially greater risk of being realized by the Company.
EUR estimates and potential horizontal well locations have not been risked by the Company. Actual locations drilled and quantities that may be ultimately recovered from the Company’sinterest may differ substantially from the Company’s estimates. There is no commitment by the Company to drill all of the potential horizontal drilling locations. Factors affecting ultimaterecovery include the scope of the Company’s ongoing drilling program, which will be directly affected by the availability of capital, drilling and production costs, availability of drilling andcompletion services and equipment, drilling results, commodity price levels, lease expirations, regulatory approval and actual drilling results, as well as geological and mechanical factors.Estimates of type/decline curves and per-well EURs may change significantly as development of the Company’s oil and gas assets provides additional data.
Type/decline curves, estimated EURs, recovery factors and well costs represent Company estimates based on evaluation of petrophysical analysis, core data and well logs, well performancefrom existing drilling and recompletion results and seismic data, and have not been reviewed by independent engineers. These are presented as hypothetical recoveries if assumptions andestimates regarding recoverable hydrocarbons, recovery factors and costs prove correct. As a result, such estimates may change significantly as results from more wells are evaluated.Estimates of EURs do not constitute reserves, but constitute estimates of contingent resources that the SEC has determined are too speculative to include in SEC filings. Unless otherwisenoted, Internal Rate of Return (or “IRR”) and Net Present Value (or “NPV”) estimates are before taxes and assume Company-generated EUR and decline curve estimates based on Companydrilling and completion cost estimates that do not include land, seismic, G&A or other corporate level costs.
Investors are urged to consider closely the disclosure in our Form 10-K and other reports filed with the SEC, available on our website or by request by contacting Investor Relations: CallonPetroleum Company, 1401 Enclave Parkway, Suite 600, Houston, TX 77077. You may also email the Company at [email protected].
You can also obtain our Form 10-K and other reports filed with the SEC by contacting the SEC directly at 1-800-SEC-0330 or by downloading it from the SEC’s web site http://www.sec.gov.
3

Callon Petroleum
4
2017 Activity in All Core Areas2Q17 Highlights
FIN
AN
CIA
LR
ESU
LTS
Q/Q production growth of 9% driven primarily by oil volumes
– Oil mix of ~79% (17,538 Bbl/d)
15% sequential reduction in per-unit LOE; on track to meet FY17 target
Adj. EBITDA margin of ~73% (1)
OP
ERA
TIO
NA
L R
ESU
LTS
WildHorse: WC A delineated across entire Howard Co. position
Spur: Solid WC A and WC B DUC results demonstrate potential with visibility to enhancement via operated program
Monarch: Successful LSBY well density pilots support 13 WPS; (Locations: +15%)
2H
17
& F
Y1
8
OU
TLO
OK
Arrival of 4th rig in July to initiate operated Delaware Basin program
Unchanged plan to add a 5th rig in 1Q18
– Now directed to Delaware
Reiterating 2018 exit rate of 40 MBoe/d
Delaware Basin
SpurRanger
Monarch
WildHorse
Midland Basin
1) See the non-GAAP related disclosures in the Appendix.

5
Near-Term Execution2
Q1
7
Development activity in all four core operating areas
WildHorse development expanded to Central Howard County
Initial benefits from infrastructure positively impacting LOE
1) Source: BMO Capital Markets, “Staring Contest” published 7/12/17. Peers include APA, CXO, CVX, ECA, EGN, EPE, FANG, LPI, OXY, PE, PXD, QEP, RSPP, SM, XOM.
Forecasting 40% Production Growth for 2017
78% 79%
0
5
10
15
20
25
30
35
1Q17 2Q17 3Q17E 4Q17E
Mb
oe/
d
MBoe/d % Oil
Per Well 12 Month Cumulative Production (1)
0.0
5.0
10.0
15.0
20.0
25.0
Pe
er 1
Pe
er 2
Pe
er 3
Pe
er 4
Pe
er 5
Pe
er 6
Pe
er 7
Pe
er 8
Pe
er 9
Pe
er 1
0
Pe
er 1
1
Pe
er 1
2
Pe
er 1
3
CP
E
Pe
er 1
4
Pe
er 1
5
Bo
e1
6:1
/ft
(20
15
-20
17
wel
ls)
3Q
17
Addition of fourth rig, which arrived at Spur in July
Addition of 2nd dedicated frac fleet to support program development
WildHorse infrastructure projects substantially complete
4Q
17
Initial production impact from Spur (10,000 ftlateral development)
WildHorse production benefitting fully from infrastructure and debottlenecking
Initial results from re-emergence of activity in Ranger

0%
2%
4%
6%
8%
10%
Peer 1 Peer 2 Peer 3 Peer 4 Peer 5 Peer 6 CPE
Growth Plan
1) Operating cash flow excluding working capital and phatom settles less total capex.2) Source: BMO Capital Markets, “Staring Contest” published 7/12/17. Peers include CDEV, CXO, EGN, FANG, PE, RSPP.
6
Philosophy Resilient Baseline of Growth (1)
($100)
($50)
$0
$50
$100
1H18 2H18 1H19 2H19
Free
Cas
h F
low
($
MM
)
$50 - $55 Band
~35% CAGR from 2017 to 2019 on 5-rig Baseline
0
2
4
6
0
10,000
20,000
30,000
40,000
50,000
2017 2018 2019
Baselin
e # of R
igs
Dai
ly N
et P
rod
uct
ion
(B
oe/
d)
2018 Expected Return on Capital Employed (2)
Baseline program designed to provide ongoing visibility for near-term cash flow neutrality
Activity levels biased upward, not downward, given measured pace of rig additions
Robust production growth potential without sacrificing corporate-level returns given breadth of quality inventory and cost structure
Resilient activity through volatile short-term cycles in a re-balancing oil market
Free Cash Flow visibility to accelerate beyond 5 rigs
CPE ROCE nearly double peer average
Upside potential with additional rigs

Operational Update
7
Highlights LOE (including Gathering & Treating)
Net Wells Spud: Geographic Breakdown (2)
80% 84%
37% 35%
26%14%
16%
21% 51%
20% 16%
0%
20%
40%
60%
80%
100%
1Q17 2Q17 3Q17E 4Q17E
WildHorse Spur Monarch Ranger
Net Completions: Quarterly Progression (1)
6.6
9.7
11.0
14.0
0
5
10
15
1Q17 2Q17 3Q17E 4Q17E
2nd consecutive quarter with LOE reduction (2Q results over 10% below low end of guidance)
9.7 net completions during 2Q17 and on pace to complete ~42 net wells in 2017
Operated Delaware Basin program initiated in July
– Currently 3 Midland and 1 Delaware
– Starting with 2 single-well pads in L WC A before moving to multi-well pad development
1) 3Q17E and 4Q17E based on midpoint of guidance.2) Operated Callon wells.
$0
$2
$4
$6
$8
1Q17 2Q17
$/B
oe
Saltwater disposal Fuel & powerRepairs & maintenance Gathering & treatingDownhole Jobs / Workover Other LOE

Program development in full stride
– Two dedicated drilling rigs at WildHorse
– Three target zones
Continued exceptional performance in WC A
– Easternmost and southernmost delineation wells tracking 1 MMBoe type curve
WildHorse WC A: Program Development Progresses South
1) Peak 24-hour rate observed to date during flowback period.2) Papagiorgio 33-40B #01WA is a non-operated well in which Callon holds a minority working interest.
8
Infrastructure Progress
Recent WC A Well Activity
Expanding to Fairway Development
Fairway
1 2
Well Zone Lateral Peak-to-Date (1)
Colonial Unit 01AH WC A 7,802’ 1,471 Boe/d
Colonial Unit 02AH WC A 7,802’ 1,635 Boe/d
Wyndham Unit 01AH WC A 10,000’ 1,177 Boe/d
Wyndham Unit 02AH WC A 10,000’ 1,614 Boe/d
Papagiorgio 33-40B #01WA (2) WC A 10,000’ 1,500+ Boe/d
4
4 3
5
100% Complete
100% Complete
75% Complete
Gathering, Processing &
Takeaway
Gathering &Takeaway (Pipeline)
Oil Gas Water
WC A successfully delineated across the North-South and East-West
extents of CPE’s Howard Co. position, with results throughout tracking or
exceeding a 1MMBoe type curve
1
2
3
4
5
Fairway water gathering corridor
SWD Capacity

Operated LSBY wells to date have tracked acquisition type curve
WildHorse LSBY have exhibited flat production profiles (similar to Monarch)
Initiatives to accelerate ramp to peak:
– Optimized completion design with increased near-wellbore focus and more control over frac height (lower sand and fluid loading; employing diverters)
– Infrastructure build-out increases peak fluid capacity, accelerating de-watering of formation and early-time oil cut ramp
WildHorse LSBY: Established Base with Upside
1) Garrett-Snell Unit B 36-25 08SH is a non-operated well in which Callon holds a minority working interest.
9
YTD 2017 Lower Spraberry Wells
Lower Spraberry PDPs Tracking Acquisition Type Curve
Commentary
Well IP24 IP30
Wright-Adams Unit 31-42 07SH 750 Boe/d 522 Boe/d
Cheek Unit 28-21 09SH 725 Boe/d 572 Boe/d
Garrett-Reed Unit 37-48 09SH 829 Boe/d 635 Boe/d
Garrett-Snell Unit B 36-25 08SH (1) 1,107 Boe/d 889 Boe/d
1
2
4
3
Sidewinder
Maverick
Fairway
Returning to both Maverick and
Sidewinder in 3Q17 to complete Lower
Spraberry wells with updated stimulation
design
1
2
3
40
20
40
60
80
100
120
140
1 2 3 4 5 6 7 8 9
Cu
mu
lati
ve P
rod
uct
ion
(M
Bo
e)
Month
Average (8 wells) 850 MBOE

0
50
100
150
Corbets (L WC A) Saratoga (WC B)
MB
op
er 1
,00
0’ C
om
ple
ted
Lat
eral
Acquisition Type Curve Acquired Wells EUR
Spur: Optimizing Completions
1) Based on unaudited, internal mid-year reserve report as of July 11, 2017.
10
Optimizing Landing Zones for Operated WellsAcquired Wells Tracking Acquisition Type Curves (1)
Optimizing Operated Completion Design
U WC A~50’ lower
L WC A~60’ lower
CPEPrevious
Operators
3BS Sand
WC B~55’
higher
L WC A
L WC B
11,000’
11,500’
12,000’
7,500’ TC: 900 MBoe7,500’ TC: 1.6 MMBoe
GR Δ Log R
Previous Operator Design
Callon Design
Fluid Type Slickwater Slickwater
Stage Spacing (ft.) 125 200
# of Clusters 8 10 - 12
Proppant Loading (lbs. / ft.) ~2,800 ~2,000
Fluid Loading (Bbls / ft.) ~75 ~60
Diverter Employed Yes Yes
Callon operated completions to employ a high-density, near-wellbore design

Monarch: Organic Inventory Replacement
11
Pilot Programs Prove 13-Well Spacing in LSBY Lower LSBY – Consistently Improving Infill Results (2)
Upper LSBY – Outperforming in 13 Well Density PilotsCurrent 13 WPS Upper/Lower LSBY Spacing
Results from 2 key sets of tests reinforce optimal LSBY density at Monarch as 13 wells per section on stack/stagger pattern
– Successful full development of Lower LSBY flow unit at Casselman 8
– Four distinct 3-well pads across Monarch testing Upper LSBY and Lower LSBY on 13 wells per section spacing
Results increased Monarch LSBY inventory by ~15%
10+ rig years (1) of remaining inventory in Monarch LSBY 0
50
100
150
200
250
0 1 2 3 4 5 6 7 8 9 10 11 12
Cu
mu
lati
ve P
rod
uct
ion
(M
Bo
e)
Month
Pad 1 (2015) Pad 2 (2016) Pad 3 (2017)
1,000 MBoe
800 MBoe
0
50
100
150
200
250
0 1 2 3 4 5 6 7 8 9 10 11 12
Month
UL (Cass 10) UL (Cass 40)LL 1 (Cass 10) LL 2 (Cass 10)LL 1 (Cass 40) LL 2 (Cass 40)
1,000 MBoe
800 MBoe
1) Based on spud-to-spud cycle time assumption of 15 wells per rig per year. 2) Years in parentheses next to “Pad X” reflect dates of completion and flowback for each respective pad.
Casselman 8 – full section development of a single
flow unit over time
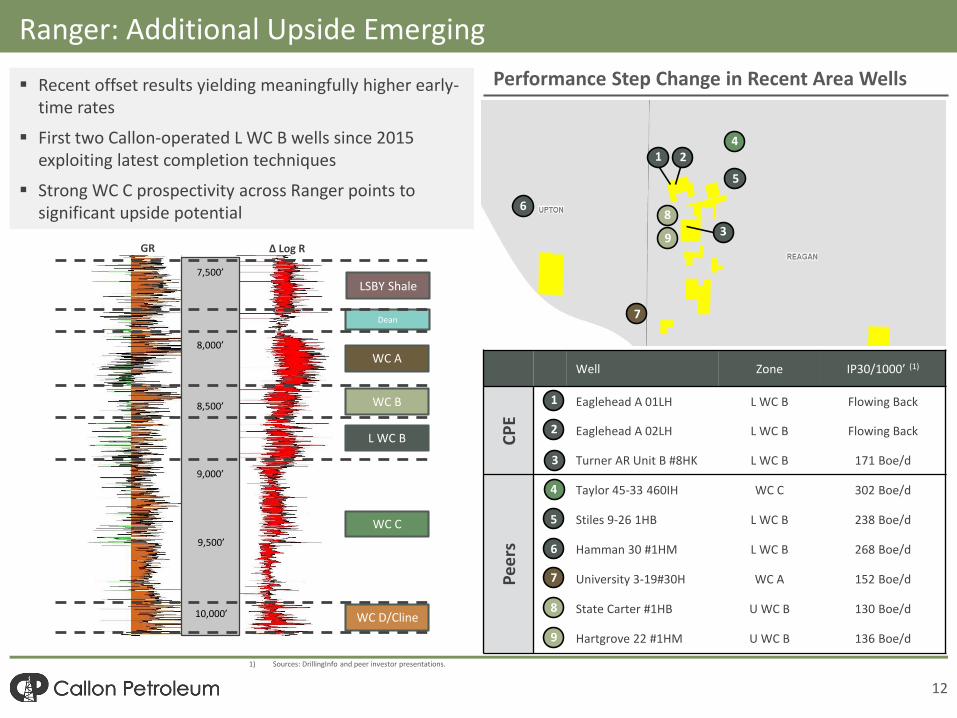
Recent offset results yielding meaningfully higher early-time rates
First two Callon-operated L WC B wells since 2015 exploiting latest completion techniques
Strong WC C prospectivity across Ranger points to significant upside potential
Ranger: Additional Upside Emerging
12
Performance Step Change in Recent Area Wells
Well Zone IP30/1000’ (1)
CP
E
Eaglehead A 01LH L WC B Flowing Back
Eaglehead A 02LH L WC B Flowing Back
Turner AR Unit B #8HK L WC B 171 Boe/d
Pe
ers
Taylor 45-33 460IH WC C 302 Boe/d
Stiles 9-26 1HB L WC B 238 Boe/d
Hamman 30 #1HM L WC B 268 Boe/d
University 3-19#30H WC A 152 Boe/d
State Carter #1HB U WC B 130 Boe/d
Hartgrove 22 #1HM U WC B 136 Boe/d
LSBY Shale
Dean
WC A
WC B
L WC B
WC C
WC D/Cline
7,500’
8,000’
8,500’
9,000’
9,500’
10,000’
1
2
3
4
5
6
7
8
9
8
9
6
5
4
7
1 2
3GR Δ Log R
1) Sources: DrillingInfo and peer investor presentations.

2Q17 Summary Results
13
Revenue Drivers Cash Operating Expenses Reduced 13% Q/Q
$5.70 $6.61 $5.56
$2.92$2.43
$2.67
$2.01$3.21
$2.38
$0
$5
$10
$15
2Q16 1Q17 2Q17
$/B
oe
LOE Gathering Adj Cash G&A Production Taxes
13.5 20.4 22.2
$36.88
$44.27$40.71
$0
$20
$40
$60
0
5
10
15
20
25
2Q16 1Q17 2Q17
$/B
oe
MB
oe/
d
Production Unhedged Realized Price
Cash Generation ($/Boe)
$28.90 $34.02 $32.32
$14.30
$30.20 $31.67
$0
$10
$20
$30
$40
2Q16 1Q17 2Q17
$/B
oe
Operating Margin Cash Operational CAPEX
Unhedged revenue per Boe benefits from best-in-class oil content and pipeline offtake
Total cash costs of $11.06 per Boe (including G&A)
Strong operating margins continued to minimize cash flow outspend in volatile price environment
Internal operating margins in excess of capital expenditures
1) See the non-GAAP related disclosures in the Appendix. 2) Operational capital includes drilling and completion, facilities, land and seismic. Presented on a cash basis.
(2)
(1)

Financial Positioning
1) Assumes elected commitment amount of $500 MM. 2) At issuance as of May 19, 2017.3) Net Debt at June 30, 2017 divided by annualized 2Q17 Adjusted EBITDA. See Appendix for the reconciliation of Adjusted EBITDA. 14
Capitalization ($MM)
Debt Maturity Summary ($MM)
$0
$200
$400
$600
2017 2018 2019 2020 2021 2022 2023 2024
Senior Notes
No Near-Term Maturities
$650MM Borrowing Base
$500MM Elected Commitment
Highlights
June 30, 2017
Cash $139
Credit Facility $0
Senior Notes due 2024 $600
Total Debt $600
Stockholders’ Equity $1,816
Total Capitalization $2,416
Total Liquidity (1) $639
Net Debt to LQA Adj EBITDA (3) 1.9x
Successfully extended revolving credit facility
– Borrowing base increased to $650MM; CPE elected commitment of $500MM
– Undrawn facility with $639MM (1) of liquidity as of June 30th
Raised an additional $200MM in the high yield market on an opportunistic basis (YTW 5.2%) (2)
Target a long-term leverage ratio of < 2.0x Net Debt / Annualized Adjusted EBITDA (3)
Continued to add to oil hedge position for 2H17 (~50% of guidance midpoint) and 2018 (~40% of current consensus estimates)

Guidance Summary
1) Excludes stock-based compensation and corporate depreciation and amortization. See the Non-GAAP related disclosures in the Appendix. 2) Excludes certain non-recurring expenses and non-cash valuation adjustments. See the non-GAAP related disclosures in the Appendix. 3) All interest expense anticipated to be capitalized.4) Includes drilling, completions, facilities, seismic, land and other items. Excludes capitalized expenses. 15
Guidance
2Q17 Guidance
2Q17Actual
3Q17Guidance
FY17 Guidance
Total production (MBoepd) 21.5 - 23.5 22.2 23.0 - 25.0 22.5 - 25.5
Oil production16.6 - 18.1 (76%-78%)
17.5(79% )
17.9 - 19.5(77%)
17.6 - 19.9(78%)
Income Statement Expenses (per BOE)
LOE, including workovers $6.25 - $7.00 $5.56 $6.00 - $6.50 $5.75 - $6.25
Gathering and treating $0.40 - $0.50 $0.45 $0.40 - $0.50 $0.40 - $0.50
Production taxes, including ad valorem(% of unhedged revenues)
7% 6% 7% 7%
Adjusted G&A: cash component (1) $2.25 - $2.50 $2.67 $2.25 - $2.50 $2.00 - $2.50
Adjusted G&A: non-cash component (2) $0.50 - $0.75 $0.53 $0.50 - $0.75 $0.50 - $1.00
Interest expense (3) $0.00 $0.00 $0.00 $0.00
Effective income tax rate 0% 1% 0% 0%
Capital expenditures ($MM, accrual basis)
Operational (4) $90 - $100 $84 $110 - $130 $350
Capitalized expenses (cash component) $10 - $12 $12 $12 - $17 $40 - $45
Net operated horizontal completions:
Midland Basin 9 - 11 9 ~10 ~39
Delaware Basin 1 1 ~1 ~3
Highlights
Increased expectations for FY17 oil mix (+2% over previous midpoint)
Reduced LOE guidance for FY17 based on delivered 1H17 results and further WildHorse efficiencies
Increased operational capital to high end of previous range
– Extending planned lateral lengths
– Increased working interest in drill wells from 1H17 acquisitions

Appendix
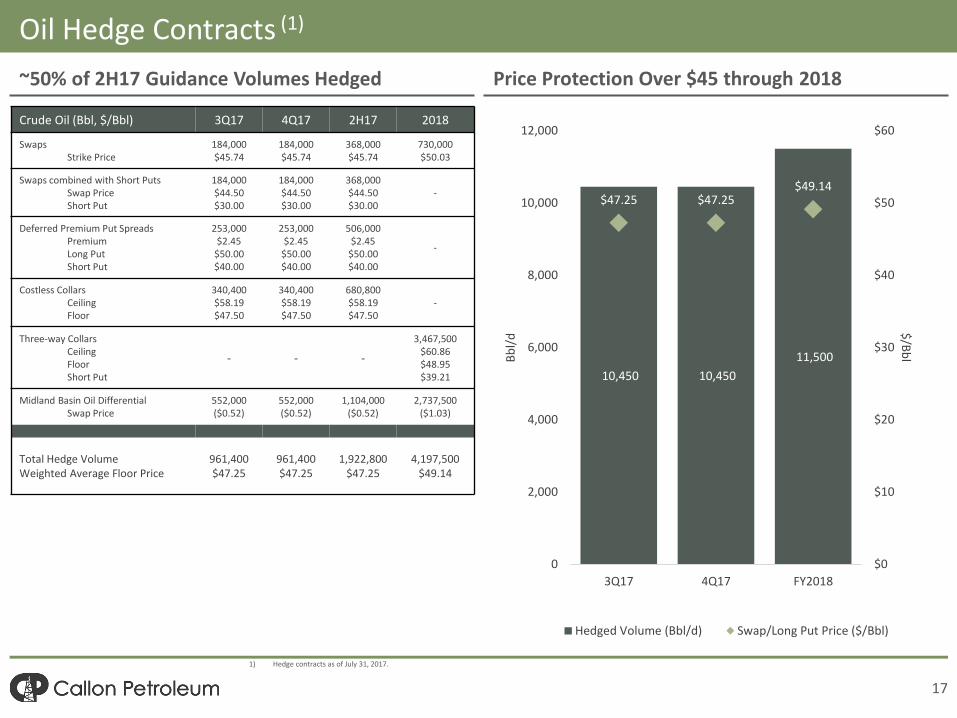
Oil Hedge Contracts (1)
1) Hedge contracts as of July 31, 2017.
17
~50% of 2H17 Guidance Volumes Hedged
Crude Oil (Bbl, $/Bbl) 3Q17 4Q17 2H17 2018
SwapsStrike Price
184,000$45.74
184,000$45.74
368,000$45.74
730,000$50.03
Swaps combined with Short PutsSwap PriceShort Put
184,000$44.50$30.00
184,000$44.50$30.00
368,000$44.50$30.00
-
Deferred Premium Put SpreadsPremium Long Put Short Put
253,000$2.45
$50.00$40.00
253,000$2.45
$50.00$40.00
506,000$2.45
$50.00$40.00
-
Costless CollarsCeiling Floor
340,400$58.19$47.50
340,400$58.19$47.50
680,800$58.19$47.50
-
Three-way CollarsCeiling FloorShort Put
- - -
3,467,500$60.86$48.95$39.21
Midland Basin Oil Differential Swap Price
552,000($0.52)
552,000($0.52)
1,104,000($0.52)
2,737,500($1.03)
Total Hedge Volume Weighted Average Floor Price
961,400$47.25
961,400$47.25
1,922,800$47.25
4,197,500$49.14
Price Protection Over $45 through 2018
10,450 10,450
11,500
$47.25 $47.25$49.14
$0
$10
$20
$30
$40
$50
$60
0
2,000
4,000
6,000
8,000
10,000
12,000
3Q17 4Q17 FY2018
$/B
blBb
l/d
Hedged Volume (Bbl/d) Swap/Long Put Price ($/Bbl)

Natural Gas Hedge Contracts (1)
1) Hedge contracts as of July 31, 2017.
18
~35% of 2H17 Guidance Volumes Hedged
Natural Gas (MMBtu, $/MMBtu) 3Q17 4Q17 2H17 2018
SwapsStrike Price
368,000$3.39
124,000$3.39
492,000$3.39
-
Costless CollarsCeiling Floor
368,000$3.68$3.00
856,000$3.77$3.23
1,224,000$3.74$3.16
720,000$3.84$3.40
Three-way CollarsCeiling FloorShort Put
368,000$3.71$3.00$2.50
368,000$3.71$3.00$2.50
736,000$3.71$3.00$2.50
-
Total Hedge Volume Weighted Average Floor Price
1,104,000$3.13
1,348,000$3.18
2,452,000$3.16
720,000$3.40
Price Protection Over $3 through 1Q18
12,000
14,652
8,000
$3.13 $3.18
$3.40
$0
$1
$2
$3
$4
0
2,000
4,000
6,000
8,000
10,000
12,000
14,000
16,000
3Q17 4Q17 1Q18
$/M
MB
tu
MM
Btu
/d
Hedged Volume (MMBtu/d) Swap/Long Put Price ($/MMBtu)

19
Quarterly Cash Flow Statement

20
Non-GAAP Reconciliation (1)
1) See “Important Disclosure” slides for disclosures related to Supplemental Non-GAAP Financial Measures.2) Adjusted EBITDA inclusive of Pro forma Adjustments is used primarily for the purpose of calculating compliance with covenants, such as Debt/EBITDA calculations, and includes the impact of
acquisitions closed during prior periods as if they were completed at the beginning of the reporting period.
(2)

21
Non-GAAP Reconciliation (1)
1) See “Important Disclosure” slides for disclosures related to Supplemental Non-GAAP Financial Measures.