2nd Quarter Year End Projection Estimates
20
2 nd Quarter Year End Projection Estimates City Manager's Office Budget/CIP and Grants Division March 2019
Transcript of 2nd Quarter Year End Projection Estimates
2nd Quarter Year End Projection Estimates
City Manager's OfficeBudget/CIP and Grants Division
March 2019
. FY 2019 2nd Quarter Projections | Page 1
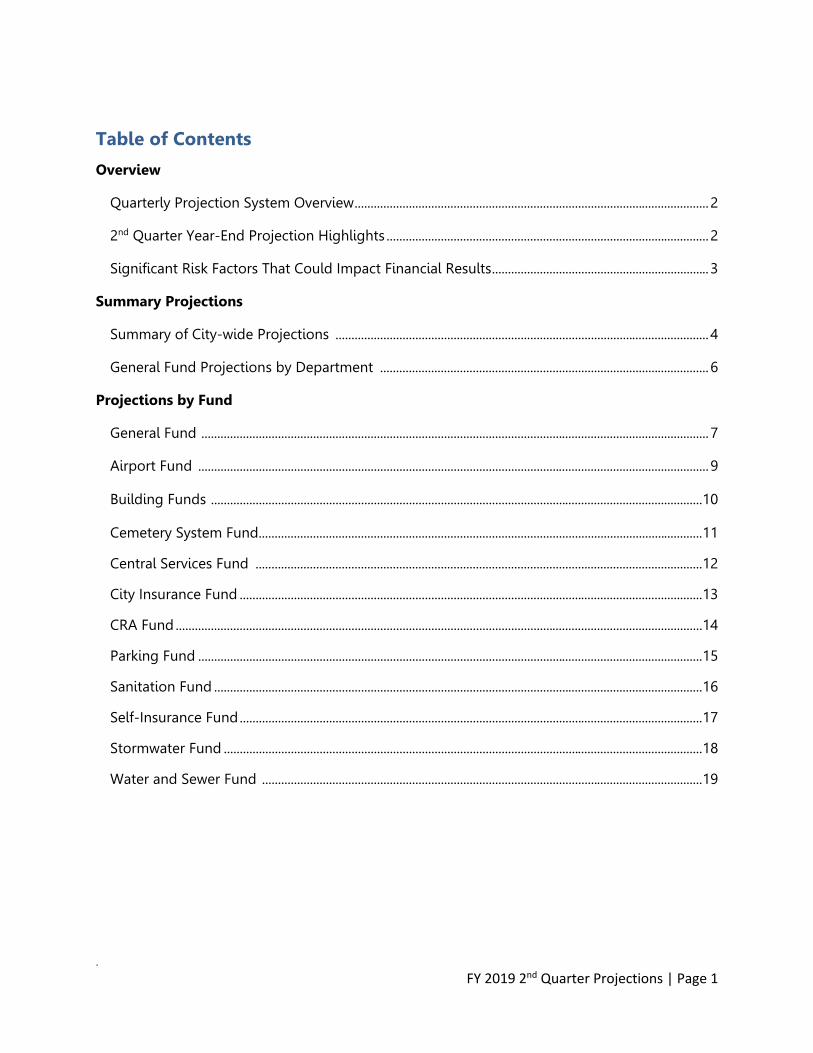
Table of Contents
Overview
Quarterly Projection System Overview ............................................................................................................... 2
2nd Quarter Year-End Projection Highlights ..................................................................................................... 2
Significant Risk Factors That Could Impact Financial Results .................................................................... 3
Summary Projections
Summary of City-wide Projections ..................................................................................................................... 4
General Fund Projections by Department ....................................................................................................... 6
Projections by Fund
General Fund ............................................................................................................................................................... 7
Airport Fund ................................................................................................................................................................ 9
Building Funds .......................................................................................................................................................... 10
Cemetery System Fund ........................................................................................................................................... 11
Central Services Fund ............................................................................................................................................ 12
City Insurance Fund ................................................................................................................................................. 13
CRA Fund ..................................................................................................................................................................... 14
Parking Fund .............................................................................................................................................................. 15
Sanitation Fund ......................................................................................................................................................... 16
Self-Insurance Fund ................................................................................................................................................. 17
Stormwater Fund ...................................................................................................................................................... 18
Water and Sewer Fund .......................................................................................................................................... 19
. FY 2019 2nd Quarter Projections | Page 2
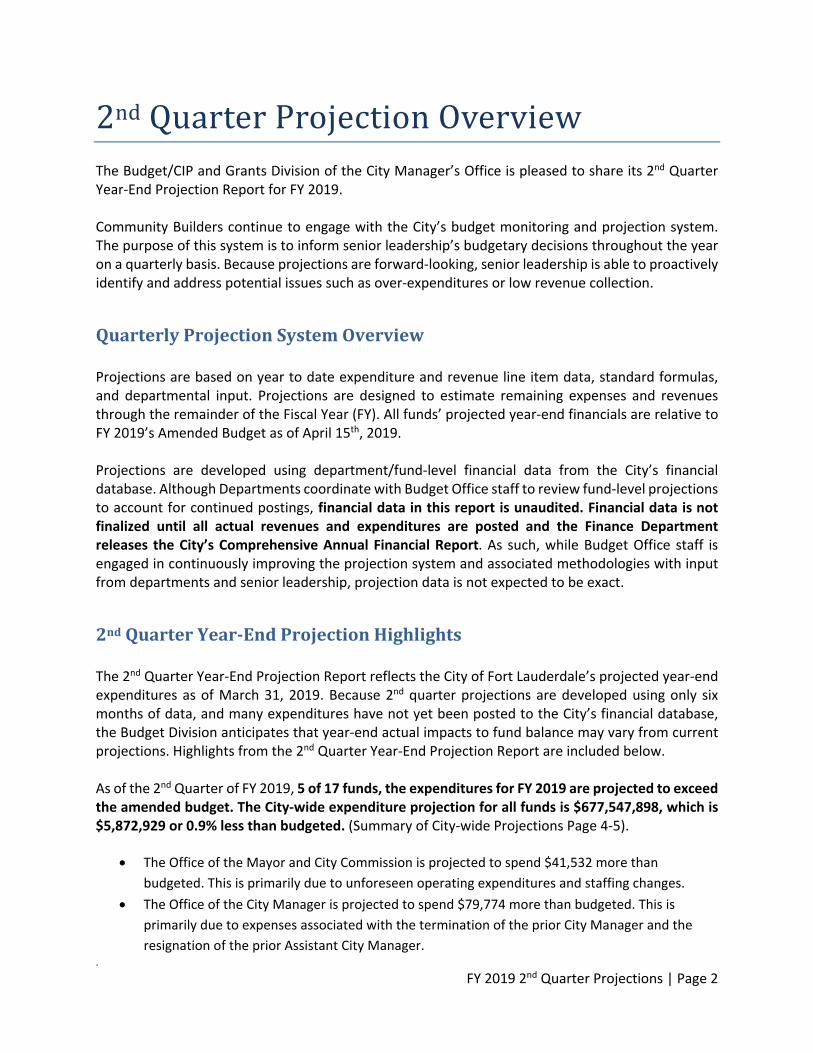
2nd Quarter Projection Overview The Budget/CIP and Grants Division of the City Manager’s Office is pleased to share its 2nd Quarter Year‐End Projection Report for FY 2019. Community Builders continue to engage with the City’s budget monitoring and projection system. The purpose of this system is to inform senior leadership’s budgetary decisions throughout the year on a quarterly basis. Because projections are forward‐looking, senior leadership is able to proactively identify and address potential issues such as over‐expenditures or low revenue collection.
QuarterlyProjectionSystemOverview Projections are based on year to date expenditure and revenue line item data, standard formulas, and departmental input. Projections are designed to estimate remaining expenses and revenues through the remainder of the Fiscal Year (FY). All funds’ projected year‐end financials are relative to FY 2019’s Amended Budget as of April 15th, 2019. Projections are developed using department/fund‐level financial data from the City’s financial database. Although Departments coordinate with Budget Office staff to review fund‐level projections to account for continued postings, financial data in this report is unaudited. Financial data is not finalized until all actual revenues and expenditures are posted and the Finance Department releases the City’s Comprehensive Annual Financial Report. As such, while Budget Office staff is engaged in continuously improving the projection system and associated methodologies with input from departments and senior leadership, projection data is not expected to be exact.
2ndQuarterYear‐EndProjectionHighlights
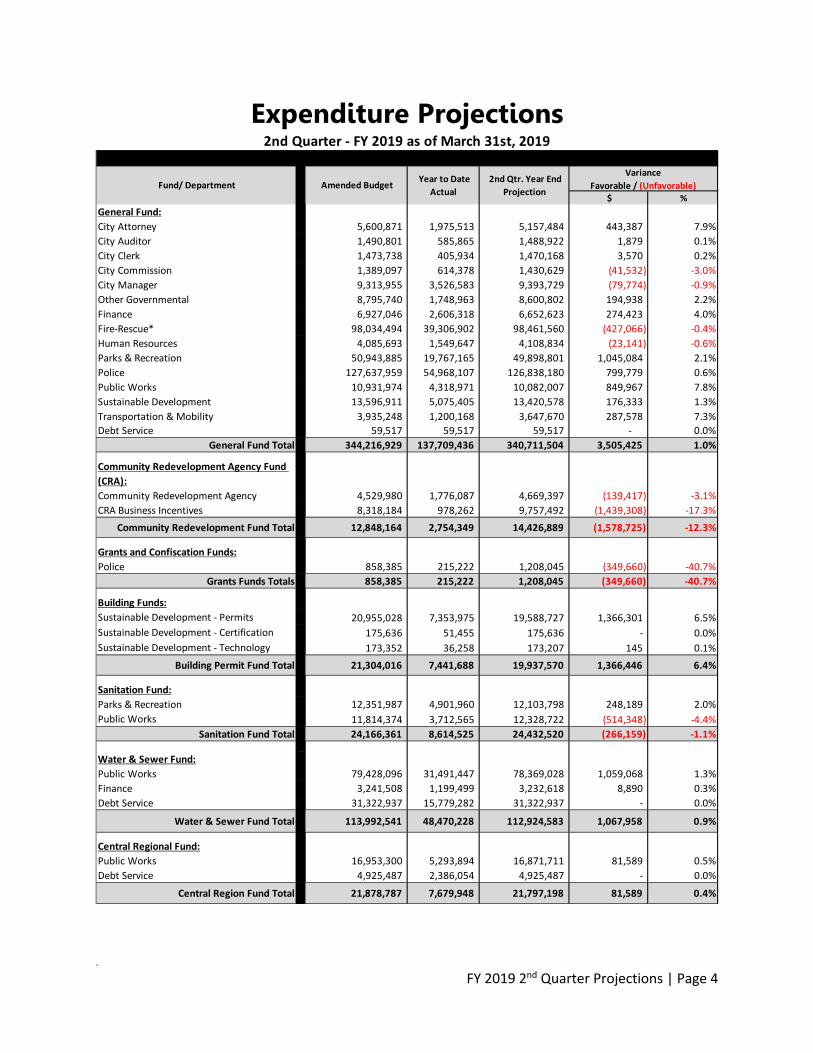
The 2nd Quarter Year‐End Projection Report reflects the City of Fort Lauderdale’s projected year‐end expenditures as of March 31, 2019. Because 2nd quarter projections are developed using only six months of data, and many expenditures have not yet been posted to the City’s financial database, the Budget Division anticipates that year‐end actual impacts to fund balance may vary from current projections. Highlights from the 2nd Quarter Year‐End Projection Report are included below. As of the 2nd Quarter of FY 2019, 5 of 17 funds, the expenditures for FY 2019 are projected to exceed the amended budget. The City‐wide expenditure projection for all funds is $677,547,898, which is $5,872,929 or 0.9% less than budgeted. (Summary of City‐wide Projections Page 4‐5).
The Office of the Mayor and City Commission is projected to spend $41,532 more than
budgeted. This is primarily due to unforeseen operating expenditures and staffing changes.
The Office of the City Manager is projected to spend $79,774 more than budgeted. This is
primarily due to expenses associated with the termination of the prior City Manager and the
resignation of the prior Assistant City Manager.
. FY 2019 2nd Quarter Projections | Page 3
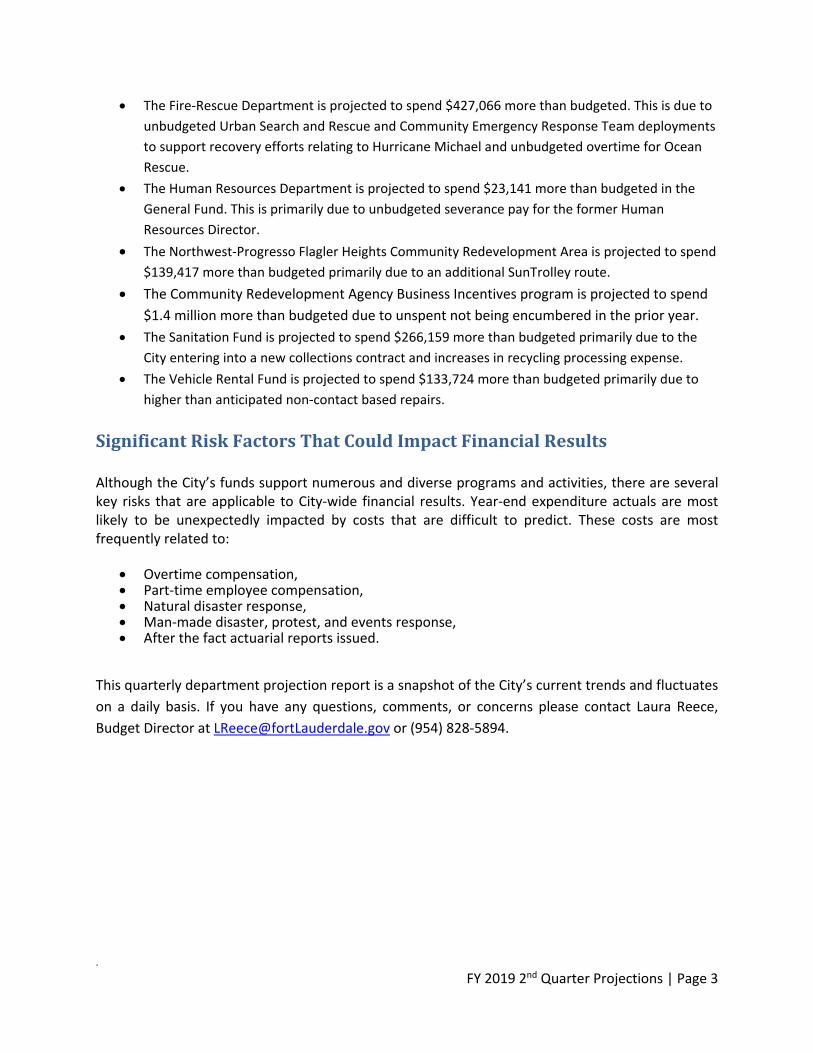
The Fire‐Rescue Department is projected to spend $427,066 more than budgeted. This is due to
unbudgeted Urban Search and Rescue and Community Emergency Response Team deployments
to support recovery efforts relating to Hurricane Michael and unbudgeted overtime for Ocean
Rescue.
The Human Resources Department is projected to spend $23,141 more than budgeted in the
General Fund. This is primarily due to unbudgeted severance pay for the former Human
Resources Director.
The Northwest‐Progresso Flagler Heights Community Redevelopment Area is projected to spend
$139,417 more than budgeted primarily due to an additional SunTrolley route.
The Community Redevelopment Agency Business Incentives program is projected to spend
$1.4 million more than budgeted due to unspent not being encumbered in the prior year.
The Sanitation Fund is projected to spend $266,159 more than budgeted primarily due to the
City entering into a new collections contract and increases in recycling processing expense.
The Vehicle Rental Fund is projected to spend $133,724 more than budgeted primarily due to
higher than anticipated non‐contact based repairs.
SignificantRiskFactorsThatCouldImpactFinancialResults Although the City’s funds support numerous and diverse programs and activities, there are several key risks that are applicable to City‐wide financial results. Year‐end expenditure actuals are most likely to be unexpectedly impacted by costs that are difficult to predict. These costs are most frequently related to:
Overtime compensation, Part‐time employee compensation, Natural disaster response, Man‐made disaster, protest, and events response, After the fact actuarial reports issued.
This quarterly department projection report is a snapshot of the City’s current trends and fluctuates
on a daily basis. If you have any questions, comments, or concerns please contact Laura Reece,
Budget Director at [email protected] or (954) 828‐5894.
. FY 2019 2nd Quarter Projections | Page 4
$ %
General Fund:
City Attorney 5,600,871 1,975,513 5,157,484 443,387 7.9%
City Auditor 1,490,801 585,865 1,488,922 1,879 0.1%
City Clerk 1,473,738 405,934 1,470,168 3,570 0.2%
City Commission 1,389,097 614,378 1,430,629 (41,532) ‐3.0%
City Manager 9,313,955 3,526,583 9,393,729 (79,774) ‐0.9%
Other Governmental 8,795,740 1,748,963 8,600,802 194,938 2.2%
Finance 6,927,046 2,606,318 6,652,623 274,423 4.0%
Fire‐Rescue* 98,034,494 39,306,902 98,461,560 (427,066) ‐0.4%
Human Resources 4,085,693 1,549,647 4,108,834 (23,141) ‐0.6%
Parks & Recreation 50,943,885 19,767,165 49,898,801 1,045,084 2.1%
Police 127,637,959 54,968,107 126,838,180 799,779 0.6%
Public Works 10,931,974 4,318,971 10,082,007 849,967 7.8%
Sustainable Development 13,596,911 5,075,405 13,420,578 176,333 1.3%
Transportation & Mobility 3,935,248 1,200,168 3,647,670 287,578 7.3%
Debt Service 59,517 59,517 59,517 ‐ 0.0%
General Fund Total 344,216,929 137,709,436 340,711,504 3,505,425 1.0%
Community Redevelopment Agency Fund
(CRA):
Community Redevelopment Agency 4,529,980 1,776,087 4,669,397 (139,417) ‐3.1%
CRA Business Incentives 8,318,184 978,262 9,757,492 (1,439,308) ‐17.3%
Community Redevelopment Fund Total 12,848,164 2,754,349 14,426,889 (1,578,725) ‐12.3%
Grants and Confiscation Funds:
Police 858,385 215,222 1,208,045 (349,660) ‐40.7%
Grants Funds Totals 858,385 215,222 1,208,045 (349,660) ‐40.7%
Building Funds:
Sustainable Development ‐ Permits 20,955,028 7,353,975 19,588,727 1,366,301 6.5%
Sustainable Development ‐ Certification 175,636 51,455 175,636 ‐ 0.0%
Sustainable Development ‐ Technology 173,352 36,258 173,207 145 0.1%
Building Permit Fund Total 21,304,016 7,441,688 19,937,570 1,366,446 6.4%
Sanitation Fund:
Parks & Recreation 12,351,987 4,901,960 12,103,798 248,189 2.0%
Public Works 11,814,374 3,712,565 12,328,722 (514,348) ‐4.4%
Sanitation Fund Total 24,166,361 8,614,525 24,432,520 (266,159) ‐1.1%
Water & Sewer Fund:
Public Works 79,428,096 31,491,447 78,369,028 1,059,068 1.3%
Finance 3,241,508 1,199,499 3,232,618 8,890 0.3%
Debt Service 31,322,937 15,779,282 31,322,937 ‐ 0.0%
Water & Sewer Fund Total 113,992,541 48,470,228 112,924,583 1,067,958 0.9%
Central Regional Fund:
Public Works 16,953,300 5,293,894 16,871,711 81,589 0.5%
Debt Service 4,925,487 2,386,054 4,925,487 ‐ 0.0%
Central Region Fund Total 21,878,787 7,679,948 21,797,198 81,589 0.4%
Fund/ Department Amended Budget Year to Date
Actual
Expenditure Projections2nd Quarter ‐ FY 2019 as of March 31st, 2019
2nd Qtr. Year End
Projection
Variance
Favorable / (Unfavorable)

. FY 2019 2nd Quarter Projections | Page 5
$ %
Parking Fund:
Transportation & Mobility 18,538,906 6,416,213 18,318,492 220,414 1.2%
Debt Service 364,277 114,785 314,035 50,242 13.8%
Parking Fund Total 18,903,183 6,530,998 18,632,527 270,656 1.4%
Airport Fund:
Transportation & Mobility 10,283,778 3,064,506 10,133,418 150,360 1.5%
Airport Fund Total 10,283,778 3,064,506 10,133,418 150,360 1.5%
Stormwater Fund:
Public Works 9,702,543 3,770,371 9,696,284 6,259 0.1%
Stormwater Fund Total 9,702,543 3,770,371 9,696,284 6,259 0.1%
City Insurance Fund:
Human Resources 19,991,444 9,382,505 19,350,768 640,676 3.2%
City Insurance Funds Total 19,991,444 9,382,505 19,350,768 640,676 3.2%
Self‐Insured Health Insurance Fund:
Human Resources 34,178,644 10,805,017 32,974,702 1,203,942 3.5%
Health Insurance Funds Total 34,178,644 10,805,017 32,974,702 1,203,942 3.5%
Central Services Fund (ITS):
Information Technology Services 20,675,520 7,298,827 20,377,848 297,672 1.4%
Debt Service 1,499,604 ‐ 1,499,604 ‐ 0.0%
Central Service Fund Total 22,175,124 7,298,827 21,877,452 297,672 1.3%
Vehicle Rental Fund (Fleet):
Public Works 22,198,441 5,997,123 22,332,165 (133,724) ‐0.6%
Vehicle Rental Fund Total 22,198,441 5,997,123 22,332,165 (133,724) ‐0.6%
Cemetery Fund:
Parks & Recreation 3,976,481 885,197 3,592,967 383,514 9.6%
Cemetery Fund Total 3,976,481 885,197 3,592,967 383,514 9.6%
Perpetual Care Fund:
Cemetery 847,607 449,084 1,620,907 (773,300) ‐91.2%
Perpetual Care Fund Total 847,607 449,084 1,620,907 (773,300) ‐91.2%
Arts & Science District Garage Fund:
Transportation & Mobility 1,898,399 562,344 1,898,399 ‐ 0.0%
Arts & Science Garage Fund Total 1,898,399 562,344 1,898,399 ‐ 0.0%
ALL FUNDS TOTALS 683,420,827 261,631,368 677,547,898 5,872,929 0.9%All financial data is from the City’s financial management system as of February 2019.
Fire Rescue Amended budget is as of March to account for the pay plan adjustment to 75th percentile Budget Amendment.
Fund/ Department Amended Budget Year to Date
Actual
Expenditure Projections (Continued)2nd Quarter ‐ FY 2019 as of March 31st, 2019
2nd Qtr. Year End
Projection
Variance
Favorable / (Unfavorable)
. FY 2019 2nd Quarter Projections | Page 6

. FY 2019 2nd Quarter Projections | Page 7
Fund Highlights:
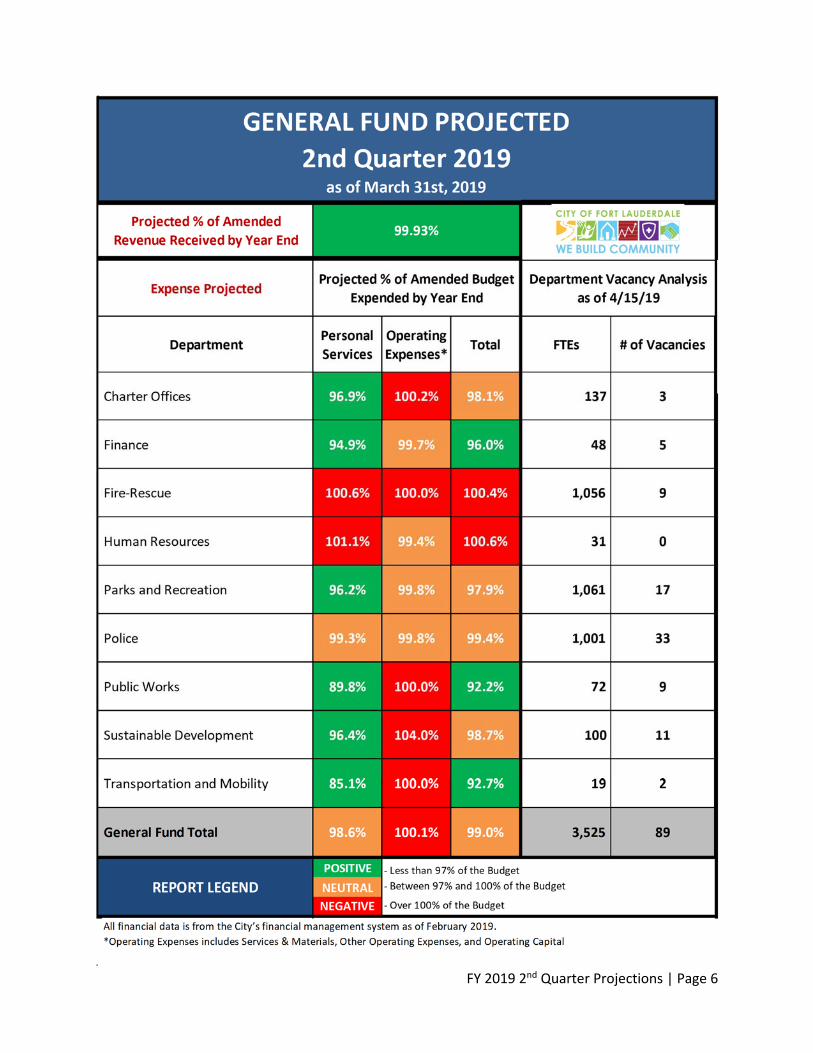
As of the 2nd Quarter of FY 2019, General Fund expenditures are projected to be $340,711,504, which is $3,505,425 or 1.0% less than budgeted. Revenues are expected to be $235,011 or 0.1% less than budgeted. The net impact is a projected $2,278,551 decrease in fund balance from the end of FY 2018. Four of the fourteen General Fund Departments are projected to exceed their expenditure budgets.
The Office of the Mayor and City Commission is projected to spend $41,532 more than
budgeted. This is primarily due to unforeseen operating expenditures and staffing changes.
The Office of the City Manager is projected to spend $79,774 more than budgeted. This is
primarily due to expenses associated with the termination of the prior City Manager and the
resignation of the prior Assistant City Manager.
The Fire‐Rescue Department is projected to spend $427,066 more than budgeted. This is due to
unbudgeted Urban Search and Rescue and Community Emergency Response Team deployments
$ %
Revenue:
Taxes 213,779,208 148,919,074 213,824,885 45,677 0.0%
Licenses & Permits 3,431,600 3,105,554 3,595,080 163,480 4.8%
Intergovernmental Revenue 21,754,971 7,003,327 21,615,029 (139,942) ‐0.6%
Charges for Services 23,838,901 7,944,538 23,461,338 (377,563) ‐1.6%
Fines & Forfeitures 2,311,000 653,658 1,809,270 (501,730) ‐21.7%
Miscellaneous Revenue 93,377,185 54,102,900 93,952,252 575,067 0.6%
Revenue Total 358,492,865 221,729,051 358,257,854 (235,011) ‐0.1%
Other Sources:
Transfers In 1,629,836 991,300 1,508,619 (121,217) ‐7.4%
Appropriation from Fund Balance 5,426,418 ‐ ‐ (5,426,418) ‐100.0%
Other Sources Total 7,056,254 991,300 1,508,619 (5,547,635) ‐78.6%
Total Revenues and Other Sources 365,549,119 222,720,351 359,766,473 (5,782,646) ‐1.6%
Expenditure:
Salaries & Wages* 171,011,441 61,008,136 168,095,554 2,915,887 1.7%
Fringe Benefits 84,474,411 47,012,499 83,797,969 676,442 0.8%
Services/ Materials 37,978,753 12,283,026 38,059,157 (80,404) ‐0.2%
Other Operating Expenses 49,410,284 16,238,039 49,410,284 ‐ 0.0%
Capital Outlay 1,282,523 1,108,218 1,289,023 (6,500) ‐0.5%
Debt Service 59,517 59,517 59,517 ‐ 0.0%
Expenditure Total 344,216,929 137,709,435 340,711,504 3,505,425 1.0%Other Resources Allocated:
Transfer to CIP 1,999,116 891,298 2,169,116 (170,000) ‐8.5%
Other Transfers 19,333,074 11,862,146 19,164,404 168,670 0.9%
Transfers Total 21,332,190 12,753,444 21,333,520 (1,330) 0.0%
Total Expenditures & Other Resources 365,549,119 150,462,879 362,045,024 3,504,095 1.0%
Fund Net ‐$ 72,257,472$ (2,278,551)$
All financial data is from the City’s financial management system as of February 2019.
Fire Rescue Amended budget is as of March to account for the pay plan adjustment to 75th percentile Budget Amendment.
General Fund Projection2nd Quarter ‐ FY 2019 as of March 31st, 2019
Revenue/ Expenditure Type: Amended Budget Year to Date
Actual
2nd Qtr. Year End
Projection
Variance
Favorable / (Unfavorable)

. FY 2019 2nd Quarter Projections | Page 8
to support recovery efforts relating to Hurricane Michael and unbudgeted overtime for Ocean
Rescue.
The Human Resources Department is projected to spend $23,141 more than budgeted in the
General Fund. This is primarily due to unbudgeted severance pay for the former Human
Resources Director.

. FY 2019 2nd Quarter Projections | Page 9
Fund Highlights:
As of the 2nd Quarter of FY 2019, Airport Fund expenditures are projected to be $10,133,418, which is $150,360 or 1.5% less than budgeted. Revenues are expected to be $438,188 or 5.5% more than budgeted. The net impact is a projected $2,352,382 planned decrease in fund balance from the end of FY 2018.
$ %
Revenue:Charges for Services 4,046,153 1,714,180 4,475,965 429,812 10.6%
Miscellaneous Revenue 3,955,055 1,542,838 3,963,431 8,376 0.2%
Revenue Total 8,001,208 3,257,018 8,439,396 438,188 5.5%
Other Sources:
Transfers In 1,342,735 ‐ 1,342,735 ‐ 0.0%
Appropriation from Fund Balance 2,920,930 ‐ ‐ (2,920,930) ‐100.0%
Other Sources Total 4,263,665 ‐ 1,342,735 (2,920,930) ‐68.5%
Total Revenues and Other Sources 12,264,873 3,257,018 9,782,131 (2,482,742) ‐20.2%
Expenditure:
Salaries & Wages 1,490,544 514,105 1,365,967 124,577 8.4%
Fringe Benefits 667,383 352,285 655,490 11,893 1.8%
Services/ Materials 4,188,091 668,760 4,174,201 13,890 0.3%
Other Operating Expenses 3,151,760 1,257,845 3,151,760 ‐ 0.0%
Capital Outlay 786,000 271,511 786,000 ‐ 0.0%
Expenditure Total 10,283,778 3,064,506 10,133,418 150,360 1.5%Other Resources Allocated:
Transfer to CIP 1,981,095 826,766 2,001,095 (20,000) ‐1.0%
Transfers Total 1,981,095 826,766 2,001,095 (20,000) ‐1.0%
Total Expenditures & Other Resources 12,264,873 3,891,272 12,134,513 130,360 1.1%
Fund Net ‐$ (634,254)$ (2,352,382)$
All financial data is from the City’s financial management system as of February 2019.
Airport Fund Projection2nd Quarter ‐ FY 2019 as of March 31st, 2019
Revenue/ Expenditure Type: Amended Budget Year to Date
Actual
2nd Qtr. Year End
Projection
Variance
Favorable / (Unfavorable)

. FY 2019 2nd Quarter Projections | Page 10
Fund Highlights: As of the 2nd Quarter of FY 2019, Building Fund expenditures are projected to be $19,937,570, which is $1,366,446 or 6.4% less than budgeted. Revenues are expected to be $1,753,618 or 7.5% less than budgeted due to a revised rate structure. There is projected to be no change in fund balance from the end of FY 2018 due to the change in rate structure.
$ %
Revenue:
Licenses & Permits 22,250,750 9,087,178 20,884,240 (1,366,510) ‐6.1%
Charges for Services 145,437 16,485 45,780 (99,657) ‐68.5%
Fines & Forfeitures 35,000 57,527 57,527 22,527 64.4%
Miscellaneous Revenue 801,679 218,901 491,701 (309,978) ‐38.7%
Revenue Total 23,232,866 9,380,091 21,479,248 (1,753,618) ‐7.5%
Total Revenues and Other Sources 23,232,866 9,380,091 21,479,248 (1,753,618) ‐7.5%
Expenditure:
Salaries & Wages 9,901,250 3,367,445 9,181,370 719,880 7.3%
Fringe Benefits 3,275,765 1,404,746 3,143,956 131,809 4.0%
Services/ Materials 3,027,806 647,545 2,513,049 514,757 17.0%
Other Operating Expenses 4,387,489 1,793,565 4,387,489 ‐ 0.0%
Capital Outlay 711,706 228,387 711,706 ‐ 0.0%
Expenditure Total 21,304,016 7,441,688 19,937,570 1,366,446 6.4%Other Resources Allocated:
Transfer to CIP 1,541,678 786,556 1,541,678 ‐ 0.0%
Transfer to Fund Balance 387,172 ‐ ‐ 387,172 100.0%
Transfers Total 1,928,850 786,556 1,541,678 387,172 20.1%
Total Expenditures & Other Resources 23,232,866 8,228,244 21,479,248 1,753,618 7.5%
Fund Net ‐$ 1,151,847$ ‐$
All financial data is from the City’s financial management system as of February 2019.
Building Funds Projection2nd Quarter ‐ FY 2019 as of March 31st, 2019
Revenue/ Expenditure Type: Amended Budget Year to Date
Actual
2nd Qtr. Year End
Projection
Variance
Favorable / (Unfavorable)

. FY 2019 2nd Quarter Projections | Page 11
Fund Highlights: As of the 2nd Quarter of FY 2019, Cemetery System Fund expenditures are projected to be $3,592,967, which is $383,514 or 9.6% less than budgeted. Revenues are expected to be $1,219,731 or 22.9% less than budgeted. The net impact is projected to have no impact on fund balance.
$ %
Revenue:
Charges for Services ‐ 38,642 987,609 987,609 100.0%
Miscellaneous Revenue 5,330,017 286,614 3,122,677 (2,207,340) ‐41.4%
Revenue Total 5,330,017 325,256 4,110,286 (1,219,731) ‐22.9%
Total Revenues and Other Sources 5,330,017 325,256 4,110,286 (1,219,731) ‐22.9%
Expenditure:
Salaries & Wages 1,366,700 273,928 1,029,754 336,946 24.7%
Fringe Benefits 585,475 64,224 494,805 90,670 15.5%
Services/ Materials 1,255,006 318,234 1,216,513 38,493 3.1%
Other Operating Expenses 17,000 5,790 34,128 (17,128) ‐100.8%
Capital Outlay 752,300 223,021 817,767 (65,467) ‐8.7%
Expenditure Total 3,976,481 885,197 3,592,967 383,514 9.6%
Other Resources Allocated:
Other Transfers 1,353,536 ‐ 517,319 836,217 61.8%
Transfers Total 1,353,536 ‐ 517,319 836,217 61.8%
Total Expenditures & Other Resources 5,330,017 885,197 4,110,286 1,219,731 22.9%
Fund Net ‐$ (559,941)$ ‐$ All financial data is from the City’s financial management system as of February 2019.
Revenue/ Expenditure Type: Amended Budget Year to Date
Actual
2nd Qtr. Year End
Projection
Variance
Favorable / (Unfavorable)
Cemetery System Fund Projection2nd Quarter ‐ FY 2019 as of March 31st, 2019
. FY 2019 2nd Quarter Projections | Page 12
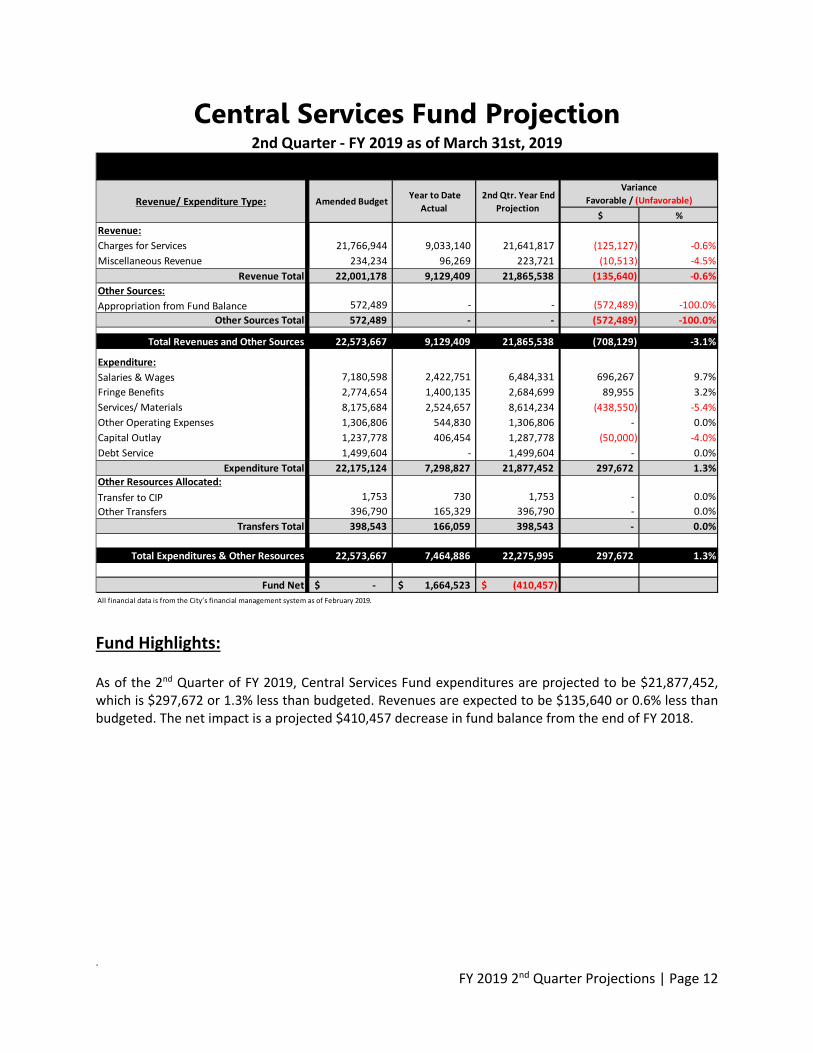
Fund Highlights: As of the 2nd Quarter of FY 2019, Central Services Fund expenditures are projected to be $21,877,452, which is $297,672 or 1.3% less than budgeted. Revenues are expected to be $135,640 or 0.6% less than budgeted. The net impact is a projected $410,457 decrease in fund balance from the end of FY 2018.
$ %
Revenue:
Charges for Services 21,766,944 9,033,140 21,641,817 (125,127) ‐0.6%
Miscellaneous Revenue 234,234 96,269 223,721 (10,513) ‐4.5%
Revenue Total 22,001,178 9,129,409 21,865,538 (135,640) ‐0.6%
Other Sources:
Appropriation from Fund Balance 572,489 ‐ ‐ (572,489) ‐100.0%
Other Sources Total 572,489 ‐ ‐ (572,489) ‐100.0%
Total Revenues and Other Sources 22,573,667 9,129,409 21,865,538 (708,129) ‐3.1%
Expenditure:
Salaries & Wages 7,180,598 2,422,751 6,484,331 696,267 9.7%
Fringe Benefits 2,774,654 1,400,135 2,684,699 89,955 3.2%
Services/ Materials 8,175,684 2,524,657 8,614,234 (438,550) ‐5.4%
Other Operating Expenses 1,306,806 544,830 1,306,806 ‐ 0.0%
Capital Outlay 1,237,778 406,454 1,287,778 (50,000) ‐4.0%
Debt Service 1,499,604 ‐ 1,499,604 ‐ 0.0%
Expenditure Total 22,175,124 7,298,827 21,877,452 297,672 1.3%Other Resources Allocated:
Transfer to CIP 1,753 730 1,753 ‐ 0.0%
Other Transfers 396,790 165,329 396,790 ‐ 0.0%
Transfers Total 398,543 166,059 398,543 ‐ 0.0%
Total Expenditures & Other Resources 22,573,667 7,464,886 22,275,995 297,672 1.3%
Fund Net ‐$ 1,664,523$ (410,457)$
All financial data is from the City’s financial management system as of February 2019.
Central Services Fund Projection2nd Quarter ‐ FY 2019 as of March 31st, 2019
Revenue/ Expenditure Type: Amended Budget Year to Date
Actual
2nd Qtr. Year End
Projection
Variance
Favorable / (Unfavorable)
. FY 2019 2nd Quarter Projections | Page 13
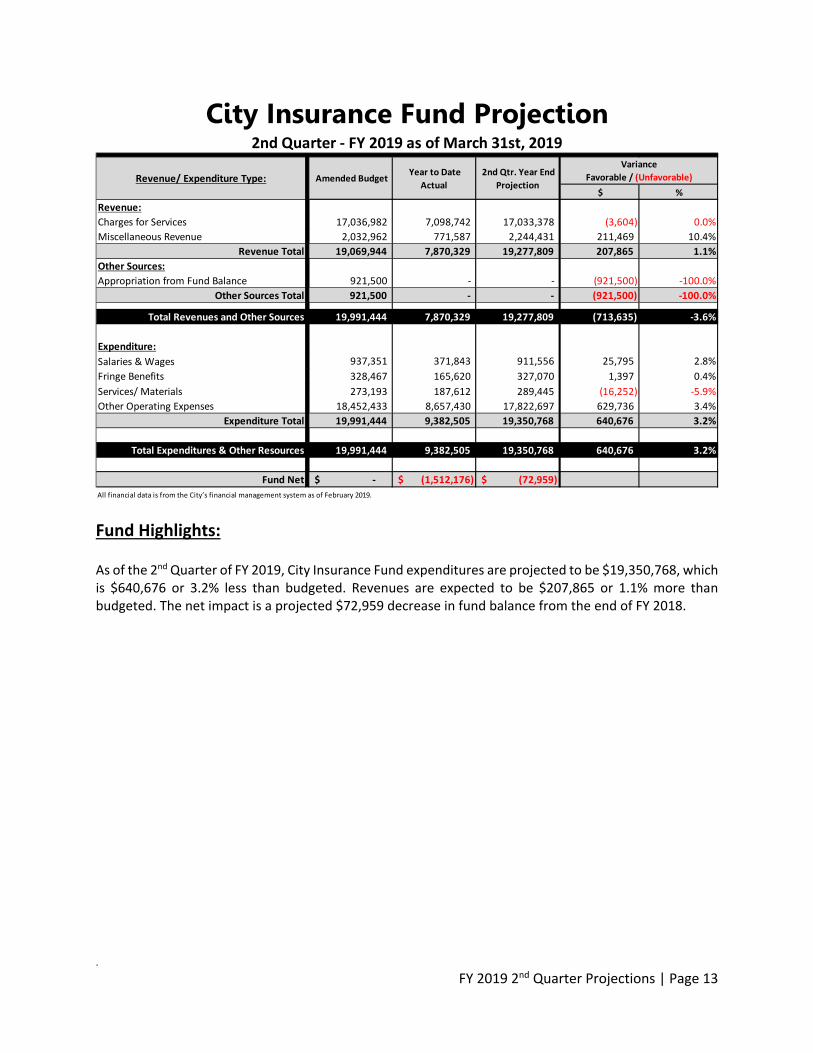
Fund Highlights: As of the 2nd Quarter of FY 2019, City Insurance Fund expenditures are projected to be $19,350,768, which is $640,676 or 3.2% less than budgeted. Revenues are expected to be $207,865 or 1.1% more than budgeted. The net impact is a projected $72,959 decrease in fund balance from the end of FY 2018.
$ %
Revenue:
Charges for Services 17,036,982 7,098,742 17,033,378 (3,604) 0.0%
Miscellaneous Revenue 2,032,962 771,587 2,244,431 211,469 10.4%
Revenue Total 19,069,944 7,870,329 19,277,809 207,865 1.1%
Other Sources:
Appropriation from Fund Balance 921,500 ‐ ‐ (921,500) ‐100.0%
Other Sources Total 921,500 ‐ ‐ (921,500) ‐100.0%
Total Revenues and Other Sources 19,991,444 7,870,329 19,277,809 (713,635) ‐3.6%
Expenditure:
Salaries & Wages 937,351 371,843 911,556 25,795 2.8%
Fringe Benefits 328,467 165,620 327,070 1,397 0.4%
Services/ Materials 273,193 187,612 289,445 (16,252) ‐5.9%
Other Operating Expenses 18,452,433 8,657,430 17,822,697 629,736 3.4%
Expenditure Total 19,991,444 9,382,505 19,350,768 640,676 3.2%
Total Expenditures & Other Resources 19,991,444 9,382,505 19,350,768 640,676 3.2%
Fund Net ‐$ (1,512,176)$ (72,959)$
All financial data is from the City’s financial management system as of February 2019.
City Insurance Fund Projection2nd Quarter ‐ FY 2019 as of March 31st, 2019
Revenue/ Expenditure Type: Amended Budget Year to Date
Actual
2nd Qtr. Year End
Projection
Variance
Favorable / (Unfavorable)
. FY 2019 2nd Quarter Projections | Page 14
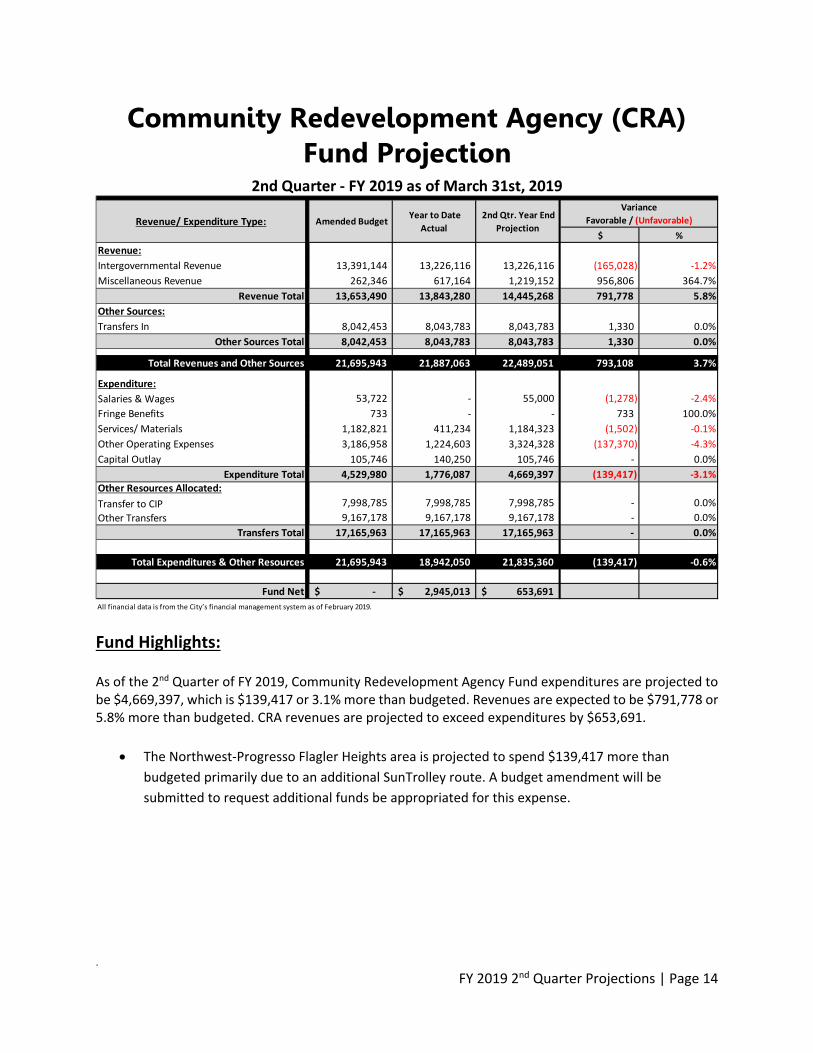
Fund Highlights: As of the 2nd Quarter of FY 2019, Community Redevelopment Agency Fund expenditures are projected to be $4,669,397, which is $139,417 or 3.1% more than budgeted. Revenues are expected to be $791,778 or 5.8% more than budgeted. CRA revenues are projected to exceed expenditures by $653,691.
The Northwest‐Progresso Flagler Heights area is projected to spend $139,417 more than
budgeted primarily due to an additional SunTrolley route. A budget amendment will be
submitted to request additional funds be appropriated for this expense.
$ %
Revenue:
Intergovernmental Revenue 13,391,144 13,226,116 13,226,116 (165,028) ‐1.2%
Miscellaneous Revenue 262,346 617,164 1,219,152 956,806 364.7%
Revenue Total 13,653,490 13,843,280 14,445,268 791,778 5.8%
Other Sources:
Transfers In 8,042,453 8,043,783 8,043,783 1,330 0.0%
Other Sources Total 8,042,453 8,043,783 8,043,783 1,330 0.0%
Total Revenues and Other Sources 21,695,943 21,887,063 22,489,051 793,108 3.7%
Expenditure:
Salaries & Wages 53,722 ‐ 55,000 (1,278) ‐2.4%
Fringe Benefits 733 ‐ ‐ 733 100.0%
Services/ Materials 1,182,821 411,234 1,184,323 (1,502) ‐0.1%
Other Operating Expenses 3,186,958 1,224,603 3,324,328 (137,370) ‐4.3%
Capital Outlay 105,746 140,250 105,746 ‐ 0.0%
Expenditure Total 4,529,980 1,776,087 4,669,397 (139,417) ‐3.1%Other Resources Allocated:
Transfer to CIP 7,998,785 7,998,785 7,998,785 ‐ 0.0%
Other Transfers 9,167,178 9,167,178 9,167,178 ‐ 0.0%
Transfers Total 17,165,963 17,165,963 17,165,963 ‐ 0.0%
Total Expenditures & Other Resources 21,695,943 18,942,050 21,835,360 (139,417) ‐0.6%
Fund Net ‐$ 2,945,013$ 653,691$
All financial data is from the City’s financial management system as of February 2019.
Community Redevelopment Agency (CRA)Fund Projection
2nd Quarter ‐ FY 2019 as of March 31st, 2019
Revenue/ Expenditure Type: Amended Budget Year to Date
Actual
2nd Qtr. Year End
Projection
Variance
Favorable / (Unfavorable)

. FY 2019 2nd Quarter Projections | Page 15
Fund Highlights: As of the 2nd Quarter of FY 2019, Parking Fund expenditures are projected to be $18,632,527, which is $270,656 or 1.4% less than budgeted. Revenues are expected to be $78,667 or 0.4% less than budgeted. The net impact is a projected $4,178,645 decrease in fund balance from the end of FY 2018.
The Parking Fund is projected to spend $4,099,978 more than budgeted due to the partial payment of the parking line of credit.
$ %
Revenue:
Charges for Services 14,631,373 5,569,399 14,907,517 276,144 1.9%
Fines & Forfeitures 4,001,000 1,234,071 3,646,660 (354,340) ‐8.9%
Miscellaneous Revenue 789,102 252,342 788,631 (471) ‐0.1%
Revenue Total 19,421,475 7,055,812 19,342,808 (78,667) ‐0.4%
Total Revenues and Other Sources 19,421,475 7,055,812 19,342,808 (78,667) ‐0.4%
Expenditure:
Salaries & Wages 4,669,254 1,523,846 4,244,732 424,522 9.1%
Fringe Benefits 1,818,180 849,427 1,773,726 44,454 2.4%
Services/ Materials 4,408,281 1,148,765 4,407,807 474 0.0%
Other Operating Expenses 7,606,227 2,831,975 7,606,227 ‐ 0.0%
Capital Outlay 286,000 62,200 286,000 ‐ 0.0%
Debt Service 115,241 114,785 314,035 (198,794) ‐172.5%
Expenditure Total 18,903,183 6,530,998 18,632,527 270,656 1.4%
Other Resources Allocated:
Transfer to CIP 300,917 300,382 (1,151,155) 1,452,072 482.5%
Other Transfers ‐ ‐ 6,040,081 (6,040,081) ‐100.0%
Transfer to Fund Balance 217,375 ‐ ‐ 217,375 100.0%
Transfers Total 518,292 300,382 4,888,926 (4,370,634) ‐843.3%
Total Expenditures & Other Resources 19,421,475 6,831,380 23,521,453 (4,099,978) ‐21.1%
Fund Net ‐$ 224,432$ (4,178,645)$
All financial data is from the City’s financial management system as of February 2019.
Parking Fund Projection2nd Quarter ‐ FY 2019 as of March 31st, 2019
Revenue/ Expenditure Type: Amended Budget Year to Date
Actual
2nd Qtr. Year End
Projection
Variance
Favorable / (Unfavorable)

. FY 2019 2nd Quarter Projections | Page 16
Fund Highlights: As of the 2nd Quarter of FY 2019, Sanitation Fund expenditures are projected to be $24,432,520, which is $266,159 or 1.1% more than budgeted. Revenues are expected to be $731,903 or 4.3% more than budgeted. The net impact is a projected $451,930 decrease in fund balance from the end of FY 2018.
The Sanitation Fund is projected to spend $266,159 more than budgeted primarily due to the
City entering into a new collections contract and increases in recycling processing expense.
$ %
Revenue:
Charges for Services 17,025,089 6,927,398 17,662,004 636,915 3.7%
Miscellaneous Revenue 132,387 117,472 227,375 94,988 71.8%
Revenue Total 17,157,476 7,044,870 17,889,379 731,903 4.3%
Other Sources:
Transfers In 6,100,000 2,541,667 6,100,000 ‐ 0.0%
Appropriation from Fund Balance 917,674 ‐ ‐ (917,674) ‐100.0%
Other Sources Total 7,017,674 2,541,667 6,100,000 (917,674) ‐13.1%
Total Revenues and Other Sources 24,175,150 9,586,537 23,989,379 (185,771) ‐0.8%
Expenditure:
Salaries & Wages 5,390,844 1,967,642 5,150,728 240,116 4.5%
Fringe Benefits 2,717,584 1,357,135 2,653,065 64,519 2.4%
Services/ Materials 12,197,815 3,563,382 12,771,422 (573,607) ‐4.7%
Other Operating Expenses 3,027,701 1,235,104 3,024,888 2,813 0.1%
Capital Outlay 832,417 491,262 832,417 ‐ 0.0%
Expenditure Total 24,166,361 8,614,525 24,432,520 (266,159) ‐1.1%Other Resources Allocated:
Transfer to CIP 8,789 3,662 8,789 ‐ 0.0%
Transfers Total 8,789 3,662 8,789 ‐ 0.0%
Total Expenditures & Other Resources 24,175,150 8,618,187 24,441,309 (266,159) ‐1.1%
Fund Net ‐$ 968,350$ (451,930)$
All financial data is from the City’s financial management system as of February 2019.
Sanitation Fund Projection2nd Quarter ‐ FY 2019 as of March 31st, 2019
Revenue/ Expenditure Type: Amended Budget Year to Date
Actual
2nd Qtr. Year End
Projection
Variance
Favorable / (Unfavorable)
. FY 2019 2nd Quarter Projections | Page 17
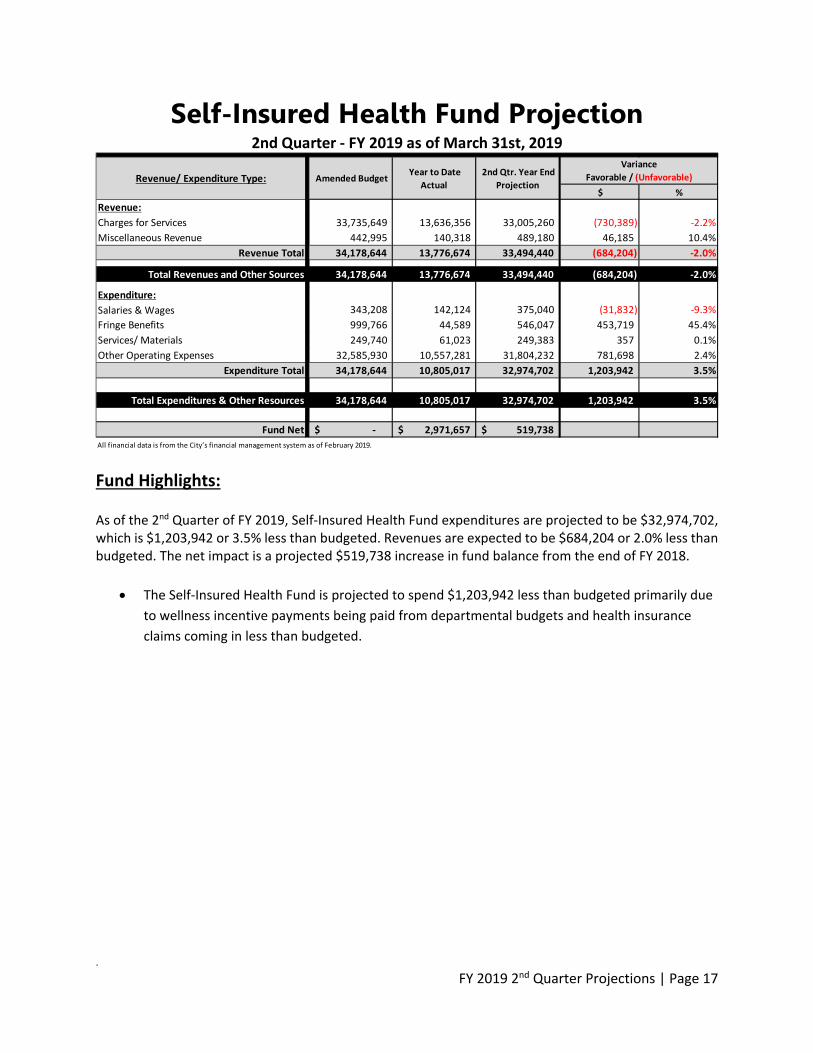
Fund Highlights: As of the 2nd Quarter of FY 2019, Self‐Insured Health Fund expenditures are projected to be $32,974,702, which is $1,203,942 or 3.5% less than budgeted. Revenues are expected to be $684,204 or 2.0% less than budgeted. The net impact is a projected $519,738 increase in fund balance from the end of FY 2018.
The Self‐Insured Health Fund is projected to spend $1,203,942 less than budgeted primarily due
to wellness incentive payments being paid from departmental budgets and health insurance
claims coming in less than budgeted.
$ %
Revenue:
Charges for Services 33,735,649 13,636,356 33,005,260 (730,389) ‐2.2%
Miscellaneous Revenue 442,995 140,318 489,180 46,185 10.4%
Revenue Total 34,178,644 13,776,674 33,494,440 (684,204) ‐2.0%
Total Revenues and Other Sources 34,178,644 13,776,674 33,494,440 (684,204) ‐2.0%
Expenditure:
Salaries & Wages 343,208 142,124 375,040 (31,832) ‐9.3%
Fringe Benefits 999,766 44,589 546,047 453,719 45.4%
Services/ Materials 249,740 61,023 249,383 357 0.1%
Other Operating Expenses 32,585,930 10,557,281 31,804,232 781,698 2.4%
Expenditure Total 34,178,644 10,805,017 32,974,702 1,203,942 3.5%
Total Expenditures & Other Resources 34,178,644 10,805,017 32,974,702 1,203,942 3.5%
Fund Net ‐$ 2,971,657$ 519,738$
All financial data is from the City’s financial management system as of February 2019.
Self-Insured Health Fund Projection2nd Quarter ‐ FY 2019 as of March 31st, 2019
Revenue/ Expenditure Type: Amended Budget Year to Date
Actual
2nd Qtr. Year End
Projection
Variance
Favorable / (Unfavorable)

. FY 2019 2nd Quarter Projections | Page 18
Fund Highlights: As of the 2nd Quarter of FY 2019, Stormwater Fund expenditures are projected to be $9,696,284, which is $6,259 or 0.1% less than budgeted. Revenues are expected to be $806,381 or 4.5% less than budgeted. The net impact is a projected $3,352,762 increase in fund balance from the end of FY 2018.
Service charge revenues are primarily generated by fixed stormwater fees, which are not based
on consumption levels. Projected service charge revenues are lower than budgeted because
agents of the State are no longer making stormwater utility fee payments. This decrease was
further cemented by the Florida’s Fourth District Court of Appeal stormwater utility fee decision
on January 23, 2019.
$ %
Revenue:
Charges for Services 17,289,000 7,452,521 16,401,242 (887,758) ‐5.1%
Miscellaneous Revenue 493,648 178,128 575,025 81,377 16.5%
Revenue Total 17,782,648 7,630,649 16,976,267 (806,381) ‐4.5%
Total Revenues and Other Sources 17,782,648 7,630,649 16,976,267 (806,381) ‐4.5%
Expenditure:
Salaries & Wages 2,281,326 816,062 2,283,740 (2,414) ‐0.1%
Fringe Benefits 1,099,529 553,404 1,094,122 5,407 0.5%
Services/ Materials 3,849,436 702,568 3,840,631 8,805 0.2%
Other Operating Expenses 2,050,910 778,888 2,056,449 (5,539) ‐0.3%
Capital Outlay 421,342 919,449 421,342 ‐ 0.0%
Expenditure Total 9,702,543 3,770,371 9,696,284 6,259 0.1%Other Resources Allocated:
Transfer to CIP 3,927,221 1,636,342 3,927,221 ‐ 0.0%
Transfer to Fund Balance 4,152,884 ‐ ‐ 4,152,884 100.0%
Transfers Total 8,080,105 1,636,342 3,927,221 4,152,884 51.4%
Total Expenditures & Other Resources 17,782,648 5,406,713 13,623,505 4,159,143 23.4%
Fund Net ‐$ 2,223,936$ 3,352,762$
All financial data is from the City’s financial management system as of February 2019.
Stormwater Fund Projection2nd Quarter ‐ FY 2019 as of March 31st, 2019
Revenue/ Expenditure Type: Amended Budget Year to Date
Actual
2nd Qtr. Year End
Projection
Variance
Favorable / (Unfavorable)
. FY 2019 2nd Quarter Projections | Page 19
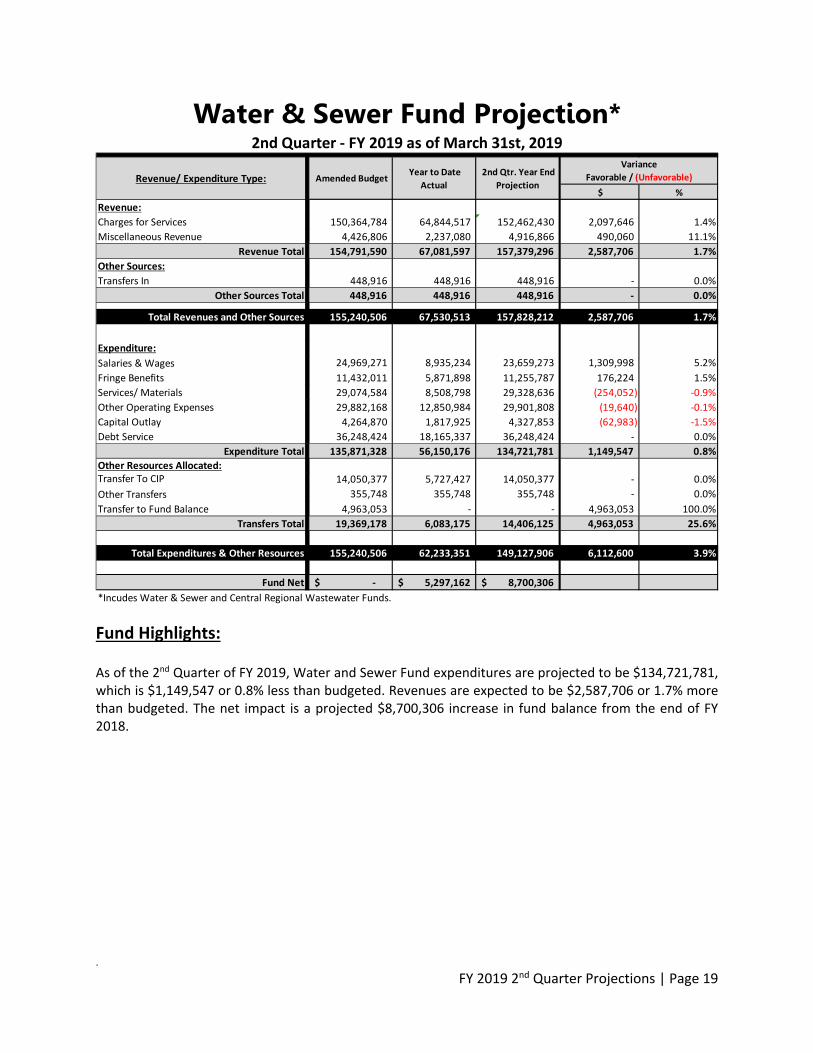
Fund Highlights: As of the 2nd Quarter of FY 2019, Water and Sewer Fund expenditures are projected to be $134,721,781, which is $1,149,547 or 0.8% less than budgeted. Revenues are expected to be $2,587,706 or 1.7% more than budgeted. The net impact is a projected $8,700,306 increase in fund balance from the end of FY 2018.
$ %
Revenue:
Charges for Services 150,364,784 64,844,517 152,462,430 2,097,646 1.4%
Miscellaneous Revenue 4,426,806 2,237,080 4,916,866 490,060 11.1%
Revenue Total 154,791,590 67,081,597 157,379,296 2,587,706 1.7%
Other Sources:
Transfers In 448,916 448,916 448,916 ‐ 0.0%
Other Sources Total 448,916 448,916 448,916 ‐ 0.0%
Total Revenues and Other Sources 155,240,506 67,530,513 157,828,212 2,587,706 1.7%
Expenditure:
Salaries & Wages 24,969,271 8,935,234 23,659,273 1,309,998 5.2%
Fringe Benefits 11,432,011 5,871,898 11,255,787 176,224 1.5%
Services/ Materials 29,074,584 8,508,798 29,328,636 (254,052) ‐0.9%
Other Operating Expenses 29,882,168 12,850,984 29,901,808 (19,640) ‐0.1%
Capital Outlay 4,264,870 1,817,925 4,327,853 (62,983) ‐1.5%
Debt Service 36,248,424 18,165,337 36,248,424 ‐ 0.0%
Expenditure Total 135,871,328 56,150,176 134,721,781 1,149,547 0.8%
Other Resources Allocated:Transfer To CIP 14,050,377 5,727,427 14,050,377 ‐ 0.0%
Other Transfers 355,748 355,748 355,748 ‐ 0.0%
Transfer to Fund Balance 4,963,053 ‐ ‐ 4,963,053 100.0%
Transfers Total 19,369,178 6,083,175 14,406,125 4,963,053 25.6%
Total Expenditures & Other Resources 155,240,506 62,233,351 149,127,906 6,112,600 3.9%
Fund Net ‐$ 5,297,162$ 8,700,306$
*Incudes Water & Sewer and Central Regional Wastewater Funds.
Water & Sewer Fund Projection*2nd Quarter ‐ FY 2019 as of March 31st, 2019
Revenue/ Expenditure Type: Amended Budget Year to Date
Actual
2nd Qtr. Year End
Projection
Variance
Favorable / (Unfavorable)