
296 mahadik
21
Photoelectrocatalytic Degradation of Salicylic acid using Sprayed Gold Doped Iron Oxide Thin Films M.A. Mahadik M.A. Mahadik Shri Ganeshay Namah Electrochemical Materials Laboratory, Department of Physics, Shivaji University, Kolhapur - 416004 under the guidance of Prof. (Dr.) C.H. Bhosale by
-
Upload
4th-international-conference-on-advances-in-energy-research-icaer-2013 -
Category
Technology
-
view
205 -
download
3
Transcript of 296 mahadik

Photoelectrocatalytic Degradation of Salicylic acid using Sprayed Gold Doped Iron Oxide Thin
Films
M.A. MahadikM.A. Mahadik
Shri Ganeshay Namah
Electrochemical Materials Laboratory,Department of Physics,
Shivaji University, Kolhapur - 416004
under the guidance of
Prof. (Dr.) C.H. Bhosale
by

2
Outline of the presentationOutline of the presentation
IntroductionExperimentalResults and DiscussionPEC XRD Optical properties SEM Electrical resistivity measurements Photoelectrocatalytic degradation of salicylic acid
Conclusions
IntroductionExperimentalResults and DiscussionPEC XRD Optical properties SEM Electrical resistivity measurements Photoelectrocatalytic degradation of salicylic acid
Conclusions

3
Introduction
Recently, TiO2 (Eg = 3.2 eV):promising material but absorbs ~ 3-4% of solar spectrum Alternative Fe2O3 with band gap (2.2 eV) absorbs ~ 40% visible light
0.0
0.5
1.0
1.5
2.0
2.5
0.0 0.2 0.4 0.6 0.8 1.0 1.2 1.4 1.6 1.8 2.0En
erg
y D
istr
ibu
tio
n (
kW/m
-2.m
m)
Wavelength (mm)
Spectral distribution of sunlight. AM0 and AM1.5 with radiation distribution at 6000K.
6000 K black body
AM0 radiation
AM1.5 radiation
Importance of problem
4
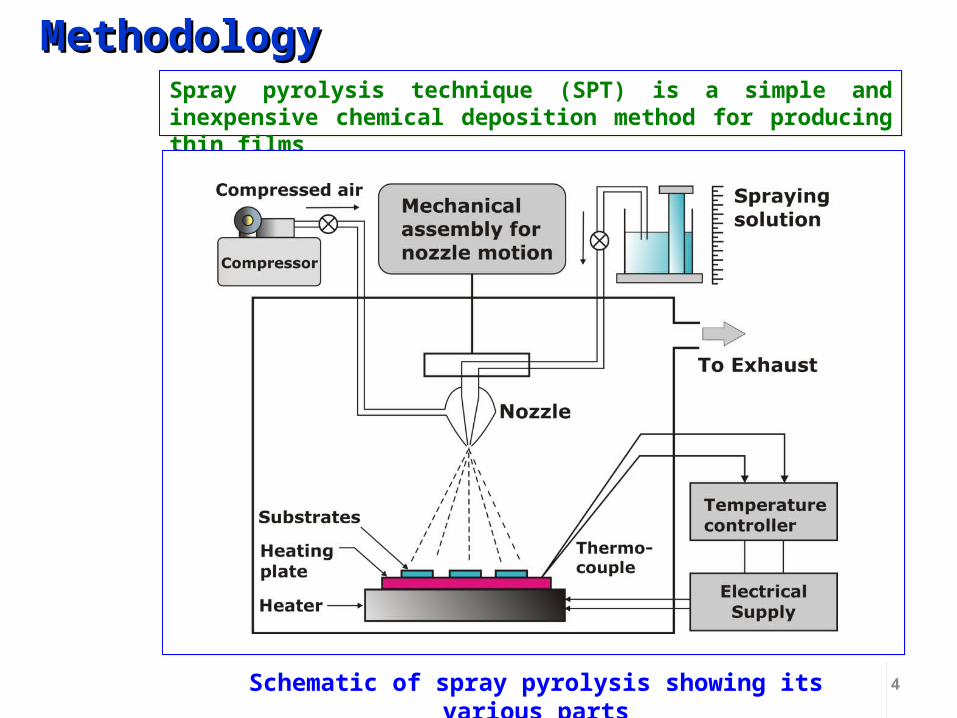
MethodologyMethodologySpray pyrolysis technique (SPT) is a simple and inexpensive chemical deposition method for producing thin filmsSpray pyrolysis technique (SPT) is a simple and inexpensive chemical deposition method for producing thin films
Schematic of spray pyrolysis showing its various partsSchematic of spray pyrolysis showing its various parts
5
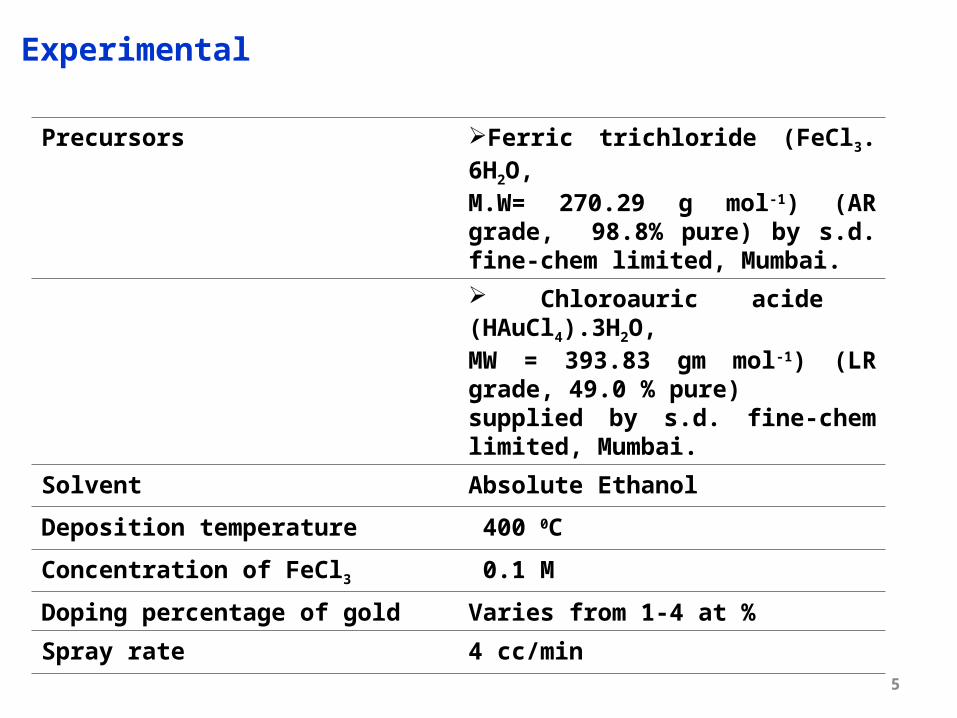
Experimental
Precursors Ferric trichloride (FeCl3. 6H2O, M.W= 270.29 g mol-1) (AR grade, 98.8% pure) by s.d. fine-chem limited, Mumbai.
Chloroauric acide (HAuCl4).3H2O, MW = 393.83 gm mol-1) (LR grade, 49.0 % pure) supplied by s.d. fine-chem limited, Mumbai.
Solvent Absolute Ethanol
Deposition temperature 400 0C
Concentration of FeCl3 0.1 M
Doping percentage of gold Varies from 1-4 at %
Spray rate 4 cc/min

6
Undoped 1 at % 2 at % 3 at % 4 at %
Photograph of undoped and Au doped Fe2O3 thin films deposited on glass and FTO substrates
7
A
V
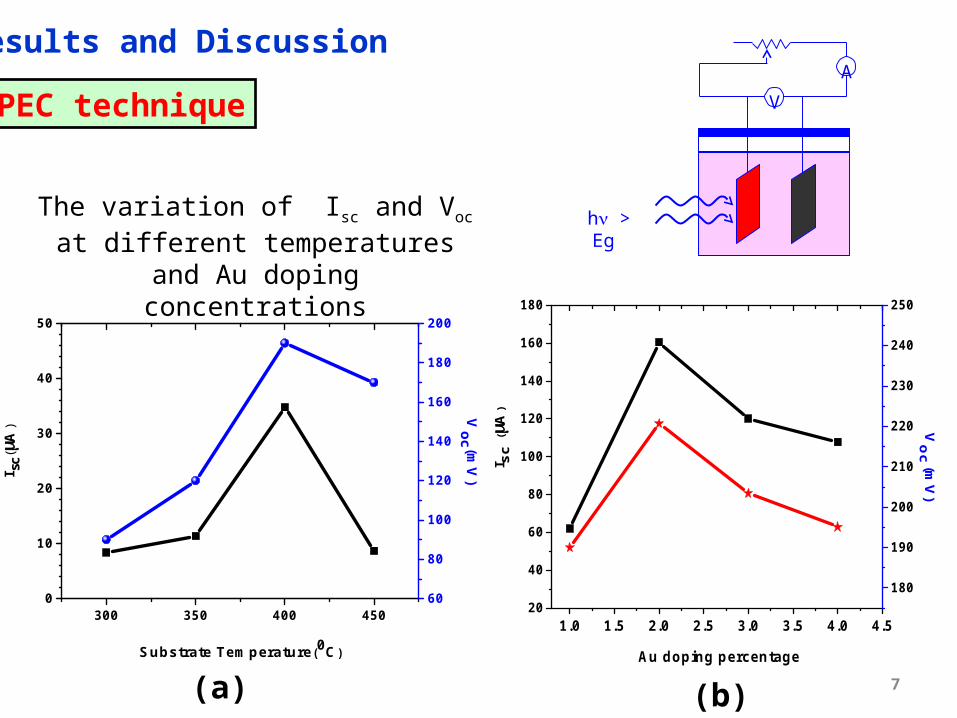
h > Eg The variation of Isc and Voc at different temperatures and Au doping
concentrations
300 350 400 4500
10
20
30
40
50
Substrate Temperature(0C)
I sc(mA
)
60
80
100
120
140
160
180
200
Voc (m
V)
1.0 1.5 2.0 2.5 3.0 3.5 4.0 4.520
40
60
80
100
120
140
160
180
Au doping percentage
I sc
(mA
)
180
190
200
210
220
230
240
250
Voc
(mV)
(a) (b)
Results and Discussion
PEC technique

8
X-ray diffraction pattern Au: Fe2O3 thin films on Glass substrates
20 30 40 50 60 70 80
4 at % Au:Fe2O
3
3 at % Au:Fe2O
3
2 at % Au:Fe2O
3
1 at % Au:Fe2O
3Inte
nsi
ty (
A.U
.)
2(Degree)
Undoped Fe2O
3
(10
4)
(11
0)
(00
6)
(02
4)
(11
6)
PDF Card - 01-077-9924

9
SEM of undoped and 2at % Au doped FeSEM of undoped and 2at % Au doped Fe22OO33 thin film deposited thin film deposited
at 400 at 400 ooC substrate temperatureC substrate temperature
a b

10
0.0 0.5 1.0 1.5 2.0 2.5 3.0 3.5 4.00.055
0.060
0.065
0.070
0.075
0.080
0.085
0.090
Act
ivat
ion E
ner
gy
(eV)
Au Doping %1.8 2.0 2.2 2.4 2.6 2.8 3.0 3.2
3
4
5
6
7
8
9
10
11
12
undoped Fe2O
3
1 at% Au:Fe2O
3
2 at% Au:Fe2O
3
3 at% Au:Fe2O
3
4 at% Au:Fe2O
3
ln
1000/T (K-1)
Sr No. Sample name
Activation energy
1 Undoped Fe2O3
0.085
2 1at % Au Fe2O3
0.076
3 2at % Au Fe2O3
0.058
4 3 at % Au Fe2O3
0.085
5 4 at % Au Fe2O3
0.086
kT
Eexp0
11
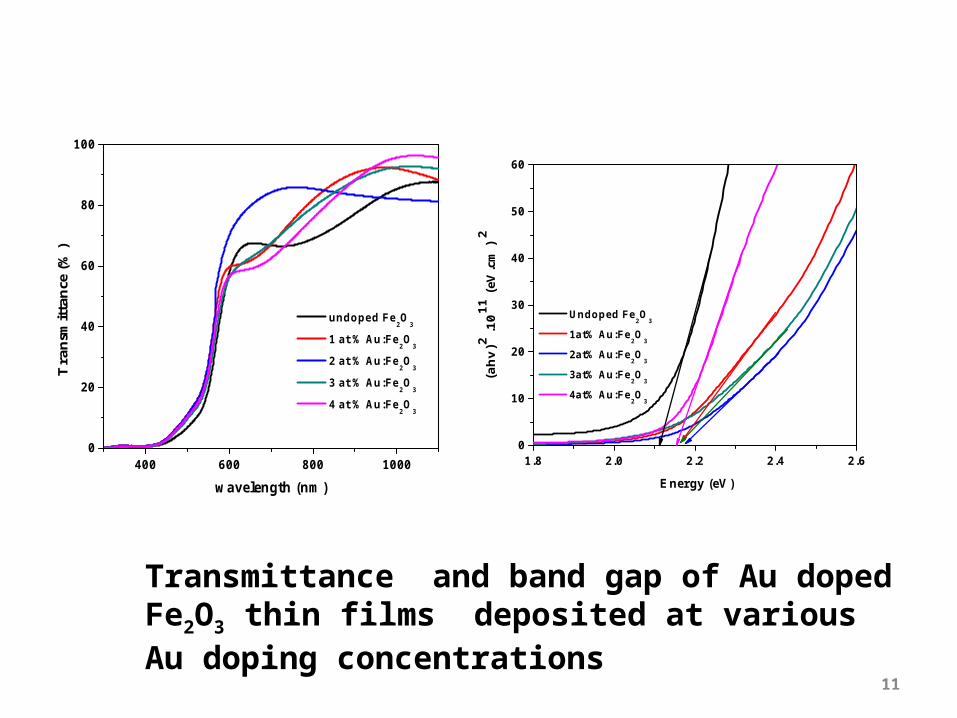
Transmittance and band gap of Au doped Fe2O3 thin films deposited at various Au doping concentrations
400 600 800 10000
20
40
60
80
100
undoped Fe2O
3
1 at % Au:Fe2O
3
2 at % Au:Fe2O
3
3 at % Au:Fe2O
3
4 at % Au:Fe2O
3
wavelength (nm)
Tra
nsm
ittan
ce (%
)
1.8 2.0 2.2 2.4 2.60
10
20
30
40
50
60
Energy (eV)(a
hv)2
.10
11 (
eV.c
m) 2
Undoped Fe2O
3
1at% Au:Fe2O
3
2at% Au:Fe2O
3
3at% Au:Fe2O
3
4at% Au:Fe2O
3

10 cm
10 c
m
F:SnO2 / glassRs = 5-10 cm-2
t = 1 mm
Photograph of Fluorine doped Tin oxide (FTO) thin films by spray pyrolysis

13
10 cm
Photograph of undoped and 2at % Au doped Fe2O3 thin films by spray pyrolysis

14Photographs of single cell reactor with gasket for circulation of water
Front side view of reactor Closed view of reactor
Back side view of reactor Back side of reactor
15
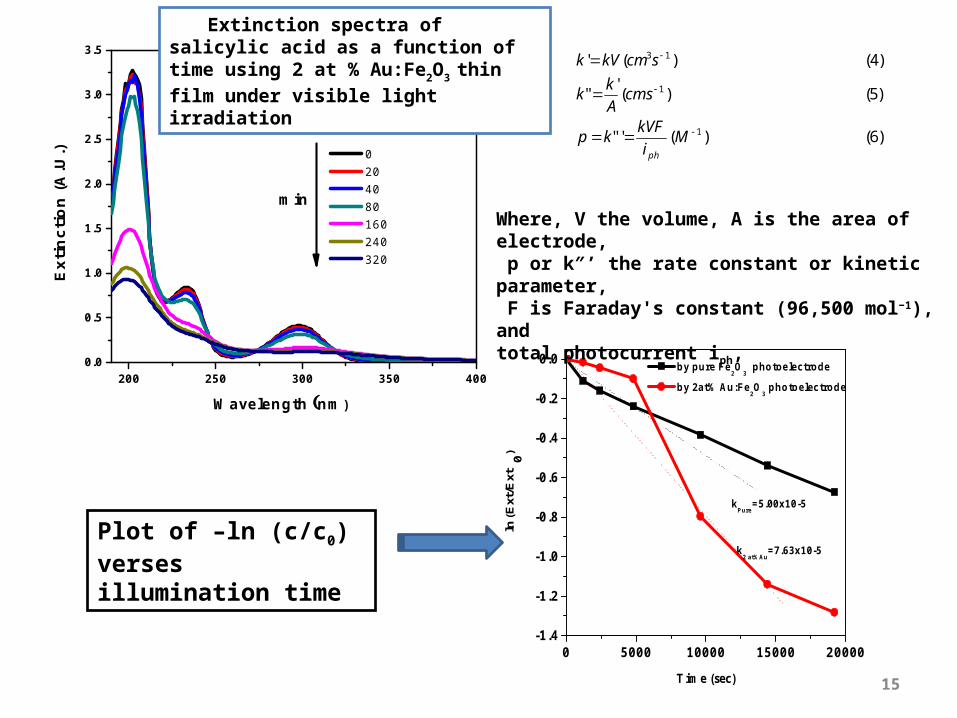
200 250 300 350 4000.0
0.5
1.0
1.5
2.0
2.5
3.0
3.5
Wavelength nm)
0 20 40 80 160 240 320
Ext
inct
ion (A
.U.)
min
0 5000 10000 15000 20000-1.4
-1.2
-1.0
-0.8
-0.6
-0.4
-0.2
0.0 by pure Fe2O
3 photoelectrode
by 2at% Au:Fe2O
3 photoelectrode
ln(E
xt/E
xt0)
Time (sec)
k2 at%Au
=7.63x10⁻⁵
kPure
=5.00x10⁻⁵
Extinction spectra of salicylic acid as a function of time using 2 at % Au:Fe2O3 thin
film under visible light irradiation
Plot of –ln (c/c0) verses illumination time
)6()('"
)5()('
"
)4()('
1
1
13
Mi
kVFkp
scmA
kk
scmkVk
ph
Where, V the volume, A is the area of electrode, p or k″’ the rate constant or kinetic parameter, F is Faraday's constant (96,500 mol−1), and total photocurrent iph,
16
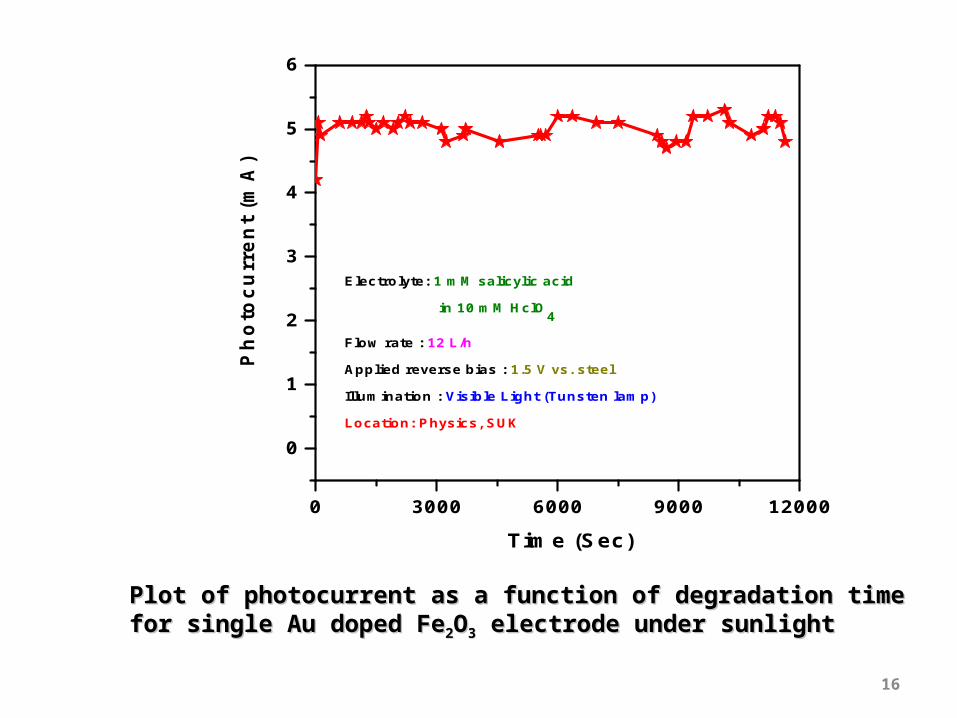
0 3000 6000 9000 12000
0
1
2
3
4
5
6
Electrolyte: 1 mM salicylic acid
in 10 mM HclO4
Flow rate : 12 L/h
Applied reverse bias : 1.5 V vs. steel
Illumination : Visible Light (Tunsten lamp)
Location: Physics, SUK
Photo
curr
ent (m
A)
Time (Sec)
Plot of photocurrent as a function of degradation time for single Au doped Plot of photocurrent as a function of degradation time for single Au doped FeFe22OO33 electrode under sunlight electrode under sunlight
17
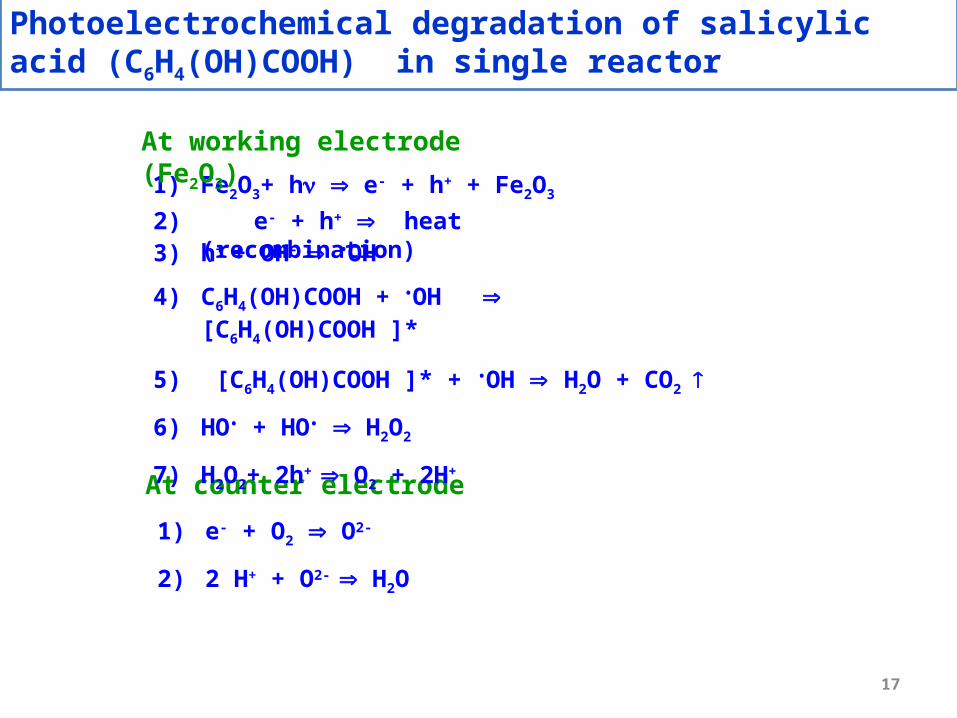
Photoelectrochemical degradation of salicylic acid (C6H4(OH)COOH) in single reactor
1) Fe2O3+ h e- + h+ + Fe2O3
At working electrode (Fe2O3)
At counter electrode
1) e- + O2 O2-
2) 2 H+ + O2- H2O
2) e- + h+ heat (recombination)3) h+ + OH- •OH
4) C6H4(OH)COOH + •OH [C6H4(OH)COOH ]*
5) [C6H4(OH)COOH ]* + •OH H2O + CO2
6) HO• + HO• H2O2
7) H2O2+ 2h+ O2 + 2H+

18
Plot of COD and TOC as a function of reaction Plot of COD and TOC as a function of reaction time for single Au doped Fetime for single Au doped Fe22OO33 electrode under electrode under
visible light source visible light source
0 5000 10000 15000 20000
6
8
10
12
14
16
18
20
CODTOC
Reaction time (Sec)
CO
D (m
g/L)
10
15
20
25
30
35
40
TOC
(mg/L)
COD = no. of O2*Concentration *32*1000TOC= no. of C*12*Concentration*1000

19
Parameters and conditions for Salicylic acid degradation by Parameters and conditions for Salicylic acid degradation by FeFe22OO33 based electrode under visible light (tungsten lamp) based electrode under visible light (tungsten lamp)
Electrode Electrolyte Electrolyte volume
(l)
Bias, (V)
Mean photo-current, iph,
(A)
Active area (cm2)
Rate constant
(s-1)
Kineticparameter
(M)
Remaining Time require
d(min)
Undoped Fe2O3 1mM Salicylic acid
10mM HClO4
0.150 1.5 (cell) 0.04 64 5.0 10-5 0.0072 37 % 320
2at % Au Fe2O3
1mM Salicylic acid
10mM HClO4
0.150 1.5 (cell) 0.052 64 7.610-5 0.0084 25 % 320
20
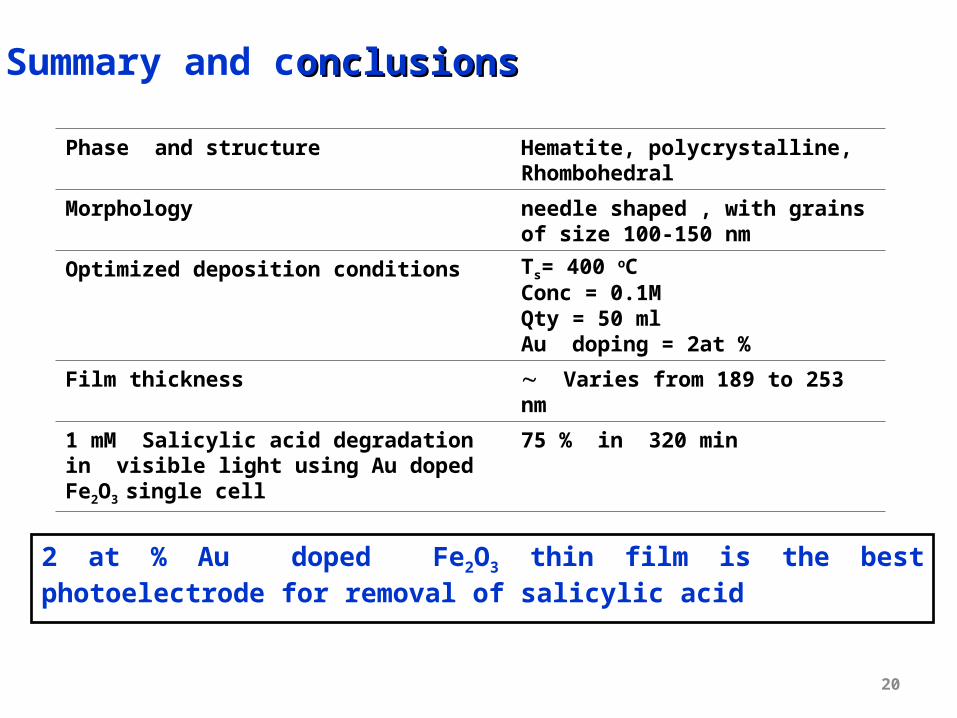
Summary and conclusionsonclusions
Phase and structure Hematite, polycrystalline, Rhombohedral
Morphology needle shaped , with grains of size 100-150 nm
Optimized deposition conditions Ts= 400 oCConc = 0.1MQty = 50 mlAu doping = 2at %
Film thickness Varies from 189 to 253 nm
1 mM Salicylic acid degradation in visible light using Au doped Fe2O3 single cell
75 % in 320 min
2 at % Au doped Fe2O3 thin film is the best photoelectrode for removal of salicylic acid

21

![leg.wa.govleg.wa.gov/CodeReviser/WACArchive/Documents/2012/WAC-296-826... · (2/17/09) [Ch. 296-826 WAC—p. 1] Chapter 296-826 Chapter 296-826 WAC ANHYDROUS AMMONIA WAC 296-826-100](https://static.fdocuments.net/doc/165x107/5b2b78217f8b9ae6278b475f/legwa-21709-ch-296-826-wacp-1-chapter-296-826-chapter-296-826-wac.jpg)


![WAC 296 - 46B CHAPTERlawfilesext.leg.wa.gov/law/WACArchive/2014/WAC 296... · (11/5/13) [ch. 296-46b wac p. 1] chapter 296-46b chapter 296-46b wac electrical safety standards, administration,](https://static.fdocuments.net/doc/165x107/5f937088d75d77697316c60c/wac-296-46b-296-11513-ch-296-46b-wac-p-1-chapter-296-46b-chapter.jpg)

![Chapter 296-841 Chapter 296-841 WAC AIRBORNE …lawfilesext.leg.wa.gov/law/WACArchive/2013/WAC-296-841-CHAPTE… · (2/20/07) [Ch. 296-841 WAC—p. 1] Chapter 296-841 Chapter 296-841](https://static.fdocuments.net/doc/165x107/605db1edd2831252ec0d5d41/chapter-296-841-chapter-296-841-wac-airborne-22007-ch-296-841-wacap-1.jpg)


