2013 Philippine Human Development Report Geography and Human Development

MODULE - 9Human resourcedevelopment in India
Notes
285
Human Development
GEOGRAPHY
28
HUMAN DEVELOPMENT
Whenever, we think about development, we normally tend to think about thematerial and economic development. Materials may include house, landed prop-erty, motor vehicle, jewellery etc. Again all these material assets are converted interms of money, whenever or wherever the need arises. Till today, the entireworld is divided into two groups of countries - developed and developing. Thisclassification is mostly based on level of economic development. Though thistrend is still continuing but a change in thinking about development was intro-duced and that was a change in emphasis on measurement of development frompurely economic to human. In 1990 two economists - Prof. Mehbub Al Haqueand Prof. Amartya Sen introduced the concept of Human Development. From1990 onwards, United Nations Development Programme (UNDP), each yearcalculate Human Development Index (HDI) and publish as a report which isknown as Human Development Report (HDR). This report, is published eachyear in which almost all the countries are placed under three categories, high,medium and low based on the defined parameters.
In this lesson, we will learn about the concept and process of measuring humandevelopment index. We will also find out India’s position among the variouscountries in the world. Simultaneously, we will also analyse position of variousstates of India as far as human development index is concerned. At the end, wewill suggest certain measures to improve human development in our country.
OBJECTIVES
After studying this lesson, you will be able to:
define the term human development; explain the term human development index; describe the regional patterns of human development index in the states of
India; and highlight the need for improvement in human development index in Indian
contex.
MODULE - 9
Notes
Human resourcedevelopment in India
286
Human Development
GEOGRAPHY
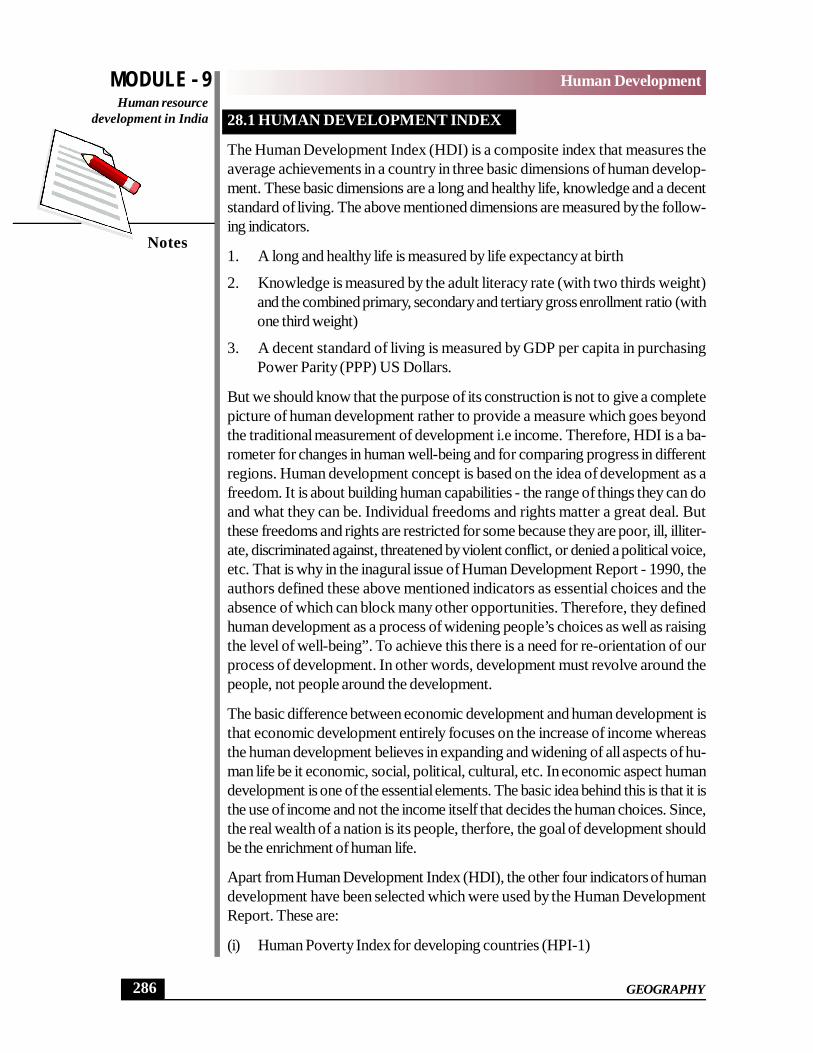
28.1 HUMAN DEVELOPMENT INDEX
The Human Development Index (HDI) is a composite index that measures theaverage achievements in a country in three basic dimensions of human develop-ment. These basic dimensions are a long and healthy life, knowledge and a decentstandard of living. The above mentioned dimensions are measured by the follow-ing indicators.
1. A long and healthy life is measured by life expectancy at birth
2. Knowledge is measured by the adult literacy rate (with two thirds weight)and the combined primary, secondary and tertiary gross enrollment ratio (withone third weight)
3. A decent standard of living is measured by GDP per capita in purchasingPower Parity (PPP) US Dollars.
But we should know that the purpose of its construction is not to give a completepicture of human development rather to provide a measure which goes beyondthe traditional measurement of development i.e income. Therefore, HDI is a ba-rometer for changes in human well-being and for comparing progress in differentregions. Human development concept is based on the idea of development as afreedom. It is about building human capabilities - the range of things they can doand what they can be. Individual freedoms and rights matter a great deal. Butthese freedoms and rights are restricted for some because they are poor, ill, illiter-ate, discriminated against, threatened by violent conflict, or denied a political voice,etc. That is why in the inagural issue of Human Development Report - 1990, theauthors defined these above mentioned indicators as essential choices and theabsence of which can block many other opportunities. Therefore, they definedhuman development as a process of widening people’s choices as well as raisingthe level of well-being”. To achieve this there is a need for re-orientation of ourprocess of development. In other words, development must revolve around thepeople, not people around the development.
The basic difference between economic development and human development isthat economic development entirely focuses on the increase of income whereasthe human development believes in expanding and widening of all aspects of hu-man life be it economic, social, political, cultural, etc. In economic aspect humandevelopment is one of the essential elements. The basic idea behind this is that it isthe use of income and not the income itself that decides the human choices. Since,the real wealth of a nation is its people, therfore, the goal of development shouldbe the enrichment of human life.
Apart from Human Development Index (HDI), the other four indicators of humandevelopment have been selected which were used by the Human DevelopmentReport. These are:
(i) Human Poverty Index for developing countries (HPI-1)
MODULE - 9Human resourcedevelopment in India
Notes
287
Human Development
GEOGRAPHY
(ii) Human Poverty Index for selected DECD Countries (HPI-2)
(iii) Gender - related Development Index (GDI)
(iv) Gender Empowered Measurement (GEM)
Out of these given, HDI, HPI-1 and GDI are calculated by three common dimen-sions - a long and healthy life, knowledge and a decent standard of living. Butsome of indicators are different within these dimensions. Let us know their simi-larities and differences from the table given below.
Table No. 28.1: A comparative analysis of Dimensions usedin HDI, HPI-1 and GDI
Sl. Indices HDI HPI-1 GDINo.
1. A long and Life expectancy at birth Probability at birth of Life expectancy at birthhealthy life not swimming at age 40
2. Knowledge Adult literacy rate Adult literacy rate Adult literacy rate(with two thirdweight) and
The combined primary, Percentage of the Combined primary,secondary and gross population without secondary and tertiaryenrolment (with one sustainable access gross enrolment ratiothird weight) to an improved water
source
3. A decent GDP per capita (adju- The percentage of Estimated earnedstandard of sted to purchasing power children under weight income (PPP in US $)living parity in US$) for age of one year.
28.2 WHY HUMAN DEVELOPMENT
Paul Streeten, a development economist identified six reasons in favour of thehuman development. The reasons are as follows:
1. The ultimate purpose of the entire exercise of development is to improve thehuman conditions and to enlarge people’s choice.
2. Human development is a means to higher productivity. A well nourished,healthy, educated, skilled alert labour force is the most productive asset.Therefore investments in these sectors are justified on ground of productivity.
3. It helps in reducing the rate of growth of population.
4. Human development is friendly to the physical environment also. Deforesta-tion, desertification and soil erosion decline when poverty declines.
5. Improved living conditions and reduced poverty contribute to a healthy civilsociety and greater social stability.
6. Human development also helps in reducing civil disturbance in the societyand in increasing political stabililty.

MODULE - 9
Notes
Human resourcedevelopment in India
288
Human Development
GEOGRAPHY
Till now you might have understood the importance of human development. Let usnow have a closer look at India’s position at international level as far as humandevelopment is concerned. We will also try to find out the reasons for low levels ofhuman development in India
28.3 INDIA : TRENDS OF HDI
According to Human Development Report 2005, India’s rank was 127 out of177 countries of the world. All the 177 countries are grouped under three catego-ries. These are high, medium and low. The countries which had value between0.800 and above are termed as high. The countries which had value between0.500 to 0.799 were ranked under medium categories and countries which hadvalue less than 0.500 were ranked as low human development countries. Indiawas placed almost at the bottom of the table in the medium level category. Ourneighbouring countries like China (85), Sri Lanka (93), Maldives (96) remainedwell above the India’s position. Other neighbouring countries like Myanamar (129),Bhutan (134), Pakistan (135) and Nepal (136) were placed just below India. Thecountries which lied below India were mostly from Africa and rest few countrieswere from Asia. If we look at India’s situation over the time we can definitely saythat it has improved a lot over the last thirty years (Table 28.2)
Table No. 28.2: INDIA : Human Development Index Trendsin India 1975 - 2005
Years 1975 1980 1985 1990 1995 2000 2005
India 0.412 0.438 0.476 0.513 0.546 0.577 0.602
Source: Human Development Report, 2005, p.225
This improvement is not sufficient enough. There are many small countries of Asiaand Africa like Fiji, Mongolia, Tunisia, etc. are well above India. India has towork very hard to be placed among the top countries in the medium human devel-opment category (0.501 - 0.800). If the present trend continues it needs minimum30 years to enter the high human development category. And for this, a rigorouseffort particularly in the social sector like education, health and economic sectorparticularly reduction of poverty are required. The following are the reasons tokeep India at the bottom of human development (a) rapid increase in population(b) large number of adult illiterates and low gross enrolment ratio (c) high drop-out rates (d) inadequate government expenditure on education and health, (e)large proportion of under weight children as well as under nourished people (f)very poor sanitation facilities and low access to essential life saving medicines.
Apart from HDI, the performance of India is also not very encouraging as far asGender Development Index (GDI) and Human Poverty Index (HDI) are con-cerned. According to Human Development Report, 2005, India’s position in GDIwas 98 out of 140 countries and in HPI-1 was 58 out of 103 countries.
MODULE - 9Human resourcedevelopment in India
Notes
289
Human Development
GEOGRAPHY
INTEXT QUESTIONS 28.1
1. What is Human Development Index?
________________________________________________________
2. Name the three dimensions and their respective indicator used for measuringHDI.
(i) ___________________________________________________
(ii) ___________________________________________________
(iii) ___________________________________________________
3. Differentiate between human development and economic development
________________________________________________________
4. How do we measure Human Poverty Index (HPI-1)for developing countries(HPI -1)
(i) ___________________________________________________
(ii) ___________________________________________________
(iii) ___________________________________________________
5. What is India’s position in Human Development Index according to HumanDevelopment Report - 2005. Name any two neighbouring countries of Indiawho are doing better than India.
________________________________________________________
________________________________________________________
________________________________________________________
28.4 SOCIO-ECONOMIC INDICATORS
Let us now have a brief discussion about the various socio-economic indicators ofIndia that are responsible for human development. As mentioned earlier, we willdiscuss health and education under social indicators and general economy withreference to per capital income and poverty.
Health Situations in India
As you know health is one of the three dimensions of human development. Thoughunder health life expectancy is considered as the indicator, but we should knowother health related demographic indicators like birth rate, death rate, total fertilityrate, infant mortality rate, etc as well as about health facilities like hospital, dispen-sary, beds in the hospital, number of doctors and nurses, etc. to have a holistic
MODULE - 9
Notes
Human resourcedevelopment in India
290
Human Development
GEOGRAPHY
view about the health situation in the country. Definitely, today the health situationhas improved a lot since Independence.
Today, there have been significant demographic changes and epidemological shiftshave occurred. India has been able to control various communicable diseases.However, under communicable diseases Vector Born Disease and AIDS continueto be critical areas of concern. With the decline in death rates, increase in lifeexpectancy and changing life styles, there has been an increase in non-communicablediseases like cardio-vascular ailments, cancer, cataract induced blindness, diabetesetc. In all the above mentioned diseases, the disease of AIDS pose unique challenge,because no cure is available for till today. Secondly, India ranks second in theworld, next only to South Africa with an estimated population of 5.206 millionpersons infected by HIV/AIDS by December 2005. Recently, according toUNAIDS estimate, India has the largest number of HIV/AIDS population,surpassing South Africa. Though India is placed among the list of low prevalencecountry, our problem is the large population base. Specifically in the activereproductive age group of 15-49 years. You can find out the total number ofinfected persons from the age-composition table no 27.3 in the previous lesson. Ifwe really want young people to prevent HIV infection, we have to enhance our lifeskills in the following ways.
Understand and feel good about yourself. Have faith in yourself. Understandyour own strengths and weaknesses. Maintain your self-respect and self-confidence.
Be positive in your attitude towards life. Be ready to learn from experienceseven if they are not pleasant.
In difficult situations, try to identify the cause of the problem. Identify the bestsolutions available and then follow them.
Share your concerns with others and seek timely help when needed. Adopt a healthy lifestyle. Make responsible decisions. Seek reliable information and make informed choices and decisions. Think of the consequences of your decisions and actions, do not act hastily
and impulsively. Learn from the experiences of others; we can benefit from the mistakes of
others. Manage your stress by sharing your concerns with others and by seeking help
from parents, teachers, friends, and counselors. Have the courage to say ‘no’ to peer pressure. Be caring and empathetic towards people who need special care such as
people living with HIV/AIDS (PLWHA).
Seek out and share information on sensitive reproductive health issues.

MODULE - 9Human resourcedevelopment in India
Notes
291
Human Development
GEOGRAPHY
Study the following table to know health related indicators.
Table 28.3: INDIA : Selected Health Indicators (1951–2003)
Sl.No. Indicator 1951 2003
1. Birth Rate (per thousand) 40.8 24.8
2. Death Rate (per thousand) 25.1 8.0
3. Infant Mortality Rate 146 60(per thousand live births) (1951-61)*
4. Child (0-4 years) Mortality 57.3 17.8Rate (per thousand children) (1972)* (2002)*
5. Total Fertility Rate 6.0 3.0(2001)*
6. Life Expectancy Rate (Male) 37.2 63.9 (2001-06)* (Female) 36.2 66.9 (2001-06)*
Source: Economic Survey 2005-06, Ministry of Finance, Govt of India, p-25
Note: The figure given in the brackets refer to the year which is different from thereference year mentioned in the particular columns of the table
I am sure you have read the table carefully. As we said earlier that there has beensignificant improvement in each health indicator. But the desired result has notbeen achieved in reducing birth rate, infant mortality rate as well as total fertilityrate. There is a need for sustained effort particularly in remote rural areas wherehealth care system is almost non-functional. As far as health care facilities in thecountry are concerned it has increased in leaps and bounds.
Table 28.4: INDIA : Trends in Health Care Facilities 1951-2004
Sl.No. Facilities 1951 2004
1. Sub centre, Primary Health centre, 725 1,68,986Community Health Centre
2. Dispensaries and Hospitals 9,209 38,031 (2002)
3. Beds (Private and Public) 1,17,198 9,14,543 (2002)
4. Nursing Personnel 18,054 8,36,000
5. Doctors (Modern System) 61,800 6,25,131
Source: Economic Survey 2005-06, Ministry of Finance, Govt of India, p-212.
During 50 years (1951-2001) population has increased alarmingly from 36.10crores to 102.70 crores. Simultaneously number of patients as well as problems
MODULE - 9
Notes
Human resourcedevelopment in India
292
Human Development
GEOGRAPHY
related to birth, infant child and mother care has increased significantly. Thereforethe health system is still at cross roads with a wide gap between demand andsupply. Therefore the health system is still at cross roads with a wide gap betweendemand and supply. Looking at the distribution of medical facilities we find there ishighly unequal distribution and most of the facilities are concentrated around ma-jor cities and towns. To reduce the inequality Government of India started anambition project of National Rural Health Mission. (NRHM). This programmewas launched on April 12, 2005 for a period of 7 years. The vision and targetoutcome of NRHM is given below. A part from NRHM, Government of India hasalso launched many programmes related to health aspect of women and childrenlike Janani Suraksha Yojana (JSY), Balika Samridhi Yojana (BSY) and KishoriShakti Yojna (KSY) etc.
Table 28.5: National Rural Health Mission (NRHM):Vision and Target Outcome
Vision of NRHM Target outcome
To be implemented throughout IMR to be reduced zero per thousandthe country with special focus on live births by 201218 states with weak public healthindicators and/or weakinfrastructure
To improve the availability IMR to be reduced to 100 perand access to quality health care 100,000 live births by 2012
To build synergy between health TFR reduced to 2.1 by 2012and determinants of good health like Malaria mortality to be reducednutritions, sanitation, hygiene and by 50% by 2010 and 60% by 2012safe drinking water A complete elimination of Kala Azar
mortality by 2010 To streamline the Indian Systems Filaria to be reduced by 70% by 2010,
of Medicine to facilitate compreh- 80% by 2012 and completeensive health care elimination by 2015
To increase the absorptive capacity Dengue mortality to be reduced byof the health delivery system to en- 50% by 2010 and sustaining it at thatable it to handle increased allocations. level till 2012
To involve the community over the Cataract operations increasing toplanning process. 46 lakh per annum.
To upgradate the infrastructure Leprosy prevalence rate to be reducedfrom 1.8. per 10,000 in 2005 to lessthan 1 per 10,000 thereafter
To assist in capacity building TB DOTS series - Maintains 85% To increase the fund allocation
for health sector.
Source: Economic survey, 2005-06, Ministry of Finance, Government of India, p-217
cure rate through entire missionperiod
MODULE - 9Human resourcedevelopment in India
Notes
293
Human Development
GEOGRAPHY
Knowledge Indicators
Knowledge is always considered as power that empowers human being in variousways. An individual with certain levels of knowledge will have economic freedomand will have wide choice for growth and development. Today’s soceity is movingtowards knowledge society and a major chunk of population derived their suste-nance that is based on knowledge economy. Due to these factors, knowledge wasconsidered as one of the integral parts of human development index. But knowl-edge is a qualitative aspect and has many dimensions to it. In HDI two dimensionsof knowledge were taken into consideration. As mentioned earlier, they are (a)adult literacy rate and (b) combined primary, secondary, and tertiary gross enroll-ment ratio.
Therefore, in this lesson, we will not discuss about the trend and regional patternsof literacy rather we will specifically discussed about adult literacy. It’s because ofthe fact that we have already discussed about literacy in details in the lesson no-27. The other fact for detailed discussion about adult literacy is that it is taken asone of the indicators to measure the knowledge component. According to NSSO52nd Round (1995-96) and as reported in selected Educational Statistics (1997-98), 54.38% of adults are literate. According to the Human Development Report2005, the adult literacy in India, is 61.0% in 2003. But if we make statewiseanalysis, the pattern has not changed much.
The regional pattern of adult literacy varies considerably. It may be observed thatstates below the national average are Bihar (including Jharkhand), Rajasthan, UttarPradesh (including Uttaranchal), Arunachal Pradesh, Andhra Pradesh, MadhyaPradesh (including Chhatisgarh), Jammu and Kashmir and Orissa. Therefore, thereis a need for improvement of adult literacy in these states.
Gross Enrollment Ratio (GER)
It indicates the proportion between the total number of learners in a particular agegroup that are supposed to be in that particular class and classes the total numberof actual learners enrolled in that particular class/classes. Sometimes GER is morethan 100% due to admission of below the age group and above the age group inthat class/classes. In HDI, aggregate GER of primary, secondary and tertiary edu-cation is calculated. Here we will restrict our discussion about GER of primaryeducation (from Ist to Vth class).
According to Economic Survey, 2005-06 the GER has increased progressivelyfrom 32.1% in 1950-51 to 84.91 in 2003-04 in the age groups of 6-14 (from Istto Vth class). Simultaneously drop-out rates at primary level declined from 39.0%in 2001-02 to 31.4% in 2003-04. As on October 2005, number of out of schoolchildren, as reported by states/UTs was reduced to 95 lakh from 320 lakh in2001. But still 95 lakh out of school children at primary level is a very high number.If we look at state-wise GER, it has been found that it varies from 116.77% inManipur to 55.82% in Bihar. The states which have GER below the national

MODULE - 9
Notes
Human resourcedevelopment in India
294
Human Development
GEOGRAPHY
average are Uttar Pradesh, Bihar, Andhra Pradesh, Assam, Haryana, Punjab,Jammu and Kashmir, Jharkhand and Nagaland.
To improve the educational attainment particularly enrollment and retention at el-ementary level and reduce the adult illiteracy Government of India has startedvarious new programmes and also strengthened existing programmes.
Economic Indicators
Human development has also placed a great significance to economic productivityand growth. This provides means to progress apart from education and health.Economic growth is generally found out with the Gross Domestic Product (GDP),Gross National Product (GNP), per capita income, etc. Here we won’t discuss indetails all these above mentioned economic indicators but we will discuss onlyabout per-capita income.
According to Economic Survey 2005-06, per-capita income has increased fromRs 3,687 in 1950-51 to Rs 19,649 in 2004-05. Though per-capita income hasincreased significantly but disparities are very wide both at region level and locallevels. Even at the rural and urban levels there exists very high disparity in percapita income. Such variation is also reflected through those persons who arebelow the poverty line.
Poverty is not only an economic phenomena but also social and psychologicaldeprivation. This is reflected through poor quality of life, malnutrition, low humandevelopment, etc. According to Planning Commission estimate in 1999-2000,there were 26.10% of population living below poverty line. This ratio is 27.09% inrural areas and 23.62% in urban areas. While rural poverty is linked with landlessand marginal farmers, urban poverty is expressed in terms of sprawling slums incities. The states with population below the poverty line from the national averageinclude Orissa, Bihar (including Jharkhand), Madhya Pradesh (includingChhatisgarh), Uttar Pradesh (including Uttarakhand), all the north-eastern statesexcept Mizoram and West Bengal.
INTEXT QUESTIONS 28.2
1. Name the three demographic indicators which need to be improved to achievethe desired result.
(i) ___________________________________________________
(ii) ___________________________________________________
(iii) ___________________________________________________
2. Name any three health programmes related to women and children launchedby Government of India.
(i) ___________________________________________________
MODULE - 9Human resourcedevelopment in India
Notes
295
Human Development
GEOGRAPHY
(ii) ___________________________________________________
(iii) ___________________________________________________
3. Define Gross Enrollment Ratio
_______________________________________________________.
4. Name any three states in which people are living below poverty line.
(i) ___________________________________________________
(ii) ___________________________________________________
(iii) ___________________________________________________
28.5 HUMAN DEVELOPMENT INDEX - A STATE LEVEL ANALYSIS
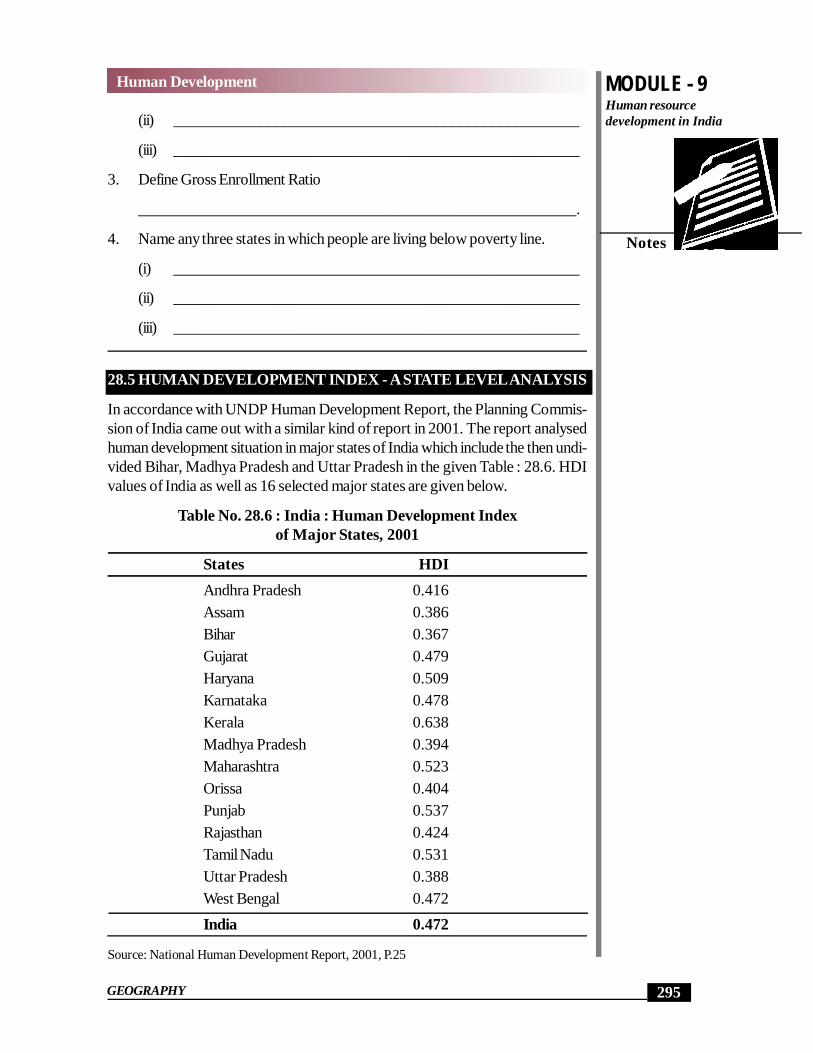
In accordance with UNDP Human Development Report, the Planning Commis-sion of India came out with a similar kind of report in 2001. The report analysedhuman development situation in major states of India which include the then undi-vided Bihar, Madhya Pradesh and Uttar Pradesh in the given Table : 28.6. HDIvalues of India as well as 16 selected major states are given below.
Table No. 28.6 : India : Human Development Indexof Major States, 2001
States HDIAndhra Pradesh 0.416Assam 0.386Bihar 0.367Gujarat 0.479Haryana 0.509Karnataka 0.478Kerala 0.638Madhya Pradesh 0.394Maharashtra 0.523Orissa 0.404Punjab 0.537Rajasthan 0.424Tamil Nadu 0.531Uttar Pradesh 0.388West Bengal 0.472India 0.472
Source: National Human Development Report, 2001, P.25
MODULE - 9
Notes
Human resourcedevelopment in India
296
Human Development
GEOGRAPHY
If we analyse the pattern given in the above Table 28.6, it is concluded that thereis a north south divide barring a few exceptions. All the southern Indian states aredoing well except Andhra Pradesh. On the other hand most of northern statesexcept Punjab and Haryana are doing badly in human development index. Thesenorthern states are given an accronym “BIMARU” (whcih stands for Bihar, MadhyaPradesh, Rajasthan and Uttar Pradesh). Apart from north-south divide, there ex-ists a east - west divide also. Western states like Gujarat and Maharashtra aredoing fairly well in comparision to eastern states – Orissa, and Assam. Both thesestates are below national average. West Bengal is exactly positioned at the na-tional average. Therefore there is a need to pay a greater attention to those stateswhich are not doing well in HDI. An efforts should be made in these states toimprove human development index.
In the following paragraphs we will make a detailed discussion at the states level inIndia based on the development radars suggested in the National Human Devel-opment Report - 2001 prepared by Planning Commission of India. DevelopmentRadars are diagrammatic representation of progress in HDI prepared, separatelyfor rural and urban areas on eight distinct social indicators for two points of time,i.e. early 1980 and early 1990. Development Radars were constructed for all thestates. The indicators have been included with a view to reflect attainments onthree critical dimensions of well being - longevity, education and command overresources. At the same time development radar (DR) highlights the progress inmeeting out the basic human needs of accessibility to safe drinking water andshelter. The social indicators selected for the construction of Development Radars(DR) are as follows;
(i) Per-capita consumption expenditure.
(ii) Incidence of poverty as captured by the head count ratio.
(iii) Access of safe drinking water.
(iv) Proportion of households with pucca houses.
(v) Literacy rate for the age group of 7 years and above.
(vi) Intensity of formal education (indicators based on weighted enrolment in suc-cessive classes adjusted for non enrolled children in the age group of 6–18years)
(vii) Life expectancy at the age of one year; and
(viii) Infant mortality rates.
The indicators scale through a magnitude from zero to five. Here, zero corre-sponding to least achievement while five given to maximum achievement.

MODULE - 9Human resourcedevelopment in India
Notes
297
Human Development
GEOGRAPHY
INTEXT QUESTIONS 28.3
1. Name any three states of northern India which are below national average inHDI.
________________________________________________________
2. What is Development Radar.
________________________________________________________
3. In which two indicators still substantial gaps are there as far as rural - urbandifferences are concerned.
________________________________________________________
WHAT YOU HAVE LEARNT
The concept of Human Development Index (HDI) was propounded by ProfMehbub Al Haque and Prof. Amartya Sen in 1990. From 1990 onwards HumanDevelopment Report is published by UNDP annually which reflects the status ofhuman development in almost all the countries across the world. HDI is a com-posite index that measures the average achievements in a country in three basicdimensions of human development. They are long and healthy life, knowledge anddecent standards of living. They basic difference between economic developmentand human development is that economic development entirely focusses on theincrease of income whereas the human development stresses in expanding andwidening of all aspects of human life. In HDI, economic condition is one of theessential elements. Apart from HDI, various types of indices are constructed andpublished by UNDP. Some of the important indices are Human Poverty Index,Gender Development Index, Gender Empowered Measurement index, etc.
According to Human Development Report - 2005, India’s rank is 127th almost atthe bottom of the table in the medium level category. The reasons which keepIndia at the bottom of human development are rapid increase in population, largenumber of adult illiterates, low Gross Enrollment Ratio, inadequate governmentexpenditure on education and health, large proportion of under - weight childrenas well as under nourished people, very poor sanitation facilities and low access toessential life saving medicines etc. Therefore, there is an urgent need to improve inhealth situation, educational attainment and increased standard of living and re-duction of poverty level. If we look at the situation since independence to till date,we find that there has been a significant improvement. However there has beenincreases in HIV/AIDS patients to check the menace of HIV/AIDS, the youngesters have been suggested to develop certain life skills. But there is a needfor further improvement. To improve the situation, the Government of India hasimplemented many programmes such as massive project like National Rural Health

MODULE - 9
Notes
Human resourcedevelopment in India
298
Human Development
GEOGRAPHY
Mission, Sarva Shikhsa Abhiyan, National Rural Employment Guarantee Schemeetc.
In accordance with UNDP Human Development Report, Planning Commissionof India came out with a similar kind of Report titled “National Human Develop-ment Report.” In this report HDI of fifteen major states were calculated. The stateof Kerala has highest HDI whereas the state of Bihar has the lowest HDI. Apartfrom that the Planning Commission has constructed Development Radar. TheDevelopment Radar is a diagramatic representation of progress of states as awhole and for rural and urban areas separately. The Development Radar has beencalculated based on eight distinct social indicators for two points of time.
TERMINAL QUESTIONS
1. Differentiate among Human Development Index, Human Poverty Index andGender Development Index.
2. Explain any four reasons in favour of the human development.
3. Describe any four visions envisaged in National Rural Health Mission (NRHM)implemented by Government of India.
4. Write any four factors responsible for keeping India almost at the bottom ofhuman development index table.
ANSWER TO INTEXT QUESTIONS
28.1
1. The Human Development Index is a composite index that measures the av-erage achievements of a country in three basic dimensions of human devel-opment such as long and healthy life, knowledge and decent standard ofliving.
2. (i) Long and healthy life measured by life expectancy at birth.
(ii) Knowledge is measured by the adult literacy rate and the combinedprimary, secondary and tertiary gross enrollment ratio.
(iii) A decent standard of living is measured by DGP per-capita purchasingpower parity in US Dollar.
3. Economic development entirely focusses on the increase of income. The hu-man development stresses in expanding and widening of all aspects of humanlife.
4. (i) Probability at birth of not swimming at the age of 40(ii) Adult literacy rate
MODULE - 9Human resourcedevelopment in India
Notes
299
Human Development
GEOGRAPHY
(iii) (a) Percentage of the population without sustainable access to animproved water source (b) the percentage of children underweightfor age of one year.
5. 127 out of 174 countries. Neighbouring countries who are doing betterthan India are China, Sri Lanka and Maldives (Any two)
28.2
1. (i) Birth Rate (ii) Infant Mortality Rate (iii) Total Fertility Rate
2. (i) National Rural Health Mission (ii) Janani Suraksha Yojna (iii) BalikaSamridhi Yojna (iv) Kishori Shakti Yojna (Any three)
3. Gross Enrollment Ratio indicates the proportion between the total numberof leaners in a particular age group that are supposed to be in that particularclass/classes and that total number of actual learners enrolled in that par-ticular class/classes
4. (i) Bihar (including Jharkhand), (ii) Orissa (iii) Madhya Pradesh (includingChhatisgarh) (iv) Uttar Pradesh (including Uttarkhand) (v) Assam (vi) WestBengal (vii) Meghalaya (viii) Manipur (ix) Nagaland (x) Tripura, (xi)Sikkim(xii) Arunachal Pradesh (Any three)
28.3
1. (i) Bihar (ii) Madhya Pradesh (iii) Uttar Pradesh (iv) Rajasthan (Any three)2. Development Radars are diagramatic representation of progress of states
separately for rural and urban areas on eight distinct social indicators fortwo points of time namely early 1980 and early 1990.
3. (i) per-capita expenditure (ii) poverty
HINTS TO TERMINAL QUESTIONS
1. Basically all the indices (i.e. HDI, HPI and GDI) are calculated on threecommon dimensions: a long and healthy life, knowledge and a decentstandard of living. However some indicators are different within thesedimensions. HDI is a composite index of life expectancy at the birth; adultliteracy rate; the combined primary, secondary and enrollment; and lastly,GDP per capita income. HPI is a composite index of probability at birth;adult literacy rate; percentage of population without sustainable access tosafe drinking water; and lastly, percentage of children underweight for ageof one year. HDI is a composite index of life expectancy at birth; adultliteracy rate; combined primary, secondary and tertiary gross enrollmentratio; and lastly, estimated earned income.
MODULE - 9
Notes
Human resourcedevelopment in India
300
Human Development
GEOGRAPHY
2. Refer to section 28.2
3. Refer to table 28.54. Refer to section 28.3
Healthy diet during adolescenceBoth girls and boys need a nutritious diet duringadolescence because this is a particularly importantphase when their bodies are undergoing tremendouschanges. It is important to take calcium and ironsupplements to help this growth spurt duringadolescence.Since girls are more prone to anaemia (iron deficiency)resulting from menstruation, they require more ironsupplementation in their diet. To prevent or cureanaemia, girls should cat iron-rich foods such as meat,liver, and leafy green vegetables, or they should geta prescription for iron tablets from the doctor.Anaemia causes even more problems during teenagepregnancy, which in turn can lead to furtheranaemia.
Point to Ponder