
2/7/091 Farmington Public Schools Superintendent’s Recommended Budget 2009-2010.
35
2/7/09 1 Farmington Public Schools Superintendent’s Recommended Budget 2009-2010
-
Upload
clinton-short -
Category
Documents
-
view
215 -
download
0
Transcript of 2/7/091 Farmington Public Schools Superintendent’s Recommended Budget 2009-2010.
2/7/09 1
Farmington Public Schools
Superintendent’s Recommended Budget
2009-2010

2/7/09 2
Farmington Public Schools

2/7/09 3
Farmington Public Schools Philosophy and Mission Statement
The Farmington Public Schools are committed to the belief that ALL children are capable of attaining high levels of educational achievement in preparation for productive, rewarding lives and responsible citizenship.
Students will reach this goal through their own diligence and effort, and through a school and school district learning climate that responds to individual student academic needs, a curriculum that challenges, adequate resources, and skilled, professional instruction. A belief in social equality underlies Farmington’s commitment to providing a high quality education for ALL students.
The mission of the Farmington Public Schools is to offer a common, standards-based educational program that will enable every student to achieve rigorous performance standards.

2/7/09 4
ACHIEVEMENTS
2/7/09 5
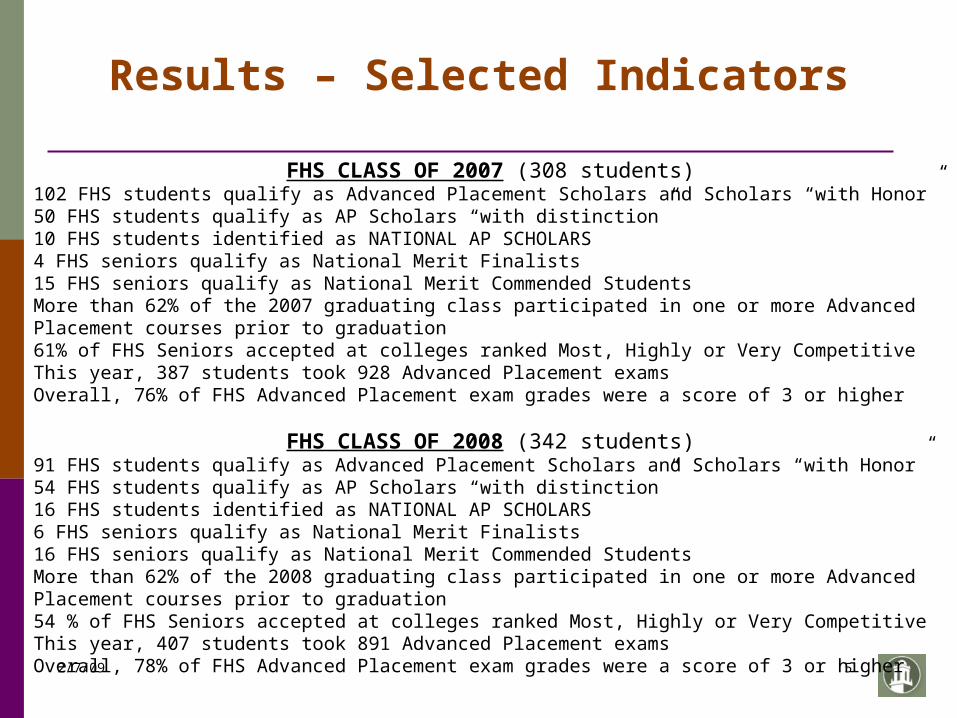
Results – Selected Indicators
FHS CLASS OF 2007 (308 students)102 FHS students qualify as Advanced Placement Scholars and Scholars “with Honor”50 FHS students qualify as AP Scholars “with distinction”10 FHS students identified as NATIONAL AP SCHOLARS4 FHS seniors qualify as National Merit Finalists15 FHS seniors qualify as National Merit Commended StudentsMore than 62% of the 2007 graduating class participated in one or more Advanced Placement courses prior to graduation61% of FHS Seniors accepted at colleges ranked Most, Highly or Very CompetitiveThis year, 387 students took 928 Advanced Placement examsOverall, 76% of FHS Advanced Placement exam grades were a score of 3 or higher
FHS CLASS OF 2008 (342 students)91 FHS students qualify as Advanced Placement Scholars and Scholars “with Honor”54 FHS students qualify as AP Scholars “with distinction”16 FHS students identified as NATIONAL AP SCHOLARS6 FHS seniors qualify as National Merit Finalists16 FHS seniors qualify as National Merit Commended StudentsMore than 62% of the 2008 graduating class participated in one or more Advanced Placement courses prior to graduation 54 % of FHS Seniors accepted at colleges ranked Most, Highly or Very CompetitiveThis year, 407 students took 891 Advanced Placement examsOverall, 78% of FHS Advanced Placement exam grades were a score of 3 or higher

2/7/09 6
College Acceptances
Year# of
Students
Acceptances at “Most Competitive”
Colleges (as % of class)
Acceptances at “Most and Highly
Competitive” Colleges
(as % of class)
2004 280 15% 34%
2005 326 14% 38%
2006 330 14% 35%
2007 308 17% 51%
2008 342 19% 44%
2/7/09 7
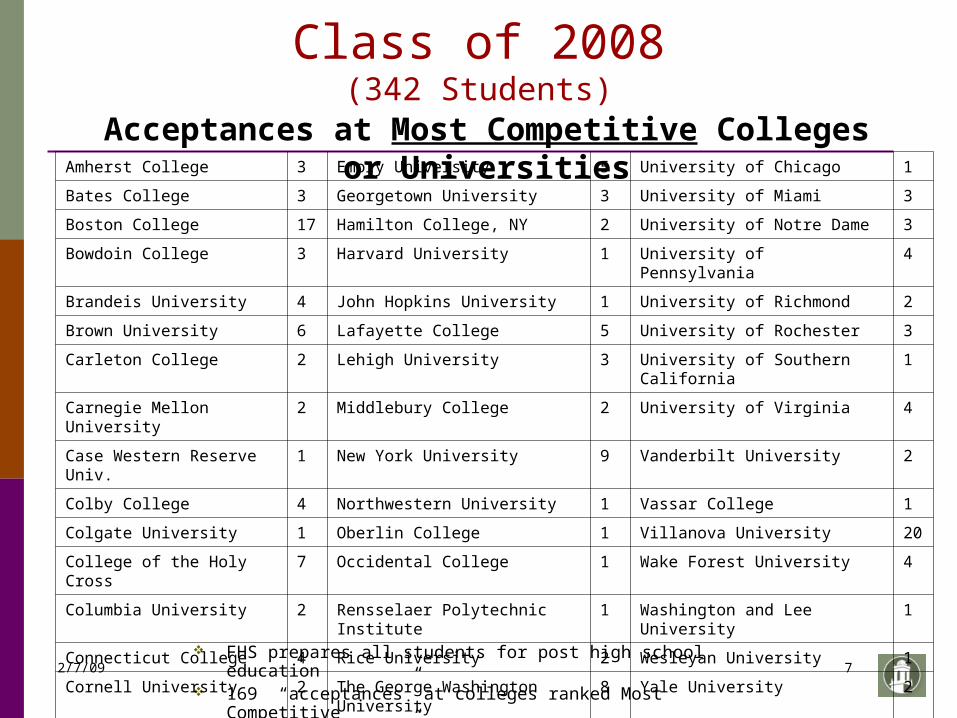
Class of 2008(342 Students)
FHS prepares all students for post high school education 169 “acceptances” at colleges ranked Most Competitive 290 “acceptances” at colleges ranked Highly Competitive
Amherst College 3 Emory University 5 University of Chicago 1
Bates College 3 Georgetown University 3 University of Miami 3
Boston College 17 Hamilton College, NY 2 University of Notre Dame 3
Bowdoin College 3 Harvard University 1 University of Pennsylvania 4
Brandeis University 4 John Hopkins University 1 University of Richmond 2
Brown University 6 Lafayette College 5 University of Rochester 3
Carleton College 2 Lehigh University 3 University of Southern California 1
Carnegie Mellon University 2 Middlebury College 2 University of Virginia 4
Case Western Reserve Univ. 1 New York University 9 Vanderbilt University 2
Colby College 4 Northwestern University 1 Vassar College 1
Colgate University 1 Oberlin College 1 Villanova University 20
College of the Holy Cross 7 Occidental College 1 Wake Forest University 4
Columbia University 2 Rensselaer Polytechnic Institute 1 Washington and Lee University 1
Connecticut College 4 Rice University 2 Wesleyan University 1
Cornell University 2 The George Washington University 8 Yale University 2
Dartmouth College 1 Tufts University 4
Duke University 2 Tulane University 1
Acceptances at Most Competitive Colleges or Universities
2/7/09 8
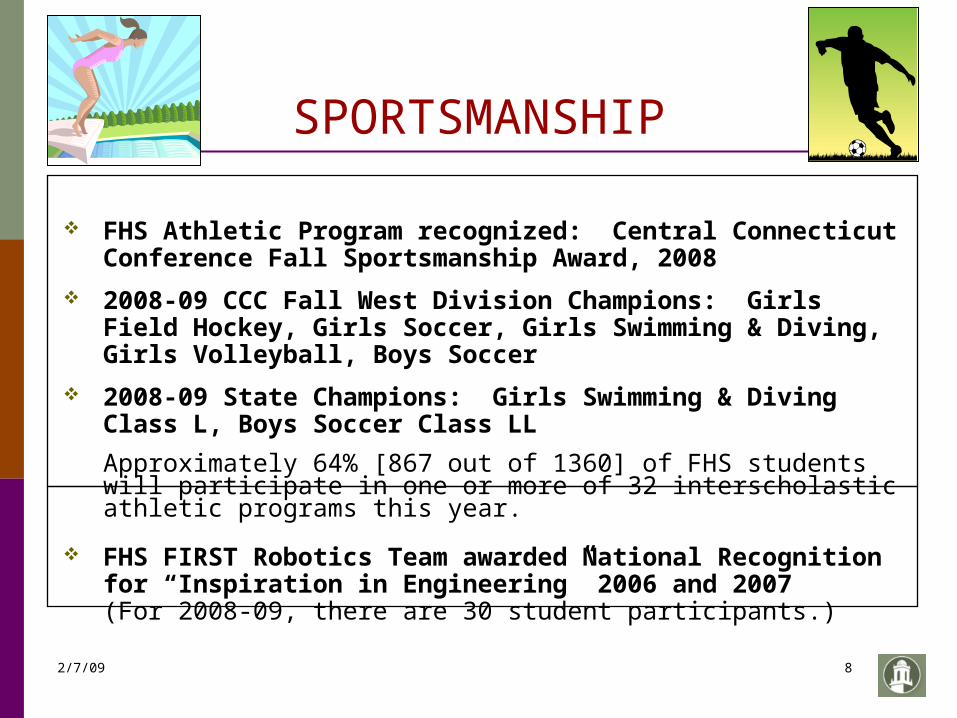
SPORTSMANSHIP
FHS Athletic Program recognized: Central Connecticut Conference Fall Sportsmanship Award, 2008
2008-09 CCC Fall West Division Champions: Girls Field Hockey, Girls Soccer, Girls Swimming & Diving, Girls Volleyball, Boys Soccer
2008-09 State Champions: Girls Swimming & Diving Class L, Boys Soccer Class LL
Approximately 64% [867 out of 1360] of FHS students will participate in one or more of 32 interscholastic athletic programs this year.
FHS FIRST Robotics Team awarded National Recognition for “Inspiration in Engineering” 2006 and 2007(For 2008-09, there are 30 student participants.)
2/7/09 9
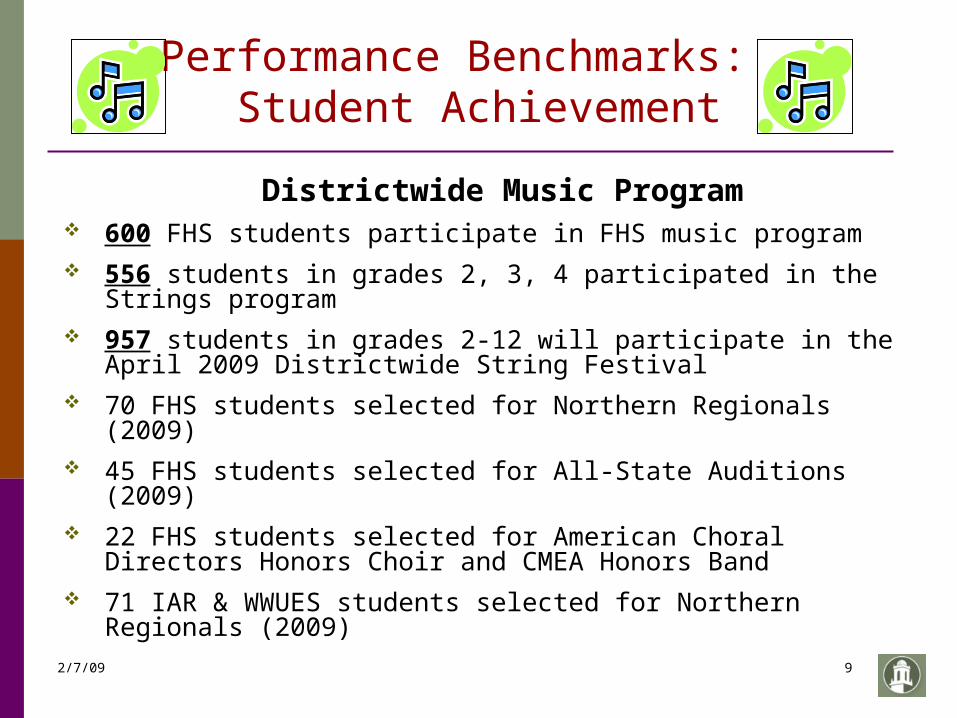
Performance Benchmarks: Student Achievement
Districtwide Music Program 600 FHS students participate in FHS music program 556 students in grades 2, 3, 4 participated in the Strings program 957 students in grades 2-12 will participate in the April 2009 Districtwide
String Festival 70 FHS students selected for Northern Regionals (2009) 45 FHS students selected for All-State Auditions (2009) 22 FHS students selected for American Choral Directors Honors Choir
and CMEA Honors Band 71 IAR & WWUES students selected for Northern Regionals (2009)

2/7/09 10
Additional Results
Connecticut Mastery Test Results 2008 (DRG B):More than 80% of students met or exceeded goal in reading, writing, and mathematics in grades 5, 7, and 8.
Rankings in DRG B: Ranked 1st in Grade 5 Reading Ranked 2nd Grade 5 ScienceRanked 4th in Grade 5 Writing & Math Ranked 4th in Grade 4 Writing Ranked 4th in Grade 3 Reading & Writing
Connecticut Academic Performance Test (Grade 10) 2008:356 students took CAPT with more than 57% meeting standard in all four subject areas, a general trend upward since 2001 (39% meeting goal in all four subjects).In both mathematics and science, over 40% of the students were at the advanced level of performance.
SAT I:Farmington students’ average scores in the critical reading portion are 47 points higher than the national average and 40 points higher than the Connecticut average. In mathematics, FHS students average 46 points higher than the national average and 48 points higher than the Connecticut average. In the new writing section of the SAT, FHS students average 66 points higher than the national average and 47 points higher than the Connecticut average.
2/7/09 11
FARMINGTON PUBLIC SCHOOLSNEWSWEEK MAGAZINE RANKING2009-2010 SUPERINTENDENT’S
BUDGET
Newsweek Magazine recognized Farmington High School as one of the Top 200 High Schools in America and as the Top Ranked High School in Connecticut.
2/7/09 12
FARMINGTON PUBLIC SCHOOLSCONNECTICUT MAGAZINE TOP PUBLIC HIGH
SCHOOLS2009-2010 SUPERINTENDENT’S BUDGET
The November 2008 Connecticut Magazine rated Farmington High School as one of the Top Ten High Schools in Connecticut.

2/7/09 13
FARMINGTON PUBLIC SCHOOLSU.S. NEWS & WORLD REPORT
RANKING2009-2010 SUPERINTENDENT’S
BUDGET
Farmington High School was ranked as one of the Top High Schools in the Nation in U.S. News and World Report’s 2009 Rankings of Best High Schools in America.
12/5/2008
2/7/09 14
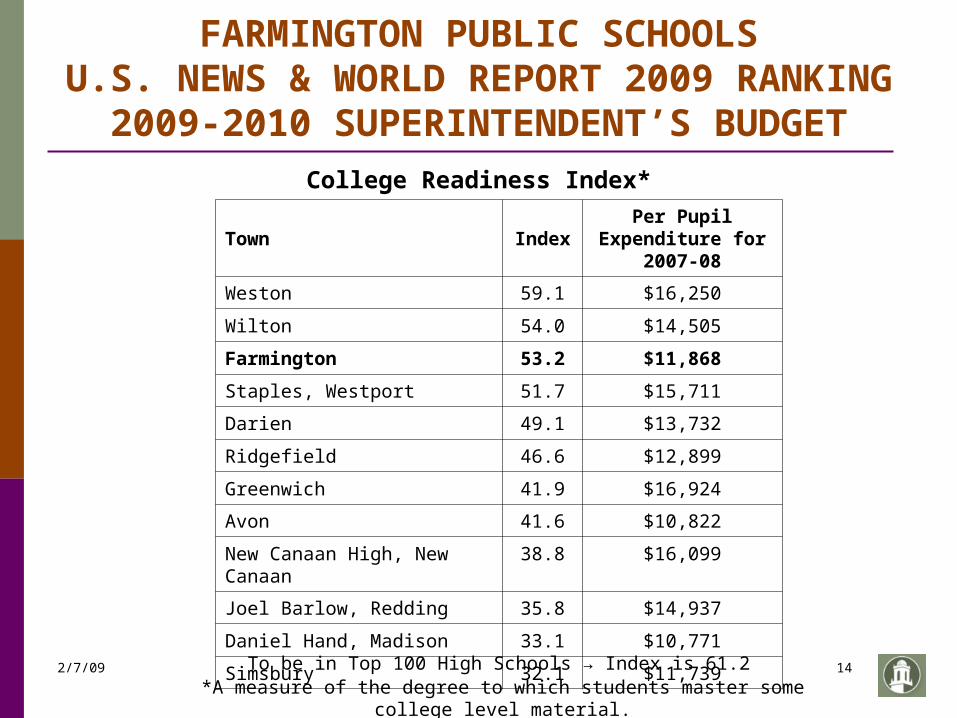
FARMINGTON PUBLIC SCHOOLSU.S. NEWS & WORLD REPORT 2009
RANKING2009-2010 SUPERINTENDENT’S
BUDGETCollege Readiness Index*
Town IndexPer Pupil Expenditure
for 2007-08
Weston 59.1 $16,250
Wilton 54.0 $14,505
Farmington 53.2 $11,868
Staples, Westport 51.7 $15,711
Darien 49.1 $13,732
Ridgefield 46.6 $12,899
Greenwich 41.9 $16,924
Avon 41.6 $10,822
New Canaan High, New Canaan 38.8 $16,099
Joel Barlow, Redding 35.8 $14,937
Daniel Hand, Madison 33.1 $10,771
Simsbury 32.1 $11,739
To be in Top 100 High Schools → Index is 61.2*A measure of the degree to which students master some college level material.
2/7/09 15
Farmington Public Schools
2009-2010 SUPERINTENDENT’S BUDGET
2/7/09 16
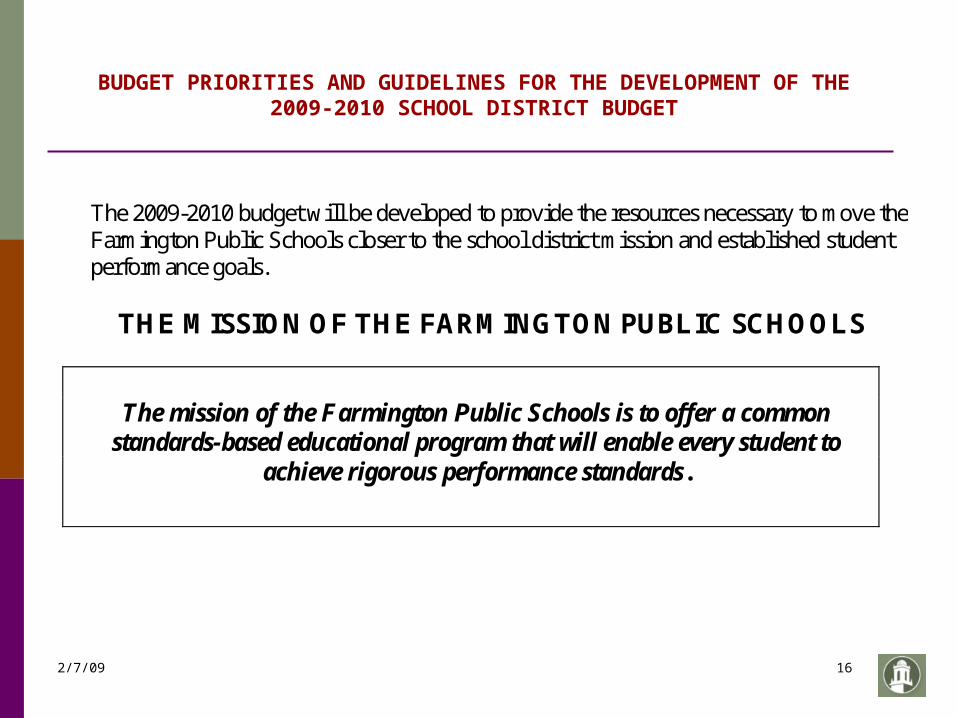
BUDGET PRIORITIES AND GUIDELINES FOR THE DEVELOPMENT OF THE 2009-2010 SCHOOL DISTRICT BUDGET
The 2009-2010 budget will be developed to provide the resources necessary to move the Farmington Public Schools closer to the school district mission and established student performance goals.
THE MISSION OF THE FARMINGTON PUBLIC SCHOOLS
The mission of the Farmington Public Schools is to offer a common standards-based educational program that will enable every student to
achieve rigorous performance standards.

2/7/09 17
BUDGET PRIORITIES AND GUIDELINES FOR THE DEVELOPMENT OF THE 2009-2010 SCHOOL DISTRICT BUDGET
SCHOOL DISTRICT FIVE-YEAR GOALS – 2003-2009
1. All Farmington students will meet established literacy performance standards by demonstrating high levels of communication skills in reading, writing, speaking, and listening; and all students will learn to be proficient in the use of technology to improve learning.
2. All Farmington students will meet established mathematics performance standards by strengthening their understanding of basic mathematical concepts, relationships and operations, and demonstrating the ability to apply them to practical problem solving.
3. All Farmington students will meet established science performance standards by demonstrating knowledge and understanding of natural laws and theories of the physical/life sciences by applying the scientific method to the investigation of natural phenomena.
4. All Farmington students will meet established social studies performance standards by demonstrating their understanding of human affairs by acquiring knowledge of U.S. history and government, world history, geography and the principles of economics. In addition, students will demonstrate their appreciation for cultural achievement via exemplary literature and by developing their performance skills and related understandings in the disciplines of music and visual arts.
5. All Farmington students will meet established standards by cultivating the habits of good citizenship, health and personal responsibility and by demonstrating the cooperative life skills necessary to be productive and responsible citizens in our diverse and complex world.

2/7/09 18
FARMINGTON PUBLIC SCHOOLSSTORY OF THE 2009-2010
BUDGET 2009-2010 Budget was prepared in the context of
the worst economic situation since the depression.
A great effort was made by all staff to aggressively contain costs.
The Board’s Self-Insurance Fund last year is the major factor driving the 2009-2010 budget.
Special education costs (occupational therapy, tuition and nursing services) exert pressure on the proposed budget.

2/7/09 19
FARMINGTON PUBLIC SCHOOLSEFFORTS BY ADMINISTRATION TO
REDUCE2009-2010 SUPERINTENDENT’S
BUDGET Negotiated a Zero % Increase to the Transportation
Contract Negotiated a Reduction to the Environmental Contract Negotiated a Reduction to the Ikon Copier Contract Proposed a Zero % Increase for Central Office
Leadership Curtailed Certain Maintenance Contracts for 2009-
2010 Eliminated Summer Assistance for Custodians Eliminated Summer Assistance for Audio-Visual
Department Planned Minimal Maintenance Projects for 2009-2010 Reduced Equipment Needs Totaling $295,148

2/7/09 20
FARMINGTON PUBLIC SCHOOLSSUMMARY OF REDUCTIONS TO2009-2010 SUPERINTENDENT’S
BUDGETContract Reductions TOTAL
- Transportation $62,982
- Copier Lease 26,988
- Raises 8,938
- Maintenance Contracts 15,291 114,199
Equipment 295,148
Special Education Tuition 589,500
Maintenance
- Projects 177,809
- Repair Accounts 17,450 195,259
Personnel/Professional Services 243,640
Instructional Supplies/Texts 64,665
Repair Instructional Equipment 13,100
Other (Insurance, Workers’ Comp) 18,000
$1,533,511
2/7/09 21
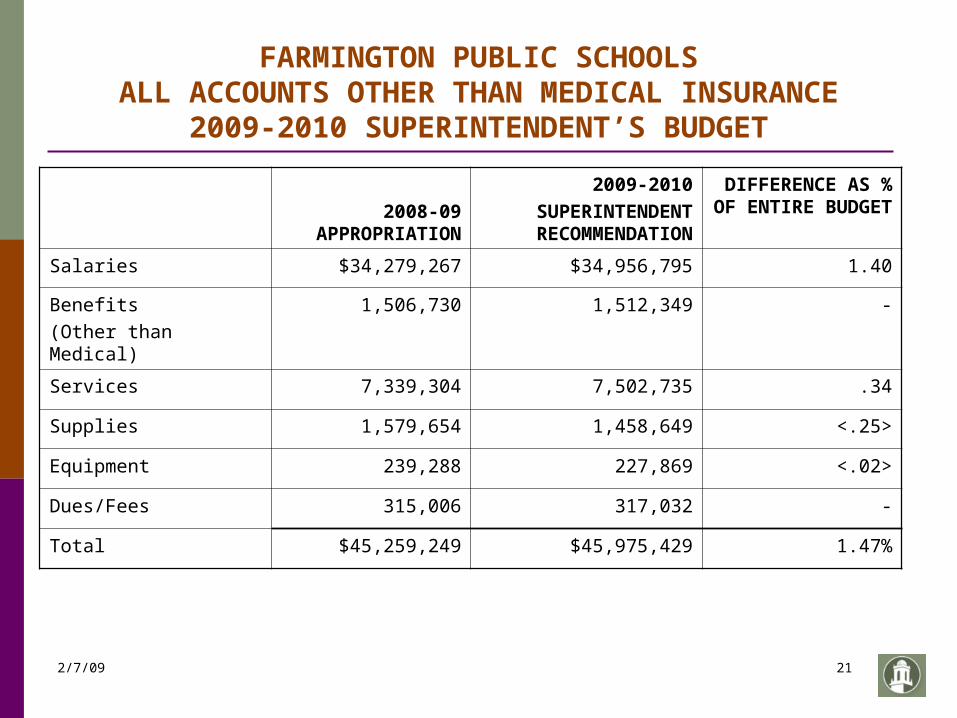
FARMINGTON PUBLIC SCHOOLSALL ACCOUNTS OTHER THAN MEDICAL
INSURANCE2009-2010 SUPERINTENDENT’S BUDGET
2008-09 APPROPRIATION
2009-2010SUPERINTENDENT
RECOMMENDATION
DIFFERENCE AS % OF ENTIRE
BUDGET
Salaries $34,279,267 $34,956,795 1.40
Benefits (Other than Medical)
1,506,730 1,512,349 -
Services 7,339,304 7,502,735 .34
Supplies 1,579,654 1,458,649 <.25>
Equipment 239,288 227,869 <.02>
Dues/Fees 315,006 317,032 -
Total $45,259,249 $45,975,429 1.47%

2/7/09 22
FARMINGTON PUBLIC SCHOOLSBUDGET CHALLENGE
2009-2010 SUPERINTENDENT’S BUDGET
The depletion of the Board’s Self-Insurance Fund has had a dramatic effect on the 2009-2010 budget.

2/7/09 23
FARMINGTON PUBLIC SCHOOLSUSE OF SELF-INSURANCE RESERVE
2009-2010 SUPERINTENDENT’S BUDGET
2008-2009Expected Claims & Administration(Net of Contributions) $4,660,357
Use of Self-Insurance Reserve BOE - $450,000 TC - $900,000 1,350,000
2008-2009 Appropriation $3,310,357

2/7/09 24
FARMINGTON PUBLIC SCHOOLSUSE OF SELF-INSURANCE RESERVE
2009-2010 SUPERINTENDENT’S BUDGET
2009-2010Expected Claims & Administration(Net of Contributions) $5,465,413
Use of Self-Insurance Reserve 0
2009-2010 Request $5,465,413
2008-2009 Appropriation 3,310,357
Dollar IncreasePercentage Increase
$2,155,05665.1%
Increase as a % of Entire Budget 4.44%

2/7/09 25
FARMINGTON PUBLIC SCHOOLSCOMPOUNDING A DIFFICULT SITUATION2009-2010 SUPERINTENDENT’S BUDGET
If the economic situation wasn’t bad enough …
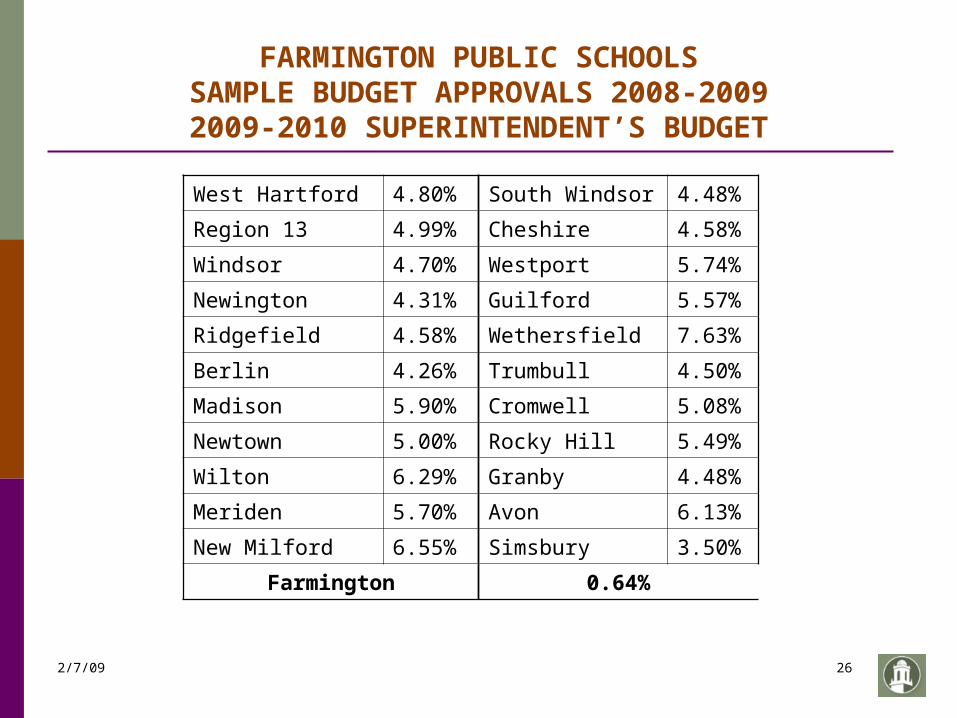
Farmington enters the 2009-2010 budget following the lowest increase in its history
ANDthe 2nd lowest percentage increase in the state.
2/7/09 26
FARMINGTON PUBLIC SCHOOLSSAMPLE BUDGET APPROVALS 2008-20092009-2010 SUPERINTENDENT’S BUDGET
West Hartford 4.80% South Windsor 4.48%
Region 13 4.99% Cheshire 4.58%
Windsor 4.70% Westport 5.74%
Newington 4.31% Guilford 5.57%
Ridgefield 4.58% Wethersfield 7.63%
Berlin 4.26% Trumbull 4.50%
Madison 5.90% Cromwell 5.08%
Newtown 5.00% Rocky Hill 5.49%
Wilton 6.29% Granby 4.48%
Meriden 5.70% Avon 6.13%
New Milford 6.55% Simsbury 3.50%
Farmington 0.64%

2/7/09 27
Benchmarking: Per Pupil Expenditures (2007-2008)
Farmington’s Per Pupil Expenditure Ranking: 96
Average State Per Pupil Expenditure: $12,515
Farmington’s Per Pupil Expenditure: $11,868
New Money Necessary to reach State Average Per Pupil:$2,642,348
2/7/09 28
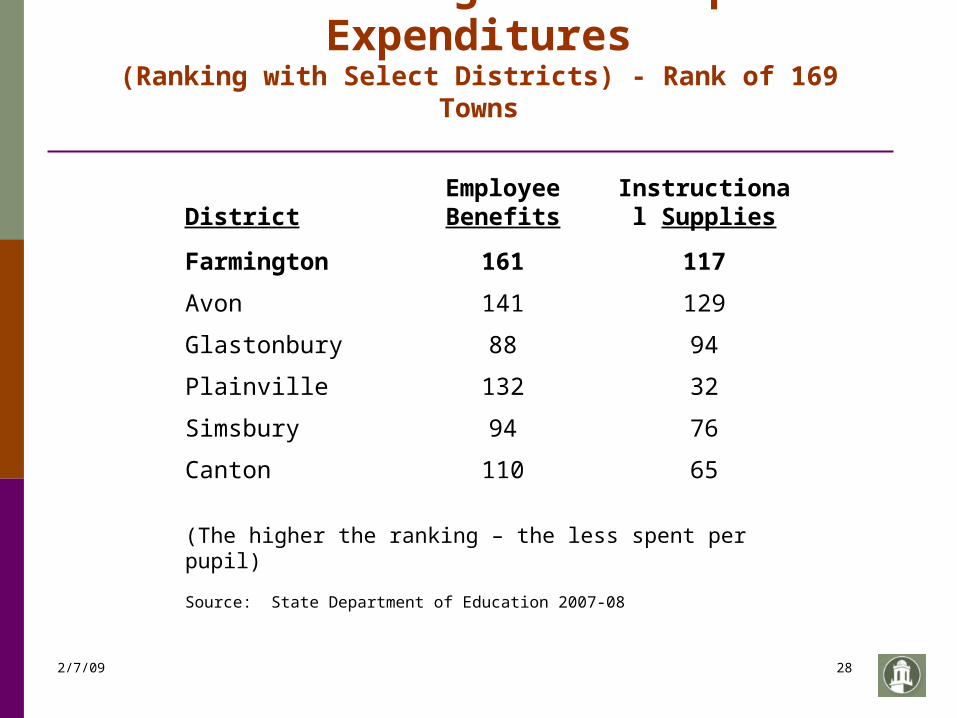
Benchmarking: Per Pupil Expenditures
(Ranking with Select Districts) - Rank of 169 Towns
DistrictEmployee Benefits
Instructional Supplies
Farmington 161 117
Avon 141 129
Glastonbury 88 94
Plainville 132 32
Simsbury 94 76
Canton 110 65
(The higher the ranking – the less spent per pupil)
Source: State Department of Education 2007-08
2/7/09 29
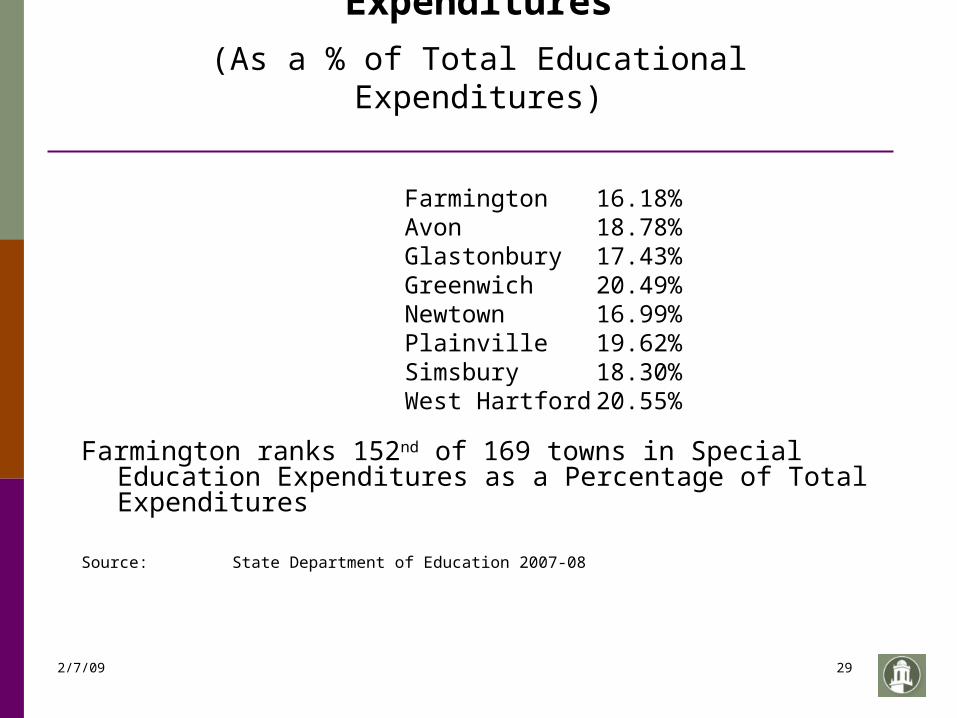
Benchmarking: Special Education Expenditures
(As a % of Total Educational Expenditures)
Farmington 16.18%Avon 18.78%Glastonbury 17.43%Greenwich 20.49%Newtown 16.99%Plainville 19.62%Simsbury 18.30%West Hartford 20.55%
Farmington ranks 152nd of 169 towns in Special Education Expenditures as a Percentage of Total Expenditures
Source: State Department of Education 2007-08
2/7/09 30
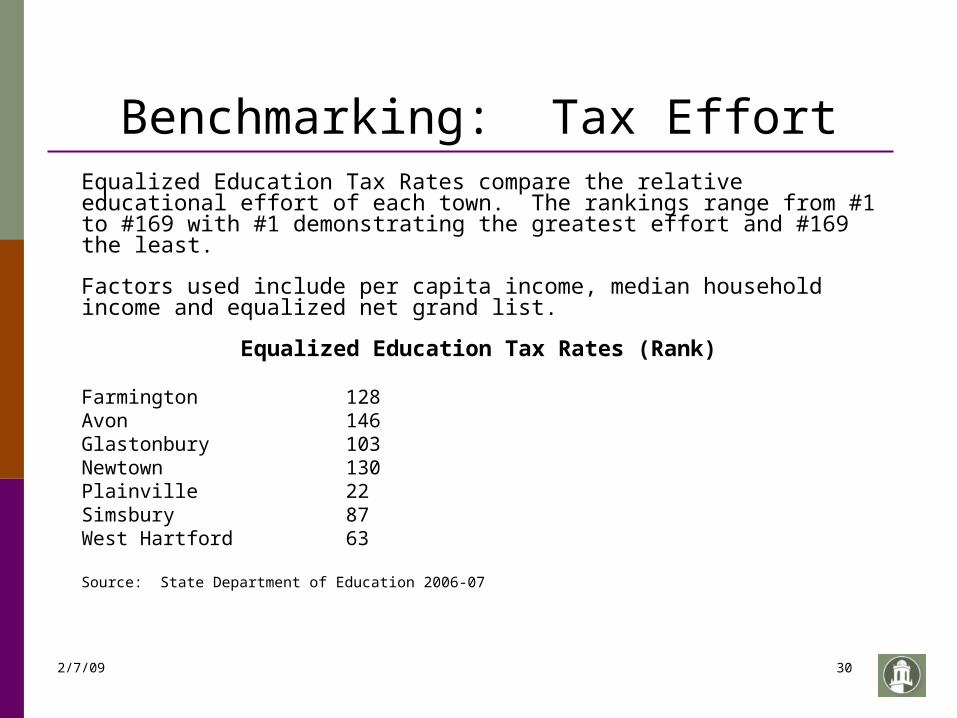
Benchmarking: Tax EffortEqualized Education Tax Rates compare the relative educational effort of each town. The rankings range from #1 to #169 with #1 demonstrating the greatest effort and #169 the least.
Factors used include per capita income, median household income and equalized net grand list.
Equalized Education Tax Rates (Rank)
Farmington 128Avon 146Glastonbury 103Newtown 130Plainville 22Simsbury 87West Hartford 63
Source: State Department of Education 2006-07
2/7/09 31
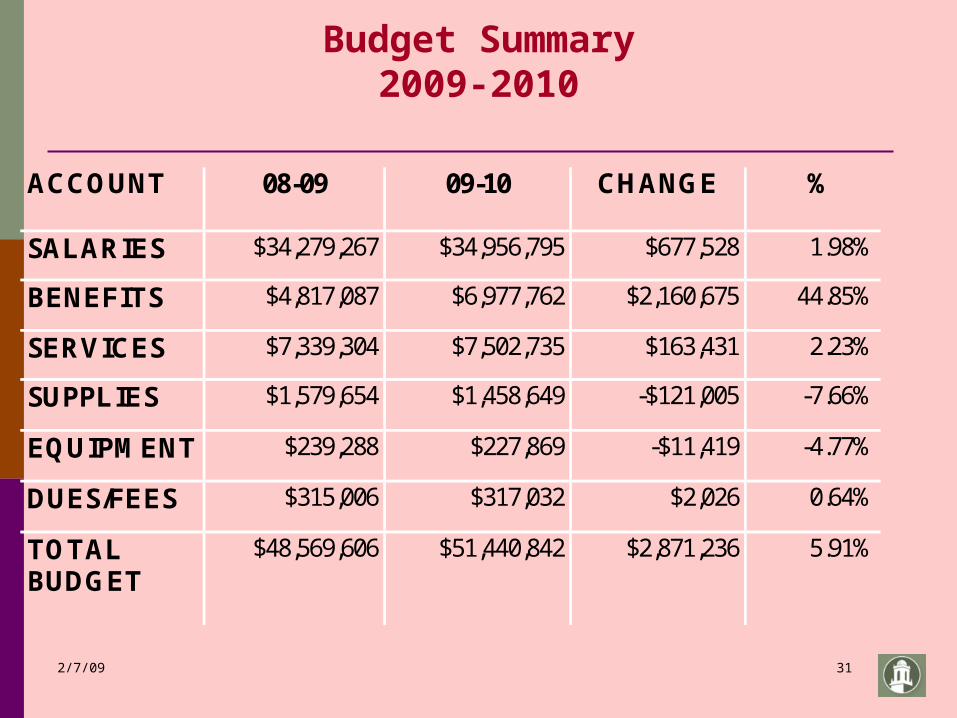
Budget Summary2009-2010
ACCOUNT 08-09 09-10 CHANGE %
SALARIES $34,279,267 $34,956,795 $677,528 1.98%
BENEFITS $4,817,087 $6,977,762 $2,160,675 44.85%
SERVICES $7,339,304 $7,502,735 $163,431 2.23%
SUPPLIES $1,579,654 $1,458,649 -$121,005 -7.66%
EQUIPMENT $239,288 $227,869 -$11,419 -4.77%
DUES/FEES $315,006 $317,032 $2,026 0.64%
TOTAL BUDGET
$48,569,606 $51,440,842 $2,871,236 5.91%

2/7/09 32
Budget Summary2008-2009
ACCOUNT 07-08 08-09 CHANGE %
SALARIES $32,661,118 $34,279,723 $1,618,605 4.96%
BENEFITS $5,694,717 $4,817,087 -$877,630 -15.41%
SERVICES $7,135,695 $6,933,263 -$202,432 -2.84%
SUPPLIES $1,922,753 $1,985,239 $62,486 3.25%
EQUIPMENT $505,305 $239,288 -$266,017 -52.64%
DUES/FEES $341,844 $315,006 -$26,838 -7.85%
TOTAL BUDGET
$48,261,432 $48,569,606 $308,174 0.64%

2/7/09 33
Budget Summary2007-2008
ACCOUNT 06-07 07-08 CHANGE %
SALARIES $31,287,659 $32,629,618 $1,341,959 4.29%
BENEFITS $6,176,780 $5,694,717 -$482,063 -7.80%
SERVICES $6,622,840 $7,167,195 $544,355 8.22%
SUPPLIES $1,994,318 $1,922,753 -$71,566 -3.59%
EQUIPMENT $160,462 $505,305 $344,843 214.91%
DUES/FEES $342,486 $341,844 -$642 -0.19%
TOTAL BUDGET
$46,584,545 $48,261,432 $1,676,887 3.60%

2/7/09 34
Farmington Public Schools
2/7/09 35
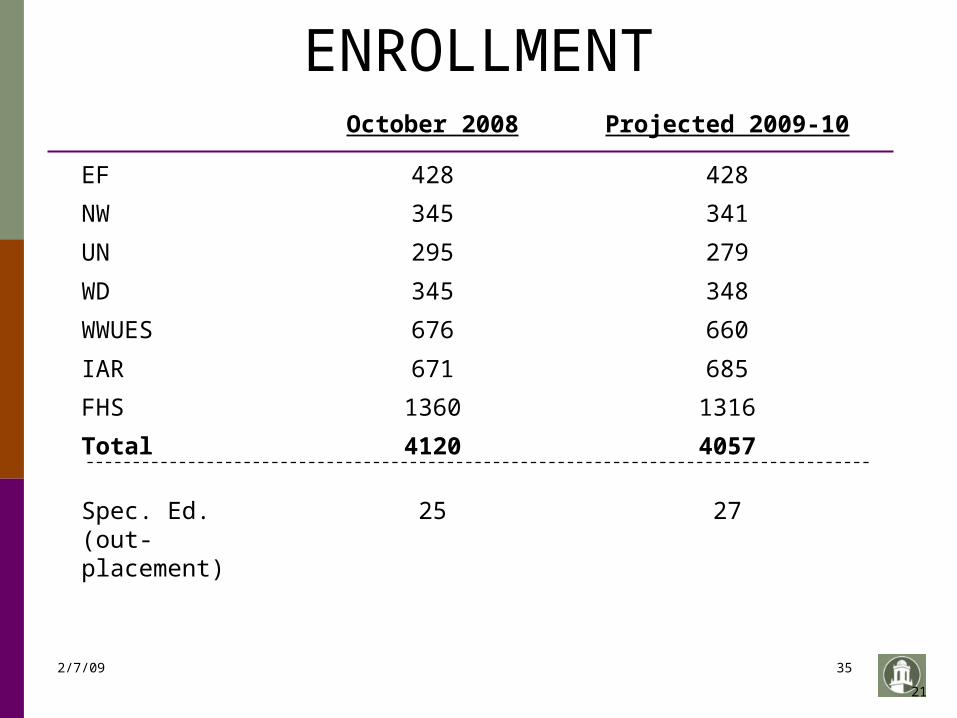
ENROLLMENTOctober 2008 Projected 2009-10
EF 428 428
NW 345 341
UN 295 279
WD 345 348
WWUES 676 660
IAR 671 685
FHS 1360 1316
Total 4120 4057
Spec. Ed.(out-placement)
25 27
21


![Superintendent’s [Re] Briefing](https://static.fdocuments.net/doc/165x107/56814e3c550346895dbba5e7/superintendents-re-briefing.jpg)
