24x7 power for all UTTAR PRADESH - Ministry of...
122
Transcript of 24x7 power for all UTTAR PRADESH - Ministry of...

Government of Uttar Pradesh
Shri Yogi Adityanath
Hon’ble Chief Minister of Uttar Pradesh
Foreword

Government of India
Shri Piyush Goyal
Hon’ble Union Minister of State (Independent Charge) Power, Coal, New & Renewable Energy
Foreword

Government of Uttar Pradesh
Shri Shrikant Sharma
Hon’ble Energy Minister of Uttar Pradesh
Foreword

Government of Uttar Pradesh
Shri Swatantra Dev Singh
Hon'ble State Minister (Energy) of Uttar Pradesh
Foreword

Government of India
Government of Uttar Pradesh
Joint statement
‘24x7 Power for All’ (PFA) programme will be implemented by Government of Uttar Pradesh with active support
of Government of India with the objective to connect all unconnected households in a phased manner by 2019
and to ensure 24x7 quality, reliable and affordable power supply to all domestic, commercial and industrial
consumers within a fixed timeframe. Agriculture consumers will also be given supply as per requirement in a
cost-effective manner.
Government of Uttar Pradesh is committed to accord the highest priority to the power sector and to provide
full support to associated utilities for ensuring quality power supply.
Government of Uttar Pradesh, in synergy with Government of India, will take necessary steps for village
electrification, capacity addition, power purchase planning, strengthening the required transmission and
distribution network, encouraging renewable energy, undertaking customer-centric initiatives, reducing AT&C
losses, bridging the gap between ACS and ARR, and following good governance practices in the implementation
of electricity-related Central and State Government schemes.
Government of India would synergise and supplement the efforts of the Government of Uttar Pradesh through
fast-track resolution of key issues pertaining to generation & transmission and by ensuring enhanced allocation
in various distribution schemes.
The Ministry of Power, Government of India, will also endeavour to support the State in availing of concessional
financing arrangements for power utilities in the State.
The Central and State Governments would meet regularly to review the progress of the programme over the
next two years and would strive to achieve the objectives by taking necessary steps as envisaged in this Power
for All document.
Shalini Prasad
Additional Secretary,
Ministry of Power, Government of India
Sanjay Agarwal
Additional Chief Secretary (Energy),
Government of Uttar Pradesh

CRISIL Infrastructure Advisory
24x7 Power for All (Uttar Pradesh) i
Executive summaryThe 24x7 Power for All programme is a joint initiative
of the Government of India (GoI) and state
governments, with the objective to provide 24x7
power to households, industry, commercial, and other
consuming entities, and adequate power to the
agricultural sector by 2019. This roadmap document
aims to identify the requirements to meet the above
objectives for Uttar Pradesh.
Uttar Pradesh is one of the largest states in the country.
From 450 kWh in FY12 to 524 kWh in FY16, its per
capita consumption of electricity has been steadily
growing. However, the consumption remains well
below the national average of about 1,075 kWh (FY16).
Connecting the unconnected: rural
Considering the projections as per census, there are
2.89 crore rural households in Uttar Pradesh. Of these,
0.92 crore rural households already exist in Discom
records.
The State undertook a survey in FY15 to map
habitations that have drinking water supply. This
survey also captured the status of electrification and
accordingly, was considered during finalisation of
DDUGJY scheme. As per the survey, additional 0.25
crore households were being served through existing
network. Also, under various ongoing rural
electrification schemes, about 1.09 crore un-electrified
households (or approximately 1,62,000 habitations)
were targeted to be served through additional network
being created.
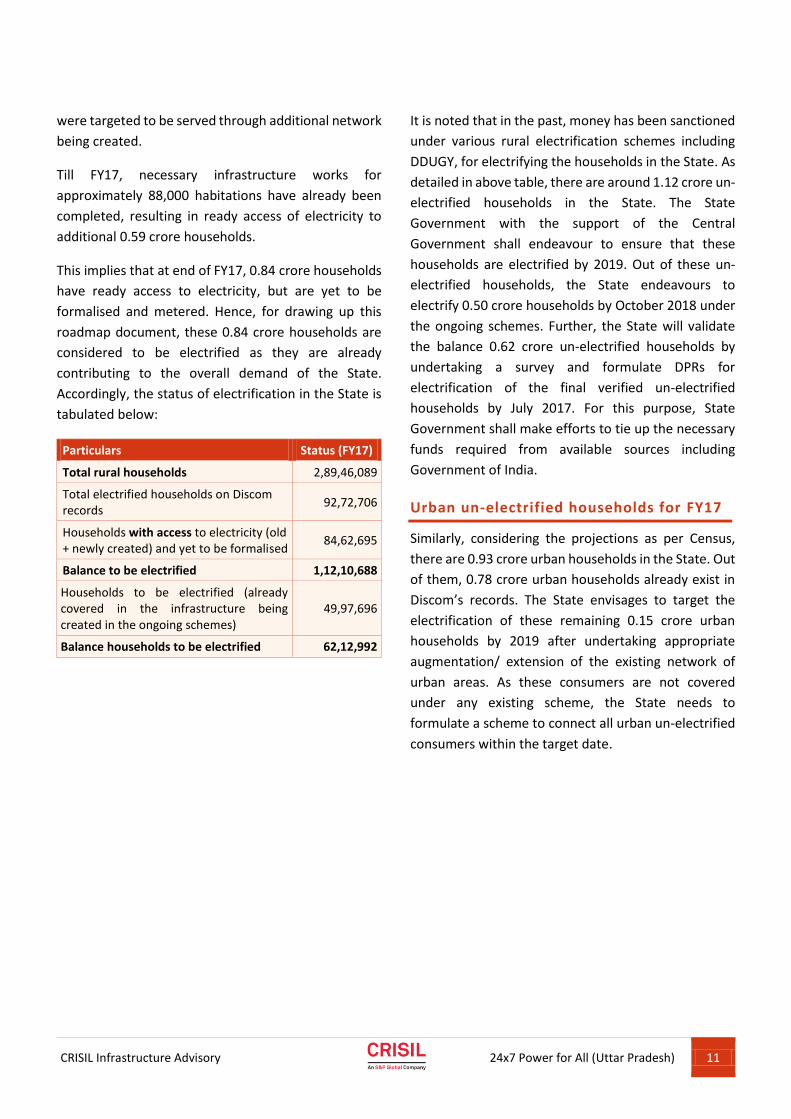
Till FY17, necessary infrastructure works for
approximately 88,000 habitations have already been
completed, resulting in ready access of electricity to
additional 0.59 crore households.
This implies that at end of FY17, 0.84 crore households
have ready access to electricity but are yet to be
formalised and metered. Hence, for drawing up this
roadmap document, these 0.84 crore households are
considered to be electrified as they are already
contributing to the overall demand of the State.
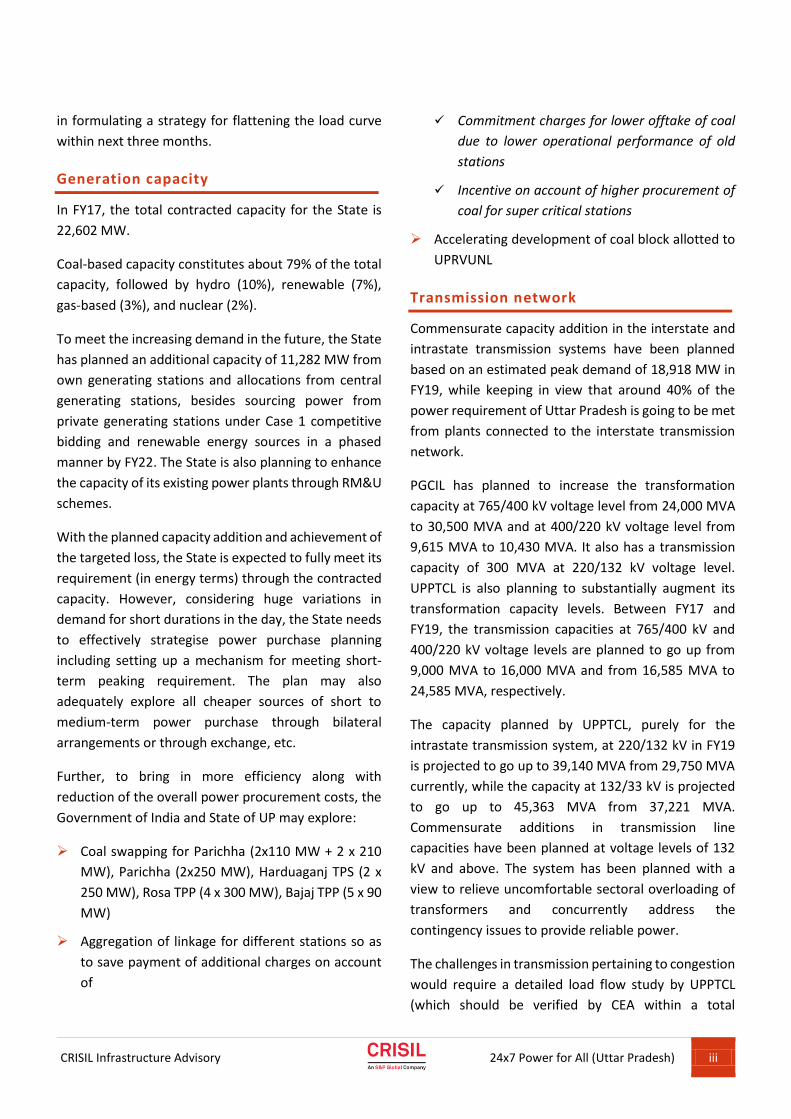
Accordingly the status of electrification in the State is
tabulated below:
Particulars Status (FY17)
Total rural households 2,89,46,089
Total electrified households as per discom records
92,72,706
Households with access to electricity and yet to be formalised
84,62,695
Balance to be electrified 1,12,10,688
Households to be electrified (already covered in the infrastructure being created in the ongoing schemes)
49,97,696
Balance households to be electrified 62,12,992
It is noted that in the past, money has been sanctioned
under various rural electrification schemes including
DDUGY for electrifying the households in the State. As
detailed in above table, there are around 1.12 crore un-
electrified households in the State. The State
Government with the support of the Central
Government shall endeavour to ensure that these
households shall be electrified by 2019. Out of these
un-electrified households, the State endeavours to
electrify 0.50 crore households by October 2018 under
the ongoing schemes. Further, the State will validate
the balance 0.62 crore un-electrified households by
undertaking a survey and formulate DPRs for
electrification of the final verified un-electrified
households by July 2017. For this purpose, State
Government shall make efforts to tie up the necessary
funds required from available sources including
Government of India.
Connecting the unconnected: urban
Similarly, considering the projections as per census,
there are 0.93 crore urban households in the State. Out
of them, 0.78 crore urban households already exist in
Discom’s records. The State envisages to target the
electrification of these remaining 0.15 crore urban
households by 2019 after undertaking appropriate
augmentation/ extension of the existing network of
CRISIL Infrastructure Advisory
24x7 Power for All (Uttar Pradesh) ii
urban areas. As these consumers are not covered
under any existing scheme, the State needs to
formulate a scheme to connect all urban un-electrified
consumers within the target date.
24x7 power supply
Currently, the State is supplying power for 18 hours to
rural areas, 20 hours in tehsil towns and Bundelkhand
and 24 hours in district headquarters, cities and
industries.
The State plans to supply for 24 hours across all areas
and for 10 hours to agricultural consumers (whose
feeder segregation is underway) by October 2018.
Feeder segregation
Of the 75 districts in the State, schemes for feeder
separation for 73 districts, with a total cost of Rs
7,084.49 crore, was submitted for sanction under
DDUGJY. Sanction was granted for 28 districts for
complete works and 11 districts for partial works for an
amount of Rs 3,257.69 crore; the works are underway
and are targeted to be completed by early 2019. It is
also observed that early implementation of feeder
segregation will help in reducing and effectively
managing the peak demand, which stands at 17,355
MW in FY17.
Metering
In FY17, almost 40% (i.e., 0.68 crore) of the total 1.70
crore registered domestic households are still
unmetered. Further, another 0.84 crore connections
are required to be formalised and metered. The work
for converting these connections to metered
connections by October 2018 is underway and needs to
be carried out on war footing, being imperative for
turnaround of Discoms.
Demand growth
To achieve the objective of 24x7 power supply, the
State would need to meet the increase in demand. The
broad approach for projection of demand is highlighted
below:
1. The daily household consumption has been
computed separately for rural and urban
households for FY17 and escalated in line with the
historical trend after considering an additional
factor for increasing the number of supply hours in
the rural areas.
2. The new consumer addition in rural as well as
urban areas, due to the electrification of
households is then multiplied by average
household consumption in the respective areas.
3. The annual sales in the domestic category have
been arrived at on the consideration that
households in both rural and urban categories
would be consuming electricity at their respective
projected daily household consumption rates.
4. Sales in categories other than households have
been considered to increase at the respective
CAGRs over the past five years.
5. The supply hours in rural areas will be increased to
24 hours by 2019.
6. All agricultural connections, which have been
identified under the DDUGJY scheme for feeder
separation, will be segregated by early 2019.
Average 10 hours of supply has been considered
for these agricultural consumers and, for the
remaining agricultural consumers, there will be
round-the-clock supply.
The peak demand is expected to rise from 17,355 in
FY17 to around 18,918 MW in FY19 (and 24,777 MW in
FY22) after including electrification of all households as
well as impact of energy efficiency measures.
Similarly, the energy requirement would increase from
the current requirement of about 1,08,853 MU in FY17
to 1,22,856 MU in FY19 (and 1,60,903 MU in FY22) after
including electrification of all households as well as
impact of energy efficiency measures.
Considering the variations in peak demand within the
day as well as across the year, CEA will assist the State
CRISIL Infrastructure Advisory
24x7 Power for All (Uttar Pradesh) iii
in formulating a strategy for flattening the load curve
within next three months.
Generation capacity
In FY17, the total contracted capacity for the State is
22,602 MW.
Coal-based capacity constitutes about 79% of the total
capacity, followed by hydro (10%), renewable (7%),
gas-based (3%), and nuclear (2%).
To meet the increasing demand in the future, the State
has planned an additional capacity of 11,282 MW from
own generating stations and allocations from central
generating stations, besides sourcing power from
private generating stations under Case 1 competitive
bidding and renewable energy sources in a phased
manner by FY22. The State is also planning to enhance
the capacity of its existing power plants through RM&U
schemes.
With the planned capacity addition and achievement of
the targeted loss, the State is expected to fully meet its
requirement (in energy terms) through the contracted
capacity. However, considering huge variations in
demand for short durations in the day, the State needs
to effectively strategise power purchase planning
including setting up a mechanism for meeting short-
term peaking requirement. The plan may also
adequately explore all cheaper sources of short to
medium-term power purchase through bilateral
arrangements or through exchange, etc.
Further, to bring in more efficiency along with
reduction of the overall power procurement costs, the
Government of India and State of UP may explore:
Coal swapping for Parichha (2x110 MW + 2 x 210
MW), Parichha (2x250 MW), Harduaganj TPS (2 x
250 MW), Rosa TPP (4 x 300 MW), Bajaj TPP (5 x 90
MW)
Aggregation of linkage for different stations so as
to save payment of additional charges on account
of
Commitment charges for lower offtake of coal
due to lower operational performance of old
stations
Incentive on account of higher procurement of
coal for super critical stations
Accelerating development of coal block allotted to
UPRVUNL
Transmission network
Commensurate capacity addition in the interstate and
intrastate transmission systems have been planned
based on an estimated peak demand of 18,918 MW in
FY19, while keeping in view that around 40% of the
power requirement of Uttar Pradesh is going to be met
from plants connected to the interstate transmission
network.
PGCIL has planned to increase the transformation
capacity at 765/400 kV voltage level from 24,000 MVA
to 30,500 MVA and at 400/220 kV voltage level from
9,615 MVA to 10,430 MVA. It also has a transmission
capacity of 300 MVA at 220/132 kV voltage level.
UPPTCL is also planning to substantially augment its
transformation capacity levels. Between FY17 and
FY19, the transmission capacities at 765/400 kV and
400/220 kV voltage levels are planned to go up from
9,000 MVA to 16,000 MVA and from 16,585 MVA to
24,585 MVA, respectively.
The capacity planned by UPPTCL, purely for the
intrastate transmission system, at 220/132 kV in FY19
is projected to go up to 39,140 MVA from 29,750 MVA
currently, while the capacity at 132/33 kV is projected
to go up to 45,363 MVA from 37,221 MVA.
Commensurate additions in transmission line
capacities have been planned at voltage levels of 132
kV and above. The system has been planned with a
view to relieve uncomfortable sectoral overloading of
transformers and concurrently address the
contingency issues to provide reliable power.
The challenges in transmission pertaining to congestion
would require a detailed load flow study by UPPTCL
(which should be verified by CEA within a total
CRISIL Infrastructure Advisory
24x7 Power for All (Uttar Pradesh) iv
timeframe of three months) and the addition of
renewables would require a study of integration of the
clean-energy grid. Based on requirement, the State will
look for options for the construction of new lines
through tariff-based competitive bidding (TBCB) route
and invite more private participation.
Adequate capacity and line additions would enable the
intrastate transmission system to adequately cater to
the projected demand in FY19.
Distribution network
The State has submitted a perspective distribution plan
to CEA, envisaging substantial distribution capacity
addition in the next few years. This would include
augmentation of the existing network as well as
expansion and provision of last-mile connectivity to
un-electrified areas. Presently, distribution
transformation capacity at 33 kV level is about 44,677
MVA, over and above which the Discoms are planning
to add about 7,762 MVA, resulting in cumulative total
capacity of 52,403 MVA by the end of FY19. At the DT
level, huge capacity addition is planned which is
expected to reach to 55,701 MVA by end of FY19.
The critical challenges in distribution include last-mile
connectivity, illegal connections, high losses and
quality of supply for which the State plans to take
measures such as feeder separation, smart meter
installation, and metering. Discoms aim to convert
unmetered connections into metered connections by
formulation of a suitable metering policy.
To improve voltage profile and reduce line losses, the
State has planned to install 3,302 capacitor banks with
total capacity of over 8,300 MVAr.
On overall basis, the capacity addition is considered
adequate to meet the increased demand owing to
addition of electrified households under various
schemes on top of normal load growth. Funds of Rs
21,766.38 crore are available with the State under
ongoing central schemes (IPDS, RAPDRP, and DDUGJY)
and ongoing state schemes. To ensure 100%
electrification in the State by 2019, the State shall
undertake a survey and work out the additional fund
requirement, if any. The source of such additional
funding shall be separately explored.
AT&C losses
Under Ujwal Discom Assurance Yojana (UDAY), the
State Government, Discoms and the Government of
India have signed a tripartite agreement, under which
the State has agreed to reduce AT&C loss to 19.36% by
FY19 and 14.86% by end FY20, from current level of
34.22% in FY15. The trajectory of loss, as agreed under
UDAY, has been taken into account for preparing this
roadmap document. For NPCL, the projected AT&C and
distribution loss targets for FY19 have been considered
as 8.92% and 8.00%, respectively.
To achieve these targets, the State shall pursue
implementation of ongoing schemes - i.e., IPDS,
RAPDRP, DDUGJY, Vidyut Chori Roko Abhiyan (VICRA) -
and will also take additional steps, including installation
of prepaid meters, defective meter replacement, raids
for checking thefts, replacement of mechanical meters,
and metering of unmetered connections on a war-
footing basis.
Clean-energy initiatives
The State has notified policies such as Solar Power
Policy, 2013, and RPO Compliance Regulations, for the
promotion of clean energy in the State. The State plans
to add 2,767 MW of grid-connected renewable energy
plants and around 58.6 MW through off-grid projects
up to FY19.
A 440 MW solar park has been allotted to Uttar Pradesh
for which MNRE would provide CFA of Rs 88 crore (i.e.,
Rs 20 lakhs/MW). However, as the Cabinet has
increased the aggregate capacity of solar parks from
20,000 MW to 40,000 MW, the State Government can
apply for higher capacity.
Investment in biomass is expected to be around Rs.
1,125 crore in next two years with total addition of 150
MW.
CRISIL Infrastructure Advisory
24x7 Power for All (Uttar Pradesh) v
Energy conservation and efficiency
As per the report of National Productivity Council there
is scope for 13-15% reduction in electricity usage
through demand side measures, which translate into
15,000 MU of annual energy savings, resulting in
around 1,500 MW of avoidable capacity.
In U.P., approximately 10 lakh pump-sets are used for
agriculture. State Government may prioritise
replacement of very old pumps with energy-efficient
pumps with smart control panels.
State has vision to distribute 10 crore LED bulbs in Uttar
Pradesh. EESL will supply LED bulbs through its
distribution partners under UJALA scheme. EESL's
regional officers will ensure frequent and high number
of distribution kiosks at all places in U.P. Discoms will
also hold necessary awareness programmes among
common people on UJALA scheme for its success.
State Government may also sign agreement with EESL
on replacement of entire state’s conventional street
lights with LED street lights, which will help in reduction
of peak load during evening hours.
Financial turnaround
The Government of India, the Government of Uttar
Pradesh and the Discoms in the State have signed a
memorandum of understanding under UDAY on
January 30, 2016, for operational and financial
turnaround of Discoms. As envisaged in the scheme,
the Government of Uttar Pradesh has taken over 75%
of the total Discom debt outstanding as on September
30, 2015. Further, during FY16 and FY17, state bonds of
Rs 39,133 crore and Discom bonds of Rs 10,376 crore
have been issued.
As per the UDAY MoU, the State is expected to turn
profitable by FY19.
Other initiatives
GOI has launched number of mobile applications and IT
initiatives to enhance accountability and transparency
in measuring and monitoring the power scenarios and
project status at various state and central levels. UP
state will also collaborate with GOI to effectively utilise
these initiatives and applications. Major applications
are:
Vidyut PRAVAH: This app provides highlights of
power availability, demand and market price in the
exchange on real-time basis.
Tarang: Monitors intra and inter-state
transmission projects’ status on pan-India basis for
ensuring timely corrective actions.
DEEP: Supports short and medium-term power
procurement, in a uniform and transparent
manner by utilities.
GARV – II: App provides village-wise and
habitation-wise baseline data of household
electrifications of all states
URJA: App provides outage information,
addressing complaints and power reliability of
urban IT-enabled towns.
National UJALA Dashboard: App provides effective
monitoring of distribution of LED to state utilities.
UDAY Monitoring Portal: App provides effective
monitoring of various parameters and reform
measures signed under UDAY scheme.
URJA Mitra: App provides effective monitoring of
power outage and information dispensation to
consumers.
The State Government will also adopt new
technologies and measures on a large scale such as:
Requirement of regional distribution control
centres (RDCC) within the State will be identified in
view of upcoming projected load. These will
initially cater to the principal load centres, but
would thereafter be expanded to all load centres of
the State. This will be a key initiative, not only for
effectively managing 24x7 power supply, but also
thereafter for other functions like load forecasting.
Project monitoring tools shall be incorporated in
the PMU to ensure that progress on the
investments in the State are monitored rigorously
and bottlenecks identified.
CRISIL Infrastructure Advisory
24x7 Power for All (Uttar Pradesh) vi
Establishment of IT-enabled Online Energy
Metering, Billing & Collection System in state
DISCOMs. Establishment of meter data acquisition
system (MDAS), which will be integrated with all
feeders and select consumers' meters. Integration
of MDAS with Online Billing System will facilitate
computation of feeder-wise AT&C losses. MDAS
will also provide frequency and duration of power
interruption and improve customer care centre
services.
Above online services may also be implemented in
rural areas of the State using cloud computing-
based, web-enabled IT system, which will provide
metering billing and collection (MBC) and other
consumer-centric services on internet. This system
will facilitate setting up of mobile camps for
consumer billing and collection services at 40,000
consumer service centres throughout the State.
Implementation of various mobile applications for
ease of business operation, to provide consumers
on-the-go services and monitoring of KPIs of
commercial activities.
Mobile applications for the consumer (Consumer
App), management (Management App) and field
activities (Field App) shall be developed on priority
basis with monitoring dash board.


CRISIL Infrastructure Advisory
24x7 Power for All (Uttar Pradesh) 1
CRISIL Infrastructure Advisory
24x7 Power for All (Uttar Pradesh) 2
Power sector is a critical infrastructure element for an
economy’s growth. Availability of reliable, quality and
affordable power is vital for rapid growth in agriculture,
industry and for overall economic development of a
state. An efficient, resilient and financially healthy
power sector is an essential requirement for growth of
a state and economic empowerment of the common
man.
Under the Indian Constitution, electricity is a
concurrent subject. As per Electricity Act 2003, it is the
duty of a distribution licensee to develop and maintain
an efficient, coordinated and economical distribution
system in the mandated area of supply as well as to
supply electricity in accordance with the provisions
contained in the Act. The State Electricity Regulatory
Commission (SERC), as per the provisions of the Act,
specifies and enforces the standards with respect to
quality and reliability of supply by licensees and also
monitors the performance of distribution companies
(licensees) on the basis of notified performance
standards.
Objectives and key outcomes of the 24x7
Power for All joint initiative
The 24x7 Power for All (24x7 PFA) is a joint initiative of
the Government of India (GoI) and the Government of
Uttar Pradesh (GoUP) with the objective to make 24x7
power available to all households, industry,
commercial, public needs, any other electricity-
consuming entity, and adequate power to agriculture
farm holdings.
Towards this goal, the 24x7 PFA initiative seeks to:
i. Ensure reliable 24x7 supply to consumers by 2019.
The hours of supply for agriculture consumers will
be decided by the State Government as per
requirement.
ii. Ensure that all unconnected households are
provided access to electricity in a time-bound
manner by 2019.
iii. Ensure adequate capacity addition planning and
tie-ups for power from various sources at
affordable price to meet the projected power
demand in future.
iv. Strengthen the transmission and distribution
networks to cater to the expected growth in
demand of existing as well as future consumers.
v. Assess financial measures including optimisation of
investments and undertaking of necessary balance
sheet restructuring measures to ensure liquidity in
the finances of the utility.
vi. Put in place a strategy to ensure reduction of AT&C
losses as per agreed loss reduction trajectory and
methodology and chalk out measures required at
every level of distribution.
vii. Identify steps for implementation and adoption of
modern technologies to monitor reliability of
supply. Identify steps for monitoring and timely
commissioning of various generating plants and
transmission and distribution infrastructure to
meet the expected growth in demand.
viii. Take measures for meeting the performance
standards, as laid down by UPSERC.
This document is an action plan drawn to achieve the
above aims and objectives. The plan will be executed
by the Government of Uttar Pradesh with the support
of Government of India, wherever necessary, as per
their approved plans, schemes and policies.
Methodology for preparation of the action
plan for 24x7 Power for All
The plan aims at the following:
1) Bridging the gap between demand and supply for the already identified/registered consumers and other consuming entities
2) Connecting the unconnected households and unconnected farm holdings
Accordingly the methodology adopted to prepare the
‘Action Plan’ for 24x7 PFA includes, inter-alia:
CRISIL Infrastructure Advisory
24x7 Power for All (Uttar Pradesh) 3
1) Project average per day consumption of rural and
urban households based on respective historical
compounded annual growth rates (CAGR) during
the past five years.
2) Project the demand of commercial, industrial and
agriculture consumers based again on past data and
historical CAGR recorded during the past five years.
3) Assess the power requirement of un-electrified
households and draw up a time-bound plan for
electrification of all households.
4) Project the annual energy requirement and
maximum demand by aggregating the requirement
of all consumer categories and applying an
appropriate load factor.
5) Draw up a broad plan to meet power demand in
future through:
State’s own upcoming generation resources
Allocation from upcoming central sector power
plants
Quantum of additional procurement required
6) Assess the additional energy requirement for
providing 24x7 power supply to all households in
the State as well as to other consumer categories
and determine financial implications on utilities for
procuring additional energy and its implications on
tariff.
7) Assess the adequacy of the network - both inter-
state and intra-state transmission as well as
distribution so as to meet the increased / expected
/ projected power requirement of all consumer
categories of the State.
8) Conduct sensitivity analysis for cost of service and
resulting financial gap under multiple scenarios,
namely, tariff hike, reduction in power procurement
cost and increase in interest and moratorium period
and AT&C loss reduction, etc.
9) Set measurable targets to achieve the goal of 24x7
Power for All in a cost-effective manner for
consumers of the State.

CRISIL Infrastructure Advisory
24x7 Power for All (Uttar Pradesh) 4

CRISIL Infrastructure Advisory
24x7 Power for All (Uttar Pradesh) 5
CRISIL Infrastructure Advisory
24x7 Power for All (Uttar Pradesh) 6
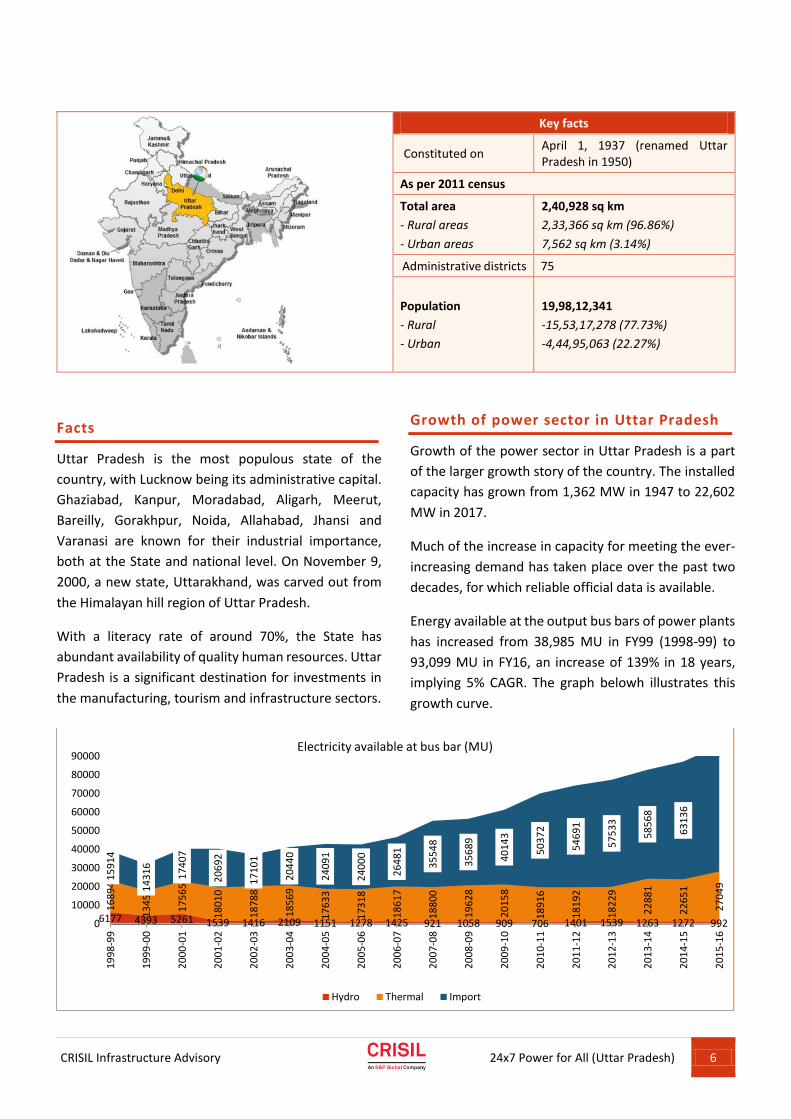
Key facts
Constituted on April 1, 1937 (renamed Uttar Pradesh in 1950)
As per 2011 census
Total area
- Rural areas
- Urban areas
2,40,928 sq km
2,33,366 sq km (96.86%)
7,562 sq km (3.14%)
Administrative districts 75
Population
- Rural
- Urban
19,98,12,341
-15,53,17,278 (77.73%)
-4,44,95,063 (22.27%)
Facts
Uttar Pradesh is the most populous state of the
country, with Lucknow being its administrative capital.
Ghaziabad, Kanpur, Moradabad, Aligarh, Meerut,
Bareilly, Gorakhpur, Noida, Allahabad, Jhansi and
Varanasi are known for their industrial importance,
both at the State and national level. On November 9,
2000, a new state, Uttarakhand, was carved out from
the Himalayan hill region of Uttar Pradesh.
With a literacy rate of around 70%, the State has
abundant availability of quality human resources. Uttar
Pradesh is a significant destination for investments in
the manufacturing, tourism and infrastructure sectors.
Growth of power sector in Uttar Pradesh
Growth of the power sector in Uttar Pradesh is a part
of the larger growth story of the country. The installed
capacity has grown from 1,362 MW in 1947 to 22,602
MW in 2017.
Much of the increase in capacity for meeting the ever-
increasing demand has taken place over the past two
decades, for which reliable official data is available.
Energy available at the output bus bars of power plants
has increased from 38,985 MU in FY99 (1998-99) to
93,099 MU in FY16, an increase of 139% in 18 years,
implying 5% CAGR. The graph belowh illustrates this
growth curve.
6177 4393 5261 1539 1416 2109 1151 1278 1425 921 1058 909 706 1401 1539 1263 1272 992
16
89
4
13
45
6
17
56
5
18
01
0
18
78
8
18
56
9
17
63
3
17
31
8
18
61
7
18
80
0
19
62
8
20
15
8
18
91
6
18
19
2
18
22
9
22
88
1
22
65
1
27
04
9
15
91
4
14
31
6
17
40
7
20
69
2
17
10
1
20
44
0
24
09
1
24
00
0
26
48
1
35
54
8
35
68
9
40
14
3
50
37
2
54
69
1
57
53
3
58
56
8
63
13
6
0
10000
20000
30000
40000
50000
60000
70000
80000
90000
19
98
-99
19
99
-00
20
00
-01
20
01
-02
20
02
-03
20
03
-04
20
04
-05
20
05
-06
20
06
-07
20
07
-08
20
08
-09
20
09
-10
20
10
-11
20
11
-12
20
12
-13
20
13
-14
20
14
-15
20
15
-16
Electricity available at bus bar (MU)
Hydro Thermal Import
CRISIL Infrastructure Advisory
24x7 Power for All (Uttar Pradesh) 7
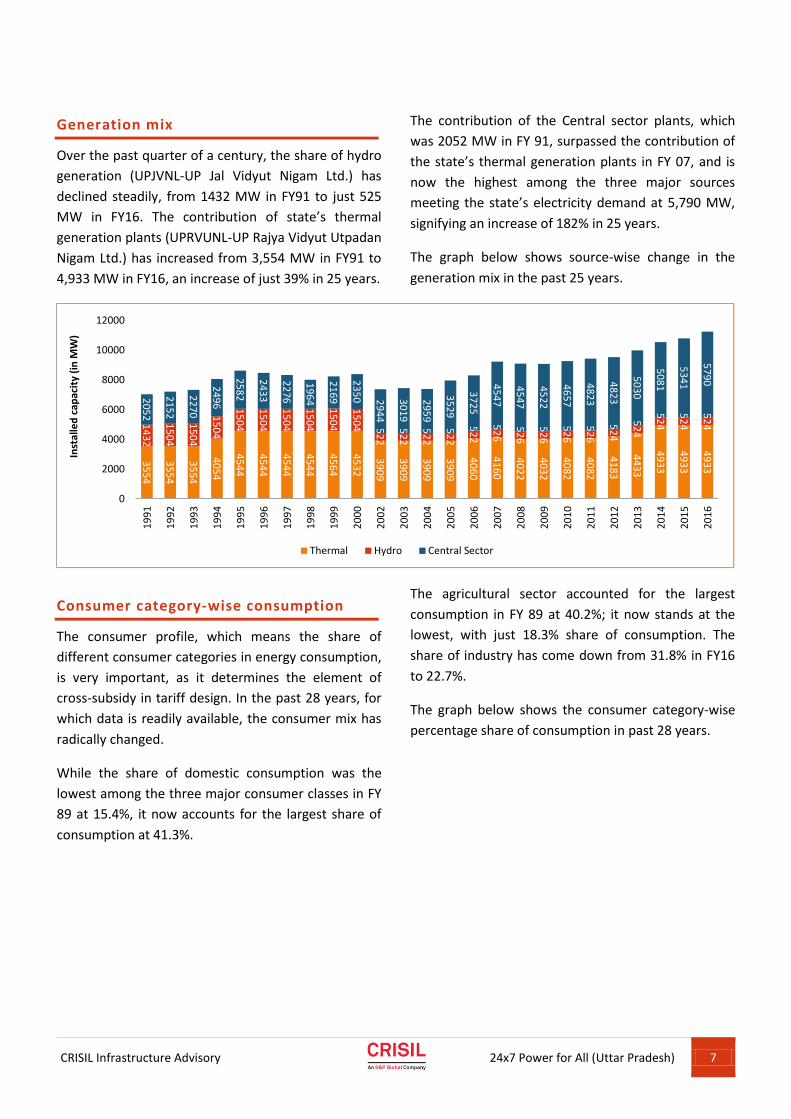
Generation mix
Over the past quarter of a century, the share of hydro
generation (UPJVNL-UP Jal Vidyut Nigam Ltd.) has
declined steadily, from 1432 MW in FY91 to just 525
MW in FY16. The contribution of state’s thermal
generation plants (UPRVUNL-UP Rajya Vidyut Utpadan
Nigam Ltd.) has increased from 3,554 MW in FY91 to
4,933 MW in FY16, an increase of just 39% in 25 years.
The contribution of the Central sector plants, which
was 2052 MW in FY 91, surpassed the contribution of
the state’s thermal generation plants in FY 07, and is
now the highest among the three major sources
meeting the state’s electricity demand at 5,790 MW,
signifying an increase of 182% in 25 years.
The graph below shows source-wise change in the
generation mix in the past 25 years.
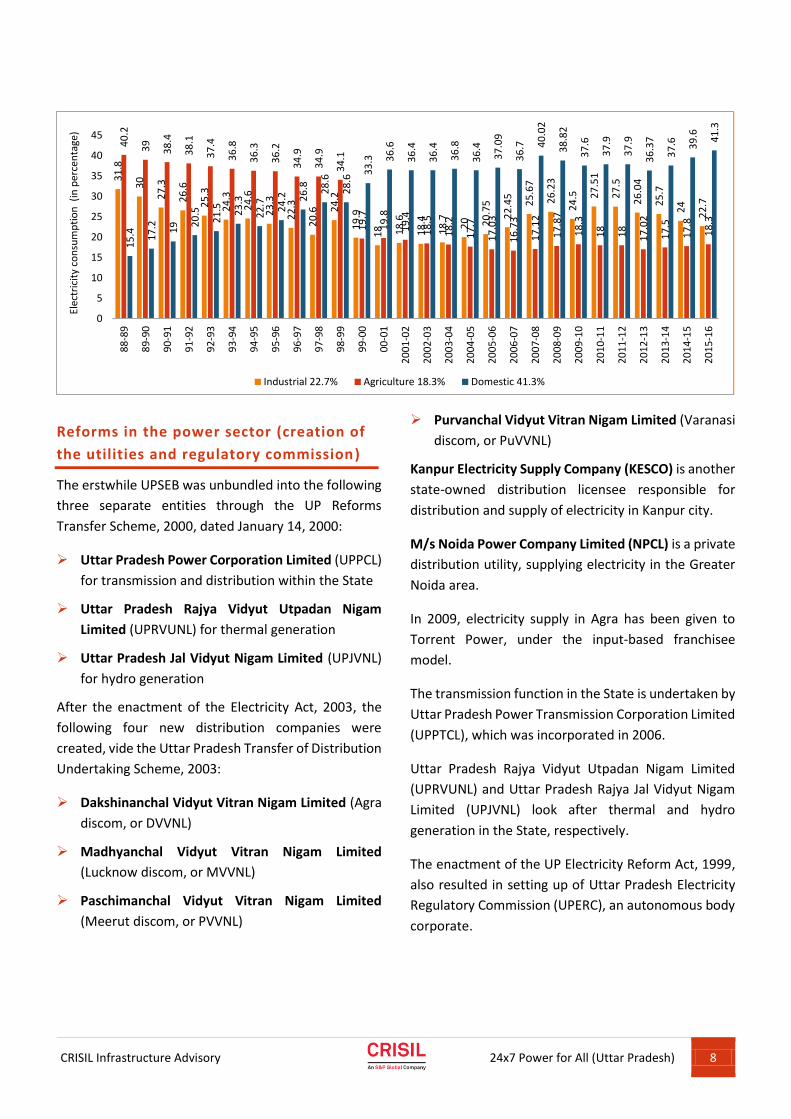
Consumer category-wise consumption
The consumer profile, which means the share of
different consumer categories in energy consumption,
is very important, as it determines the element of
cross-subsidy in tariff design. In the past 28 years, for
which data is readily available, the consumer mix has
radically changed.
While the share of domestic consumption was the
lowest among the three major consumer classes in FY
89 at 15.4%, it now accounts for the largest share of
consumption at 41.3%.
The agricultural sector accounted for the largest
consumption in FY 89 at 40.2%; it now stands at the
lowest, with just 18.3% share of consumption. The
share of industry has come down from 31.8% in FY16
to 22.7%.
The graph below shows the consumer category-wise
percentage share of consumption in past 28 years.
35
54
35
54
35
54
40
54
45
44
45
44
45
44
45
44
45
64
45
32
39
09
39
09
39
09
39
09
40
60
41
60
40
22
40
32
40
82
40
82
41
83
44
33
49
33
49
33
49
33
14
32
15
04
15
04
15
04
15
04
15
04
15
04
15
04
15
04
15
04 5
22
52
2
52
2
52
2
52
2
52
6
52
6
52
6
52
6
52
6
52
4
52
4
52
4
52
4
52
4
20
52
21
52
22
70
24
96
25
82
24
33
22
76
19
64
21
69
23
50 2
94
4
30
19
29
59
35
29
37
25
45
47
45
47
45
22
46
57
48
23
48
23
50
30
50
81
53
41
57
90
0
2000
4000
6000
8000
10000
12000
19
91
19
92
19
93
19
94
19
95
19
96
19
97
19
98
19
99
20
00
20
02
20
03
20
04
20
05
20
06
20
07
20
08
20
09
20
10
20
11
20
12
20
13
20
14
20
15
20
16
Inst
alle
d c
apac
ity
(in
MW
)
Thermal Hydro Central Sector
CRISIL Infrastructure Advisory
24x7 Power for All (Uttar Pradesh) 8
Reforms in the power sector (creation of
the utilities and regulatory commission)
The erstwhile UPSEB was unbundled into the following
three separate entities through the UP Reforms
Transfer Scheme, 2000, dated January 14, 2000:
Uttar Pradesh Power Corporation Limited (UPPCL)
for transmission and distribution within the State
Uttar Pradesh Rajya Vidyut Utpadan Nigam
Limited (UPRVUNL) for thermal generation
Uttar Pradesh Jal Vidyut Nigam Limited (UPJVNL)
for hydro generation
After the enactment of the Electricity Act, 2003, the
following four new distribution companies were
created, vide the Uttar Pradesh Transfer of Distribution
Undertaking Scheme, 2003:
Dakshinanchal Vidyut Vitran Nigam Limited (Agra
discom, or DVVNL)
Madhyanchal Vidyut Vitran Nigam Limited
(Lucknow discom, or MVVNL)
Paschimanchal Vidyut Vitran Nigam Limited
(Meerut discom, or PVVNL)
Purvanchal Vidyut Vitran Nigam Limited (Varanasi
discom, or PuVVNL)
Kanpur Electricity Supply Company (KESCO) is another
state-owned distribution licensee responsible for
distribution and supply of electricity in Kanpur city.
M/s Noida Power Company Limited (NPCL) is a private
distribution utility, supplying electricity in the Greater
Noida area.
In 2009, electricity supply in Agra has been given to
Torrent Power, under the input-based franchisee
model.
The transmission function in the State is undertaken by
Uttar Pradesh Power Transmission Corporation Limited
(UPPTCL), which was incorporated in 2006.
Uttar Pradesh Rajya Vidyut Utpadan Nigam Limited
(UPRVUNL) and Uttar Pradesh Rajya Jal Vidyut Nigam
Limited (UPJVNL) look after thermal and hydro
generation in the State, respectively.
The enactment of the UP Electricity Reform Act, 1999,
also resulted in setting up of Uttar Pradesh Electricity
Regulatory Commission (UPERC), an autonomous body
corporate.
31
.8
30
27
.3
26
.6
25
.3
24
.3
24
.6
23
.3
22
.3
20
.6 24
.2
19
.9
18 18
.6
18
.4
18
.7
20 20
.75
22
.45
25
.67
26
.23
24
.5 27
.51
27
.5
26
.04
25
.7
24
22
.7
40
.2
39
38
.4
38
.1
37
.4
36
.8
36
.3
36
.2
34
.9
34
.9
34
.1
19
.7
19
.8
19
.4
18
.5
18
.2
17
.7
17
.03
16
.73
17
.12
17
.87
18
.3
18
18
17
.02
17
.5
17
.8
18
.3
15
.4 17
.2 19 2
0.5
21
.5 23
.3
22
.7 24
.2 26
.8 28
.6
28
.6
33
.3 36
.6
36
.4
36
.4
36
.8
36
.4
37
.09
36
.7 40
.02
38
.82
37
.6
37
.9
37
.9
36
.37
37
.6 39
.6 41
.3
0
5
10
15
20
25
30
35
40
458
8-8
9
89
-90
90
-91
91
-92
92
-93
93
-94
94
-95
95
-96
96
-97
97
-98
98
-99
99
-00
00
-01
20
01
-02
20
02
-03
20
03
-04
20
04
-05
20
05
-06
20
06
-07
20
07
-08
20
08
-09
20
09
-10
20
10
-11
20
11
-12
20
12
-13
20
13
-14
20
14
-15
20
15
-16
Elec
tric
ity
con
sum
pti
on
(in
per
cen
tage
)
Industrial 22.7% Agriculture 18.3% Domestic 41.3%
CRISIL Infrastructure Advisory
24x7 Power for All (Uttar Pradesh) 9
CRISIL Infrastructure Advisory
24x7 Power for All (Uttar Pradesh) 10
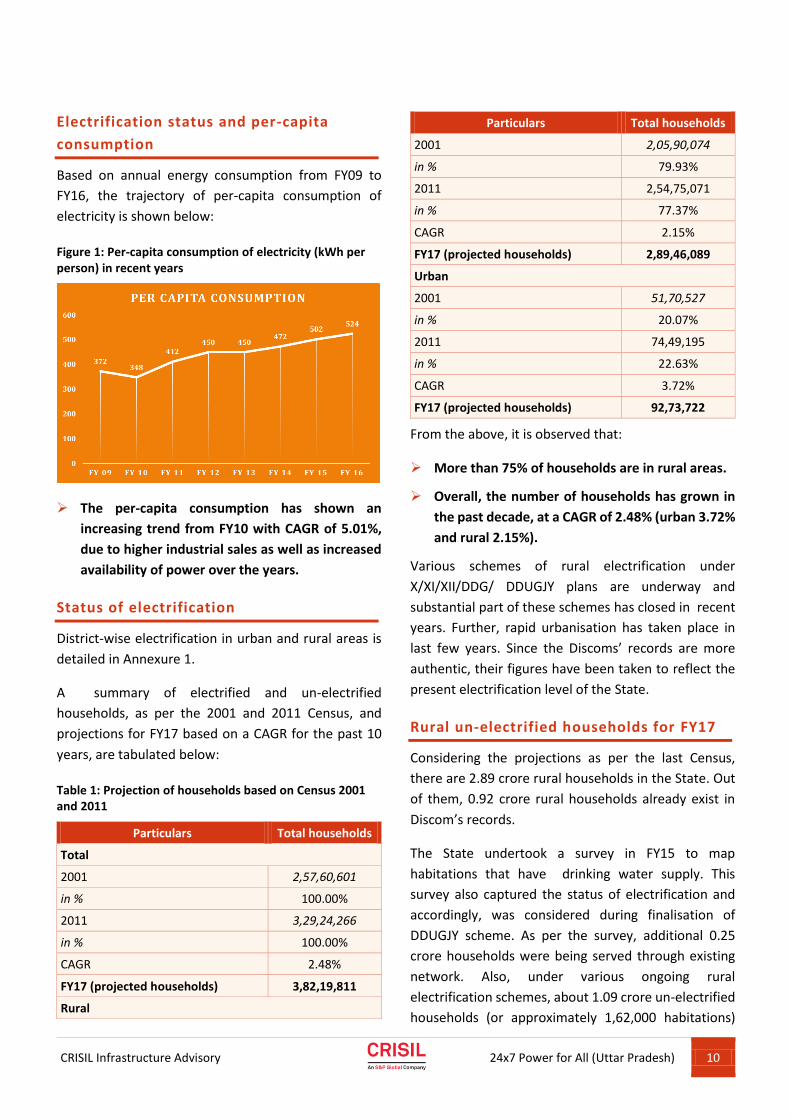
Electrification status and per-capita
consumption
Based on annual energy consumption from FY09 to
FY16, the trajectory of per-capita consumption of
electricity is shown below:
Figure 1: Per-capita consumption of electricity (kWh per person) in recent years
The per-capita consumption has shown an
increasing trend from FY10 with CAGR of 5.01%,
due to higher industrial sales as well as increased
availability of power over the years.
Status of electrification
District-wise electrification in urban and rural areas is
detailed in Annexure 1.
A summary of electrified and un-electrified
households, as per the 2001 and 2011 Census, and
projections for FY17 based on a CAGR for the past 10
years, are tabulated below:
Table 1: Projection of households based on Census 2001 and 2011
Particulars Total households
Total
2001 2,57,60,601
in % 100.00%
2011 3,29,24,266
in % 100.00%
CAGR 2.48%
FY17 (projected households) 3,82,19,811
Rural
Particulars Total households
2001 2,05,90,074
in % 79.93%
2011 2,54,75,071
in % 77.37%
CAGR 2.15%
FY17 (projected households) 2,89,46,089
Urban
2001 51,70,527
in % 20.07%
2011 74,49,195
in % 22.63%
CAGR 3.72%
FY17 (projected households) 92,73,722
From the above, it is observed that:
More than 75% of households are in rural areas.
Overall, the number of households has grown in
the past decade, at a CAGR of 2.48% (urban 3.72%
and rural 2.15%).
Various schemes of rural electrification under
X/XI/XII/DDG/ DDUGJY plans are underway and
substantial part of these schemes has closed in recent
years. Further, rapid urbanisation has taken place in
last few years. Since the Discoms’ records are more
authentic, their figures have been taken to reflect the
present electrification level of the State.
Rural un-electrified households for FY17
Considering the projections as per the last Census,
there are 2.89 crore rural households in the State. Out
of them, 0.92 crore rural households already exist in
Discom’s records.
The State undertook a survey in FY15 to map
habitations that have drinking water supply. This
survey also captured the status of electrification and
accordingly, was considered during finalisation of
DDUGJY scheme. As per the survey, additional 0.25
crore households were being served through existing
network. Also, under various ongoing rural
electrification schemes, about 1.09 crore un-electrified
households (or approximately 1,62,000 habitations)
CRISIL Infrastructure Advisory
24x7 Power for All (Uttar Pradesh) 11
were targeted to be served through additional network
being created.
Till FY17, necessary infrastructure works for
approximately 88,000 habitations have already been
completed, resulting in ready access of electricity to
additional 0.59 crore households.
This implies that at end of FY17, 0.84 crore households
have ready access to electricity, but are yet to be
formalised and metered. Hence, for drawing up this
roadmap document, these 0.84 crore households are
considered to be electrified as they are already
contributing to the overall demand of the State.
Accordingly, the status of electrification in the State is
tabulated below:
Particulars Status (FY17)
Total rural households 2,89,46,089
Total electrified households on Discom records
92,72,706
Households with access to electricity (old + newly created) and yet to be formalised
84,62,695
Balance to be electrified 1,12,10,688
Households to be electrified (already covered in the infrastructure being created in the ongoing schemes)
49,97,696
Balance households to be electrified 62,12,992
It is noted that in the past, money has been sanctioned
under various rural electrification schemes including
DDUGY, for electrifying the households in the State. As
detailed in above table, there are around 1.12 crore un-
electrified households in the State. The State
Government with the support of the Central
Government shall endeavour to ensure that these
households are electrified by 2019. Out of these un-
electrified households, the State endeavours to
electrify 0.50 crore households by October 2018 under
the ongoing schemes. Further, the State will validate
the balance 0.62 crore un-electrified households by
undertaking a survey and formulate DPRs for
electrification of the final verified un-electrified
households by July 2017. For this purpose, State
Government shall make efforts to tie up the necessary
funds required from available sources including
Government of India.
Urban un-electrified households for FY17
Similarly, considering the projections as per Census,
there are 0.93 crore urban households in the State. Out
of them, 0.78 crore urban households already exist in
Discom’s records. The State envisages to target the
electrification of these remaining 0.15 crore urban
households by 2019 after undertaking appropriate
augmentation/ extension of the existing network of
urban areas. As these consumers are not covered
under any existing scheme, the State needs to
formulate a scheme to connect all urban un-electrified
consumers within the target date.

CRISIL Infrastructure Advisory
24x7 Power for All (Uttar Pradesh) 12
CRISIL Infrastructure Advisory
24x7 Power for All (Uttar Pradesh) 13
CRISIL Infrastructure Advisory
24x7 Power for All (Uttar Pradesh) 14
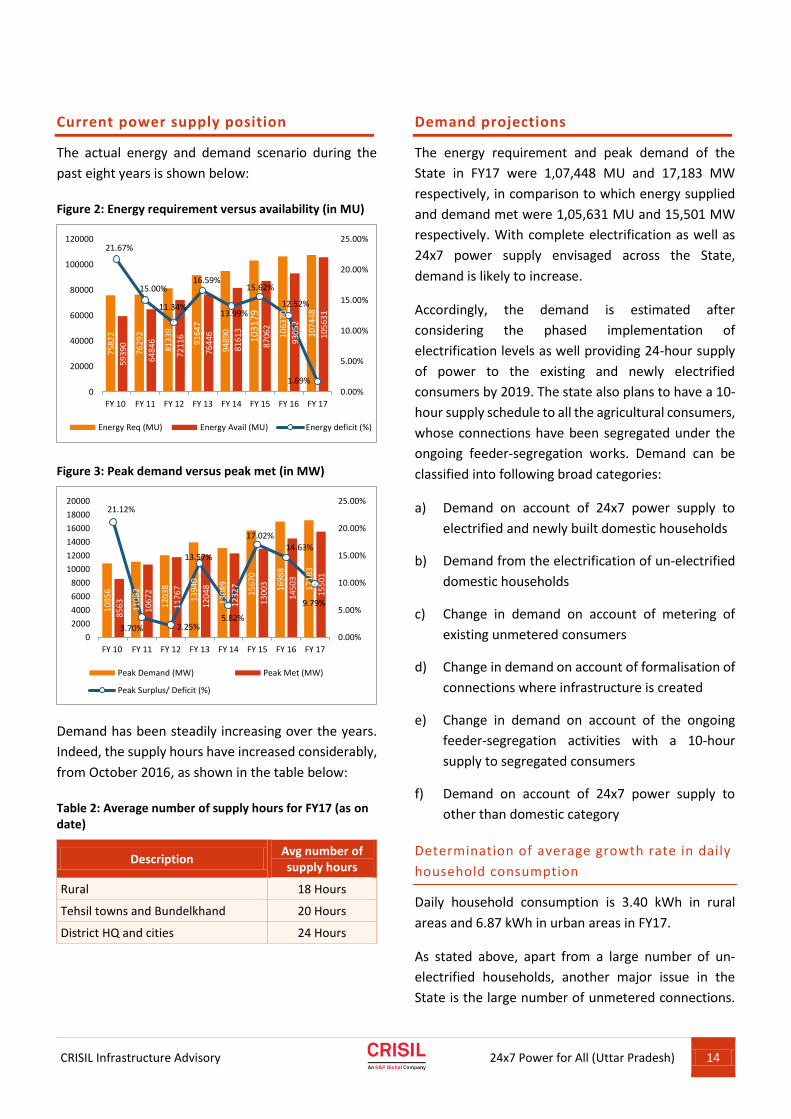
Current power supply position
The actual energy and demand scenario during the
past eight years is shown below:
Figure 2: Energy requirement versus availability (in MU)
Figure 3: Peak demand versus peak met (in MW)
Demand has been steadily increasing over the years.
Indeed, the supply hours have increased considerably,
from October 2016, as shown in the table below:
Table 2: Average number of supply hours for FY17 (as on date)
Description Avg number of supply hours
Rural 18 Hours
Tehsil towns and Bundelkhand 20 Hours
District HQ and cities 24 Hours
Demand projections
The energy requirement and peak demand of the
State in FY17 were 1,07,448 MU and 17,183 MW
respectively, in comparison to which energy supplied
and demand met were 1,05,631 MU and 15,501 MW
respectively. With complete electrification as well as
24x7 power supply envisaged across the State,
demand is likely to increase.
Accordingly, the demand is estimated after
considering the phased implementation of
electrification levels as well providing 24-hour supply
of power to the existing and newly electrified
consumers by 2019. The state also plans to have a 10-
hour supply schedule to all the agricultural consumers,
whose connections have been segregated under the
ongoing feeder-segregation works. Demand can be
classified into following broad categories:
a) Demand on account of 24x7 power supply to
electrified and newly built domestic households
b) Demand from the electrification of un-electrified
domestic households
c) Change in demand on account of metering of
existing unmetered consumers
d) Change in demand on account of formalisation of
connections where infrastructure is created
e) Change in demand on account of the ongoing
feeder-segregation activities with a 10-hour
supply to segregated consumers
f) Demand on account of 24x7 power supply to
other than domestic category
Determination of average growth rate in daily
household consumption
Daily household consumption is 3.40 kWh in rural
areas and 6.87 kWh in urban areas in FY17.
As stated above, apart from a large number of un-
electrified households, another major issue in the
State is the large number of unmetered connections.
75
82
2
76
29
2
81
33
9
91
64
7
94
89
0
10
31
79
10
63
70
1074
48
59
39
0
64
84
6
72
11
6
76
44
6
81
61
3
87
06
2
93
05
2
10
56
31
21.67%
15.00%
11.34%
16.59%
13.99%
15.62%
12.52%
1.69%0.00%
5.00%
10.00%
15.00%
20.00%
25.00%
0
20000
40000
60000
80000
100000
120000
FY 10 FY 11 FY 12 FY 13 FY 14 FY 15 FY 16 FY 17
Energy Req (MU) Energy Avail (MU) Energy deficit (%)
1085
6
1108
2
1203
8
1394
0
1308
9
1567
0
1698
8
1718
3
8563 10
672
1176
7
1204
8
1232
7
1300
3
1450
3
1550
1
21.12%
3.70% 2.25%
13.57%
5.82%
17.02%
14.63%
9.79%
0.00%
5.00%
10.00%
15.00%
20.00%
25.00%
0
2000
4000
6000
8000
10000
12000
14000
16000
18000
20000
FY 10 FY 11 FY 12 FY 13 FY 14 FY 15 FY 16 FY 17
Peak Demand (MW) Peak Met (MW)
Peak Surplus/ Deficit (%)
CRISIL Infrastructure Advisory
24x7 Power for All (Uttar Pradesh) 15
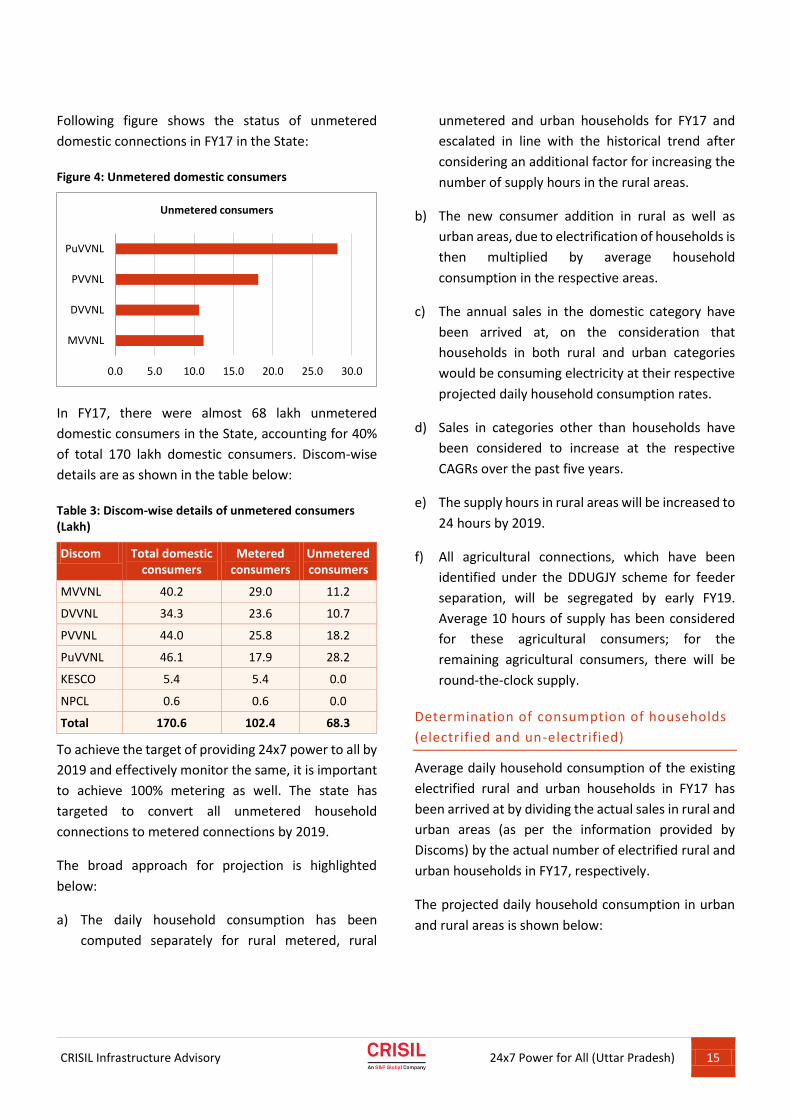
Following figure shows the status of unmetered
domestic connections in FY17 in the State:
Figure 4: Unmetered domestic consumers
In FY17, there were almost 68 lakh unmetered
domestic consumers in the State, accounting for 40%
of total 170 lakh domestic consumers. Discom-wise
details are as shown in the table below:
Table 3: Discom-wise details of unmetered consumers (Lakh)
Discom Total domestic consumers
Metered consumers
Unmetered consumers
MVVNL 40.2 29.0 11.2
DVVNL 34.3 23.6 10.7
PVVNL 44.0 25.8 18.2
PuVVNL 46.1 17.9 28.2
KESCO 5.4 5.4 0.0
NPCL 0.6 0.6 0.0
Total 170.6 102.4 68.3
To achieve the target of providing 24x7 power to all by
2019 and effectively monitor the same, it is important
to achieve 100% metering as well. The state has
targeted to convert all unmetered household
connections to metered connections by 2019.
The broad approach for projection is highlighted
below:
a) The daily household consumption has been
computed separately for rural metered, rural
unmetered and urban households for FY17 and
escalated in line with the historical trend after
considering an additional factor for increasing the
number of supply hours in the rural areas.
b) The new consumer addition in rural as well as
urban areas, due to electrification of households is
then multiplied by average household
consumption in the respective areas.
c) The annual sales in the domestic category have
been arrived at, on the consideration that
households in both rural and urban categories
would be consuming electricity at their respective
projected daily household consumption rates.
d) Sales in categories other than households have
been considered to increase at the respective
CAGRs over the past five years.
e) The supply hours in rural areas will be increased to
24 hours by 2019.
f) All agricultural connections, which have been
identified under the DDUGJY scheme for feeder
separation, will be segregated by early FY19.
Average 10 hours of supply has been considered
for these agricultural consumers; for the
remaining agricultural consumers, there will be
round-the-clock supply.
Determination of consumption of households
(electrified and un-electrified)
Average daily household consumption of the existing
electrified rural and urban households in FY17 has
been arrived at by dividing the actual sales in rural and
urban areas (as per the information provided by
Discoms) by the actual number of electrified rural and
urban households in FY17, respectively.
The projected daily household consumption in urban
and rural areas is shown below:
0.0 5.0 10.0 15.0 20.0 25.0 30.0
MVVNL
DVVNL
PVVNL
PuVVNL
Unmetered consumers
CRISIL Infrastructure Advisory
24x7 Power for All (Uttar Pradesh) 16
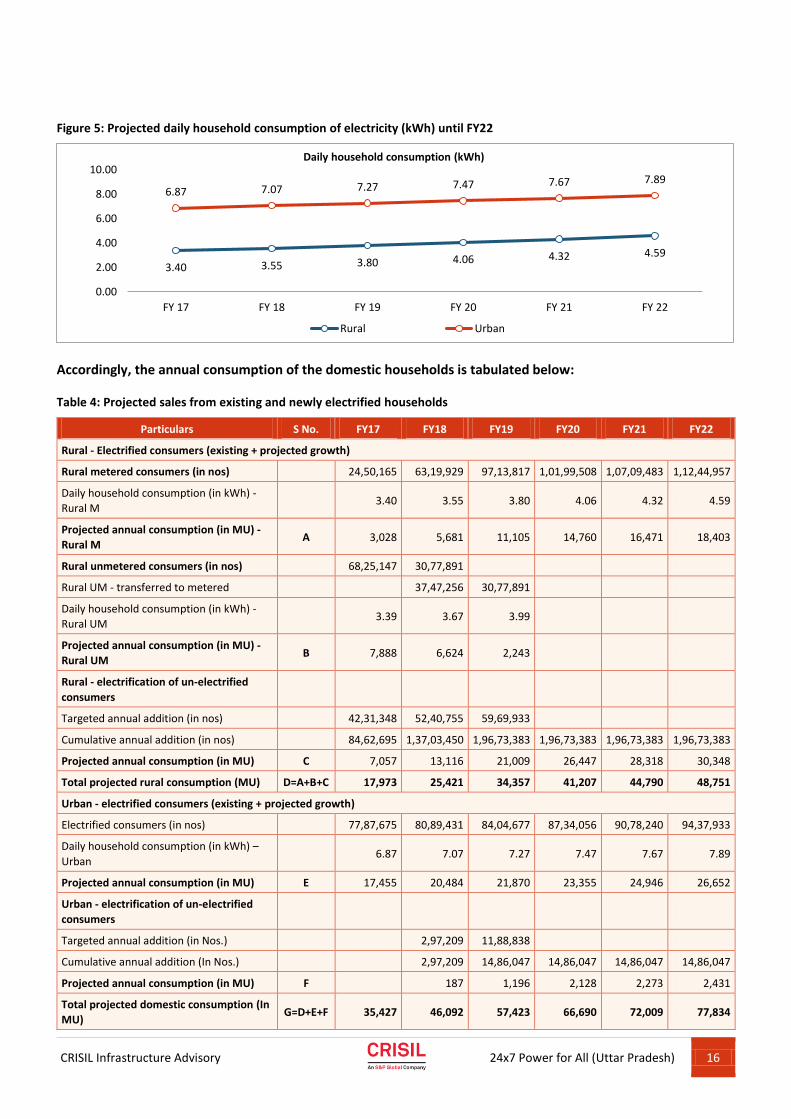
Figure 5: Projected daily household consumption of electricity (kWh) until FY22
Accordingly, the annual consumption of the domestic households is tabulated below:
Table 4: Projected sales from existing and newly electrified households
Particulars S No. FY17 FY18 FY19 FY20 FY21 FY22
Rural - Electrified consumers (existing + projected growth)
Rural metered consumers (in nos) 24,50,165 63,19,929 97,13,817 1,01,99,508 1,07,09,483 1,12,44,957
Daily household consumption (in kWh) -
Rural M 3.40 3.55 3.80 4.06 4.32 4.59
Projected annual consumption (in MU) -
Rural M A 3,028 5,681 11,105 14,760 16,471 18,403
Rural unmetered consumers (in nos) 68,25,147 30,77,891
Rural UM - transferred to metered 37,47,256 30,77,891
Daily household consumption (in kWh) -
Rural UM 3.39 3.67 3.99
Projected annual consumption (in MU) -
Rural UM B 7,888 6,624 2,243
Rural - electrification of un-electrified
consumers
Targeted annual addition (in nos) 42,31,348 52,40,755 59,69,933
Cumulative annual addition (in nos) 84,62,695 1,37,03,450 1,96,73,383 1,96,73,383 1,96,73,383 1,96,73,383
Projected annual consumption (in MU) C 7,057 13,116 21,009 26,447 28,318 30,348
Total projected rural consumption (MU) D=A+B+C 17,973 25,421 34,357 41,207 44,790 48,751
Urban - electrified consumers (existing + projected growth)
Electrified consumers (in nos) 77,87,675 80,89,431 84,04,677 87,34,056 90,78,240 94,37,933
Daily household consumption (in kWh) –
Urban 6.87 7.07 7.27 7.47 7.67 7.89
Projected annual consumption (in MU) E 17,455 20,484 21,870 23,355 24,946 26,652
Urban - electrification of un-electrified
consumers
Targeted annual addition (in Nos.) 2,97,209 11,88,838
Cumulative annual addition (In Nos.) 2,97,209 14,86,047 14,86,047 14,86,047 14,86,047
Projected annual consumption (in MU) F 187 1,196 2,128 2,273 2,431
Total projected domestic consumption (In
MU) G=D+E+F 35,427 46,092 57,423 66,690 72,009 77,834
3.40 3.55 3.80 4.06 4.32 4.59
6.87 7.07 7.27 7.47 7.67 7.89
0.00
2.00
4.00
6.00
8.00
10.00
FY 17 FY 18 FY 19 FY 20 FY 21 FY 22
Daily household consumption (kWh)
Rural Urban
CRISIL Infrastructure Advisory
24x7 Power for All (Uttar Pradesh) 17
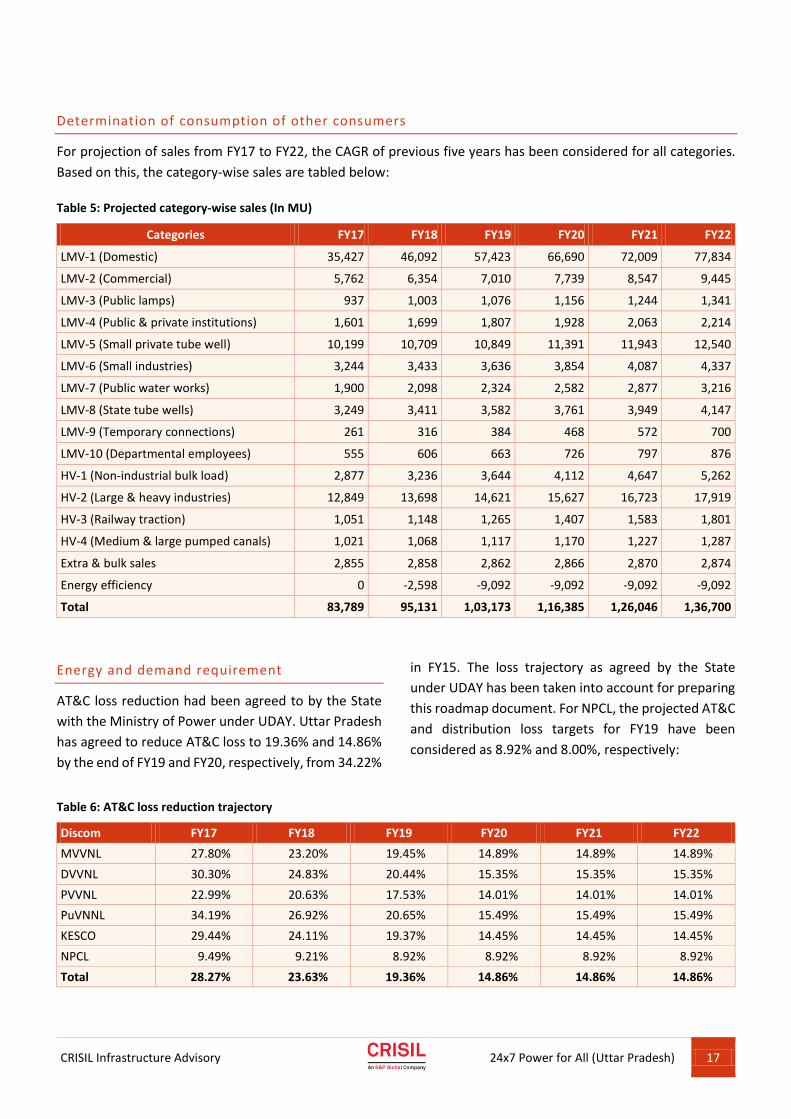
Determination of consumption of other consumers
For projection of sales from FY17 to FY22, the CAGR of previous five years has been considered for all categories.
Based on this, the category-wise sales are tabled below:
Table 5: Projected category-wise sales (In MU)
Categories FY17 FY18 FY19 FY20 FY21 FY22
LMV-1 (Domestic) 35,427 46,092 57,423 66,690 72,009 77,834
LMV-2 (Commercial) 5,762 6,354 7,010 7,739 8,547 9,445
LMV-3 (Public lamps) 937 1,003 1,076 1,156 1,244 1,341
LMV-4 (Public & private institutions) 1,601 1,699 1,807 1,928 2,063 2,214
LMV-5 (Small private tube well) 10,199 10,709 10,849 11,391 11,943 12,540
LMV-6 (Small industries) 3,244 3,433 3,636 3,854 4,087 4,337
LMV-7 (Public water works) 1,900 2,098 2,324 2,582 2,877 3,216
LMV-8 (State tube wells) 3,249 3,411 3,582 3,761 3,949 4,147
LMV-9 (Temporary connections) 261 316 384 468 572 700
LMV-10 (Departmental employees) 555 606 663 726 797 876
HV-1 (Non-industrial bulk load) 2,877 3,236 3,644 4,112 4,647 5,262
HV-2 (Large & heavy industries) 12,849 13,698 14,621 15,627 16,723 17,919
HV-3 (Railway traction) 1,051 1,148 1,265 1,407 1,583 1,801
HV-4 (Medium & large pumped canals) 1,021 1,068 1,117 1,170 1,227 1,287
Extra & bulk sales 2,855 2,858 2,862 2,866 2,870 2,874
Energy efficiency 0 -2,598 -9,092 -9,092 -9,092 -9,092
Total 83,789 95,131 1,03,173 1,16,385 1,26,046 1,36,700
Energy and demand requirement
AT&C loss reduction had been agreed to by the State
with the Ministry of Power under UDAY. Uttar Pradesh
has agreed to reduce AT&C loss to 19.36% and 14.86%
by the end of FY19 and FY20, respectively, from 34.22%
in FY15. The loss trajectory as agreed by the State
under UDAY has been taken into account for preparing
this roadmap document. For NPCL, the projected AT&C
and distribution loss targets for FY19 have been
considered as 8.92% and 8.00%, respectively:
Table 6: AT&C loss reduction trajectory
Discom FY17 FY18 FY19 FY20 FY21 FY22
MVVNL 27.80% 23.20% 19.45% 14.89% 14.89% 14.89%
DVVNL 30.30% 24.83% 20.44% 15.35% 15.35% 15.35%
PVVNL 22.99% 20.63% 17.53% 14.01% 14.01% 14.01%
PuVNNL 34.19% 26.92% 20.65% 15.49% 15.49% 15.49%
KESCO 29.44% 24.11% 19.37% 14.45% 14.45% 14.45%
NPCL 9.49% 9.21% 8.92% 8.92% 8.92% 8.92%
Total 28.27% 23.63% 19.36% 14.86% 14.86% 14.86%
CRISIL Infrastructure Advisory
24x7 Power for All (Uttar Pradesh) 18
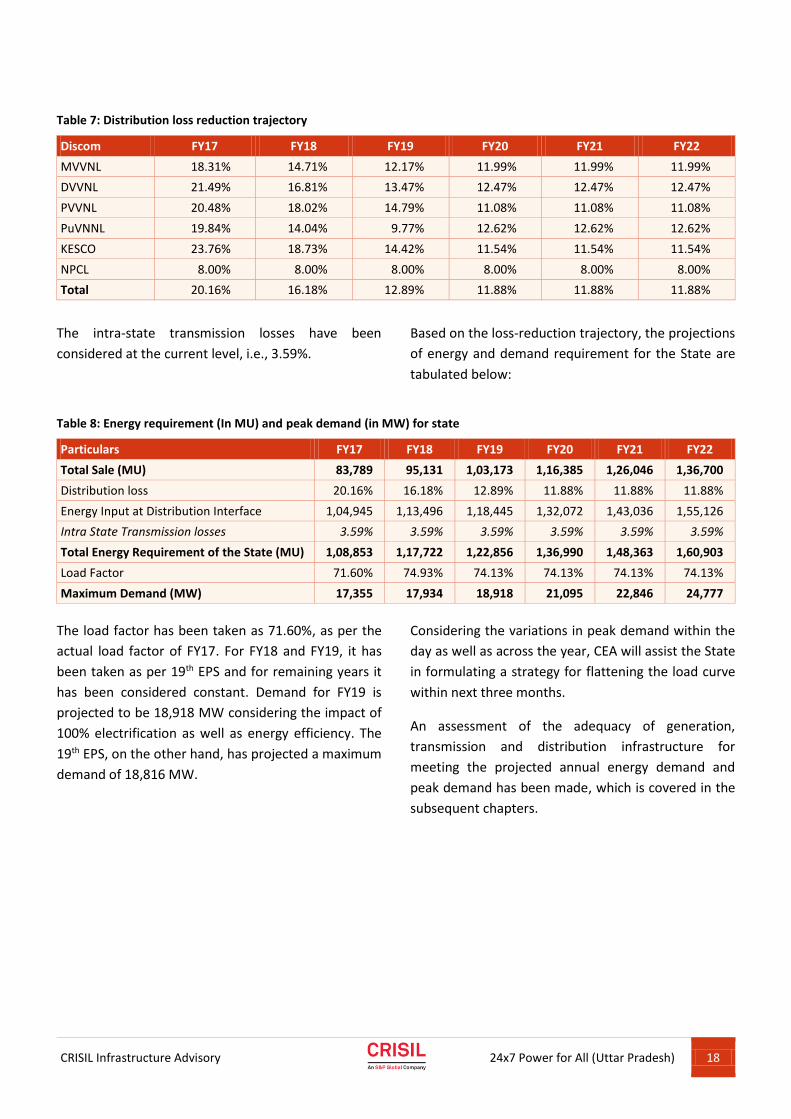
Table 7: Distribution loss reduction trajectory
Discom FY17 FY18 FY19 FY20 FY21 FY22
MVVNL 18.31% 14.71% 12.17% 11.99% 11.99% 11.99%
DVVNL 21.49% 16.81% 13.47% 12.47% 12.47% 12.47%
PVVNL 20.48% 18.02% 14.79% 11.08% 11.08% 11.08%
PuVNNL 19.84% 14.04% 9.77% 12.62% 12.62% 12.62%
KESCO 23.76% 18.73% 14.42% 11.54% 11.54% 11.54%
NPCL 8.00% 8.00% 8.00% 8.00% 8.00% 8.00%
Total 20.16% 16.18% 12.89% 11.88% 11.88% 11.88%
The intra-state transmission losses have been
considered at the current level, i.e., 3.59%.
Based on the loss-reduction trajectory, the projections
of energy and demand requirement for the State are
tabulated below:
Table 8: Energy requirement (In MU) and peak demand (in MW) for state
Particulars FY17 FY18 FY19 FY20 FY21 FY22
Total Sale (MU) 83,789 95,131 1,03,173 1,16,385 1,26,046 1,36,700
Distribution loss 20.16% 16.18% 12.89% 11.88% 11.88% 11.88%
Energy Input at Distribution Interface 1,04,945 1,13,496 1,18,445 1,32,072 1,43,036 1,55,126
Intra State Transmission losses 3.59% 3.59% 3.59% 3.59% 3.59% 3.59%
Total Energy Requirement of the State (MU) 1,08,853 1,17,722 1,22,856 1,36,990 1,48,363 1,60,903
Load Factor 71.60% 74.93% 74.13% 74.13% 74.13% 74.13%
Maximum Demand (MW) 17,355 17,934 18,918 21,095 22,846 24,777
The load factor has been taken as 71.60%, as per the
actual load factor of FY17. For FY18 and FY19, it has
been taken as per 19th EPS and for remaining years it
has been considered constant. Demand for FY19 is
projected to be 18,918 MW considering the impact of
100% electrification as well as energy efficiency. The
19th EPS, on the other hand, has projected a maximum
demand of 18,816 MW.
Considering the variations in peak demand within the
day as well as across the year, CEA will assist the State
in formulating a strategy for flattening the load curve
within next three months.
An assessment of the adequacy of generation,
transmission and distribution infrastructure for
meeting the projected annual energy demand and
peak demand has been made, which is covered in the
subsequent chapters.
CRISIL Infrastructure Advisory
24x7 Power for All (Uttar Pradesh) 19
CRISIL Infrastructure Advisory
24x7 Power for All (Uttar Pradesh) 20
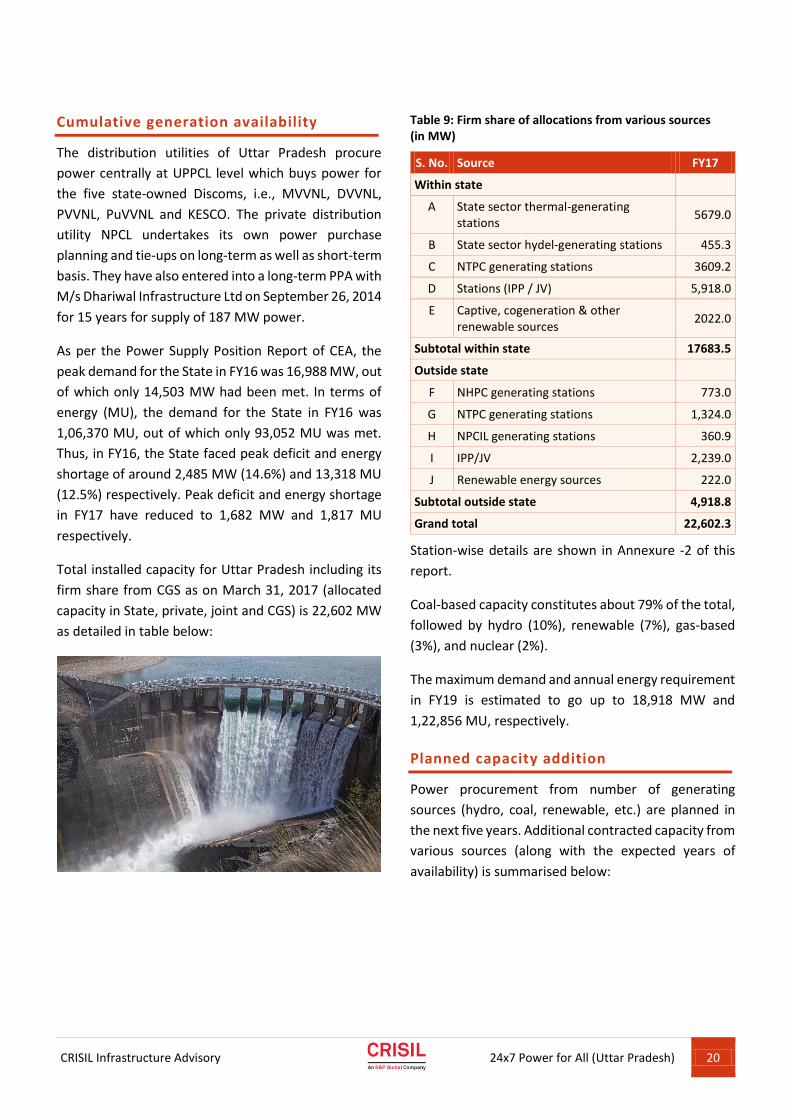
Cumulative generation availability
The distribution utilities of Uttar Pradesh procure
power centrally at UPPCL level which buys power for
the five state-owned Discoms, i.e., MVVNL, DVVNL,
PVVNL, PuVVNL and KESCO. The private distribution
utility NPCL undertakes its own power purchase
planning and tie-ups on long-term as well as short-term
basis. They have also entered into a long-term PPA with
M/s Dhariwal Infrastructure Ltd on September 26, 2014
for 15 years for supply of 187 MW power.
As per the Power Supply Position Report of CEA, the
peak demand for the State in FY16 was 16,988 MW, out
of which only 14,503 MW had been met. In terms of
energy (MU), the demand for the State in FY16 was
1,06,370 MU, out of which only 93,052 MU was met.
Thus, in FY16, the State faced peak deficit and energy
shortage of around 2,485 MW (14.6%) and 13,318 MU
(12.5%) respectively. Peak deficit and energy shortage
in FY17 have reduced to 1,682 MW and 1,817 MU
respectively.
Total installed capacity for Uttar Pradesh including its
firm share from CGS as on March 31, 2017 (allocated
capacity in State, private, joint and CGS) is 22,602 MW
as detailed in table below:
Table 9: Firm share of allocations from various sources (in MW)
S. No. Source FY17
Within state
A State sector thermal-generating stations
5679.0
B State sector hydel-generating stations 455.3
C NTPC generating stations 3609.2
D Stations (IPP / JV) 5,918.0
E Captive, cogeneration & other renewable sources
2022.0
Subtotal within state 17683.5
Outside state
F NHPC generating stations 773.0
G NTPC generating stations 1,324.0
H NPCIL generating stations 360.9
I IPP/JV 2,239.0
J Renewable energy sources 222.0
Subtotal outside state 4,918.8
Grand total 22,602.3
Station-wise details are shown in Annexure -2 of this
report.
Coal-based capacity constitutes about 79% of the total,
followed by hydro (10%), renewable (7%), gas-based
(3%), and nuclear (2%).
The maximum demand and annual energy requirement
in FY19 is estimated to go up to 18,918 MW and
1,22,856 MU, respectively.
Planned capacity addition
Power procurement from number of generating
sources (hydro, coal, renewable, etc.) are planned in
the next five years. Additional contracted capacity from
various sources (along with the expected years of
availability) is summarised below:

CRISIL Infrastructure Advisory
24x7 Power for All (Uttar Pradesh) 21
Table 10: Summary of additional capacity from various sources
Sr. no. Source Type Capacity (MW) Latest firm entitlement
Year % MW
A New stations - own & private
Meja(UPRVUNL & NTPC) Coal 1320 69% 916 FY22
Ghatampur TPP Coal 1980 64% 1275 FY22
Case I second Coal 1169 100% 1169 FY18
Bara (JP Group) Coal 1980 30% 594 FY18
Retirement Coal -210 100% -210 FY19
Subtotal Upcoming - own & private 6239 3744
B Upcoming – CGS
Visnugarh Pipal Kothi Hydro 444 37% 166 FY20
Subansiri Lower (NHPC) Hydro 2000 9% 182 FY21
Tapovan Vishnugarh Hydro 520 20% 102 FY20
Lata Tapovan HEP (NTPC) Hydro 171 20% 34 FY22
Parbati-II HEP Hydro 800 19% 155 FY19
Tanda-II Coal 1320 63% 832 FY19
Subtotal Upcoming –CGS 5255 1470
C Upcoming –State
Harduaganj Extn. St. II Coal 660 100% 660 FY20
Obra C Coal 1320 100% 1320 FY22
Jawaharpur Coal 1320 100% 1320 FY22
UPJVNL Hydro Hydro 1.5 100% 1.5 FY18
Subtotal Upcoming - State projects 3302 3302
D Upcoming renewable
Solar Renewable 2610 100% 2610 FY22
SHP Renewable 6 100% 6.0 FY19
Biomass Renewable 400 100% 400 FY19
Subtotal Upcoming renewable 3016 3016
Total Upcoming 17812 11532
Note: Currently 200 MW and 94 MW units of Obra TPS and 110 MW unit of Parichha TPS are under RM&U and 94 MW unit of Obra TPS & 60
MW of Harduaganj TPS are closed for deletion
The table below summarises the availability of power from various sources keeping in view existing and upcoming
capacity availability till FY22:
CRISIL Infrastructure Advisory
24x7 Power for All (Uttar Pradesh) 22
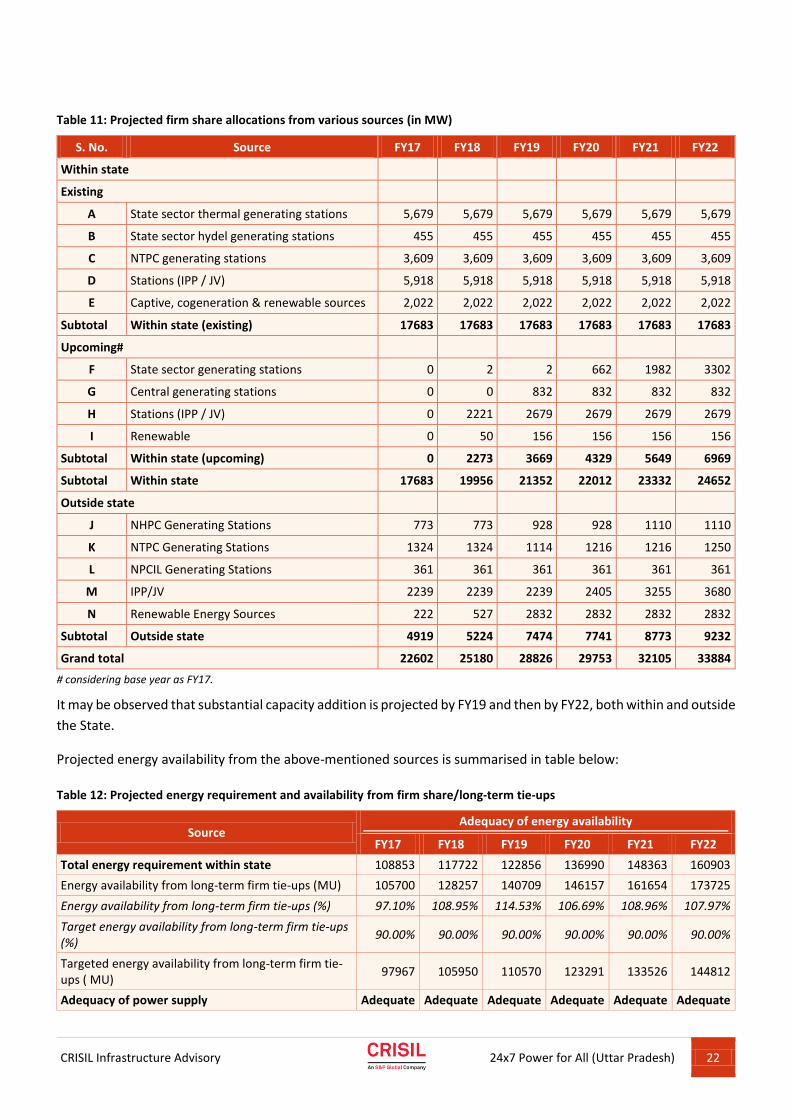
Table 11: Projected firm share allocations from various sources (in MW)
S. No. Source FY17 FY18 FY19 FY20 FY21 FY22
Within state
Existing
A State sector thermal generating stations 5,679 5,679 5,679 5,679 5,679 5,679
B State sector hydel generating stations 455 455 455 455 455 455
C NTPC generating stations 3,609 3,609 3,609 3,609 3,609 3,609
D Stations (IPP / JV) 5,918 5,918 5,918 5,918 5,918 5,918
E Captive, cogeneration & renewable sources 2,022 2,022 2,022 2,022 2,022 2,022
Subtotal Within state (existing) 17683 17683 17683 17683 17683 17683
Upcoming#
F State sector generating stations 0 2 2 662 1982 3302
G Central generating stations 0 0 832 832 832 832
H Stations (IPP / JV) 0 2221 2679 2679 2679 2679
I Renewable 0 50 156 156 156 156
Subtotal Within state (upcoming) 0 2273 3669 4329 5649 6969
Subtotal Within state 17683 19956 21352 22012 23332 24652
Outside state
J NHPC Generating Stations 773 773 928 928 1110 1110
K NTPC Generating Stations 1324 1324 1114 1216 1216 1250
L NPCIL Generating Stations 361 361 361 361 361 361
M IPP/JV 2239 2239 2239 2405 3255 3680
N Renewable Energy Sources 222 527 2832 2832 2832 2832
Subtotal Outside state 4919 5224 7474 7741 8773 9232
Grand total 22602 25180 28826 29753 32105 33884
# considering base year as FY17.
It may be observed that substantial capacity addition is projected by FY19 and then by FY22, both within and outside
the State.
Projected energy availability from the above-mentioned sources is summarised in table below:
Table 12: Projected energy requirement and availability from firm share/long-term tie-ups
Source Adequacy of energy availability
FY17 FY18 FY19 FY20 FY21 FY22
Total energy requirement within state 108853 117722 122856 136990 148363 160903
Energy availability from long-term firm tie-ups (MU) 105700 128257 140709 146157 161654 173725
Energy availability from long-term firm tie-ups (%) 97.10% 108.95% 114.53% 106.69% 108.96% 107.97%
Target energy availability from long-term firm tie-ups (%)
90.00% 90.00% 90.00% 90.00% 90.00% 90.00%
Targeted energy availability from long-term firm tie-ups ( MU)
97967 105950 110570 123291 133526 144812
Adequacy of power supply Adequate Adequate Adequate Adequate Adequate Adequate
CRISIL Infrastructure Advisory
24x7 Power for All (Uttar Pradesh) 23
While determining the adequacy of energy availability,
it is considered that existing projects would continue to
perform at the same level, whereas upcoming projects
would perform at normative levels, i.e., thermal
projects at an average PLF of 85%, hydro projects at
40%, solar at 19% and co-generation projects at 40%.
It may be seen from the above table, with considerable
capacity addition planned till FY22 along with efficiency
improvement in terms of reduced distribution losses,
the situation in the State will likely improve.
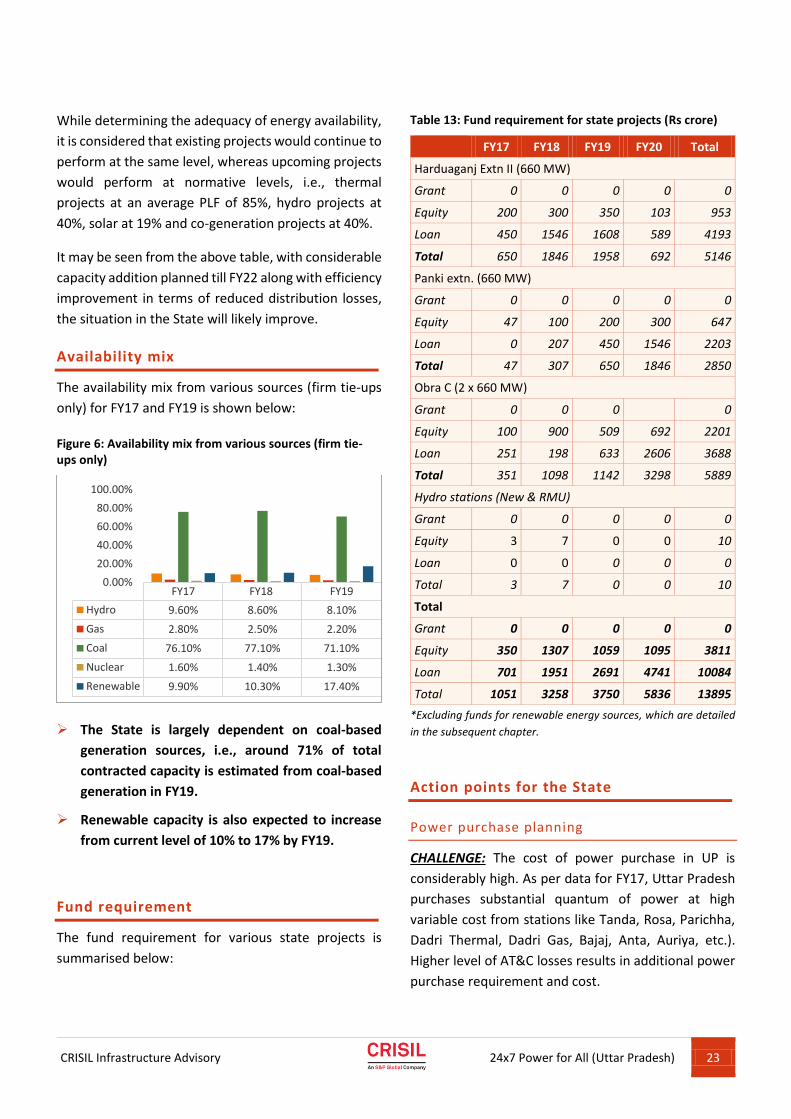
Availability mix
The availability mix from various sources (firm tie-ups
only) for FY17 and FY19 is shown below:
Figure 6: Availability mix from various sources (firm tie-ups only)
The State is largely dependent on coal-based
generation sources, i.e., around 71% of total
contracted capacity is estimated from coal-based
generation in FY19.
Renewable capacity is also expected to increase
from current level of 10% to 17% by FY19.
Fund requirement
The fund requirement for various state projects is
summarised below:
Table 13: Fund requirement for state projects (Rs crore)
FY17 FY18 FY19 FY20 Total
Harduaganj Extn II (660 MW)
Grant 0 0 0 0 0
Equity 200 300 350 103 953
Loan 450 1546 1608 589 4193
Total 650 1846 1958 692 5146
Panki extn. (660 MW)
Grant 0 0 0 0 0
Equity 47 100 200 300 647
Loan 0 207 450 1546 2203
Total 47 307 650 1846 2850
Obra C (2 x 660 MW)
Grant 0 0 0 0
Equity 100 900 509 692 2201
Loan 251 198 633 2606 3688
Total 351 1098 1142 3298 5889
Hydro stations (New & RMU)
Grant 0 0 0 0 0
Equity 3 7 0 0 10
Loan 0 0 0 0 0
Total 3 7 0 0 10
Total
Grant 0 0 0 0 0
Equity 350 1307 1059 1095 3811
Loan 701 1951 2691 4741 10084
Total 1051 3258 3750 5836 13895
*Excluding funds for renewable energy sources, which are detailed
in the subsequent chapter.
Action points for the State
Power purchase planning
CHALLENGE: The cost of power purchase in UP is
considerably high. As per data for FY17, Uttar Pradesh
purchases substantial quantum of power at high
variable cost from stations like Tanda, Rosa, Parichha,
Dadri Thermal, Dadri Gas, Bajaj, Anta, Auriya, etc.).
Higher level of AT&C losses results in additional power
purchase requirement and cost.
FY17 FY18 FY19
Hydro 9.60% 8.60% 8.10%
Gas 2.80% 2.50% 2.20%
Coal 76.10% 77.10% 71.10%
Nuclear 1.60% 1.40% 1.30%
Renewable 9.90% 10.30% 17.40%
0.00%
20.00%
40.00%
60.00%
80.00%
100.00%
CRISIL Infrastructure Advisory
24x7 Power for All (Uttar Pradesh) 24
Further, since all Discoms buy power at a centrally
pooled cost, i.e., bulk supply tariff (BST) from UPPCL,
the incremental power purchase cost is averaged
equally among all the Discoms. This results in passing
on the inefficiencies of one utility to another with no
incentive to the better-performing utilities to reduce
their losses.
It is also difficult for the State to plan peaking power
procurement efficiently.
ACTION PLAN: For enabling independent power
procurement by each of the utilities, it is important to
allocate the existing PPAs to each utility.
To efficiently manage peak and base load, it is critical
that the State has a plan for long / short-term PPAs.
Proper power procurement management would help
meet the peak/ base load in a cost-effective manner.
The State may assist towards institutionalising and
strengthening the power purchase planning and
procurement system with a dedicated cell for each
distribution utility which would work on
short/medium/long-term power purchase planning.
The Discoms may also take a considered view to
procure power, strictly as per merit order, with the
current prices in the power exchange dropping. UPPCL
may explore options to lower power purchase cost
through a mix of long-term and short-term contracts,
especially for peaking power.
Old and inefficient plants
While RM&U improves the life as well as the PLF of the
plants, new RM&U schemes may not be carried out
without a cost benefit analysis. The ongoing projects
should be completed and focus may be given on setting
up new super-critical thermal power plants or solar
power plants.
Coal swapping
Government of India has allowed flexibility of
utilisation of domestic coal among different power
plants. Coal for following stations may be allowed to
the State as well as private IPPs.
Stations Swapping details
Parichha (2x110 MW + 2 x 210 MW)
WCL to BCCL & CCL in June to Sep
Parichha (2x250 MW) BCCL (18.63 Lakh MT) to NCL
Harduaganj TPS (2 x 250 MW)
CCL (20.57 Lakh T) to NCL
Rosa TPP (4 x 300 MW) To CCL
Bajaj TPP (5 x 90 MW) To NCL
Aggregation of coal linkage for state sector
IPPS
Aggregation of linkage for different stations may be
allowed to the State’s generating stations, to save
payment of additional charges, on account of
following:
1. Commitment charges for lower offtake of coal due
to lower operational performance of old stations
2. Incentive on account of higher procurement of coal
in for super-critical stations
Coal off-take Commitment charges / incentive
<80% Commitment charges
>90% Incentive (10%)
>95% Incentive (20%)
>100% Incentive (40%)
Rationalisation of coal linkage allocation:
Exploration of coal transportation options from
different mines to power plants in a way that results in
the least transport cost. Detailed study may be carried
out to work out the actual savings.
Impact of new environmental norms:
Around 17,000 MW capacity in northern region could
get impacted by new environmental norms, of which
UP has substantial share of about 4000 MW.
A detailed plan shall be formed to shut down these
stations in phased manner, based on cost benefit
analysis.
CRISIL Infrastructure Advisory
24x7 Power for All (Uttar Pradesh) 25
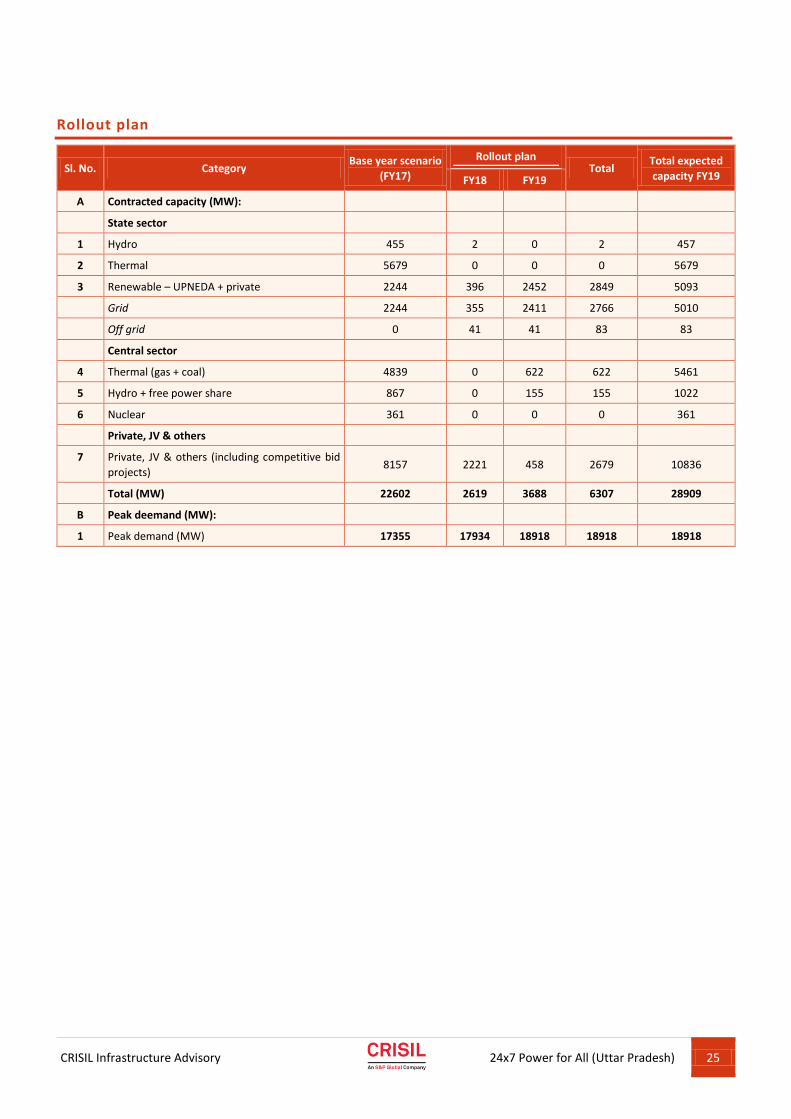
Rollout plan
Sl. No. Category Base year scenario
(FY17)
Rollout plan Total
Total expected
capacity FY19 FY18 FY19
A Contracted capacity (MW):
State sector
1 Hydro 455 2 0 2 457
2 Thermal 5679 0 0 0 5679
3 Renewable – UPNEDA + private 2244 396 2452 2849 5093
Grid 2244 355 2411 2766 5010
Off grid 0 41 41 83 83
Central sector
4 Thermal (gas + coal) 4839 0 622 622 5461
5 Hydro + free power share 867 0 155 155 1022
6 Nuclear 361 0 0 0 361
Private, JV & others
7 Private, JV & others (including competitive bid
projects) 8157 2221 458 2679 10836
Total (MW) 22602 2619 3688 6307 28909
B Peak deemand (MW):
1 Peak demand (MW) 17355 17934 18918 18918 18918

CRISIL Infrastructure Advisory
24x7 Power for All (Uttar Pradesh) 26
CRISIL Infrastructure Advisory
24x7 Power for All (Uttar Pradesh) 27
CRISIL Infrastructure Advisory
24x7 Power for All (Uttar Pradesh) 28
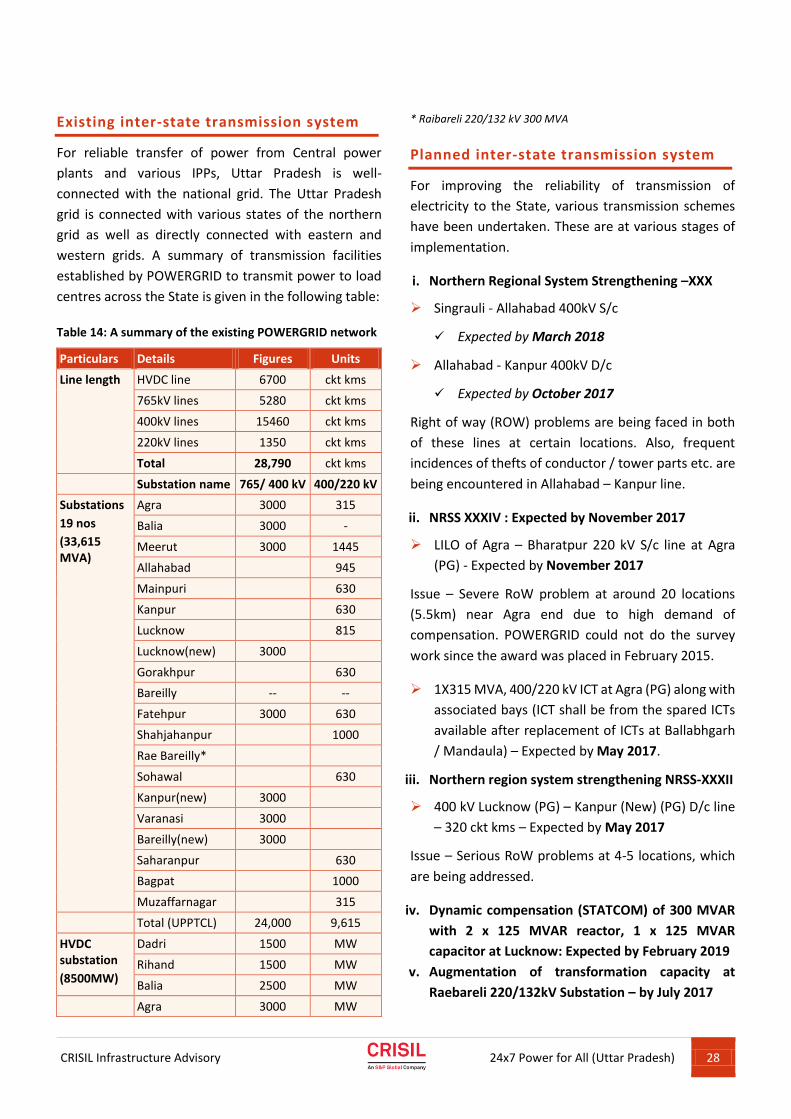
Existing inter-state transmission system
For reliable transfer of power from Central power
plants and various IPPs, Uttar Pradesh is well-
connected with the national grid. The Uttar Pradesh
grid is connected with various states of the northern
grid as well as directly connected with eastern and
western grids. A summary of transmission facilities
established by POWERGRID to transmit power to load
centres across the State is given in the following table:
Table 14: A summary of the existing POWERGRID network
Particulars Details Figures Units
Line length HVDC line 6700 ckt kms
765kV lines 5280 ckt kms
400kV lines 15460 ckt kms
220kV lines 1350 ckt kms
Total 28,790 ckt kms
Substation name 765/ 400 kV 400/220 kV
Substations
19 nos
(33,615 MVA)
Agra 3000 315
Balia 3000 -
Meerut 3000 1445
Allahabad 945
Mainpuri 630
Kanpur 630
Lucknow 815
Lucknow(new) 3000
Gorakhpur 630
Bareilly -- --
Fatehpur 3000 630
Shahjahanpur 1000
Rae Bareilly*
Sohawal 630
Kanpur(new) 3000
Varanasi 3000
Bareilly(new) 3000
Saharanpur 630
Bagpat 1000
Muzaffarnagar 315
Total (UPPTCL) 24,000 9,615
HVDC substation
(8500MW)
Dadri 1500 MW
Rihand 1500 MW
Balia 2500 MW
Agra 3000 MW
* Raibareli 220/132 kV 300 MVA
Planned inter-state transmission system
For improving the reliability of transmission of
electricity to the State, various transmission schemes
have been undertaken. These are at various stages of
implementation.
i. Northern Regional System Strengthening –XXX
Singrauli - Allahabad 400kV S/c
Expected by March 2018
Allahabad - Kanpur 400kV D/c
Expected by October 2017
Right of way (ROW) problems are being faced in both
of these lines at certain locations. Also, frequent
incidences of thefts of conductor / tower parts etc. are
being encountered in Allahabad – Kanpur line.
ii. NRSS XXXIV : Expected by November 2017
LILO of Agra – Bharatpur 220 kV S/c line at Agra
(PG) - Expected by November 2017
Issue – Severe RoW problem at around 20 locations
(5.5km) near Agra end due to high demand of
compensation. POWERGRID could not do the survey
work since the award was placed in February 2015.
1X315 MVA, 400/220 kV ICT at Agra (PG) along with
associated bays (ICT shall be from the spared ICTs
available after replacement of ICTs at Ballabhgarh
/ Mandaula) – Expected by May 2017.
iii. Northern region system strengthening NRSS-XXXII
400 kV Lucknow (PG) – Kanpur (New) (PG) D/c line
– 320 ckt kms – Expected by May 2017
Issue – Serious RoW problems at 4-5 locations, which
are being addressed.
iv. Dynamic compensation (STATCOM) of 300 MVAR
with 2 x 125 MVAR reactor, 1 x 125 MVAR
capacitor at Lucknow: Expected by February 2019
v. Augmentation of transformation capacity at
Raebareli 220/132kV Substation – by July 2017
CRISIL Infrastructure Advisory
24x7 Power for All (Uttar Pradesh) 29
Replacement of 2x100 MVA ICTs with 2x200 MVA
ICTs at Raebareilly 220/132 KV substations
vi. Augmentation of transformation capacity at
Mainpuri
1x500 MVA ICT augmentation at Mainpuri (PG)
400/220kV substation along with associated bays
and additional two 220 kV line bays – Expected by
June 2017
vii. 220kV line bays at Fatehpur (765kV)
220 KV substation Sarh of UPPTCL is likely to be
ready for commissioning/energisation by
September 2017. Hence, PGCIL is requested to
complete this work by September 2017.
viii. Northern region system strengthening NRSS –
XXXVIII
Creation of 400kV level at Aligarh (PG) by adding
2x1,500 MVA 765/400kV ICTs. Expected by March
2019, matching with TBCB line schedule.
UP interconnections with other regions
To facilitate procurement of power from the pit-head
generating stations, the State has direct connectivity
with the western region through two Gwalior–Agra
765 kV lines, and with the eastern region through 10
400 kV and three 765 kV transmission lines and HVDC
links. With the commissioning of Champa–Kurukshetra
HVDC Pole (1,500 MW), inter-regional capacity of the
northern Region from the western region is now 10,600
MW. This is likely to be enhanced to 12,600 MW with
the commissioning of another 1,500 MW Champa–
Kurukshetra HVDC capacity. This shall facilitate Uttar
Pradesh to procure power from pit head generating
stations located in western and eastern regions. In
addition to the above, the following two high-capacity
transmission corridors are under implementation:
i. Inter-regional System Strengthening Scheme for
NR and WR: April 2018
Jabalpur pooling station - Orai 765kV D/c line: (804
ckt. Km).
Orai – Aligarh 765kV D/c line (664 ckt. km)
Orai – Orai (UPPTCL) 400kV D/c (Quad) line
(76 ckm)
Issue – 400kV bays at Orai (UPPTCL) to be
constructed by UPPTCL, on deposit work basis
as per MoU signed on 06/06/2016. Work is yet
to start.
LILO of one circuit of Satna-Gwalior 765 kV D/c line
at Orai S/s (160 ckt. km)
2x1000MVA, 765/400 kV GIS substation at Orai S/s
LILO of Agra-Meerut 765 kV S/c line at Aligarh S/s
(35 ckt. km.)
765 kV switching station at Aligarh (GIS)
LILO of Kanpur – Jhatikra 765 kV S/c at Aligarh S/s
(35 ckt. km)
ii. Vindhyanchal–Varanasi 765 kV D/C (TBCB) – 450
ckm, 2019-20: to be implemented through TBCB
This work is important for relieving congestion in
the WR-NR corridor and eastern region of UP;
hence, early completion is requested.
With the commissioning of above corridors, it is
envisaged that total inter-regional capacity shall be
enhanced to about 20,000 MW.
Intra-state transmission system
UPPTCL has planned substantial strengthening of the
intra-state transmission network. While network
augmentation under the ongoing projects is at various
stages of implementation, the State has also prepared
the 13th Five-Year Plan (FYP) covering FY17 to FY22. The
following tables show the summary of: (i) year-wise
planned addition of transformation capacities at
different voltage levels; and (ii) year-wise additions in
transmission lines at different voltages until FY19.
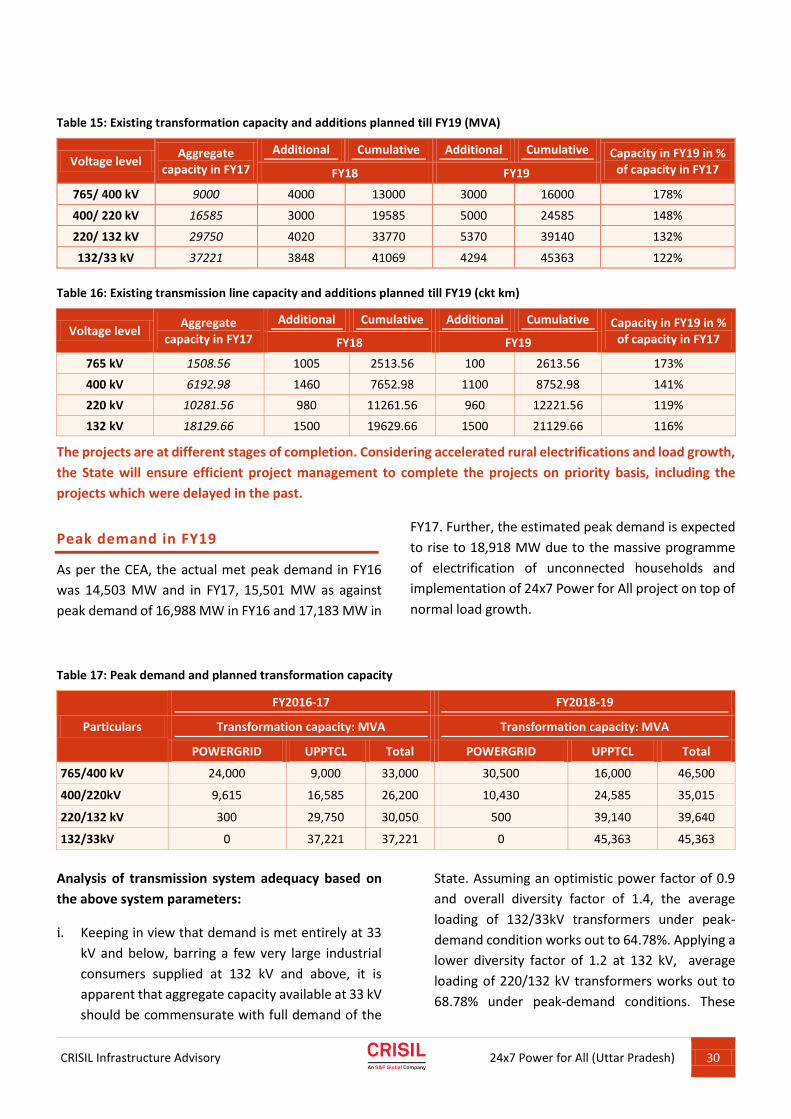
CRISIL Infrastructure Advisory
24x7 Power for All (Uttar Pradesh) 30
Table 15: Existing transformation capacity and additions planned till FY19 (MVA)
Voltage level Aggregate
capacity in FY17
Additional Cumulative Additional Cumulative Capacity in FY19 in % of capacity in FY17 FY18 FY19
765/ 400 kV 9000 4000 13000 3000 16000 178%
400/ 220 kV 16585 3000 19585 5000 24585 148%
220/ 132 kV 29750 4020 33770 5370 39140 132%
132/33 kV 37221 3848 41069 4294 45363 122%
Table 16: Existing transmission line capacity and additions planned till FY19 (ckt km)
Voltage level Aggregate
capacity in FY17
Additional Cumulative Additional Cumulative Capacity in FY19 in % of capacity in FY17 FY18 FY19
765 kV 1508.56 1005 2513.56 100 2613.56 173%
400 kV 6192.98 1460 7652.98 1100 8752.98 141%
220 kV 10281.56 980 11261.56 960 12221.56 119%
132 kV 18129.66 1500 19629.66 1500 21129.66 116%
The projects are at different stages of completion. Considering accelerated rural electrifications and load growth,
the State will ensure efficient project management to complete the projects on priority basis, including the
projects which were delayed in the past.
Peak demand in FY19
As per the CEA, the actual met peak demand in FY16
was 14,503 MW and in FY17, 15,501 MW as against
peak demand of 16,988 MW in FY16 and 17,183 MW in
FY17. Further, the estimated peak demand is expected
to rise to 18,918 MW due to the massive programme
of electrification of unconnected households and
implementation of 24x7 Power for All project on top of
normal load growth.
Table 17: Peak demand and planned transformation capacity
Particulars
FY2016-17 FY2018-19
Transformation capacity: MVA Transformation capacity: MVA
POWERGRID UPPTCL Total POWERGRID UPPTCL Total
765/400 kV 24,000 9,000 33,000 30,500 16,000 46,500
400/220kV 9,615 16,585 26,200 10,430 24,585 35,015
220/132 kV 300 29,750 30,050 500 39,140 39,640
132/33kV 0 37,221 37,221 0 45,363 45,363
Analysis of transmission system adequacy based on
the above system parameters:
i. Keeping in view that demand is met entirely at 33
kV and below, barring a few very large industrial
consumers supplied at 132 kV and above, it is
apparent that aggregate capacity available at 33 kV
should be commensurate with full demand of the
State. Assuming an optimistic power factor of 0.9
and overall diversity factor of 1.4, the average
loading of 132/33kV transformers under peak-
demand condition works out to 64.78%. Applying a
lower diversity factor of 1.2 at 132 kV, average
loading of 220/132 kV transformers works out to
68.78% under peak-demand conditions. These
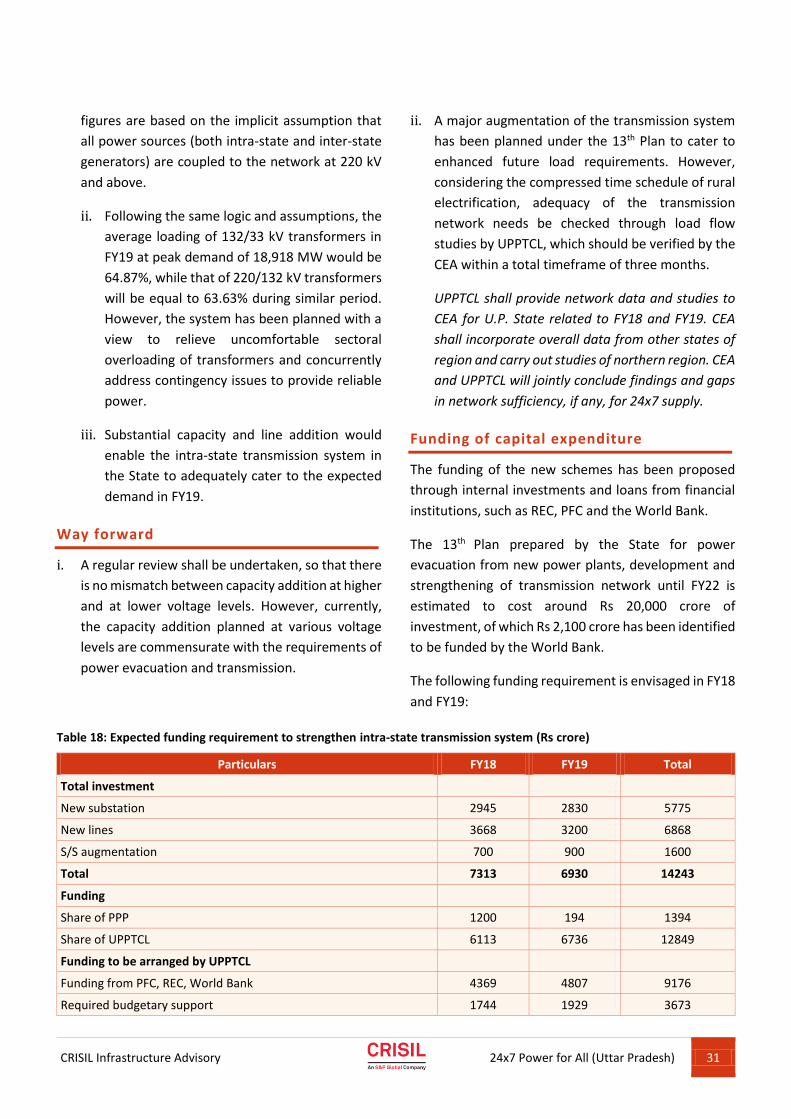
CRISIL Infrastructure Advisory
24x7 Power for All (Uttar Pradesh) 31
figures are based on the implicit assumption that
all power sources (both intra-state and inter-state
generators) are coupled to the network at 220 kV
and above.
ii. Following the same logic and assumptions, the
average loading of 132/33 kV transformers in
FY19 at peak demand of 18,918 MW would be
64.87%, while that of 220/132 kV transformers
will be equal to 63.63% during similar period.
However, the system has been planned with a
view to relieve uncomfortable sectoral
overloading of transformers and concurrently
address contingency issues to provide reliable
power.
iii. Substantial capacity and line addition would
enable the intra-state transmission system in
the State to adequately cater to the expected
demand in FY19.
Way forward
i. A regular review shall be undertaken, so that there
is no mismatch between capacity addition at higher
and at lower voltage levels. However, currently,
the capacity addition planned at various voltage
levels are commensurate with the requirements of
power evacuation and transmission.
ii. A major augmentation of the transmission system
has been planned under the 13th Plan to cater to
enhanced future load requirements. However,
considering the compressed time schedule of rural
electrification, adequacy of the transmission
network needs be checked through load flow
studies by UPPTCL, which should be verified by the
CEA within a total timeframe of three months.
UPPTCL shall provide network data and studies to
CEA for U.P. State related to FY18 and FY19. CEA
shall incorporate overall data from other states of
region and carry out studies of northern region. CEA
and UPPTCL will jointly conclude findings and gaps
in network sufficiency, if any, for 24x7 supply.
Funding of capital expenditure
The funding of the new schemes has been proposed
through internal investments and loans from financial
institutions, such as REC, PFC and the World Bank.
The 13th Plan prepared by the State for power
evacuation from new power plants, development and
strengthening of transmission network until FY22 is
estimated to cost around Rs 20,000 crore of
investment, of which Rs 2,100 crore has been identified
to be funded by the World Bank.
The following funding requirement is envisaged in FY18
and FY19:
Table 18: Expected funding requirement to strengthen intra-state transmission system (Rs crore)
Particulars FY18 FY19 Total
Total investment
New substation 2945 2830 5775
New lines 3668 3200 6868
S/S augmentation 700 900 1600
Total 7313 6930 14243
Funding
Share of PPP 1200 194 1394
Share of UPPTCL 6113 6736 12849
Funding to be arranged by UPPTCL
Funding from PFC, REC, World Bank 4369 4807 9176
Required budgetary support 1744 1929 3673
CRISIL Infrastructure Advisory
24x7 Power for All (Uttar Pradesh) 32
Action points for State Government
Congestion of substations/ lines
CHALLENGE: Currently, there is low/minimal
congestion on the transmission network, i.e., on the
substations and transmission lines. However, as peak
demand increases, the congestion level on the
transmission infrastructure is expected to rise.
ACTION PLAN: While the transmission utility, UPPTCL,
is developing new transmission infrastructure as well
as augmenting the old, it is critical at this stage to carry
out a detailed load flow study at different voltage
levels. Under this study, UPPTCL needs to monitor the
loading of lines and substations periodically to
ascertain actual growth in loading of the load centres
along with changes in consumer mix.
This will help identify the capacity addition required to
cater to growth in demand over the coming years, and
hence will enable timely planning as well as proper
investments. It will also enable UPPTCL to consider and
plan for timely augmentation of lines, which are
anticipated to be overloaded in future with high-
capacity conductors.
Integration of clean energy
CHALLENGE: With a strong focus on renewable energy,
power procurement through clean energy sources will
be higher in the future, and an integrated view is
required for grid management and stability.
ACTION PLAN: Keeping in mind the high quantum of
renewable energy to be added in the coming years, the
State needs to conduct a clean energy grid integration
study for the stability of the grid as well as for
requirement of ancillary power plants.
Further, the State will carry out the following:
The state will implement all the existing and
planned projects on time to ensure availability of
transmission system for 24x7 power supply.
UPPTCL will monitor the loading of lines and
substations on a periodic basis to ascertain actual
growth in loading of the load centres along with
changes in the consumer mix.
UPPTCL will consider and plan for timely
augmentation of lines, which are anticipated to be
overloaded in the future with high-capacity
conductors. This work of re-conductoring shall be
taken up on a sectoral-priority basis.
One set Emergency Restoration System (ERS) is
expected in April 2017, and the second set in June
2017.
Based on requirement, the State will look for
options for the construction of new lines through
tariff-based competitive bidding (TBCB) and invite
more private participation.
Considering the compressed time schedule of rural
electrification, adequacy of the transmission
network needs be checked through load flow
studies by UPPTCL, and verified by CEA within of
three months.
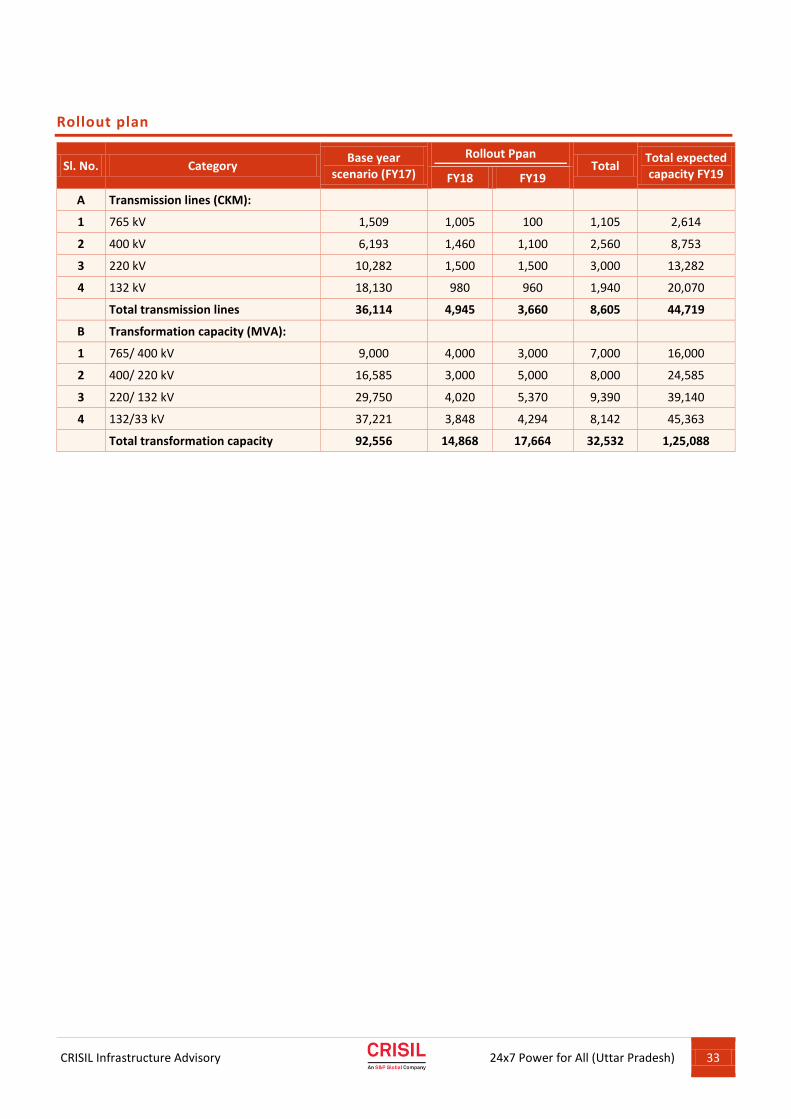
CRISIL Infrastructure Advisory
24x7 Power for All (Uttar Pradesh) 33
Rollout plan
Sl. No. Category Base year
scenario (FY17)
Rollout Ppan Total
Total expected capacity FY19 FY18 FY19
A Transmission lines (CKM):
1 765 kV 1,509 1,005 100 1,105 2,614
2 400 kV 6,193 1,460 1,100 2,560 8,753
3 220 kV 10,282 1,500 1,500 3,000 13,282
4 132 kV 18,130 980 960 1,940 20,070
Total transmission lines 36,114 4,945 3,660 8,605 44,719
B Transformation capacity (MVA):
1 765/ 400 kV 9,000 4,000 3,000 7,000 16,000
2 400/ 220 kV 16,585 3,000 5,000 8,000 24,585
3 220/ 132 kV 29,750 4,020 5,370 9,390 39,140
4 132/33 kV 37,221 3,848 4,294 8,142 45,363
Total transformation capacity 92,556 14,868 17,664 32,532 1,25,088

CRISIL Infrastructure Advisory
24x7 Power for All (Uttar Pradesh) 34
CRISIL Infrastructure Advisory
24x7 Power for All (Uttar Pradesh) 35
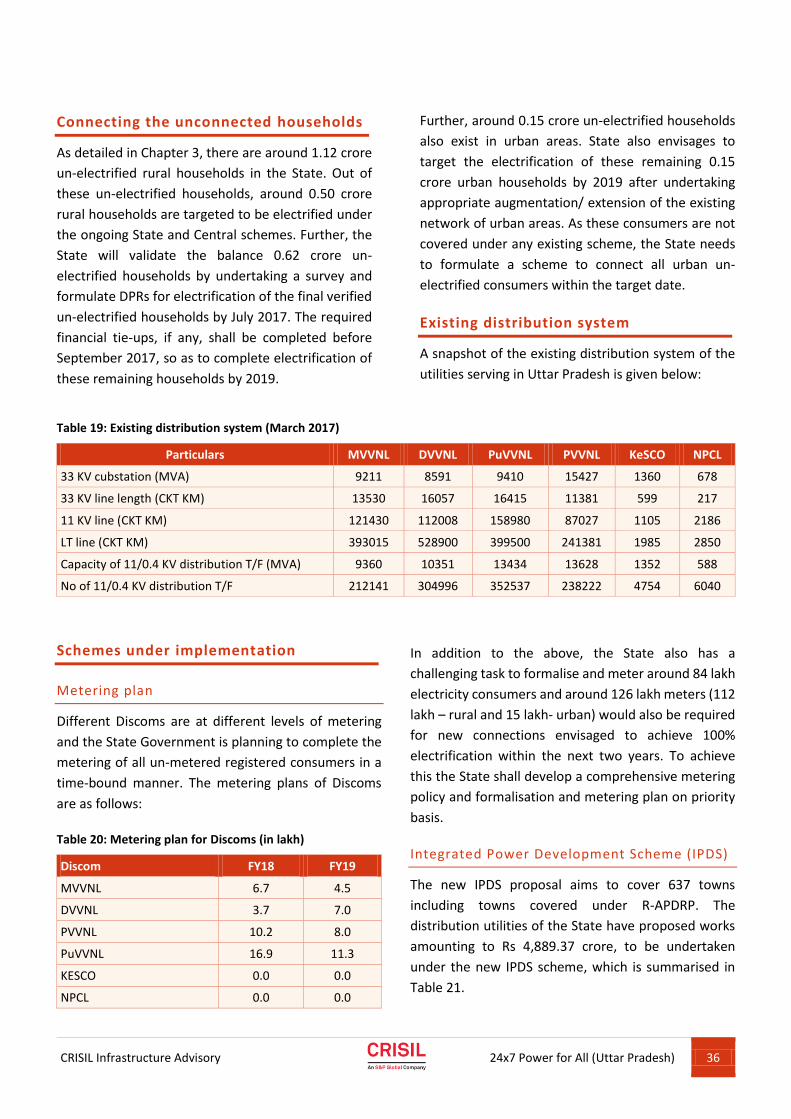
CRISIL Infrastructure Advisory
24x7 Power for All (Uttar Pradesh) 36
Connecting the unconnected households
As detailed in Chapter 3, there are around 1.12 crore
un-electrified rural households in the State. Out of
these un-electrified households, around 0.50 crore
rural households are targeted to be electrified under
the ongoing State and Central schemes. Further, the
State will validate the balance 0.62 crore un-
electrified households by undertaking a survey and
formulate DPRs for electrification of the final verified
un-electrified households by July 2017. The required
financial tie-ups, if any, shall be completed before
September 2017, so as to complete electrification of
these remaining households by 2019.
Further, around 0.15 crore un-electrified households
also exist in urban areas. State also envisages to
target the electrification of these remaining 0.15
crore urban households by 2019 after undertaking
appropriate augmentation/ extension of the existing
network of urban areas. As these consumers are not
covered under any existing scheme, the State needs
to formulate a scheme to connect all urban un-
electrified consumers within the target date.
Existing distribution system
A snapshot of the existing distribution system of the
utilities serving in Uttar Pradesh is given below:
Table 19: Existing distribution system (March 2017)
Particulars MVVNL DVVNL PuVVNL PVVNL KeSCO NPCL
33 KV cubstation (MVA) 9211 8591 9410 15427 1360 678
33 KV line length (CKT KM) 13530 16057 16415 11381 599 217
11 KV line (CKT KM) 121430 112008 158980 87027 1105 2186
LT line (CKT KM) 393015 528900 399500 241381 1985 2850
Capacity of 11/0.4 KV distribution T/F (MVA) 9360 10351 13434 13628 1352 588
No of 11/0.4 KV distribution T/F 212141 304996 352537 238222 4754 6040
Schemes under implementation
Metering plan
Different Discoms are at different levels of metering
and the State Government is planning to complete the
metering of all un-metered registered consumers in a
time-bound manner. The metering plans of Discoms
are as follows:
Table 20: Metering plan for Discoms (in lakh)
Discom FY18 FY19
MVVNL 6.7 4.5
DVVNL 3.7 7.0
PVVNL 10.2 8.0
PuVVNL 16.9 11.3
KESCO 0.0 0.0
NPCL 0.0 0.0
In addition to the above, the State also has a
challenging task to formalise and meter around 84 lakh
electricity consumers and around 126 lakh meters (112
lakh – rural and 15 lakh- urban) would also be required
for new connections envisaged to achieve 100%
electrification within the next two years. To achieve
this the State shall develop a comprehensive metering
policy and formalisation and metering plan on priority
basis.
Integrated Power Development Scheme (IPDS)
The new IPDS proposal aims to cover 637 towns
including towns covered under R-APDRP. The
distribution utilities of the State have proposed works
amounting to Rs 4,889.37 crore, to be undertaken
under the new IPDS scheme, which is summarised in
Table 21.
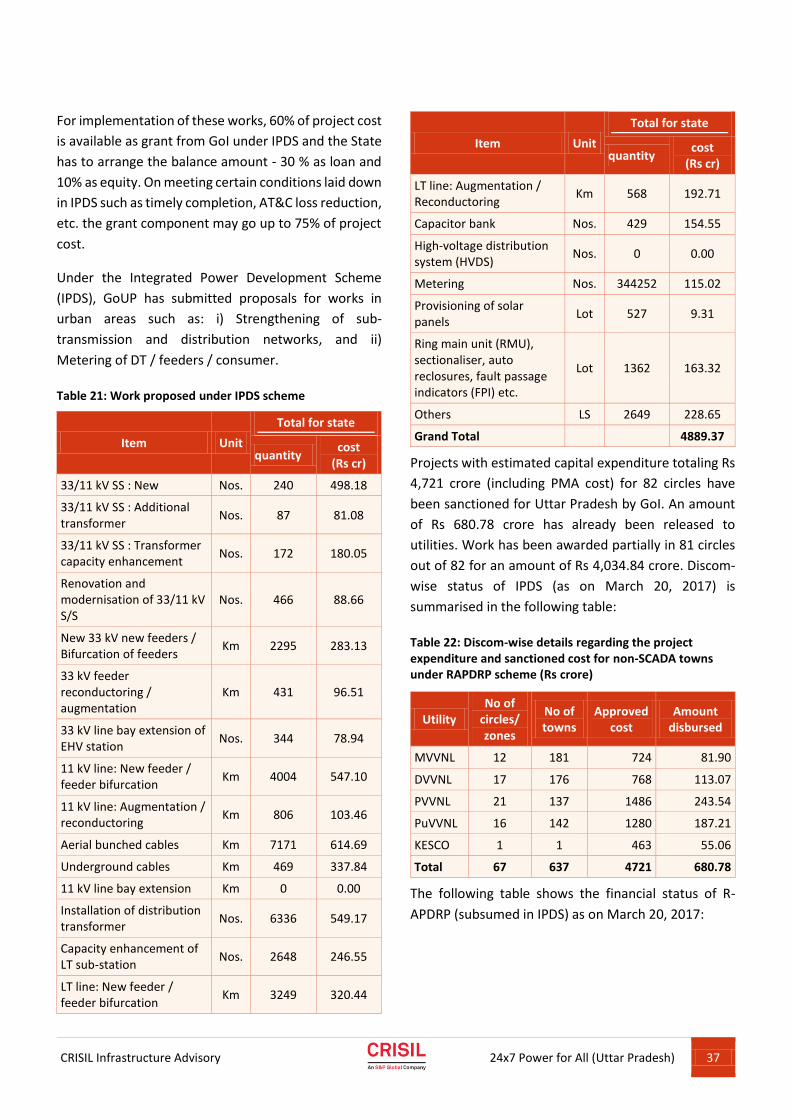
CRISIL Infrastructure Advisory
24x7 Power for All (Uttar Pradesh) 37
For implementation of these works, 60% of project cost
is available as grant from GoI under IPDS and the State
has to arrange the balance amount - 30 % as loan and
10% as equity. On meeting certain conditions laid down
in IPDS such as timely completion, AT&C loss reduction,
etc. the grant component may go up to 75% of project
cost.
Under the Integrated Power Development Scheme
(IPDS), GoUP has submitted proposals for works in
urban areas such as: i) Strengthening of sub-
transmission and distribution networks, and ii)
Metering of DT / feeders / consumer.
Table 21: Work proposed under IPDS scheme
Item Unit
Total for state
quantity cost
(Rs cr)
33/11 kV SS : New Nos. 240 498.18
33/11 kV SS : Additional transformer
Nos. 87 81.08
33/11 kV SS : Transformer capacity enhancement
Nos. 172 180.05
Renovation and modernisation of 33/11 kV S/S
Nos. 466 88.66
New 33 kV new feeders / Bifurcation of feeders
Km 2295 283.13
33 kV feeder reconductoring / augmentation
Km 431 96.51
33 kV line bay extension of EHV station
Nos. 344 78.94
11 kV line: New feeder / feeder bifurcation
Km 4004 547.10
11 kV line: Augmentation / reconductoring
Km 806 103.46
Aerial bunched cables Km 7171 614.69
Underground cables Km 469 337.84
11 kV line bay extension Km 0 0.00
Installation of distribution transformer
Nos. 6336 549.17
Capacity enhancement of LT sub-station
Nos. 2648 246.55
LT line: New feeder / feeder bifurcation
Km 3249 320.44
Item Unit
Total for state
quantity cost
(Rs cr)
LT line: Augmentation / Reconductoring
Km 568 192.71
Capacitor bank Nos. 429 154.55
High-voltage distribution system (HVDS)
Nos. 0 0.00
Metering Nos. 344252 115.02
Provisioning of solar panels
Lot 527 9.31
Ring main unit (RMU), sectionaliser, auto reclosures, fault passage indicators (FPI) etc.
Lot 1362 163.32
Others LS 2649 228.65
Grand Total 4889.37
Projects with estimated capital expenditure totaling Rs
4,721 crore (including PMA cost) for 82 circles have
been sanctioned for Uttar Pradesh by GoI. An amount
of Rs 680.78 crore has already been released to
utilities. Work has been awarded partially in 81 circles
out of 82 for an amount of Rs 4,034.84 crore. Discom-
wise status of IPDS (as on March 20, 2017) is
summarised in the following table:
Table 22: Discom-wise details regarding the project expenditure and sanctioned cost for non-SCADA towns under RAPDRP scheme (Rs crore)
Utility No of
circles/ zones
No of towns
Approved cost
Amount disbursed
MVVNL 12 181 724 81.90
DVVNL 17 176 768 113.07
PVVNL 21 137 1486 243.54
PuVVNL 16 142 1280 187.21
KESCO 1 1 463 55.06
Total 67 637 4721 680.78
The following table shows the financial status of R-
APDRP (subsumed in IPDS) as on March 20, 2017:
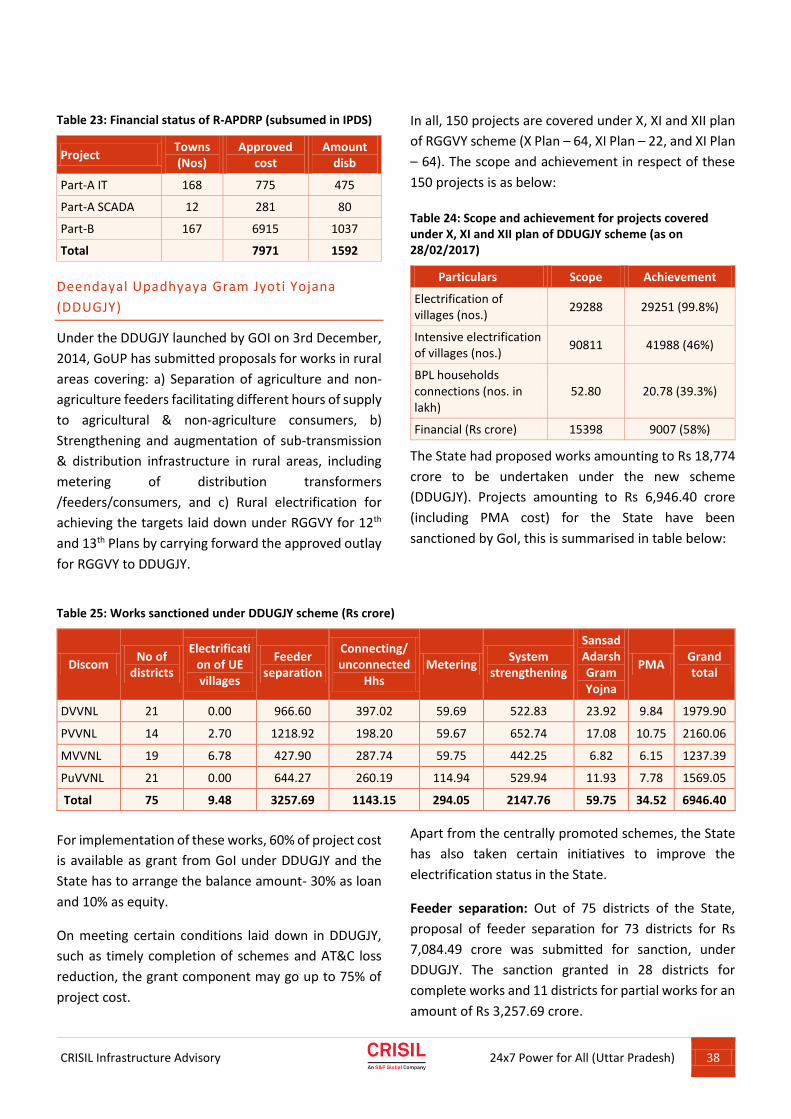
CRISIL Infrastructure Advisory
24x7 Power for All (Uttar Pradesh) 38
Table 23: Financial status of R-APDRP (subsumed in IPDS)
Project Towns (Nos)
Approved cost
Amount disb
Part-A IT 168 775 475
Part-A SCADA 12 281 80
Part-B 167 6915 1037
Total 7971 1592
Deendayal Upadhyaya Gram Jyoti Yojana
(DDUGJY)
Under the DDUGJY launched by GOI on 3rd December,
2014, GoUP has submitted proposals for works in rural
areas covering: a) Separation of agriculture and non-
agriculture feeders facilitating different hours of supply
to agricultural & non-agriculture consumers, b)
Strengthening and augmentation of sub-transmission
& distribution infrastructure in rural areas, including
metering of distribution transformers
/feeders/consumers, and c) Rural electrification for
achieving the targets laid down under RGGVY for 12th
and 13th Plans by carrying forward the approved outlay
for RGGVY to DDUGJY.
In all, 150 projects are covered under X, XI and XII plan
of RGGVY scheme (X Plan – 64, XI Plan – 22, and XI Plan
– 64). The scope and achievement in respect of these
150 projects is as below:
Table 24: Scope and achievement for projects covered under X, XI and XII plan of DDUGJY scheme (as on 28/02/2017)
Particulars Scope Achievement
Electrification of villages (nos.)
29288 29251 (99.8%)
Intensive electrification of villages (nos.)
90811 41988 (46%)
BPL households connections (nos. in lakh)
52.80 20.78 (39.3%)
Financial (Rs crore) 15398 9007 (58%)
The State had proposed works amounting to Rs 18,774
crore to be undertaken under the new scheme
(DDUGJY). Projects amounting to Rs 6,946.40 crore
(including PMA cost) for the State have been
sanctioned by GoI, this is summarised in table below:
Table 25: Works sanctioned under DDUGJY scheme (Rs crore)
Discom No of
districts
Electrification of UE villages
Feeder separation
Connecting/ unconnected
Hhs Metering
System strengthening
Sansad Adarsh Gram Yojna
PMA Grand total
DVVNL 21 0.00 966.60 397.02 59.69 522.83 23.92 9.84 1979.90
PVVNL 14 2.70 1218.92 198.20 59.67 652.74 17.08 10.75 2160.06
MVVNL 19 6.78 427.90 287.74 59.75 442.25 6.82 6.15 1237.39
PuVVNL 21 0.00 644.27 260.19 114.94 529.94 11.93 7.78 1569.05
Total 75 9.48 3257.69 1143.15 294.05 2147.76 59.75 34.52 6946.40
For implementation of these works, 60% of project cost
is available as grant from GoI under DDUGJY and the
State has to arrange the balance amount- 30% as loan
and 10% as equity.
On meeting certain conditions laid down in DDUGJY,
such as timely completion of schemes and AT&C loss
reduction, the grant component may go up to 75% of
project cost.
Apart from the centrally promoted schemes, the State
has also taken certain initiatives to improve the
electrification status in the State.
Feeder separation: Out of 75 districts of the State,
proposal of feeder separation for 73 districts for Rs
7,084.49 crore was submitted for sanction, under
DDUGJY. The sanction granted in 28 districts for
complete works and 11 districts for partial works for an
amount of Rs 3,257.69 crore.
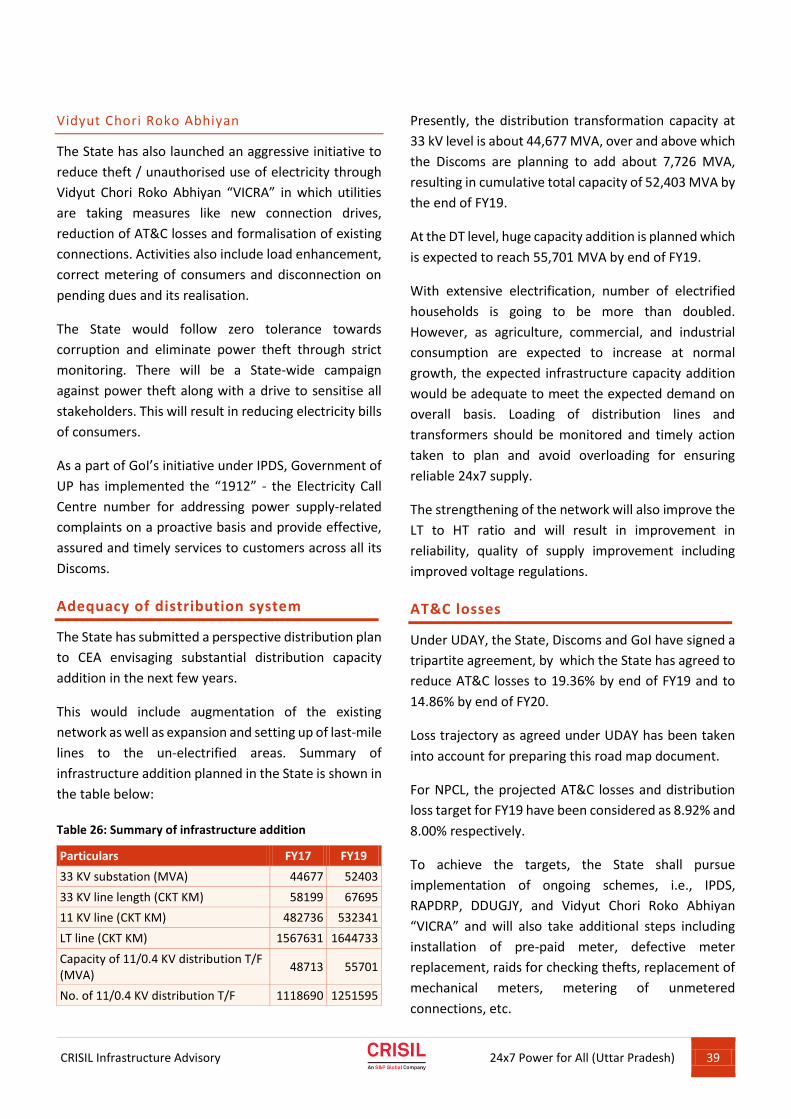
CRISIL Infrastructure Advisory
24x7 Power for All (Uttar Pradesh) 39
Vidyut Chori Roko Abhiyan
The State has also launched an aggressive initiative to
reduce theft / unauthorised use of electricity through
Vidyut Chori Roko Abhiyan “VICRA” in which utilities
are taking measures like new connection drives,
reduction of AT&C losses and formalisation of existing
connections. Activities also include load enhancement,
correct metering of consumers and disconnection on
pending dues and its realisation.
The State would follow zero tolerance towards
corruption and eliminate power theft through strict
monitoring. There will be a State-wide campaign
against power theft along with a drive to sensitise all
stakeholders. This will result in reducing electricity bills
of consumers.
As a part of GoI’s initiative under IPDS, Government of
UP has implemented the “1912” - the Electricity Call
Centre number for addressing power supply-related
complaints on a proactive basis and provide effective,
assured and timely services to customers across all its
Discoms.
Adequacy of distribution system
The State has submitted a perspective distribution plan
to CEA envisaging substantial distribution capacity
addition in the next few years.
This would include augmentation of the existing
network as well as expansion and setting up of last-mile
lines to the un-electrified areas. Summary of
infrastructure addition planned in the State is shown in
the table below:
Table 26: Summary of infrastructure addition
Particulars FY17 FY19
33 KV substation (MVA) 44677 52403
33 KV line length (CKT KM) 58199 67695
11 KV line (CKT KM) 482736 532341
LT line (CKT KM) 1567631 1644733
Capacity of 11/0.4 KV distribution T/F (MVA)
48713 55701
No. of 11/0.4 KV distribution T/F 1118690 1251595
Presently, the distribution transformation capacity at
33 kV level is about 44,677 MVA, over and above which
the Discoms are planning to add about 7,726 MVA,
resulting in cumulative total capacity of 52,403 MVA by
the end of FY19.
At the DT level, huge capacity addition is planned which
is expected to reach 55,701 MVA by end of FY19.
With extensive electrification, number of electrified
households is going to be more than doubled.
However, as agriculture, commercial, and industrial
consumption are expected to increase at normal
growth, the expected infrastructure capacity addition
would be adequate to meet the expected demand on
overall basis. Loading of distribution lines and
transformers should be monitored and timely action
taken to plan and avoid overloading for ensuring
reliable 24x7 supply.
The strengthening of the network will also improve the
LT to HT ratio and will result in improvement in
reliability, quality of supply improvement including
improved voltage regulations.
AT&C losses
Under UDAY, the State, Discoms and GoI have signed a
tripartite agreement, by which the State has agreed to
reduce AT&C losses to 19.36% by end of FY19 and to
14.86% by end of FY20.
Loss trajectory as agreed under UDAY has been taken
into account for preparing this road map document.
For NPCL, the projected AT&C losses and distribution
loss target for FY19 have been considered as 8.92% and
8.00% respectively.
To achieve the targets, the State shall pursue
implementation of ongoing schemes, i.e., IPDS,
RAPDRP, DDUGJY, and Vidyut Chori Roko Abhiyan
“VICRA” and will also take additional steps including
installation of pre-paid meter, defective meter
replacement, raids for checking thefts, replacement of
mechanical meters, metering of unmetered
connections, etc.
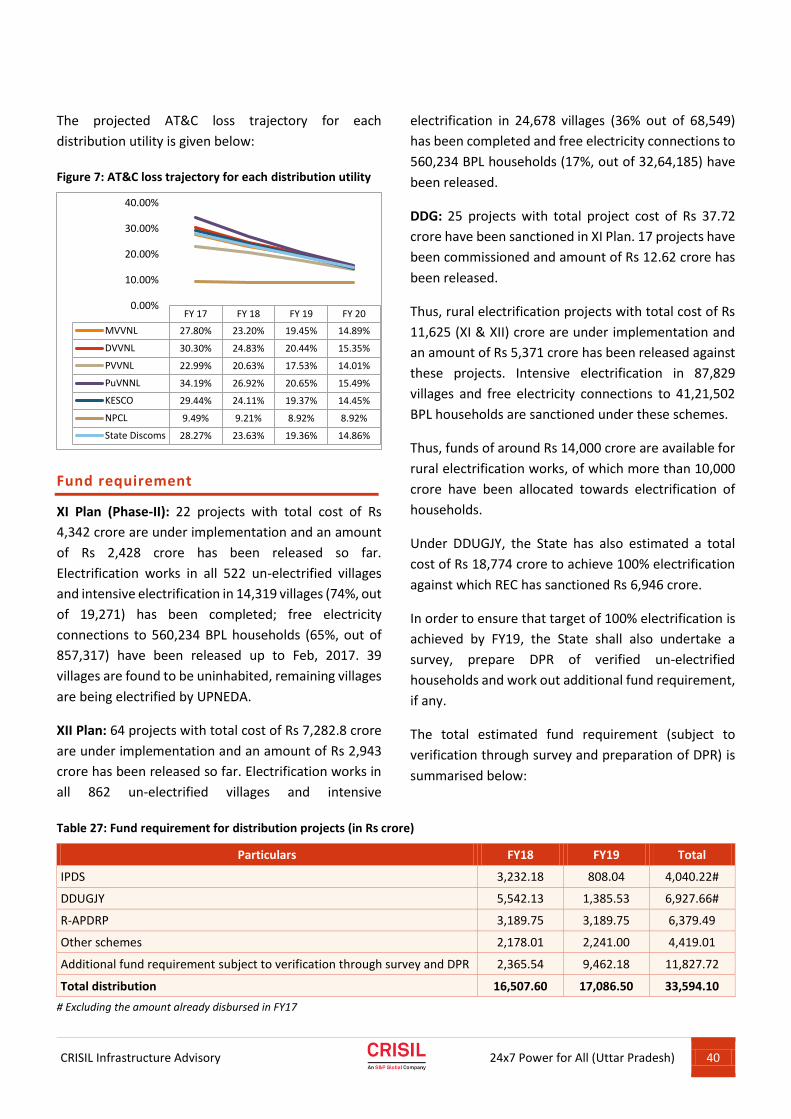
CRISIL Infrastructure Advisory
24x7 Power for All (Uttar Pradesh) 40
The projected AT&C loss trajectory for each
distribution utility is given below:
Figure 7: AT&C loss trajectory for each distribution utility
Fund requirement
XI Plan (Phase-II): 22 projects with total cost of Rs
4,342 crore are under implementation and an amount
of Rs 2,428 crore has been released so far.
Electrification works in all 522 un-electrified villages
and intensive electrification in 14,319 villages (74%, out
of 19,271) has been completed; free electricity
connections to 560,234 BPL households (65%, out of
857,317) have been released up to Feb, 2017. 39
villages are found to be uninhabited, remaining villages
are being electrified by UPNEDA.
XII Plan: 64 projects with total cost of Rs 7,282.8 crore
are under implementation and an amount of Rs 2,943
crore has been released so far. Electrification works in
all 862 un-electrified villages and intensive
electrification in 24,678 villages (36% out of 68,549)
has been completed and free electricity connections to
560,234 BPL households (17%, out of 32,64,185) have
been released.
DDG: 25 projects with total project cost of Rs 37.72
crore have been sanctioned in XI Plan. 17 projects have
been commissioned and amount of Rs 12.62 crore has
been released.
Thus, rural electrification projects with total cost of Rs
11,625 (XI & XII) crore are under implementation and
an amount of Rs 5,371 crore has been released against
these projects. Intensive electrification in 87,829
villages and free electricity connections to 41,21,502
BPL households are sanctioned under these schemes.
Thus, funds of around Rs 14,000 crore are available for
rural electrification works, of which more than 10,000
crore have been allocated towards electrification of
households.
Under DDUGJY, the State has also estimated a total
cost of Rs 18,774 crore to achieve 100% electrification
against which REC has sanctioned Rs 6,946 crore.
In order to ensure that target of 100% electrification is
achieved by FY19, the State shall also undertake a
survey, prepare DPR of verified un-electrified
households and work out additional fund requirement,
if any.
The total estimated fund requirement (subject to
verification through survey and preparation of DPR) is
summarised below:
Table 27: Fund requirement for distribution projects (in Rs crore)
Particulars FY18 FY19 Total
IPDS 3,232.18 808.04 4,040.22#
DDUGJY 5,542.13 1,385.53 6,927.66#
R-APDRP 3,189.75 3,189.75 6,379.49
Other schemes 2,178.01 2,241.00 4,419.01
Additional fund requirement subject to verification through survey and DPR 2,365.54 9,462.18 11,827.72
Total distribution 16,507.60 17,086.50 33,594.10
# Excluding the amount already disbursed in FY17
FY 17 FY 18 FY 19 FY 20
MVVNL 27.80% 23.20% 19.45% 14.89%
DVVNL 30.30% 24.83% 20.44% 15.35%
PVVNL 22.99% 20.63% 17.53% 14.01%
PuVNNL 34.19% 26.92% 20.65% 15.49%
KESCO 29.44% 24.11% 19.37% 14.45%
NPCL 9.49% 9.21% 8.92% 8.92%
State Discoms 28.27% 23.63% 19.36% 14.86%
0.00%
10.00%
20.00%
30.00%
40.00%
CRISIL Infrastructure Advisory
24x7 Power for All (Uttar Pradesh) 41
Mitigation of issue of reliability and low
voltage
Distribution companies with the existing network are
unable to deliver reliable and quality power supply due
to old, aged and inadequate systems. Consumers are
facing low-voltage problems due to longer LT lines, high
LT: HT ratio of lines, over-loading DTs and non-
availability capacitor banks at power substations and
also at consumers’ premises. As per Discoms, about 1.4
lakhs DTs in various areas are over-loaded; this is also
affecting the reliability of power supply to the
consumers.
Discoms /GoUP are considering following measures
and options:
Installation of new DTs in load centres, extension
of HT lines and installation of HVDS will improve
LT:HT ratio.
Improvement in LT to HT ratio will help in
increasing the reliability of the system, improve
quality of supply as well as reduce the technical
losses.
The status of the LT to HT ratio of line length in
FY17 and in FY19 is as per table below:
LT/HT ratio
2017 2019
State 3.25 3.09
MVVNL 3.24 3.27
DVVNL 4.72 4.71
PVVNL 2.77 2.45
PuVVNL 2.51 2.33
KESCO 1.80 1.81
NPCL 1.30 1.39
It may be noted that there is an improvement in
LT/HT ratio; however, considering the good
industry practice, the ratio needs to improve
further to 1:1 in the long term for a more reliable
system.
Expediting the ongoing works of installation of new
DTs and augmentation of existing DTs under IPDS,
DDUGJY and State plans.Installation of automatic
capacitor banks at identified power substations to
improve voltage regulation and also enforce
installation of capacitor banks in eligible consumer
categories
Discom Transformer Capacitor bank
Nos MVAr
MVVNL 5 MVA 594 1.98
10 MVA 158 3.96
DVVNL 5 MVA 777 1.98
10 MVA 316 3.96
PVVNL 5 MVA 226 1.98
10 MVA 79 3.96
PuVVNL 5 MVA 786 1.98
10 MVA 291 3.96
KESCO 5 MVA 25 1.98
10 MVA 50 3.96
Consider implementation of system automation
and improve reliability with the introduction of
system components, such as ring main units,
sectionalised appropriately
Measures for improving consumer
convenience
UPERC REGULATIONS
UPERC has issued Regulations “Standard of
Performance (SOP) 2005.” It covers the norms related
to performance of Discoms for providing services to
consumers. The SOP 2005 is under revision by UPERC.
Many consumer-friendly measures are likely to come
up, as the effort of UP Government in revised SOP such
as consumer own choice meters, enforcement
activities, and reliable power supply (24X7).
Initiatives taken by GoUP
Settlement scheme
In order to resolve long-pending consumer grievances
and disputes, Government asked the Discoms to launch
a settlement scheme in public interest. The
CRISIL Infrastructure Advisory
24x7 Power for All (Uttar Pradesh) 42
opportunity was given to all consumers to come to the
mainstream by settling their cases.
Time of the day metering: Efforts are being made in
consultation with UPERC to implement time of the day
metering for all consumers, to contain consumption
during peak hours, in order to flatten the load curve of
Discoms.
Measures taken by Discoms
Minimised load-shedding:
This year, Discoms were able to contain load-shedding
to only fraction of the total consumption, to the relief
of the people of UP.
Suggested measures to facilitate
household electrification
Following are the suggested measures to facilitate
release of connections to rural households:
States / Discoms should create awareness amongst
public at large of uses of electricity, cost of
accessing, cost of using electricity vis-à-vis cost
being incurred on energy from alternative sources,
including both direct & indirect costs, billing
process, bill payments, immediate benefits of use,
both tangible and intangible (quality of life, health,
education, security, etc.), future prospects in
income generation, employment, etc. This may be
done by reaching out to them door-to-door with
correct information and motivating them to obtain
electricity connections.
States / DISCOMs should take up extensive drive to
curb the anti-social activity of theft of electricity
and formalise connections where infrastructure is
created, to bring them on ledgers of Discoms. Stern
action against the culprits, including the Discom
staff, if found colluding, is imperative.
States / Discoms to focus on quality, reliability, and
timings of power supply in rural areas. This is
essential to create willingness amongst prospective
consumers to obtain electricity connection.
Rationalising cost of connection, particularly for
households and allowing payment in installments
Rationalising the tariff design to be in line with
Tariff Policy 2016
100% metering at all levels (consumers/DTs/
feeders) to facilitate energy audit and extensive
use of technology to improve efficiency and
facilitate near real-time monitoring and
interventions, to reduce AT&C losses.
Action points for State Government
Unelectrified consumers
CHALLENGE: Uttar Pradesh has a large number of un-
electrified households. Last-mile connectivity is
difficult due to the households being far-flung.
ACTION PLAN: A key step towards achieving complete
electrification in the State would require a baseline
database of the exact number and location of un-
electrified households. A survey would be required to
establish this database. Additionally, the survey will
also help in establishing the number of
unmetered/illegal connections.
Unmetered consumption of electricity
CHALLENGE: There is a large proportion of electrified
domestic registered consumers who haven’t installed
meters. As per FY17 data, unmetered domestic
consumers account for ~40% (68 lakh) of total domestic
registered consumers. In addition to the above, State
also has a challenging task to formalise and meter
around 84 lakh electricity connections where
infrastructure is created. Around 126 lakh meters (112
lakh – Rural and 15 lakh- Urban) would also be required
for new connections envisaged, to achieve 100%
electrification within next two years.
ACTION PLAN: Unmetered consumption is one of the
reasons behind high loss levels in the State and hence
it is of utmost importance that the State takes urgent
action. Some of the key steps which need to be taken
are:
CRISIL Infrastructure Advisory
24x7 Power for All (Uttar Pradesh) 43
1. Policy for metering: The survey as mentioned
above will establish the baseline data. The next
step is to roll out a metering policy/ guidelines to
convert the unmetered consumers to metered
ones. The policy may include a mechanism to
incentivise the unmetered consumers going for
meter installation within a well-defined timeline
and penalty the unmetered consumers.
Opportunity should be given to those with illegal
connections to convert them to legal connections
through an amnesty scheme/ waiver of interest
dues and option of paying the principal by
reasonable EMIs.
2. Metering the unmetered consumers: The final step
is the implementation phase wherein meters shall
be installed in a time-bound phased manner for all
the households.
High loss levels
CHALLENGE: There are high AT&C losses due to poor
repair & maintenance of equipment, theft, pilferage
and meter tampering. etc.
ACTION PLAN: The following key steps may be adopted
to reduce the high loss levels –
1. Energy audit: Extensive energy audit by an external
agency be undertaken at each district level
2. Feeder Separation: Feeder segregation work may
be carried out aggressively.
3. Metering the unmetered consumers:
Unmetered/illegal connections need to be
metered to reduce the loss levels as discussed
above.
4. Feeder managers - Further the losses can be
contained by appointing feeder managers, thereby
making employees accountable for losses and
failure of network.
Peak management
CHALLENGE: In Uttar Pradesh, there is considerable
variation in off-peak and peak demand which needs to
be addressed.
ACTION PLAN: Considering the variations in peak
demand within the day as well as across the year, CEA
will assist the State in formulating a strategy for
flattening the load curve within next three months.
Quality of supply
CHALLENGE: Considering that UP is one of the biggest
states in India in terms of area as well as population,
providing quality supply is a key issue.
As more households get electrified it would become
difficult to manage the supply as well as the associated
consumer data.
ACTION PLAN: Various initiatives such as URJA MITRA
will enable quality supply to the consumers.
While these measures will improve the quality of data,
a detailed study on the feasibility of these measures
should be conducted before implementing them.
Delay in implementation
CHALLENGE: There are delays in implementation of
electrification works and other related utility projects.
ACTION PLAN: Some key steps to be undertaken for
faster implementation of projects on the ground level
are -
1. Project management unit: A project management
unit may be created which will control various
aspects of project execution and ensure timely and
quality delivery of the projects.
2. New contractors: The state may look at hiring new
contractors and conducting workshops to enable
them to implement projects in a faster and
transparent manner.
Additionally, the following actions points may be
carried out-
Free electricity connection will be given to urban
and rural BPL households and APL households will
be given 100% financing options at reasonable
EMIs to avail of new connections.
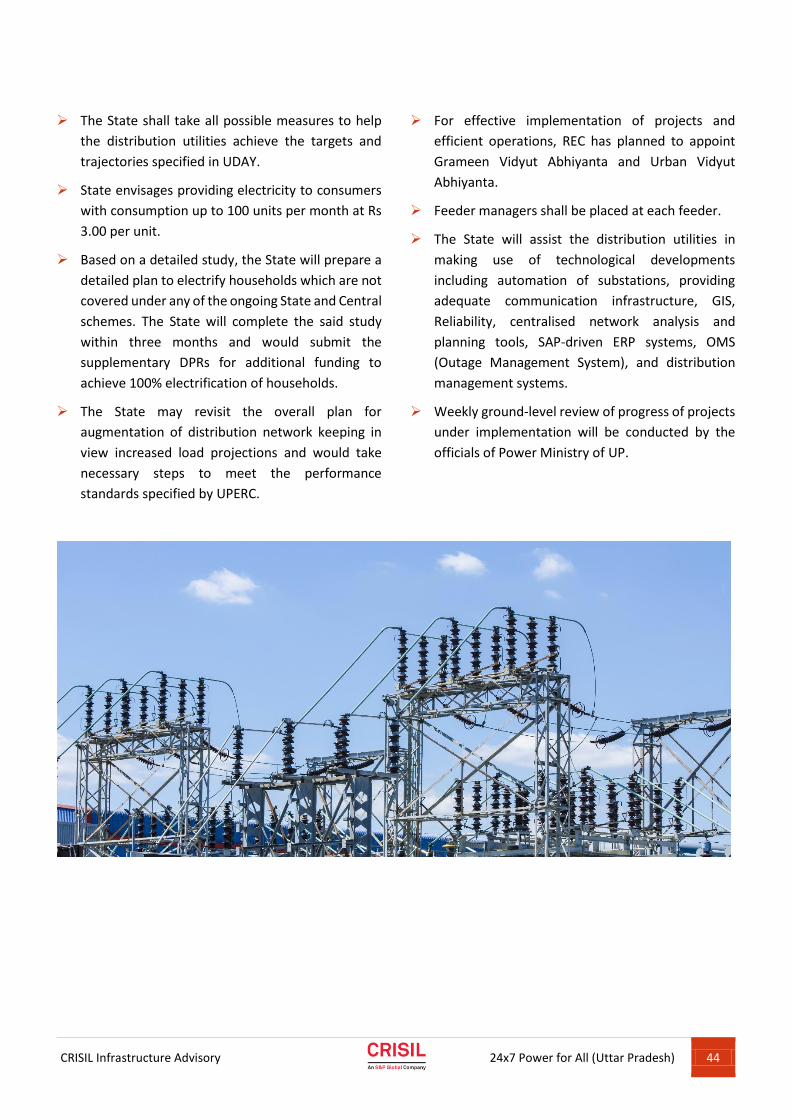
CRISIL Infrastructure Advisory
24x7 Power for All (Uttar Pradesh) 44
The State shall take all possible measures to help
the distribution utilities achieve the targets and
trajectories specified in UDAY.
State envisages providing electricity to consumers
with consumption up to 100 units per month at Rs
3.00 per unit.
Based on a detailed study, the State will prepare a
detailed plan to electrify households which are not
covered under any of the ongoing State and Central
schemes. The State will complete the said study
within three months and would submit the
supplementary DPRs for additional funding to
achieve 100% electrification of households.
The State may revisit the overall plan for
augmentation of distribution network keeping in
view increased load projections and would take
necessary steps to meet the performance
standards specified by UPERC.
For effective implementation of projects and
efficient operations, REC has planned to appoint
Grameen Vidyut Abhiyanta and Urban Vidyut
Abhiyanta.
Feeder managers shall be placed at each feeder.
The State will assist the distribution utilities in
making use of technological developments
including automation of substations, providing
adequate communication infrastructure, GIS,
Reliability, centralised network analysis and
planning tools, SAP-driven ERP systems, OMS
(Outage Management System), and distribution
management systems.
Weekly ground-level review of progress of projects
under implementation will be conducted by the
officials of Power Ministry of UP.
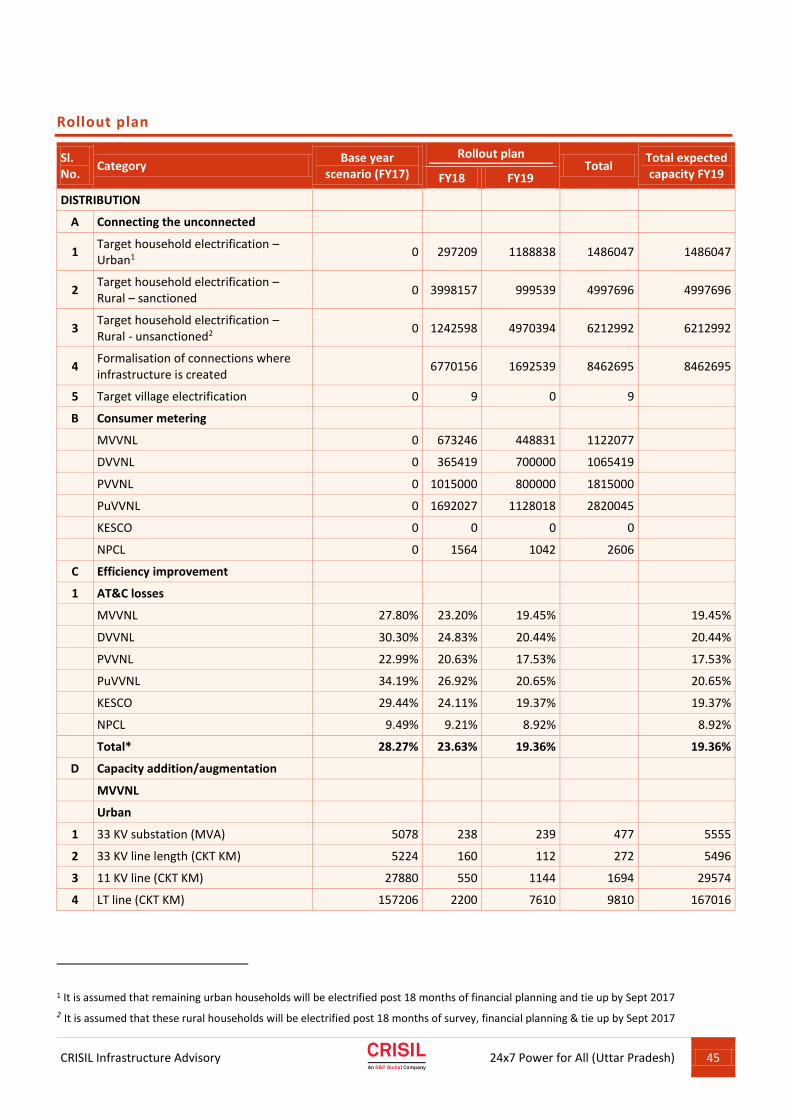
CRISIL Infrastructure Advisory
24x7 Power for All (Uttar Pradesh) 45
Rollout plan
Sl. No.
Category Base year
scenario (FY17)
Rollout plan Total
Total expected capacity FY19 FY18 FY19
DISTRIBUTION
A Connecting the unconnected
1 Target household electrification – Urban1
0 297209 1188838 1486047 1486047
2 Target household electrification – Rural – sanctioned
0 3998157 999539 4997696 4997696
3 Target household electrification – Rural - unsanctioned2
0 1242598 4970394 6212992 6212992
4 Formalisation of connections where infrastructure is created
6770156 1692539 8462695 8462695
5 Target village electrification 0 9 0 9
B Consumer metering
MVVNL 0 673246 448831 1122077
DVVNL 0 365419 700000 1065419
PVVNL 0 1015000 800000 1815000
PuVVNL 0 1692027 1128018 2820045
KESCO 0 0 0 0
NPCL 0 1564 1042 2606
C Efficiency improvement
1 AT&C losses
MVVNL 27.80% 23.20% 19.45% 19.45%
DVVNL 30.30% 24.83% 20.44% 20.44%
PVVNL 22.99% 20.63% 17.53% 17.53%
PuVVNL 34.19% 26.92% 20.65% 20.65%
KESCO 29.44% 24.11% 19.37% 19.37%
NPCL 9.49% 9.21% 8.92% 8.92%
Total* 28.27% 23.63% 19.36% 19.36%
D Capacity addition/augmentation
MVVNL
Urban
1 33 KV substation (MVA) 5078 238 239 477 5555
2 33 KV line length (CKT KM) 5224 160 112 272 5496
3 11 KV line (CKT KM) 27880 550 1144 1694 29574
4 LT line (CKT KM) 157206 2200 7610 9810 167016
1 It is assumed that remaining urban households will be electrified post 18 months of financial planning and tie up by Sept 2017
2 It is assumed that these rural households will be electrified post 18 months of survey, financial planning & tie up by Sept 2017
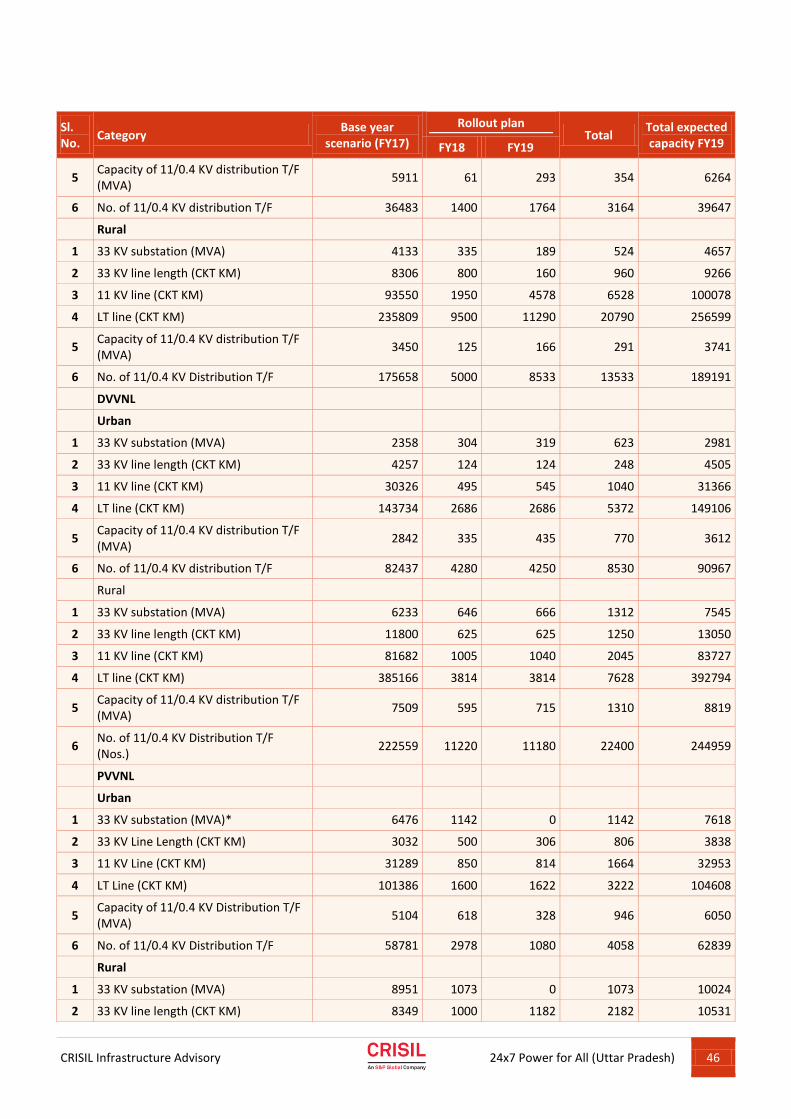
CRISIL Infrastructure Advisory
24x7 Power for All (Uttar Pradesh) 46
Sl. No.
Category Base year
scenario (FY17)
Rollout plan Total
Total expected capacity FY19 FY18 FY19
5 Capacity of 11/0.4 KV distribution T/F (MVA)
5911 61 293 354 6264
6 No. of 11/0.4 KV distribution T/F 36483 1400 1764 3164 39647
Rural
1 33 KV substation (MVA) 4133 335 189 524 4657
2 33 KV line length (CKT KM) 8306 800 160 960 9266
3 11 KV line (CKT KM) 93550 1950 4578 6528 100078
4 LT line (CKT KM) 235809 9500 11290 20790 256599
5 Capacity of 11/0.4 KV distribution T/F (MVA)
3450 125 166 291 3741
6 No. of 11/0.4 KV Distribution T/F 175658 5000 8533 13533 189191
DVVNL
Urban
1 33 KV substation (MVA) 2358 304 319 623 2981
2 33 KV line length (CKT KM) 4257 124 124 248 4505
3 11 KV line (CKT KM) 30326 495 545 1040 31366
4 LT line (CKT KM) 143734 2686 2686 5372 149106
5 Capacity of 11/0.4 KV distribution T/F (MVA)
2842 335 435 770 3612
6 No. of 11/0.4 KV distribution T/F 82437 4280 4250 8530 90967
Rural
1 33 KV substation (MVA) 6233 646 666 1312 7545
2 33 KV line length (CKT KM) 11800 625 625 1250 13050
3 11 KV line (CKT KM) 81682 1005 1040 2045 83727
4 LT line (CKT KM) 385166 3814 3814 7628 392794
5 Capacity of 11/0.4 KV distribution T/F (MVA)
7509 595 715 1310 8819
6 No. of 11/0.4 KV Distribution T/F (Nos.)
222559 11220 11180 22400 244959
PVVNL
Urban
1 33 KV substation (MVA)* 6476 1142 0 1142 7618
2 33 KV Line Length (CKT KM) 3032 500 306 806 3838
3 11 KV Line (CKT KM) 31289 850 814 1664 32953
4 LT Line (CKT KM) 101386 1600 1622 3222 104608
5 Capacity of 11/0.4 KV Distribution T/F (MVA)
5104 618 328 946 6050
6 No. of 11/0.4 KV Distribution T/F 58781 2978 1080 4058 62839
Rural
1 33 KV substation (MVA) 8951 1073 0 1073 10024
2 33 KV line length (CKT KM) 8349 1000 1182 2182 10531
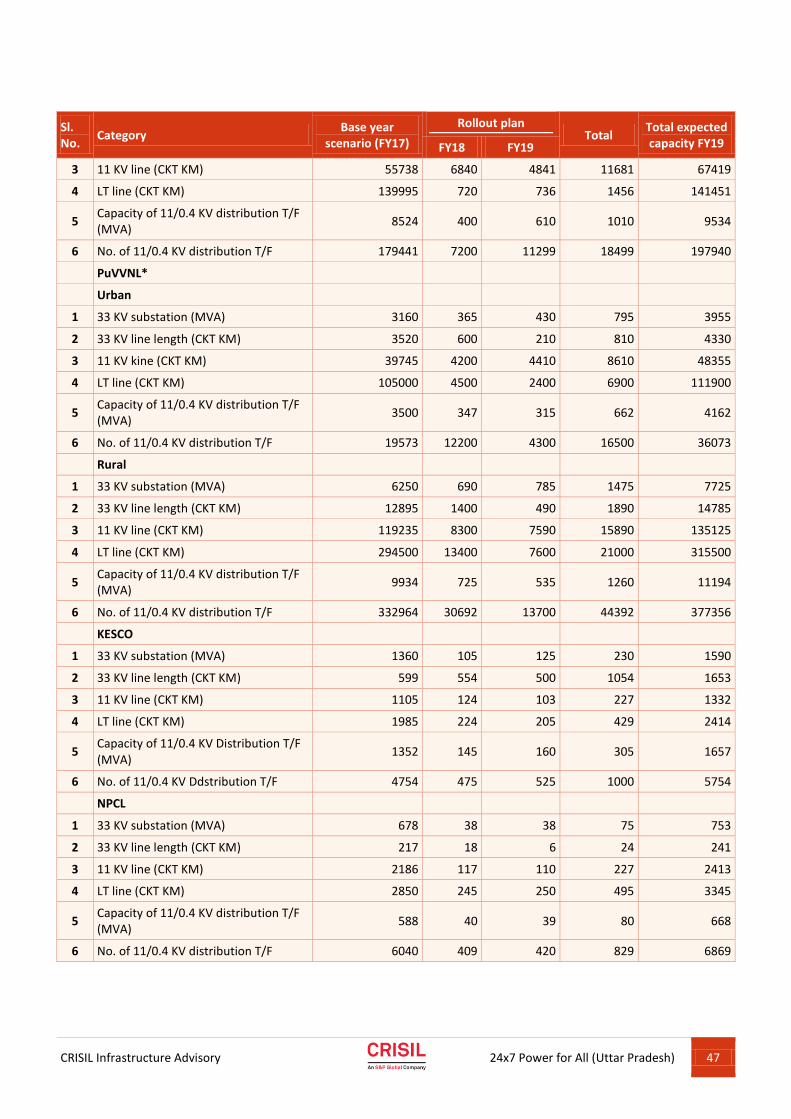
CRISIL Infrastructure Advisory
24x7 Power for All (Uttar Pradesh) 47
Sl. No.
Category Base year
scenario (FY17)
Rollout plan Total
Total expected capacity FY19 FY18 FY19
3 11 KV line (CKT KM) 55738 6840 4841 11681 67419
4 LT line (CKT KM) 139995 720 736 1456 141451
5 Capacity of 11/0.4 KV distribution T/F (MVA)
8524 400 610 1010 9534
6 No. of 11/0.4 KV distribution T/F 179441 7200 11299 18499 197940
PuVVNL*
Urban
1 33 KV substation (MVA) 3160 365 430 795 3955
2 33 KV line length (CKT KM) 3520 600 210 810 4330
3 11 KV kine (CKT KM) 39745 4200 4410 8610 48355
4 LT line (CKT KM) 105000 4500 2400 6900 111900
5 Capacity of 11/0.4 KV distribution T/F (MVA)
3500 347 315 662 4162
6 No. of 11/0.4 KV distribution T/F 19573 12200 4300 16500 36073
Rural
1 33 KV substation (MVA) 6250 690 785 1475 7725
2 33 KV line length (CKT KM) 12895 1400 490 1890 14785
3 11 KV line (CKT KM) 119235 8300 7590 15890 135125
4 LT line (CKT KM) 294500 13400 7600 21000 315500
5 Capacity of 11/0.4 KV distribution T/F (MVA)
9934 725 535 1260 11194
6 No. of 11/0.4 KV distribution T/F 332964 30692 13700 44392 377356
KESCO
1 33 KV substation (MVA) 1360 105 125 230 1590
2 33 KV line length (CKT KM) 599 554 500 1054 1653
3 11 KV line (CKT KM) 1105 124 103 227 1332
4 LT line (CKT KM) 1985 224 205 429 2414
5 Capacity of 11/0.4 KV Distribution T/F (MVA)
1352 145 160 305 1657
6 No. of 11/0.4 KV Ddstribution T/F 4754 475 525 1000 5754
NPCL
1 33 KV substation (MVA) 678 38 38 75 753
2 33 KV line length (CKT KM) 217 18 6 24 241
3 11 KV line (CKT KM) 2186 117 110 227 2413
4 LT line (CKT KM) 2850 245 250 495 3345
5 Capacity of 11/0.4 KV distribution T/F (MVA)
588 40 39 80 668
6 No. of 11/0.4 KV distribution T/F 6040 409 420 829 6869

CRISIL Infrastructure Advisory
24x7 Power for All (Uttar Pradesh) 48
CRISIL Infrastructure Advisory
24x7 Power for All (Uttar Pradesh) 49
CRISIL Infrastructure Advisory
24x7 Power for All (Uttar Pradesh) 50
Achievement in renewable energy
An aggregate 2,244 MW capacity of renewable energy
systems / plants has been installed in the state of Uttar
Pradesh. Technology-wise details of renewable energy
projects are given below:
Renewable energy projects (Total – 2,244 MW):
Solar photovoltaic – 222 MW
Wind – 0 MW
Biomass power – 2,022 MW
Existing and proposed electrification through
off-grid projects
Presently, the State is implementing following schemes
to add off-grid capacity:
1. DDG scheme is being implemented in 25 villages /
habitats in various districts and will cover 3,765
households with total installed capacity of 0.577
MW.
2. Installation of 138,805 solar power packs with
total capacity of 16.6 MW has been completed till
FY17.
The proposed electrification through off-grid projects
is detailed below:
1. Under the DDG scheme, 498 villages / habitations
shall be covered during the next 2 years to add
total capacity of 12 MW and will cover around
35,000 households.
2. About 3.2 MW of solar-based mini grids have been
installed, covering about 5,000 households. In
addition, the State has planned to add around 10
MW of solar-based mini grid projects which will
cover around 15,000 households.
3. Summarising the above, the State has planned to
electrify around 50,000 households through
upcoming off-grid projects.
Status of renewable energy policies in the
State
GoUP has issued Uttar Pradesh Solar Power Policy,
2013, with targeted capacity addition of 500 MW
through solar power plants by FY17. The solar power
projects to be set up under this policy were categorised
as follows:-
1. The first type is reserved for selling to UPPCL for
meeting its Renewable Purchase Obligation for
which the projects are selected through tariff
based competitive bidding process.
2. The second type is for the projects set up for third-
party sale.
3. And the third type is for the projects set up for
captive usage.
Directions or the guiding policies are in place for
capacity addition through small hydro power, grid
connected solar rooftop power plants, DDG projects,
bioenergy projects and solar off-grid projects.
However, guiding policies for capacity addition through
bioenergy power is under consideration for
announcement.
SECI has been approached by the State to tie up around
2,000 MW capacity under State-specific VGF Schemes
expected by FY19.
RPO status in Uttar Pradesh
Renewable purchase obligation– current
status
The Hon’ble UP Electricity Regulatory Commission has
issued UPERC (Promotion of Green Energy through
Renewable Purchase Obligation) Regulations, 2010,
which specifies that during each financial year, every
obligated entity shall purchase a minimum percentage
of its total consumption of electricity (in kWh) from
renewable energy (RE) sources under RPO. The
following table shows the status of RPO compliance in
the State.
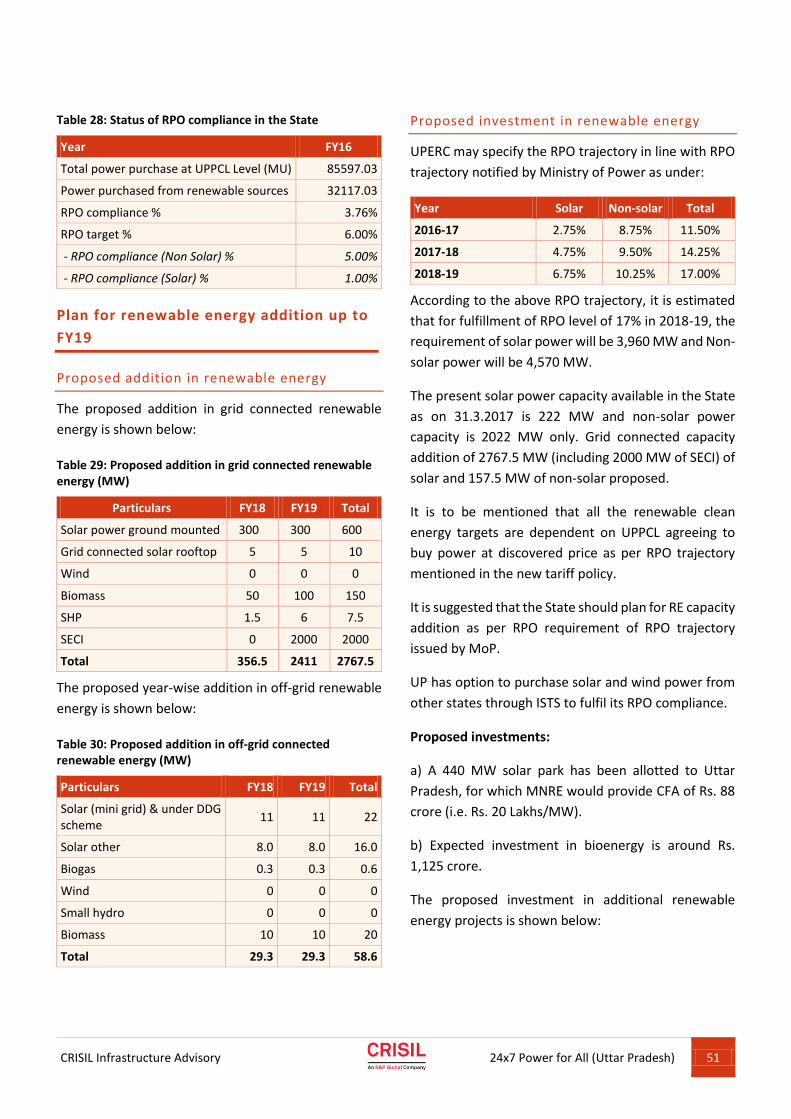
CRISIL Infrastructure Advisory
24x7 Power for All (Uttar Pradesh) 51
Table 28: Status of RPO compliance in the State
Year FY16
Total power purchase at UPPCL Level (MU) 85597.03
Power purchased from renewable sources 32117.03
RPO compliance % 3.76%
RPO target % 6.00%
- RPO compliance (Non Solar) % 5.00%
- RPO compliance (Solar) % 1.00%
Plan for renewable energy addition up to
FY19
Proposed addition in renewable energy
The proposed addition in grid connected renewable
energy is shown below:
Table 29: Proposed addition in grid connected renewable energy (MW)
Particulars FY18 FY19 Total
Solar power ground mounted 300 300 600
Grid connected solar rooftop 5 5 10
Wind 0 0 0
Biomass 50 100 150
SHP 1.5 6 7.5
SECI 0 2000 2000
Total 356.5 2411 2767.5
The proposed year-wise addition in off-grid renewable
energy is shown below:
Table 30: Proposed addition in off-grid connected renewable energy (MW)
Particulars FY18 FY19 Total
Solar (mini grid) & under DDG scheme
11 11 22
Solar other 8.0 8.0 16.0
Biogas 0.3 0.3 0.6
Wind 0 0 0
Small hydro 0 0 0
Biomass 10 10 20
Total 29.3 29.3 58.6
Proposed investment in renewable energy
UPERC may specify the RPO trajectory in line with RPO
trajectory notified by Ministry of Power as under:
Year Solar Non-solar Total
2016-17 2.75% 8.75% 11.50%
2017-18 4.75% 9.50% 14.25%
2018-19 6.75% 10.25% 17.00%
According to the above RPO trajectory, it is estimated
that for fulfillment of RPO level of 17% in 2018-19, the
requirement of solar power will be 3,960 MW and Non-
solar power will be 4,570 MW.
The present solar power capacity available in the State
as on 31.3.2017 is 222 MW and non-solar power
capacity is 2022 MW only. Grid connected capacity
addition of 2767.5 MW (including 2000 MW of SECI) of
solar and 157.5 MW of non-solar proposed.
It is to be mentioned that all the renewable clean
energy targets are dependent on UPPCL agreeing to
buy power at discovered price as per RPO trajectory
mentioned in the new tariff policy.
It is suggested that the State should plan for RE capacity
addition as per RPO requirement of RPO trajectory
issued by MoP.
UP has option to purchase solar and wind power from
other states through ISTS to fulfil its RPO compliance.
Proposed investments:
a) A 440 MW solar park has been allotted to Uttar
Pradesh, for which MNRE would provide CFA of Rs. 88
crore (i.e. Rs. 20 Lakhs/MW).
b) Expected investment in bioenergy is around Rs.
1,125 crore.
The proposed investment in additional renewable
energy projects is shown below:
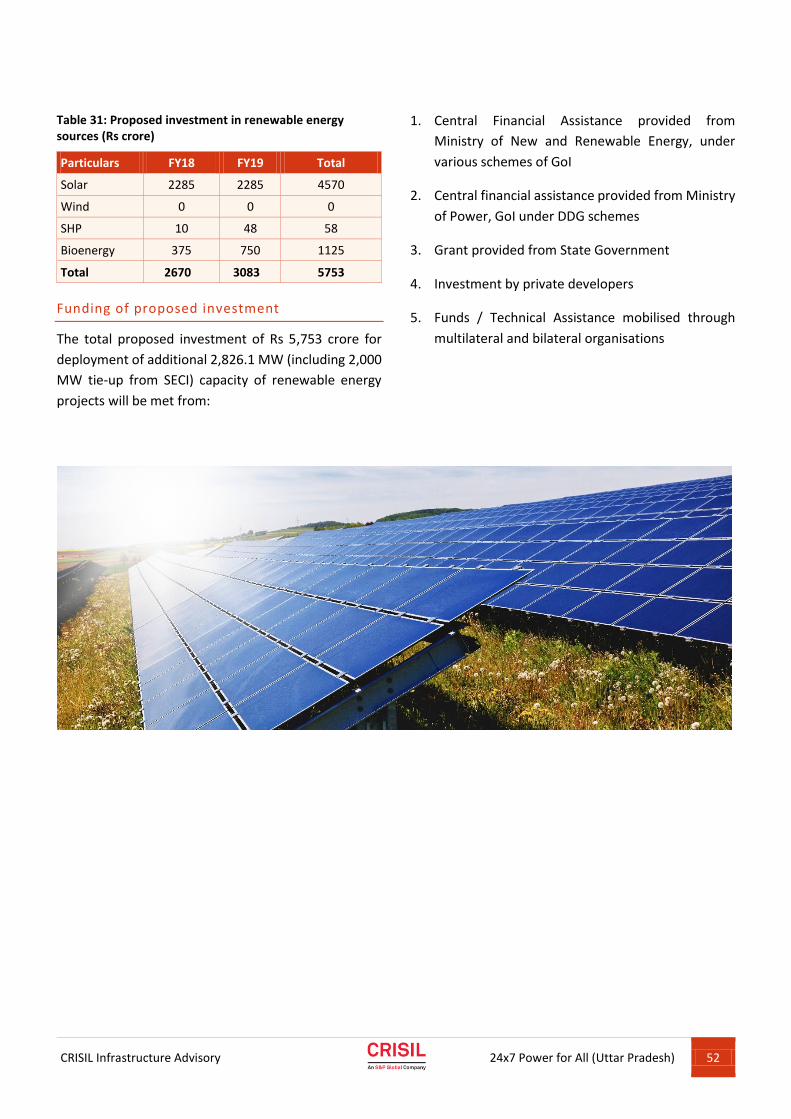
CRISIL Infrastructure Advisory
24x7 Power for All (Uttar Pradesh) 52
Table 31: Proposed investment in renewable energy sources (Rs crore)
Particulars FY18 FY19 Total
Solar 2285 2285 4570
Wind 0 0 0
SHP 10 48 58
Bioenergy 375 750 1125
Total 2670 3083 5753
Funding of proposed investment
The total proposed investment of Rs 5,753 crore for
deployment of additional 2,826.1 MW (including 2,000
MW tie-up from SECI) capacity of renewable energy
projects will be met from:
1. Central Financial Assistance provided from
Ministry of New and Renewable Energy, under
various schemes of GoI
2. Central financial assistance provided from Ministry
of Power, GoI under DDG schemes
3. Grant provided from State Government
4. Investment by private developers
5. Funds / Technical Assistance mobilised through
multilateral and bilateral organisations
CRISIL Infrastructure Advisory
24x7 Power for All (Uttar Pradesh) 53
CRISIL Infrastructure Advisory
24x7 Power for All (Uttar Pradesh) 54
Scope of demand-side measures
With implementation of various Demand Side
Management (DSM) and Energy Efficiency measures in
various sectors such as agriculture, municipalities,
buildings, domestic, industries a considerable quantum
of electricity can be saved. DSM has been traditionally
seen as a means of reducing peak electricity demand.
In fact, by reducing the overall load on an electricity
network, DSM has various beneficial effects, including
mitigating electrical system emergencies, reducing the
number of blackouts and increasing system reliability.
Benefits also include reducing dependency on
expensive imports of fuel, energy cost, and harmful
emissions to the environment. Finally, DSM has a major
role to play in deferring high investments in generation,
transmission and distribution networks. Thus, DSM
applied to electricity systems provides significant
economic reliability and environmental benefits.
Opportunities for reducing energy demand are
numerous in all sectors and many are low-cost, or even
no-cost items that most enterprises or individuals
could adopt in the short term.
As per the report of National Productivity Council there
is a scope of 13% to 15% reduction in electricity usage
through demand side measures, which translates into
15,000 MU of annual energy savings which, in turn,
results in reduction of around 1,500 MW of avoidable
capacity in Uttar Pradesh.
In the area of NPCL, the potential for energy
conservation is around 1 MU by lighting load reduction
of 800 kW in peak hours.
Scope of various activities under different sectors to
take DSM measures are summarised as follows:
Table 32: Scope of DSM measures in different sectors
Area Activities
Municipal sector (i) Lighting
(ii) Pumping
(iii) PF correction
Agricultural sector (i) Lighting
(ii) Pumping
Area Activities
Government buildings (i) Air Conditioning
(ii) Lighting
(iii) PF correction
Multistory complexes (i) Energy efficient building construction
Commercial buildings (i) Lighting
(ii) PF correction
Industries (i) Energy efficient appliances
(ii) PF correction
Promotion of solar power (i) For all sectors
Reduction of T&D losses (i) On substations
(ii) Distribution network
Efficiency improvements in thermal power stations
(i) All state generating units
Demand side management measures:
The State has ordered various measures on energy
efficiency, such measures include the following:
a. Demo projects under MuDSM programme of BEE
for LED street lights shall be undertaken for
Ghaziabad Development Authority with the help of
EESL.
b. Façade lighting for Manmahal at Manmandir Ghat
and Tulsi Ghat has been installed in Varanasi. EESL
is also working on development of façade lighting
for about 10 more heritage buildings at the Ganges
Ghats of Varanasi.
c. Replacement of conventional lights with energy-
efficient LED lights at all the 84 ghats of Varanasi
has been successfully completed & about 1,200
LED lights have been installed at all the ghats and
approach roads under Varanasi Ghat Flood Lighting
Project in FY17. The expected energy saving per
year is about 1.83 MU.
d. EESL has completed installation of more than
29,000 LED street lights in the city area of Varanasi
under SLNP in FY17. Varanasi Nagar Nigam is
expected to save over Rs 10 crore per annum and
reduction in peak load from 5.4 MW to 3.0 MW.
Additionally, LED heritage lighting installation is
CRISIL Infrastructure Advisory
24x7 Power for All (Uttar Pradesh) 55
under progress and 800 LED heritage lights have
been installed in Kashi.
e. The works under the Energy Conservation Building
Code shall be aggressively undertaken.
f. The Uttar Pradesh secretariat shall be developed as
energy conservation model.
g. 30,000 kVAR capacity automatic power factor
correctors (APFC) have been installed so far in 89
government buildings. Other government buildings
will be covered gradually.
UP Electricity Regulatory Commission (UPERC) has
passed an Order to implement DELP (DSM based
Efficient Lighting Programme) through Energy
Efficiency Services Limited (EESL) in 41 districts of the
State. In the first phase, EESL has implemented the
scheme in 41 districts of Purvanchal Vidyut Vitran
Nigam Limited, Madhyanchal Vidyut Vitran Nigam
Limited and KESCO. PVVNL & DVVNL Discoms are
distributing LED lights in the districts they service. Total
1.5 crore (approx) LED lights (7 W/9W) have been
distributed in the State since its launch on 8th June,
2015, at Varanasi. It has resulted in estimated energy
saving of 1,948 MU. EESL’s service model enables
domestic households to procure LED lights at an
affordable price of Rs. 10/- each and the balance on
easy instalment from their electricity bill.
Uttar Pradesh Rajya Krishi Utpadan Mandi Parishad has
replaced its present lighting system with energy-
efficient LED lights. Total annual electricity saving is
0.350 MU.
The vision is to distribute 10 crore LED bulbs in Uttar
Pradesh. EESL will supply LED bulbs through its
distribution partners. EESL's regional officers will
ensure frequent and high number of distribution kiosks
at all places in U.P. The distribution of LED bulbs has to
be complimented by a “massive awareness campaign”
to educate consumers about the UJALA scheme. LED
Bulb distribution will start simultaneously in all 22
Mandal Headquarters after 14th April, 2017, along with
rollout of awareness campaigns across the State.
EESL will start distribution with target of at least 1.5
crore bulbs in FY17-18 and at least 2.0 crore bulbs in
FY18-19. The plan for the distribution of the balance
along with the time frame will be fixed based on the
experience in the above phase. Further, under the
agreement signed between EESL and Aligarh Municipal
Corporation, LED street lighting implementation work
in Aligarh is completed, where more than 14,000 LED
street lights have been installed in FY17 resulting in
estimated energy saving of about 9.0 MU with
centralised control monitoring system (CCMS).
The energy audit of 20 State Government buildings has
been done and annual energy saving potential has
been estimated to be Rs. 5.27 crore with required
investment of Rs. 9.61 crore.
By partial implementation of recommendations of
energy audit reports in nine buildings, only around 0.22
MU per month is being saved with monthly cost savings
of around Rs. 12.77 lakh.
Regular awareness programmes are being conducted
in the State for ‘energy efficiency’
A website http://upsavesenergy.com/Index.aspx has
been started to create awareness amongst schools &
students.
All State Government power houses and some heavy
industries in the State have been identified as
“Designated Consumers” and these are brought under
the ambit of the “Perform, Achieve and Trade” (PAT)
scheme of BEE to promote energy efficiency. Twenty-
five DCs were covered in PAT Cycle-I and they have
been issued total 4,06,551 positive ESCerts. These
ESCerts are equivalent to 4,06,551 Toe.
In PAT Cycle-II, 46 DCs have been identified, including
five Discoms.
The draft Energy Conservation Building Code” has been
sent to the PWD department for notification. Along
with it, capacity building for Energy Conservation
Building Code (ECBC) is also being undertaken. As a
pilot project, an ECBC compliant, UPERC building is
being constructed.
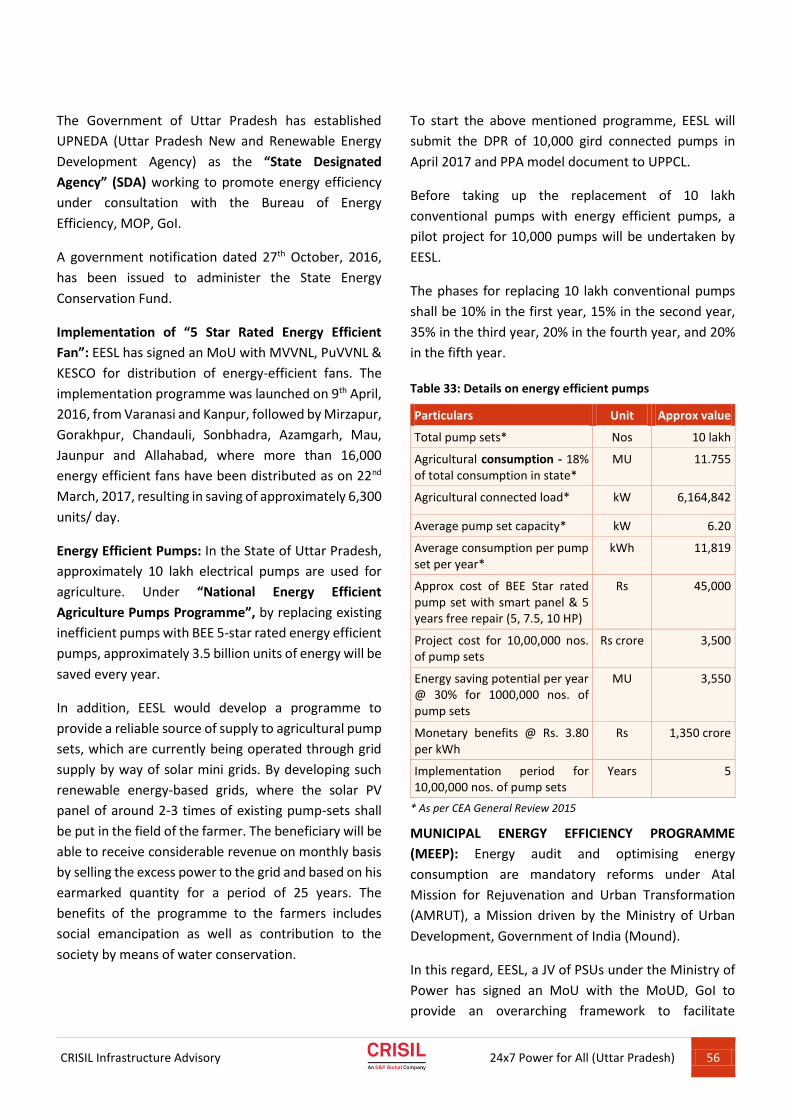
CRISIL Infrastructure Advisory
24x7 Power for All (Uttar Pradesh) 56
The Government of Uttar Pradesh has established
UPNEDA (Uttar Pradesh New and Renewable Energy
Development Agency) as the “State Designated
Agency” (SDA) working to promote energy efficiency
under consultation with the Bureau of Energy
Efficiency, MOP, GoI.
A government notification dated 27th October, 2016,
has been issued to administer the State Energy
Conservation Fund.
Implementation of “5 Star Rated Energy Efficient
Fan”: EESL has signed an MoU with MVVNL, PuVVNL &
KESCO for distribution of energy-efficient fans. The
implementation programme was launched on 9th April,
2016, from Varanasi and Kanpur, followed by Mirzapur,
Gorakhpur, Chandauli, Sonbhadra, Azamgarh, Mau,
Jaunpur and Allahabad, where more than 16,000
energy efficient fans have been distributed as on 22nd
March, 2017, resulting in saving of approximately 6,300
units/ day.
Energy Efficient Pumps: In the State of Uttar Pradesh,
approximately 10 lakh electrical pumps are used for
agriculture. Under “National Energy Efficient
Agriculture Pumps Programme”, by replacing existing
inefficient pumps with BEE 5-star rated energy efficient
pumps, approximately 3.5 billion units of energy will be
saved every year.
In addition, EESL would develop a programme to
provide a reliable source of supply to agricultural pump
sets, which are currently being operated through grid
supply by way of solar mini grids. By developing such
renewable energy-based grids, where the solar PV
panel of around 2-3 times of existing pump-sets shall
be put in the field of the farmer. The beneficiary will be
able to receive considerable revenue on monthly basis
by selling the excess power to the grid and based on his
earmarked quantity for a period of 25 years. The
benefits of the programme to the farmers includes
social emancipation as well as contribution to the
society by means of water conservation.
To start the above mentioned programme, EESL will
submit the DPR of 10,000 gird connected pumps in
April 2017 and PPA model document to UPPCL.
Before taking up the replacement of 10 lakh
conventional pumps with energy efficient pumps, a
pilot project for 10,000 pumps will be undertaken by
EESL.
The phases for replacing 10 lakh conventional pumps
shall be 10% in the first year, 15% in the second year,
35% in the third year, 20% in the fourth year, and 20%
in the fifth year.
Table 33: Details on energy efficient pumps
Particulars Unit Approx value
Total pump sets* Nos 10 lakh
Agricultural consumption - 18% of total consumption in state*
MU 11.755
Agricultural connected load* kW 6,164,842
Average pump set capacity* kW 6.20
Average consumption per pump set per year*
kWh 11,819
Approx cost of BEE Star rated pump set with smart panel & 5 years free repair (5, 7.5, 10 HP)
Rs 45,000
Project cost for 10,00,000 nos. of pump sets
Rs crore 3,500
Energy saving potential per year @ 30% for 1000,000 nos. of pump sets
MU 3,550
Monetary benefits @ Rs. 3.80 per kWh
Rs 1,350 crore
Implementation period for 10,00,000 nos. of pump sets
Years 5
* As per CEA General Review 2015
MUNICIPAL ENERGY EFFICIENCY PROGRAMME
(MEEP): Energy audit and optimising energy
consumption are mandatory reforms under Atal
Mission for Rejuvenation and Urban Transformation
(AMRUT), a Mission driven by the Ministry of Urban
Development, Government of India (Mound).
In this regard, EESL, a JV of PSUs under the Ministry of
Power has signed an MoU with the MoUD, GoI to
provide an overarching framework to facilitate
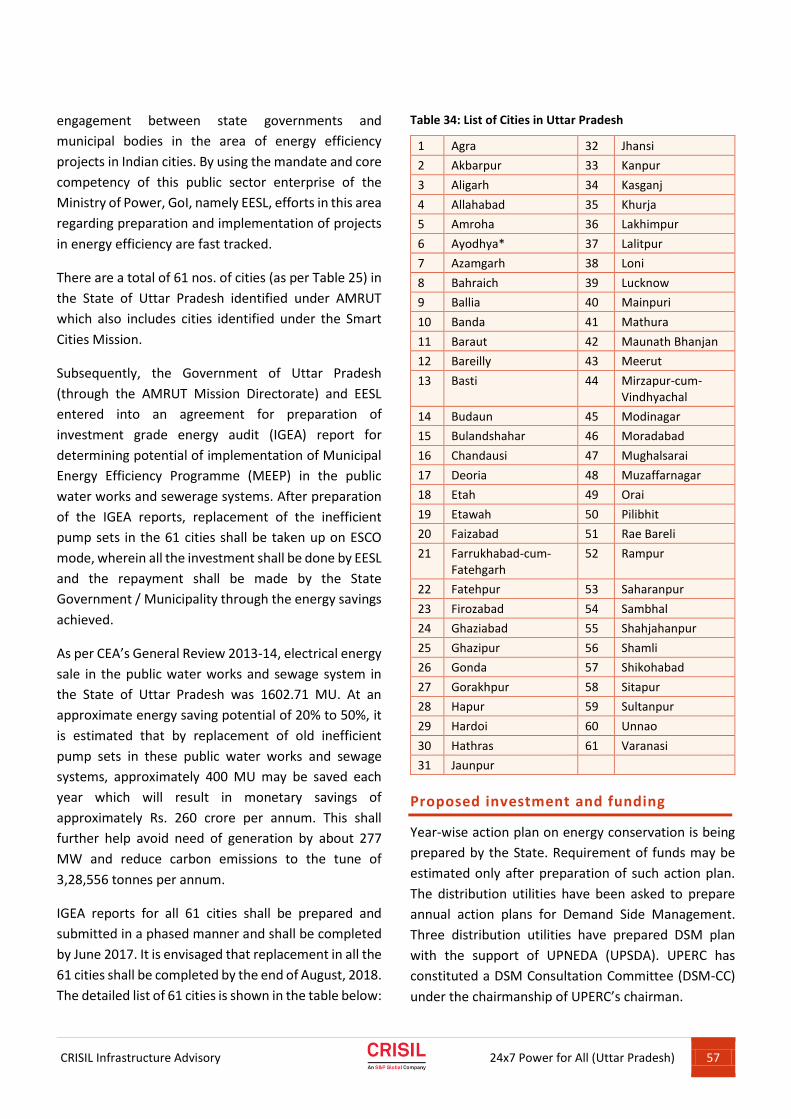
CRISIL Infrastructure Advisory
24x7 Power for All (Uttar Pradesh) 57
engagement between state governments and
municipal bodies in the area of energy efficiency
projects in Indian cities. By using the mandate and core
competency of this public sector enterprise of the
Ministry of Power, GoI, namely EESL, efforts in this area
regarding preparation and implementation of projects
in energy efficiency are fast tracked.
There are a total of 61 nos. of cities (as per Table 25) in
the State of Uttar Pradesh identified under AMRUT
which also includes cities identified under the Smart
Cities Mission.
Subsequently, the Government of Uttar Pradesh
(through the AMRUT Mission Directorate) and EESL
entered into an agreement for preparation of
investment grade energy audit (IGEA) report for
determining potential of implementation of Municipal
Energy Efficiency Programme (MEEP) in the public
water works and sewerage systems. After preparation
of the IGEA reports, replacement of the inefficient
pump sets in the 61 cities shall be taken up on ESCO
mode, wherein all the investment shall be done by EESL
and the repayment shall be made by the State
Government / Municipality through the energy savings
achieved.
As per CEA’s General Review 2013-14, electrical energy
sale in the public water works and sewage system in
the State of Uttar Pradesh was 1602.71 MU. At an
approximate energy saving potential of 20% to 50%, it
is estimated that by replacement of old inefficient
pump sets in these public water works and sewage
systems, approximately 400 MU may be saved each
year which will result in monetary savings of
approximately Rs. 260 crore per annum. This shall
further help avoid need of generation by about 277
MW and reduce carbon emissions to the tune of
3,28,556 tonnes per annum.
IGEA reports for all 61 cities shall be prepared and
submitted in a phased manner and shall be completed
by June 2017. It is envisaged that replacement in all the
61 cities shall be completed by the end of August, 2018.
The detailed list of 61 cities is shown in the table below:
Table 34: List of Cities in Uttar Pradesh
1 Agra 32 Jhansi
2 Akbarpur 33 Kanpur
3 Aligarh 34 Kasganj
4 Allahabad 35 Khurja
5 Amroha 36 Lakhimpur
6 Ayodhya* 37 Lalitpur
7 Azamgarh 38 Loni
8 Bahraich 39 Lucknow
9 Ballia 40 Mainpuri
10 Banda 41 Mathura
11 Baraut 42 Maunath Bhanjan
12 Bareilly 43 Meerut
13 Basti 44 Mirzapur-cum-Vindhyachal
14 Budaun 45 Modinagar
15 Bulandshahar 46 Moradabad
16 Chandausi 47 Mughalsarai
17 Deoria 48 Muzaffarnagar
18 Etah 49 Orai
19 Etawah 50 Pilibhit
20 Faizabad 51 Rae Bareli
21 Farrukhabad-cum-Fatehgarh
52 Rampur
22 Fatehpur 53 Saharanpur
23 Firozabad 54 Sambhal
24 Ghaziabad 55 Shahjahanpur
25 Ghazipur 56 Shamli
26 Gonda 57 Shikohabad
27 Gorakhpur 58 Sitapur
28 Hapur 59 Sultanpur
29 Hardoi 60 Unnao
30 Hathras 61 Varanasi
31 Jaunpur
Proposed investment and funding
Year-wise action plan on energy conservation is being
prepared by the State. Requirement of funds may be
estimated only after preparation of such action plan.
The distribution utilities have been asked to prepare
annual action plans for Demand Side Management.
Three distribution utilities have prepared DSM plan
with the support of UPNEDA (UPSDA). UPERC has
constituted a DSM Consultation Committee (DSM-CC)
under the chairmanship of UPERC’s chairman.
CRISIL Infrastructure Advisory
24x7 Power for All (Uttar Pradesh) 58
Funding for implementation of this action plan shall be
sought from the following:
a. Central Financial Assistance provided by Bureau of
Energy Efficiency (BEE), Ministry of Power, GoI
b. Uttar Pradesh State Energy Conservation Fund
c. Various beneficiaries/users
d. Central Financial Assistance provided from
Ministry of New and Renewable Energy, GoI, under
its various schemes.
Government of India intervention
Under the guidance of the Bureau of Energy Efficiency,
Ministry of Power, the State Designated Agency has so
far used the following methods to encourage energy
efficiency,
a. Publicity/awareness
b. Workshops / training programmes for capacity
building of stakeholders
c. Demonstration projects to showcase potential of
new energy efficient technology
For achievement of desired targets, following actions
are proposed to be undertaken at the level of the
Central Government.
a. Ask the State Government to set targets of DSM
and energy efficiency in specific measurable units
(Megawatts and million units)
b. Monitor the implementation of year-wise action
plans of energy efficiency in the State on a regular
basis.
c. Ask the State Government to convert the
distribution network of electricity into profit
centres under such an arrangement.
d. Facilitate the State Government in notifying the
Energy Conservation Building code to suit its local
climatic condition and implement it through
integration of the same in municipal bye-laws.
e. Facilitate the State Government in establishment
of “Standalone” State Designated Agency for
focused and effective implementation of energy
efficiency in the State.
i. The individual distribution sub-division of a
distribution utility shall be an independent
profit centre with an independent balance
sheet.
ii. The profit centre should be allowed to retain a
certain percentage of revenue earned by the
individual sub-division and should be allowed
to spend it on reducing the T&D losses of the
distribution network under its control.
iii. The individual profit centres should be asked to
act on an action plan to retrofit their sub-
stations with energy-efficient technologies.
iv. Huge commercial construction is likely to occur
in many major cities in the State and having
mandatory energy efficiency requirements will
drastically reduce the demand-side energy
used for commercial buildings.
Energy efficiency in the State can be implemented
more effectively and coordinated smoothly in the
presence of a “Standalone” State Designated Agency.
Action points for the State Government
a. State Power department to take steps to replace
pump sets that are more than 10 years old across
the State with energy-efficient pumps with smart
control panel.
b. Efforts will be made to replace street lights in all
municipalities with LED fittings and provide
affordable energy-efficient fans and tubelights to
people across the State.
c. EESL will arrange for 10 crore LED bulbs in the next
two years to be made available to the people under
the UJALA scheme. These LEDs are planned to be
provided with the new release of connection also
under electrification programme.
CRISIL Infrastructure Advisory
24x7 Power for All (Uttar Pradesh) 59
d. Discoms will conduct awareness programmes
among common people for success of the scheme.
e. The State Government may sign agreement with
EESL for replacement of the entire state’s
conventional street lights with LED street lights,
which will help reduce peak load in the evening.

CRISIL Infrastructure Advisory
24x7 Power for All (Uttar Pradesh) 60
CRISIL Infrastructure Advisory
24x7 Power for All (Uttar Pradesh) 61
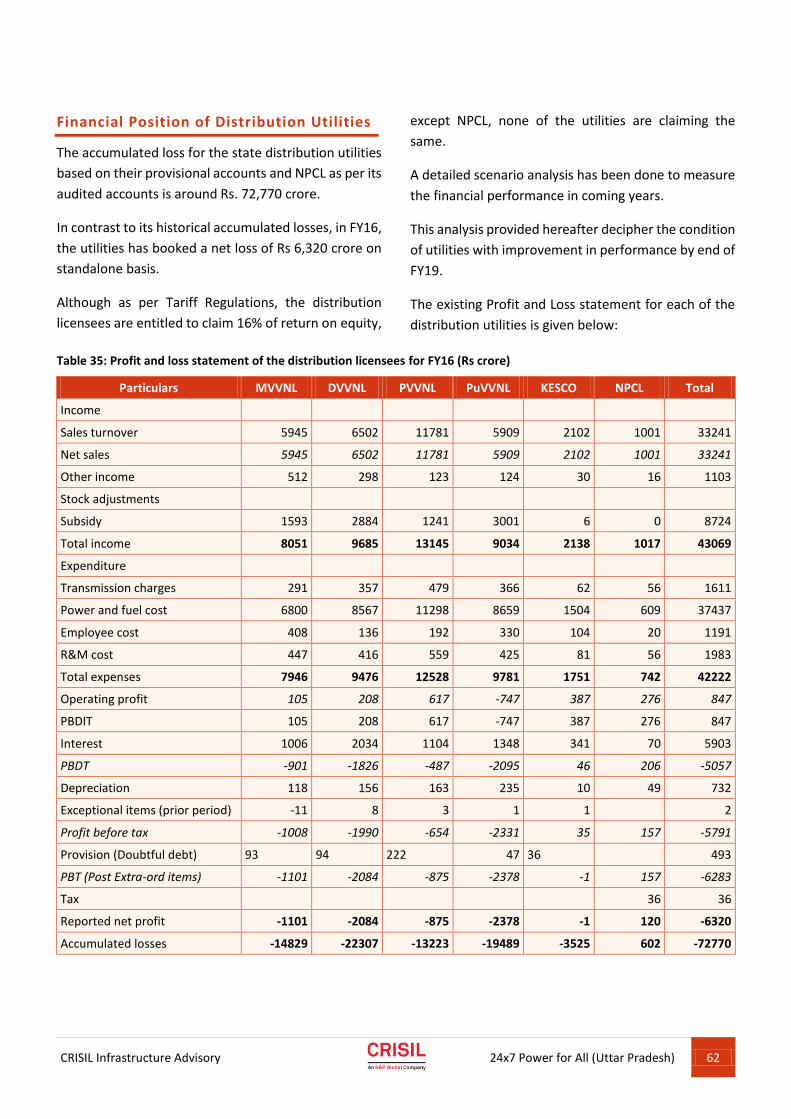
CRISIL Infrastructure Advisory
24x7 Power for All (Uttar Pradesh) 62
Financial Position of Distribution Utilities
The accumulated loss for the state distribution utilities
based on their provisional accounts and NPCL as per its
audited accounts is around Rs. 72,770 crore.
In contrast to its historical accumulated losses, in FY16,
the utilities has booked a net loss of Rs 6,320 crore on
standalone basis.
Although as per Tariff Regulations, the distribution
licensees are entitled to claim 16% of return on equity,
except NPCL, none of the utilities are claiming the
same.
A detailed scenario analysis has been done to measure
the financial performance in coming years.
This analysis provided hereafter decipher the condition
of utilities with improvement in performance by end of
FY19.
The existing Profit and Loss statement for each of the
distribution utilities is given below:
Table 35: Profit and loss statement of the distribution licensees for FY16 (Rs crore)
Particulars MVVNL DVVNL PVVNL PuVVNL KESCO NPCL Total
Income
Sales turnover 5945 6502 11781 5909 2102 1001 33241
Net sales 5945 6502 11781 5909 2102 1001 33241
Other income 512 298 123 124 30 16 1103
Stock adjustments
Subsidy 1593 2884 1241 3001 6 0 8724
Total income 8051 9685 13145 9034 2138 1017 43069
Expenditure
Transmission charges 291 357 479 366 62 56 1611
Power and fuel cost 6800 8567 11298 8659 1504 609 37437
Employee cost 408 136 192 330 104 20 1191
R&M cost 447 416 559 425 81 56 1983
Total expenses 7946 9476 12528 9781 1751 742 42222
Operating profit 105 208 617 -747 387 276 847
PBDIT 105 208 617 -747 387 276 847
Interest 1006 2034 1104 1348 341 70 5903
PBDT -901 -1826 -487 -2095 46 206 -5057
Depreciation 118 156 163 235 10 49 732
Exceptional items (prior period) -11 8 3 1 1 2
Profit before tax -1008 -1990 -654 -2331 35 157 -5791
Provision (Doubtful debt) 93 94 222 47 36 493
PBT (Post Extra-ord items) -1101 -2084 -875 -2378 -1 157 -6283
Tax 36 36
Reported net profit -1101 -2084 -875 -2378 -1 120 -6320
Accumulated losses -14829 -22307 -13223 -19489 -3525 602 -72770
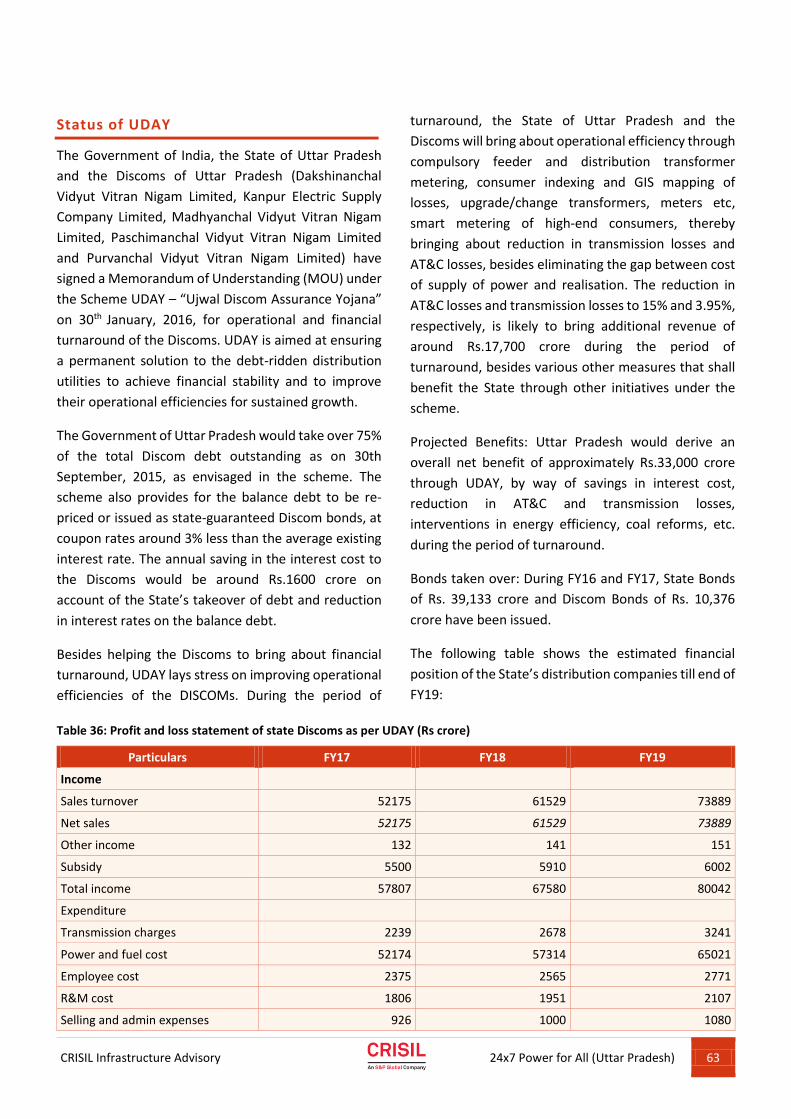
CRISIL Infrastructure Advisory
24x7 Power for All (Uttar Pradesh) 63
Status of UDAY
The Government of India, the State of Uttar Pradesh
and the Discoms of Uttar Pradesh (Dakshinanchal
Vidyut Vitran Nigam Limited, Kanpur Electric Supply
Company Limited, Madhyanchal Vidyut Vitran Nigam
Limited, Paschimanchal Vidyut Vitran Nigam Limited
and Purvanchal Vidyut Vitran Nigam Limited) have
signed a Memorandum of Understanding (MOU) under
the Scheme UDAY – “Ujwal Discom Assurance Yojana”
on 30th January, 2016, for operational and financial
turnaround of the Discoms. UDAY is aimed at ensuring
a permanent solution to the debt-ridden distribution
utilities to achieve financial stability and to improve
their operational efficiencies for sustained growth.
The Government of Uttar Pradesh would take over 75%
of the total Discom debt outstanding as on 30th
September, 2015, as envisaged in the scheme. The
scheme also provides for the balance debt to be re-
priced or issued as state-guaranteed Discom bonds, at
coupon rates around 3% less than the average existing
interest rate. The annual saving in the interest cost to
the Discoms would be around Rs.1600 crore on
account of the State’s takeover of debt and reduction
in interest rates on the balance debt.
Besides helping the Discoms to bring about financial
turnaround, UDAY lays stress on improving operational
efficiencies of the DISCOMs. During the period of
turnaround, the State of Uttar Pradesh and the
Discoms will bring about operational efficiency through
compulsory feeder and distribution transformer
metering, consumer indexing and GIS mapping of
losses, upgrade/change transformers, meters etc,
smart metering of high-end consumers, thereby
bringing about reduction in transmission losses and
AT&C losses, besides eliminating the gap between cost
of supply of power and realisation. The reduction in
AT&C losses and transmission losses to 15% and 3.95%,
respectively, is likely to bring additional revenue of
around Rs.17,700 crore during the period of
turnaround, besides various other measures that shall
benefit the State through other initiatives under the
scheme.
Projected Benefits: Uttar Pradesh would derive an
overall net benefit of approximately Rs.33,000 crore
through UDAY, by way of savings in interest cost,
reduction in AT&C and transmission losses,
interventions in energy efficiency, coal reforms, etc.
during the period of turnaround.
Bonds taken over: During FY16 and FY17, State Bonds
of Rs. 39,133 crore and Discom Bonds of Rs. 10,376
crore have been issued.
The following table shows the estimated financial
position of the State’s distribution companies till end of
FY19:
Table 36: Profit and loss statement of state Discoms as per UDAY (Rs crore)
Particulars FY17 FY18 FY19
Income
Sales turnover 52175 61529 73889
Net sales 52175 61529 73889
Other income 132 141 151
Subsidy 5500 5910 6002
Total income 57807 67580 80042
Expenditure
Transmission charges 2239 2678 3241
Power and fuel cost 52174 57314 65021
Employee cost 2375 2565 2771
R&M cost 1806 1951 2107
Selling and admin expenses 926 1000 1080
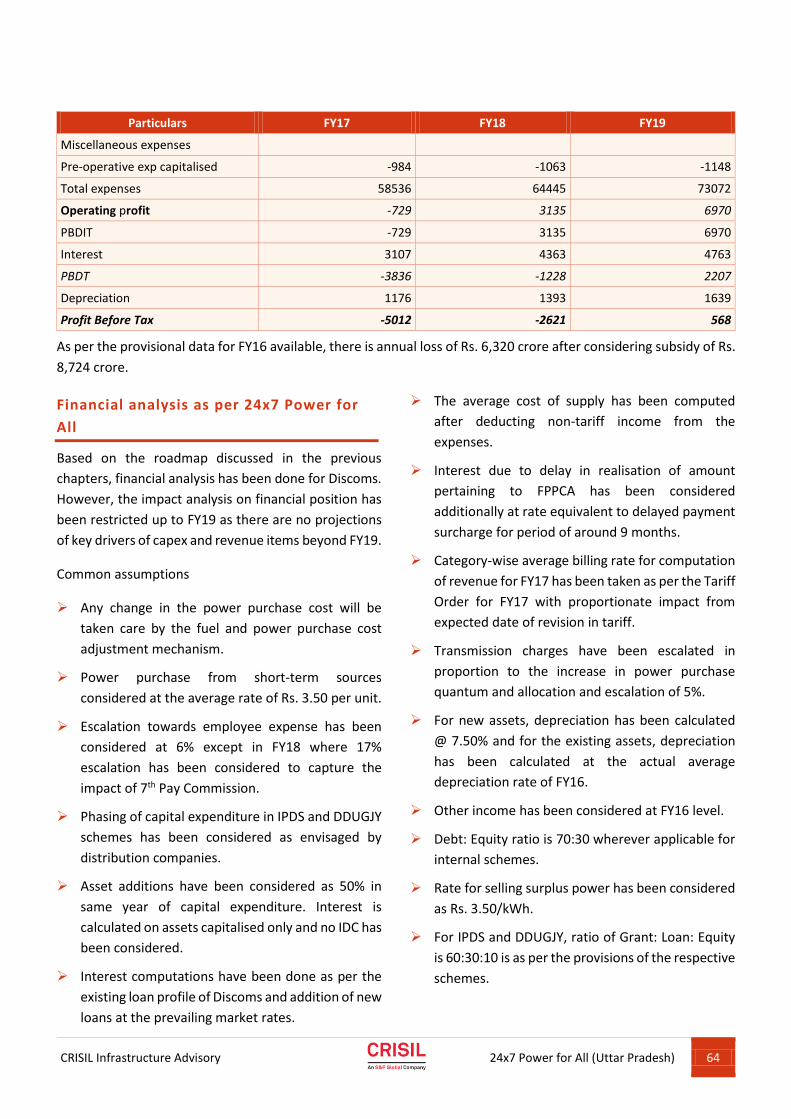
CRISIL Infrastructure Advisory
24x7 Power for All (Uttar Pradesh) 64
Particulars FY17 FY18 FY19
Miscellaneous expenses
Pre-operative exp capitalised -984 -1063 -1148
Total expenses 58536 64445 73072
Operating profit -729 3135 6970
PBDIT -729 3135 6970
Interest 3107 4363 4763
PBDT -3836 -1228 2207
Depreciation 1176 1393 1639
Profit Before Tax -5012 -2621 568
As per the provisional data for FY16 available, there is annual loss of Rs. 6,320 crore after considering subsidy of Rs.
8,724 crore.
Financial analysis as per 24x7 Power for
All
Based on the roadmap discussed in the previous
chapters, financial analysis has been done for Discoms.
However, the impact analysis on financial position has
been restricted up to FY19 as there are no projections
of key drivers of capex and revenue items beyond FY19.
Common assumptions
Any change in the power purchase cost will be
taken care by the fuel and power purchase cost
adjustment mechanism.
Power purchase from short-term sources
considered at the average rate of Rs. 3.50 per unit.
Escalation towards employee expense has been
considered at 6% except in FY18 where 17%
escalation has been considered to capture the
impact of 7th Pay Commission.
Phasing of capital expenditure in IPDS and DDUGJY
schemes has been considered as envisaged by
distribution companies.
Asset additions have been considered as 50% in
same year of capital expenditure. Interest is
calculated on assets capitalised only and no IDC has
been considered.
Interest computations have been done as per the
existing loan profile of Discoms and addition of new
loans at the prevailing market rates.
The average cost of supply has been computed
after deducting non-tariff income from the
expenses.
Interest due to delay in realisation of amount
pertaining to FPPCA has been considered
additionally at rate equivalent to delayed payment
surcharge for period of around 9 months.
Category-wise average billing rate for computation
of revenue for FY17 has been taken as per the Tariff
Order for FY17 with proportionate impact from
expected date of revision in tariff.
Transmission charges have been escalated in
proportion to the increase in power purchase
quantum and allocation and escalation of 5%.
For new assets, depreciation has been calculated
@ 7.50% and for the existing assets, depreciation
has been calculated at the actual average
depreciation rate of FY16.
Other income has been considered at FY16 level.
Debt: Equity ratio is 70:30 wherever applicable for
internal schemes.
Rate for selling surplus power has been considered
as Rs. 3.50/kWh.
For IPDS and DDUGJY, ratio of Grant: Loan: Equity
is 60:30:10 is as per the provisions of the respective
schemes.

CRISIL Infrastructure Advisory
24x7 Power for All (Uttar Pradesh) 65
Revenue subsidy has been considered as projected
in UDAY.
Capital expenditure pertaining to energy efficiency
measures has not been considered as either these
schemes are primarily funded through grants or
have short payback period, thus having negligible
impact on the financials of the distribution
company.
Considering the above assumptions on achievement of
100% electrification and 24 hours supply in the State,
the Discoms may become profitable from FY19
onwards if they reduce the AT&C losses and
commensurate tariff revision projected in UDAY. The
projected financial position of the Distribution
companies in the State till end of FY19 is shown in
Annexure 3 of this report.
Challenges: Although operational funding requirement
has been assessed and factored in the projections,
there may be time lag in arranging funds or
unavailability of such funds given the condition of
meeting this requirement only through issue of bonds.
This time lag in arranging funds may have an impact on
financing cost.
Further, due to the shortage of manpower, a number
of persons are employed on contract/samvida basis. In
view of the Hon’ble Supreme court’s orders to pay the
equivalent wages of regular workforce, the utility may
have to pay them the wages at par with regular staff,
which will have an impact on overall O&M cost.

CRISIL Infrastructure Advisory
24x7 Power for All (Uttar Pradesh) 66
CRISIL Infrastructure Advisory
24x7 Power for All (Uttar Pradesh) 67
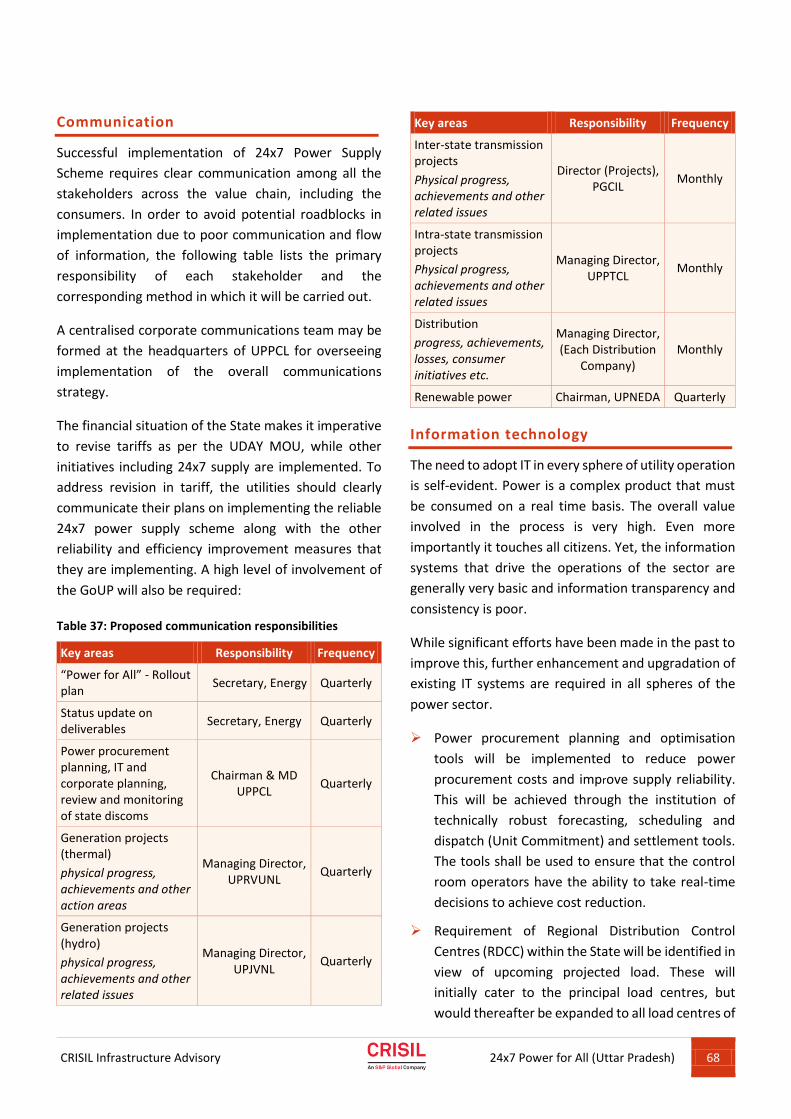
CRISIL Infrastructure Advisory
24x7 Power for All (Uttar Pradesh) 68
Communication
Successful implementation of 24x7 Power Supply
Scheme requires clear communication among all the
stakeholders across the value chain, including the
consumers. In order to avoid potential roadblocks in
implementation due to poor communication and flow
of information, the following table lists the primary
responsibility of each stakeholder and the
corresponding method in which it will be carried out.
A centralised corporate communications team may be
formed at the headquarters of UPPCL for overseeing
implementation of the overall communications
strategy.
The financial situation of the State makes it imperative
to revise tariffs as per the UDAY MOU, while other
initiatives including 24x7 supply are implemented. To
address revision in tariff, the utilities should clearly
communicate their plans on implementing the reliable
24x7 power supply scheme along with the other
reliability and efficiency improvement measures that
they are implementing. A high level of involvement of
the GoUP will also be required:
Table 37: Proposed communication responsibilities
Key areas Responsibility Frequency
“Power for All” - Rollout plan
Secretary, Energy Quarterly
Status update on deliverables
Secretary, Energy Quarterly
Power procurement planning, IT and corporate planning, review and monitoring of state discoms
Chairman & MD UPPCL
Quarterly
Generation projects (thermal)
physical progress, achievements and other action areas
Managing Director, UPRVUNL
Quarterly
Generation projects (hydro)
physical progress, achievements and other related issues
Managing Director, UPJVNL
Quarterly
Key areas Responsibility Frequency
Inter-state transmission projects
Physical progress, achievements and other related issues
Director (Projects), PGCIL
Monthly
Intra-state transmission projects
Physical progress, achievements and other related issues
Managing Director, UPPTCL
Monthly
Distribution
progress, achievements, losses, consumer initiatives etc.
Managing Director, (Each Distribution
Company) Monthly
Renewable power Chairman, UPNEDA Quarterly
Information technology
The need to adopt IT in every sphere of utility operation
is self-evident. Power is a complex product that must
be consumed on a real time basis. The overall value
involved in the process is very high. Even more
importantly it touches all citizens. Yet, the information
systems that drive the operations of the sector are
generally very basic and information transparency and
consistency is poor.
While significant efforts have been made in the past to
improve this, further enhancement and upgradation of
existing IT systems are required in all spheres of the
power sector.
Power procurement planning and optimisation
tools will be implemented to reduce power
procurement costs and improve supply reliability.
This will be achieved through the institution of
technically robust forecasting, scheduling and
dispatch (Unit Commitment) and settlement tools.
The tools shall be used to ensure that the control
room operators have the ability to take real-time
decisions to achieve cost reduction.
Requirement of Regional Distribution Control
Centres (RDCC) within the State will be identified in
view of upcoming projected load. These will
initially cater to the principal load centres, but
would thereafter be expanded to all load centres of
CRISIL Infrastructure Advisory
24x7 Power for All (Uttar Pradesh) 69
the State. This will be a key initiative, not only for
effectively managing 24x7 power supply, but also
thereafter for other functions like load forecasting.
Project monitoring tools shall be incorporated in
the PMU to ensure that progress on investments in
the State are monitored rigorously and bottlenecks
identified.
Establishment of IT enabled Online Energy
Metering, Billing & Collection System in state
Discoms. Establishment of meter data acquisition
system (MDAS), which will be integrated with all
feeders and select consumers' meters. Integration
of MDAS with Online Billing System will facilitate
computation of feeder-wise AT&C losses. MDAS
will also provide frequency and duration of power
interruption and improve customer care centre
services.
The above online services may also be
implemented in rural areas of the State using cloud
computing based web enabled IT system, which
will provide metering billing and collection (MBC)
and other consumer centric services on internet.
This system will facilitate arrangement of mobile
camps for consumer billing and collection services
at 40,000 consumer service centres available
throughout the State.
Implementation of various mobile applications for
ease of business operation to provide the
consumers on-the-go services and monitoring of
KPIs of commercial activities. Mobile applications
for the consumer (Consumer App), management
(Management App) and field activities (Field App)
shall be developed on priority with a monitoring
dashboard.
Centralised Information & Monitoring System for
operational, enforcement & litigation, vigilance
activities and analysis needs to be operationalised.
In order to curb the malpractices at the level of
meter reading, human intervention shall be
gradually reduced by adopting appropriate
metering and communication technology with IT
tools.
Standards of service specified under Section 57 of
the Electricity Act 2003 will be monitored. Suitable
IT tools may also be used by the utilities to gather
the information required to redress consumers’
grievances, effective tracking and escalation. The
utilities shall use IT based customer care centres to
improve service standards with minimal manual
intervention and increase consumer awareness
about the consumer centric services through
various electronic modes.
The above measures need to be implemented on
priority basis by distribution companies in a unified
and integrated manner and further to ensure that
the systems are operational on uniform and
common standards. For this, the UPPCL and
Discoms will evolve a comprehensive IT plan to
implement the above measures in a well-
coordinated manner.
A number of mobile applications to enhance ease
of use, accountability and transparency in
measuring and monitoring of various schemes and
project status have been developed. Application
and key features are as listed below :
Vidyut PRAVAH: This app provides highlights of
power availability, demand and market price in the
exchange on real time basis.
Tarang: Monitors progress of intra and inter-state
transmission projects status on pan-India basis to
ensure timely corrective actions.
DEEP: This app supports in short- and medium-
term power procurement in a uniform and
transparent manner by utilities.
GARV – II: App provides village-wise and
habitation-wise base line data of household
electrification of all states.
URJA: App provides outage information,
addressing complaints, power reliability of urban IT
enabled towns.
National UJALA Dashboard- App provides effective
monitoring of distribution of LED to state utilities.
CRISIL Infrastructure Advisory
24x7 Power for All (Uttar Pradesh) 70
UDAY Monitoring Portal- App provides effective
monitoring of various parameters and reform
measures signed under UDAY scheme.
URJA Mitra- App provides effective monitoring of
power outage and information dispensation to
consumers.
Institutional arrangement
A strong monitoring framework is essential to ensure
the success of the “Power for All” scheme. The
following structure is being proposed to undertake
regular monitoring of the progress of all initiatives
being undertaken in this scheme.
Government of India (GOI) Level Committee: It is
proposed that this committee will review the
overall progress of the scheme on a quarterly basis
and provide necessary support to ensure a
coordinated response from the Central
Government - where necessary. The committee
may be constituted with the following members –
PFC, REC, CEA, SECI, EESL, BEE, Ministry of Power,
MoEF, and MNRE.
State Government Level Committee: It is proposed
that a State level committee headed by the
Secretary (Power) will be formed to review the
progress of the scheme on a quarterly basis. This
committee will monitor the progress of the works
undertaken as part of the scheme and issue
directions to enable faster execution.
Department Level Committee: It is proposed that
a Department level committee at UPPCL headed by
the Chairman will be formed. This committee will
undertake progress reviews on a monthly basis. A
Discom-level DLC headed by MD which shall
undertake steps required to ensure that the
projects are progressing as per the action plan.
Project Monitoring Unit (PMU) – A project
monitoring unit shall be set up for monitoring the
progress of the works being undertaken under this
scheme. The PMU will operate under the Secretary,
(Energy) and shall be operated by an external
independent agency.
The PMU would be responsible for undertaking
coordination, preparing action plans and monitoring
progress of all works under the “Power for all” scheme.
The PMU will facilitate tracking action taken/ to be
taken and providing feedback to the various
committees that are proposed to be set up under the
scheme. The Government of India would supplement
the efforts of the Government of Uttar Pradesh in
establishing the Project Monitoring Unit (PMU).
The committees that are being proposed above are
required to be set up at the earliest to kickstart the
whole scheme. It is important that the committees
keep meeting on a regular basis as per the frequency/
timelines mentioned above – to ensure that the
objectives set out under the “Power for all” scheme are
achieved.
Capacity building
With the increase of IT applications in the Transmission
& Distribution system and to meet the expectations of
24x7 power supply for the consumers in the State, it is
important to focus on capacity building of the
employees for enhancement of technical know-how
and keeping abreast with latest technological
developments. Capacity building may also include
consumer grievance redressal system, awareness
regarding importance of working with safety, outage
management system, demand side management, etc.
It is also imperative that for transforming a distribution
utility into a customer-friendly one, change of mind-set
of employees would be required. It is critical that
change management initiatives are rolled out and
institutionalised for achieving better results.
In view of the importance of training on new
technologies, there is a requirement for development
and implementation of a well-structured Human
Resource Training Programme to help realise the
dream of 24x7 power supply system in the State in its
true sense.
There is already a provision for Demand Side
Management (DSM) training under various
programmes of the Bureau of Energy Efficiency (BEE)
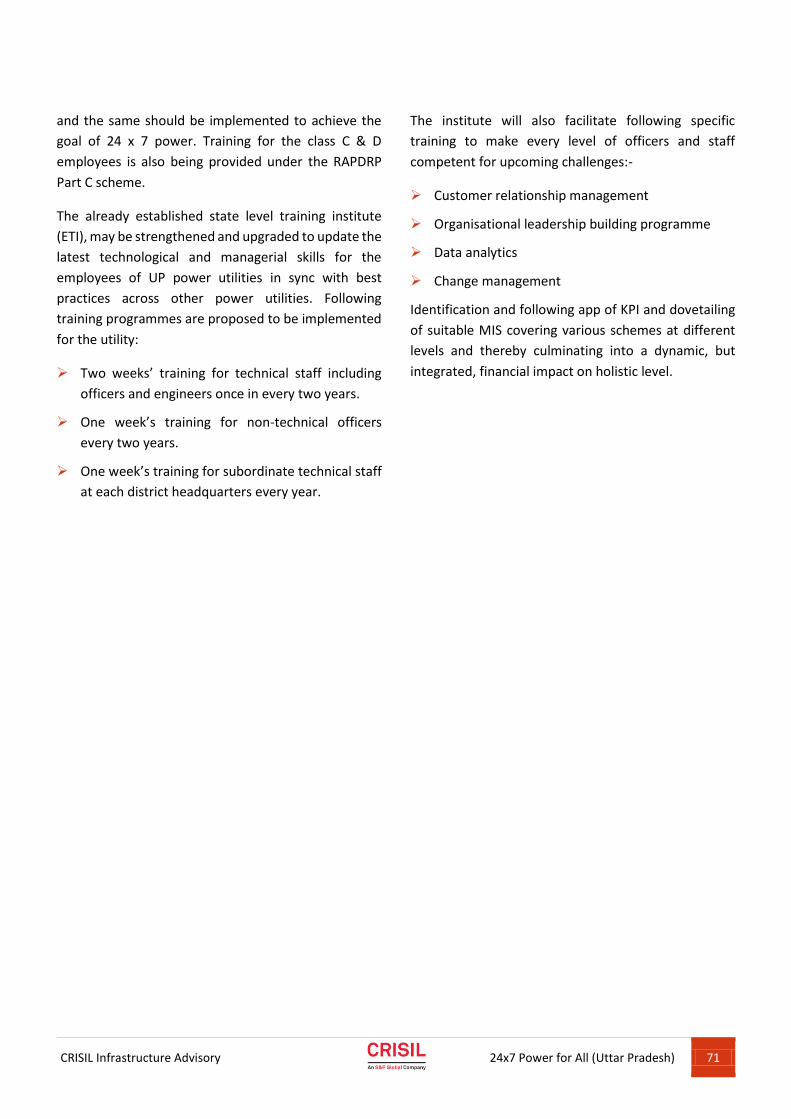
CRISIL Infrastructure Advisory
24x7 Power for All (Uttar Pradesh) 71
and the same should be implemented to achieve the
goal of 24 x 7 power. Training for the class C & D
employees is also being provided under the RAPDRP
Part C scheme.
The already established state level training institute
(ETI), may be strengthened and upgraded to update the
latest technological and managerial skills for the
employees of UP power utilities in sync with best
practices across other power utilities. Following
training programmes are proposed to be implemented
for the utility:
Two weeks’ training for technical staff including
officers and engineers once in every two years.
One week’s training for non-technical officers
every two years.
One week’s training for subordinate technical staff
at each district headquarters every year.
The institute will also facilitate following specific
training to make every level of officers and staff
competent for upcoming challenges:-
Customer relationship management
Organisational leadership building programme
Data analytics
Change management
Identification and following app of KPI and dovetailing
of suitable MIS covering various schemes at different
levels and thereby culminating into a dynamic, but
integrated, financial impact on holistic level.

CRISIL Infrastructure Advisory
24x7 Power for All (Uttar Pradesh) 72

CRISIL Infrastructure Advisory
24x7 Power for All (Uttar Pradesh) 73
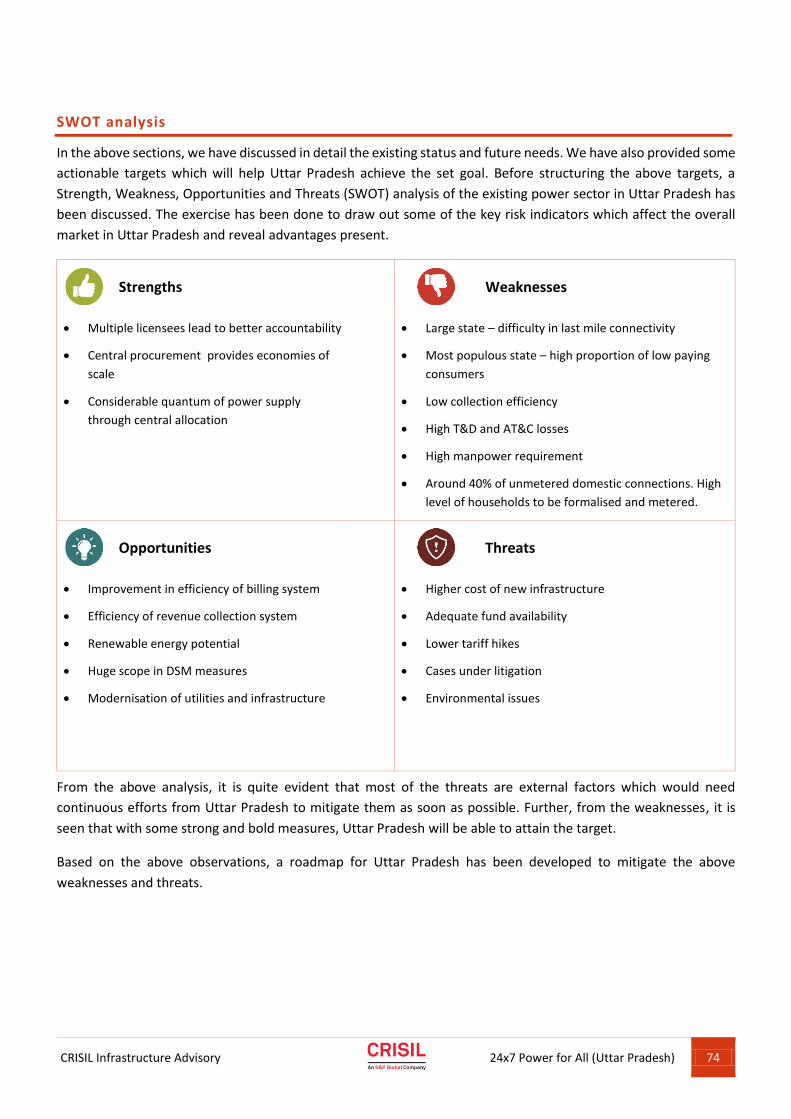
CRISIL Infrastructure Advisory
24x7 Power for All (Uttar Pradesh) 74
SWOT analysis
In the above sections, we have discussed in detail the existing status and future needs. We have also provided some
actionable targets which will help Uttar Pradesh achieve the set goal. Before structuring the above targets, a
Strength, Weakness, Opportunities and Threats (SWOT) analysis of the existing power sector in Uttar Pradesh has
been discussed. The exercise has been done to draw out some of the key risk indicators which affect the overall
market in Uttar Pradesh and reveal advantages present.
Strengths
Weaknesses
Multiple licensees lead to better accountability
Central procurement provides economies of
scale
Considerable quantum of power supply
through central allocation
Large state – difficulty in last mile connectivity
Most populous state – high proportion of low paying
consumers
Low collection efficiency
High T&D and AT&C losses
High manpower requirement
Around 40% of unmetered domestic connections. High
level of households to be formalised and metered.
Opportunities
Threats
Improvement in efficiency of billing system
Efficiency of revenue collection system
Renewable energy potential
Huge scope in DSM measures
Modernisation of utilities and infrastructure
Higher cost of new infrastructure
Adequate fund availability
Lower tariff hikes
Cases under litigation
Environmental issues
From the above analysis, it is quite evident that most of the threats are external factors which would need
continuous efforts from Uttar Pradesh to mitigate them as soon as possible. Further, from the weaknesses, it is
seen that with some strong and bold measures, Uttar Pradesh will be able to attain the target.
Based on the above observations, a roadmap for Uttar Pradesh has been developed to mitigate the above
weaknesses and threats.
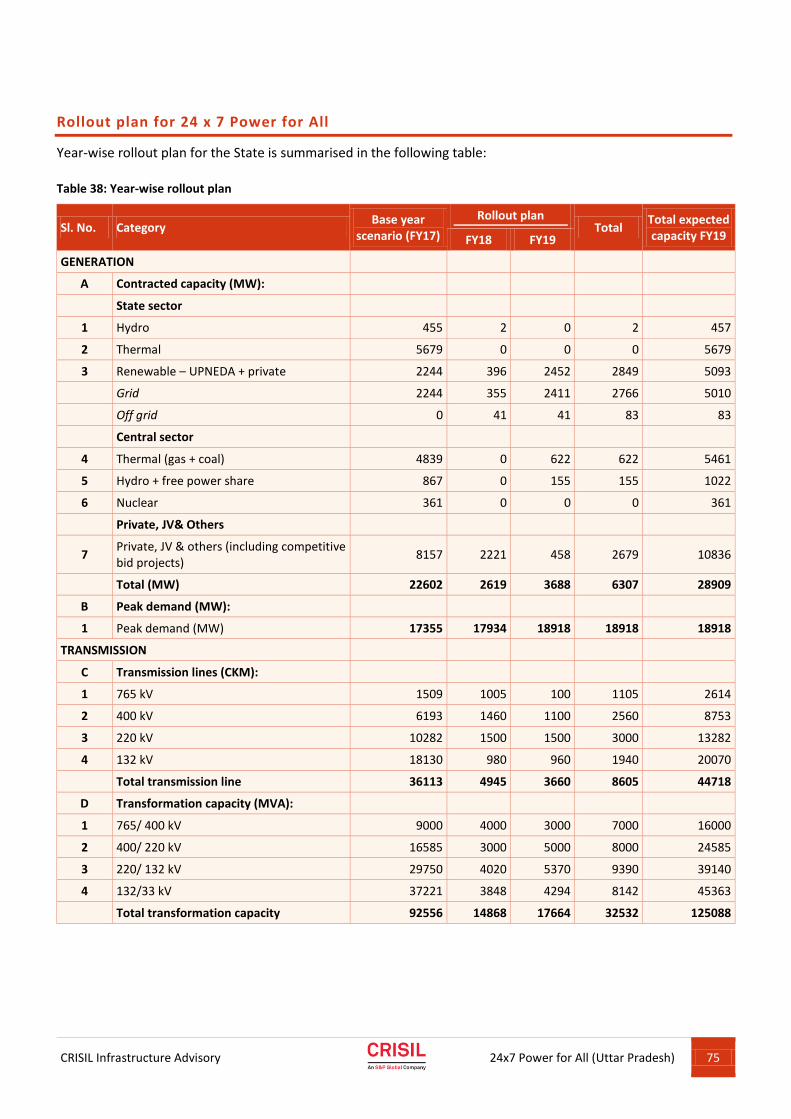
CRISIL Infrastructure Advisory
24x7 Power for All (Uttar Pradesh) 75
Rollout plan for 24 x 7 Power for All
Year-wise rollout plan for the State is summarised in the following table:
Table 38: Year-wise rollout plan
Sl. No. Category Base year
scenario (FY17)
Rollout plan Total
Total expected capacity FY19 FY18 FY19
GENERATION
A Contracted capacity (MW):
State sector
1 Hydro 455 2 0 2 457
2 Thermal 5679 0 0 0 5679
3 Renewable – UPNEDA + private 2244 396 2452 2849 5093
Grid 2244 355 2411 2766 5010
Off grid 0 41 41 83 83
Central sector
4 Thermal (gas + coal) 4839 0 622 622 5461
5 Hydro + free power share 867 0 155 155 1022
6 Nuclear 361 0 0 0 361
Private, JV& Others
7 Private, JV & others (including competitive bid projects)
8157 2221 458 2679 10836
Total (MW) 22602 2619 3688 6307 28909
B Peak demand (MW):
1 Peak demand (MW) 17355 17934 18918 18918 18918
TRANSMISSION
C Transmission lines (CKM):
1 765 kV 1509 1005 100 1105 2614
2 400 kV 6193 1460 1100 2560 8753
3 220 kV 10282 1500 1500 3000 13282
4 132 kV 18130 980 960 1940 20070
Total transmission line 36113 4945 3660 8605 44718
D Transformation capacity (MVA):
1 765/ 400 kV 9000 4000 3000 7000 16000
2 400/ 220 kV 16585 3000 5000 8000 24585
3 220/ 132 kV 29750 4020 5370 9390 39140
4 132/33 kV 37221 3848 4294 8142 45363
Total transformation capacity 92556 14868 17664 32532 125088
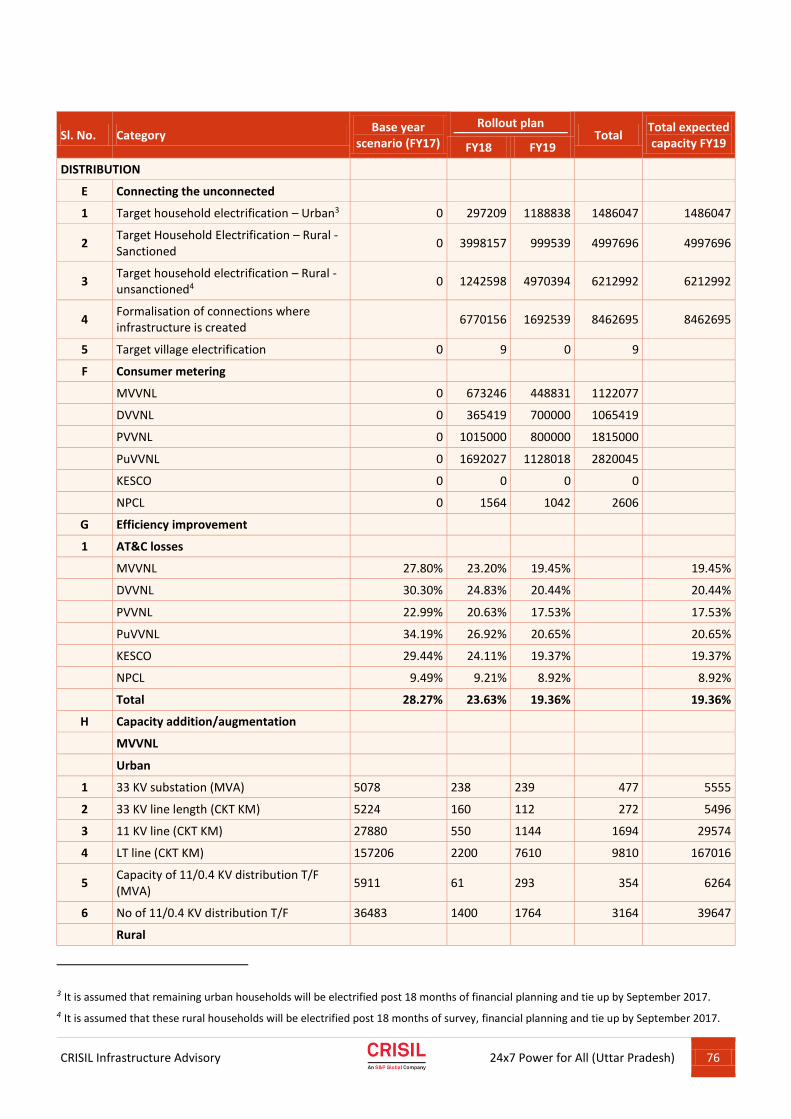
CRISIL Infrastructure Advisory
24x7 Power for All (Uttar Pradesh) 76
Sl. No. Category Base year
scenario (FY17)
Rollout plan Total
Total expected capacity FY19 FY18 FY19
DISTRIBUTION
E Connecting the unconnected
1 Target household electrification – Urban3 0 297209 1188838 1486047 1486047
2 Target Household Electrification – Rural - Sanctioned
0 3998157 999539 4997696 4997696
3 Target household electrification – Rural - unsanctioned4
0 1242598 4970394 6212992 6212992
4 Formalisation of connections where infrastructure is created
6770156 1692539 8462695 8462695
5 Target village electrification 0 9 0 9
F Consumer metering
MVVNL 0 673246 448831 1122077
DVVNL 0 365419 700000 1065419
PVVNL 0 1015000 800000 1815000
PuVVNL 0 1692027 1128018 2820045
KESCO 0 0 0 0
NPCL 0 1564 1042 2606
G Efficiency improvement
1 AT&C losses
MVVNL 27.80% 23.20% 19.45% 19.45%
DVVNL 30.30% 24.83% 20.44% 20.44%
PVVNL 22.99% 20.63% 17.53% 17.53%
PuVVNL 34.19% 26.92% 20.65% 20.65%
KESCO 29.44% 24.11% 19.37% 19.37%
NPCL 9.49% 9.21% 8.92% 8.92%
Total 28.27% 23.63% 19.36% 19.36%
H Capacity addition/augmentation
MVVNL
Urban
1 33 KV substation (MVA) 5078 238 239 477 5555
2 33 KV line length (CKT KM) 5224 160 112 272 5496
3 11 KV line (CKT KM) 27880 550 1144 1694 29574
4 LT line (CKT KM) 157206 2200 7610 9810 167016
5 Capacity of 11/0.4 KV distribution T/F (MVA)
5911 61 293 354 6264
6 No of 11/0.4 KV distribution T/F 36483 1400 1764 3164 39647
Rural
3 It is assumed that remaining urban households will be electrified post 18 months of financial planning and tie up by September 2017.
4 It is assumed that these rural households will be electrified post 18 months of survey, financial planning and tie up by September 2017.
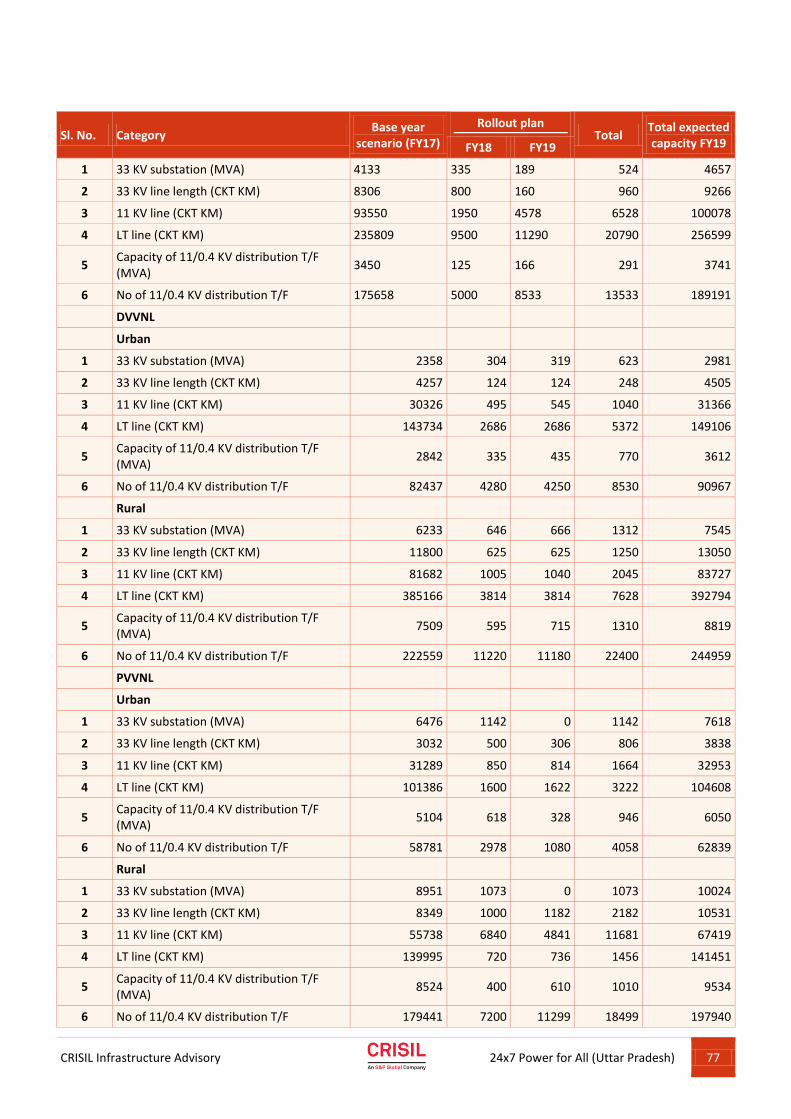
CRISIL Infrastructure Advisory
24x7 Power for All (Uttar Pradesh) 77
Sl. No. Category Base year
scenario (FY17)
Rollout plan Total
Total expected capacity FY19 FY18 FY19
1 33 KV substation (MVA) 4133 335 189 524 4657
2 33 KV line length (CKT KM) 8306 800 160 960 9266
3 11 KV line (CKT KM) 93550 1950 4578 6528 100078
4 LT line (CKT KM) 235809 9500 11290 20790 256599
5 Capacity of 11/0.4 KV distribution T/F (MVA)
3450 125 166 291 3741
6 No of 11/0.4 KV distribution T/F 175658 5000 8533 13533 189191
DVVNL
Urban
1 33 KV substation (MVA) 2358 304 319 623 2981
2 33 KV line length (CKT KM) 4257 124 124 248 4505
3 11 KV line (CKT KM) 30326 495 545 1040 31366
4 LT line (CKT KM) 143734 2686 2686 5372 149106
5 Capacity of 11/0.4 KV distribution T/F (MVA)
2842 335 435 770 3612
6 No of 11/0.4 KV distribution T/F 82437 4280 4250 8530 90967
Rural
1 33 KV substation (MVA) 6233 646 666 1312 7545
2 33 KV line length (CKT KM) 11800 625 625 1250 13050
3 11 KV line (CKT KM) 81682 1005 1040 2045 83727
4 LT line (CKT KM) 385166 3814 3814 7628 392794
5 Capacity of 11/0.4 KV distribution T/F (MVA)
7509 595 715 1310 8819
6 No of 11/0.4 KV distribution T/F 222559 11220 11180 22400 244959
PVVNL
Urban
1 33 KV substation (MVA) 6476 1142 0 1142 7618
2 33 KV line length (CKT KM) 3032 500 306 806 3838
3 11 KV line (CKT KM) 31289 850 814 1664 32953
4 LT line (CKT KM) 101386 1600 1622 3222 104608
5 Capacity of 11/0.4 KV distribution T/F (MVA)
5104 618 328 946 6050
6 No of 11/0.4 KV distribution T/F 58781 2978 1080 4058 62839
Rural
1 33 KV substation (MVA) 8951 1073 0 1073 10024
2 33 KV line length (CKT KM) 8349 1000 1182 2182 10531
3 11 KV line (CKT KM) 55738 6840 4841 11681 67419
4 LT line (CKT KM) 139995 720 736 1456 141451
5 Capacity of 11/0.4 KV distribution T/F (MVA)
8524 400 610 1010 9534
6 No of 11/0.4 KV distribution T/F 179441 7200 11299 18499 197940
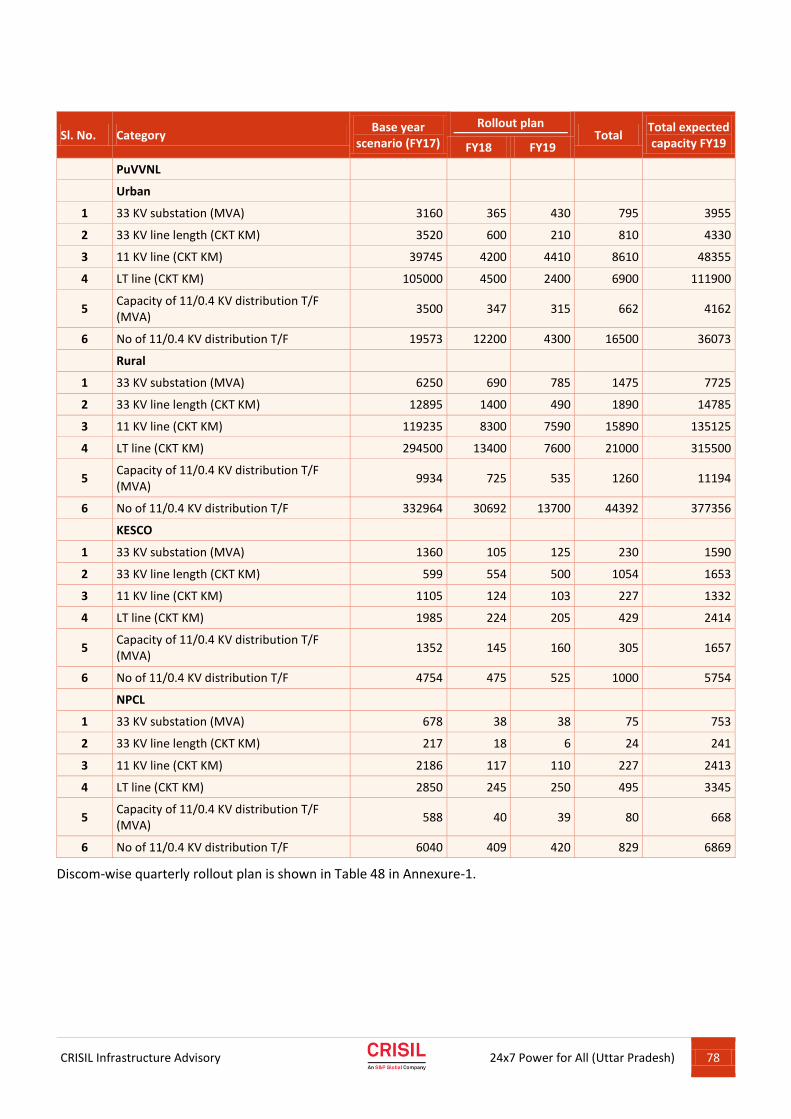
CRISIL Infrastructure Advisory
24x7 Power for All (Uttar Pradesh) 78
Sl. No. Category Base year
scenario (FY17)
Rollout plan Total
Total expected capacity FY19 FY18 FY19
PuVVNL
Urban
1 33 KV substation (MVA) 3160 365 430 795 3955
2 33 KV line length (CKT KM) 3520 600 210 810 4330
3 11 KV line (CKT KM) 39745 4200 4410 8610 48355
4 LT line (CKT KM) 105000 4500 2400 6900 111900
5 Capacity of 11/0.4 KV distribution T/F (MVA)
3500 347 315 662 4162
6 No of 11/0.4 KV distribution T/F 19573 12200 4300 16500 36073
Rural
1 33 KV substation (MVA) 6250 690 785 1475 7725
2 33 KV line length (CKT KM) 12895 1400 490 1890 14785
3 11 KV line (CKT KM) 119235 8300 7590 15890 135125
4 LT line (CKT KM) 294500 13400 7600 21000 315500
5 Capacity of 11/0.4 KV distribution T/F (MVA)
9934 725 535 1260 11194
6 No of 11/0.4 KV distribution T/F 332964 30692 13700 44392 377356
KESCO
1 33 KV substation (MVA) 1360 105 125 230 1590
2 33 KV line length (CKT KM) 599 554 500 1054 1653
3 11 KV line (CKT KM) 1105 124 103 227 1332
4 LT line (CKT KM) 1985 224 205 429 2414
5 Capacity of 11/0.4 KV distribution T/F (MVA)
1352 145 160 305 1657
6 No of 11/0.4 KV distribution T/F 4754 475 525 1000 5754
NPCL
1 33 KV substation (MVA) 678 38 38 75 753
2 33 KV line length (CKT KM) 217 18 6 24 241
3 11 KV line (CKT KM) 2186 117 110 227 2413
4 LT line (CKT KM) 2850 245 250 495 3345
5 Capacity of 11/0.4 KV distribution T/F (MVA)
588 40 39 80 668
6 No of 11/0.4 KV distribution T/F 6040 409 420 829 6869
Discom-wise quarterly rollout plan is shown in Table 48 in Annexure-1.
CRISIL Infrastructure Advisory
24x7 Power for All (Uttar Pradesh) 79
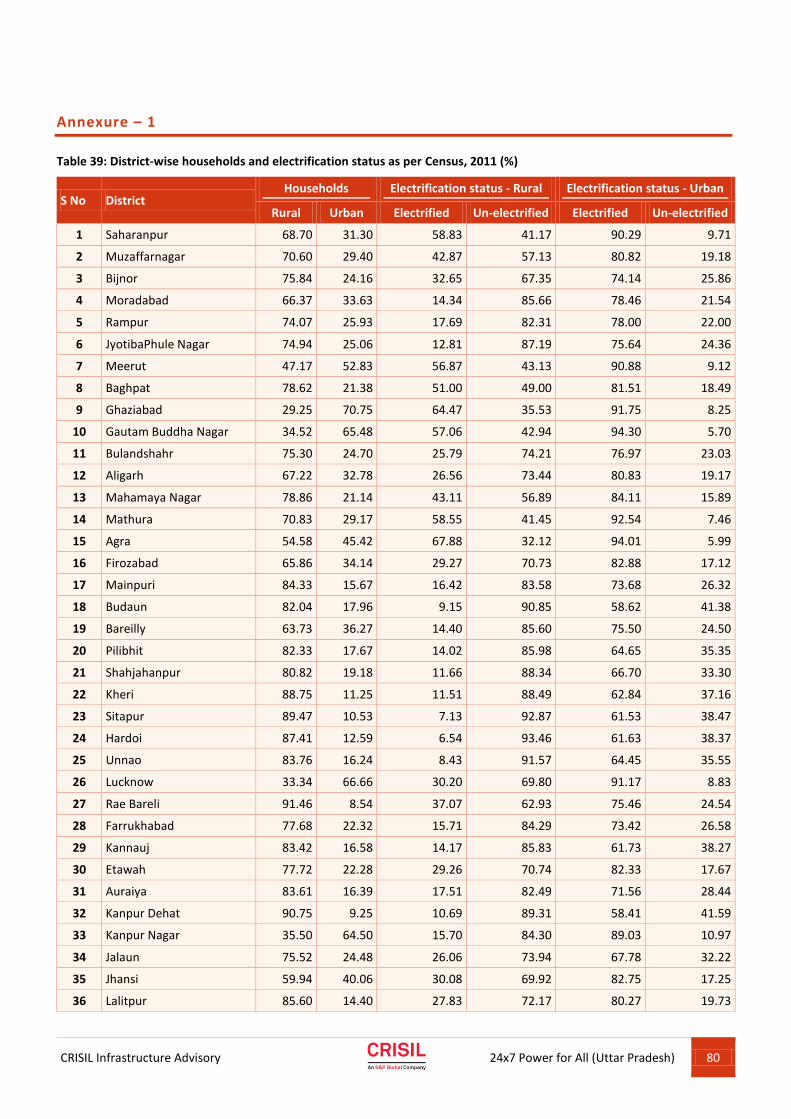
CRISIL Infrastructure Advisory
24x7 Power for All (Uttar Pradesh) 80
Annexure – 1
Table 39: District-wise households and electrification status as per Census, 2011 (%)
S No District Households Electrification status - Rural Electrification status - Urban
Rural Urban Electrified Un-electrified Electrified Un-electrified
1 Saharanpur 68.70 31.30 58.83 41.17 90.29 9.71
2 Muzaffarnagar 70.60 29.40 42.87 57.13 80.82 19.18
3 Bijnor 75.84 24.16 32.65 67.35 74.14 25.86
4 Moradabad 66.37 33.63 14.34 85.66 78.46 21.54
5 Rampur 74.07 25.93 17.69 82.31 78.00 22.00
6 JyotibaPhule Nagar 74.94 25.06 12.81 87.19 75.64 24.36
7 Meerut 47.17 52.83 56.87 43.13 90.88 9.12
8 Baghpat 78.62 21.38 51.00 49.00 81.51 18.49
9 Ghaziabad 29.25 70.75 64.47 35.53 91.75 8.25
10 Gautam Buddha Nagar 34.52 65.48 57.06 42.94 94.30 5.70
11 Bulandshahr 75.30 24.70 25.79 74.21 76.97 23.03
12 Aligarh 67.22 32.78 26.56 73.44 80.83 19.17
13 Mahamaya Nagar 78.86 21.14 43.11 56.89 84.11 15.89
14 Mathura 70.83 29.17 58.55 41.45 92.54 7.46
15 Agra 54.58 45.42 67.88 32.12 94.01 5.99
16 Firozabad 65.86 34.14 29.27 70.73 82.88 17.12
17 Mainpuri 84.33 15.67 16.42 83.58 73.68 26.32
18 Budaun 82.04 17.96 9.15 90.85 58.62 41.38
19 Bareilly 63.73 36.27 14.40 85.60 75.50 24.50
20 Pilibhit 82.33 17.67 14.02 85.98 64.65 35.35
21 Shahjahanpur 80.82 19.18 11.66 88.34 66.70 33.30
22 Kheri 88.75 11.25 11.51 88.49 62.84 37.16
23 Sitapur 89.47 10.53 7.13 92.87 61.53 38.47
24 Hardoi 87.41 12.59 6.54 93.46 61.63 38.37
25 Unnao 83.76 16.24 8.43 91.57 64.45 35.55
26 Lucknow 33.34 66.66 30.20 69.80 91.17 8.83
27 Rae Bareli 91.46 8.54 37.07 62.93 75.46 24.54
28 Farrukhabad 77.68 22.32 15.71 84.29 73.42 26.58
29 Kannauj 83.42 16.58 14.17 85.83 61.73 38.27
30 Etawah 77.72 22.28 29.26 70.74 82.33 17.67
31 Auraiya 83.61 16.39 17.51 82.49 71.56 28.44
32 Kanpur Dehat 90.75 9.25 10.69 89.31 58.41 41.59
33 Kanpur Nagar 35.50 64.50 15.70 84.30 89.03 10.97
34 Jalaun 75.52 24.48 26.06 73.94 67.78 32.22
35 Jhansi 59.94 40.06 30.08 69.92 82.75 17.25
36 Lalitpur 85.60 14.40 27.83 72.17 80.27 19.73
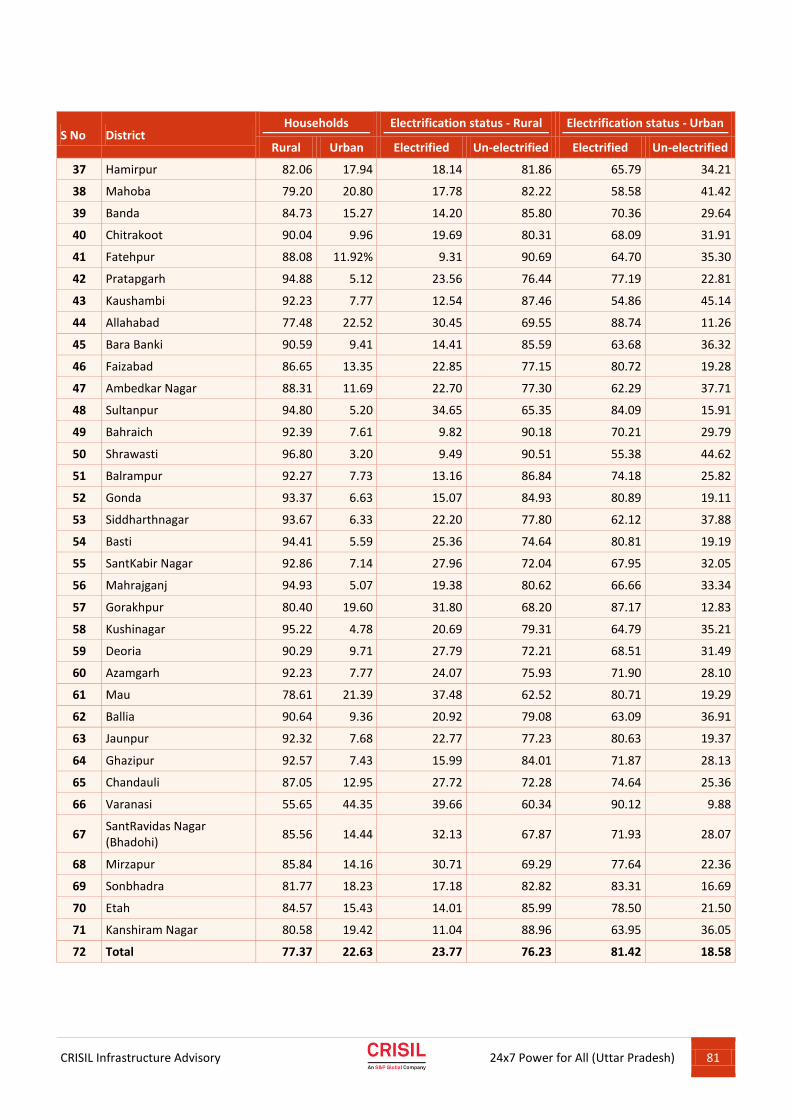
CRISIL Infrastructure Advisory
24x7 Power for All (Uttar Pradesh) 81
S No District Households Electrification status - Rural Electrification status - Urban
Rural Urban Electrified Un-electrified Electrified Un-electrified
37 Hamirpur 82.06 17.94 18.14 81.86 65.79 34.21
38 Mahoba 79.20 20.80 17.78 82.22 58.58 41.42
39 Banda 84.73 15.27 14.20 85.80 70.36 29.64
40 Chitrakoot 90.04 9.96 19.69 80.31 68.09 31.91
41 Fatehpur 88.08 11.92% 9.31 90.69 64.70 35.30
42 Pratapgarh 94.88 5.12 23.56 76.44 77.19 22.81
43 Kaushambi 92.23 7.77 12.54 87.46 54.86 45.14
44 Allahabad 77.48 22.52 30.45 69.55 88.74 11.26
45 Bara Banki 90.59 9.41 14.41 85.59 63.68 36.32
46 Faizabad 86.65 13.35 22.85 77.15 80.72 19.28
47 Ambedkar Nagar 88.31 11.69 22.70 77.30 62.29 37.71
48 Sultanpur 94.80 5.20 34.65 65.35 84.09 15.91
49 Bahraich 92.39 7.61 9.82 90.18 70.21 29.79
50 Shrawasti 96.80 3.20 9.49 90.51 55.38 44.62
51 Balrampur 92.27 7.73 13.16 86.84 74.18 25.82
52 Gonda 93.37 6.63 15.07 84.93 80.89 19.11
53 Siddharthnagar 93.67 6.33 22.20 77.80 62.12 37.88
54 Basti 94.41 5.59 25.36 74.64 80.81 19.19
55 SantKabir Nagar 92.86 7.14 27.96 72.04 67.95 32.05
56 Mahrajganj 94.93 5.07 19.38 80.62 66.66 33.34
57 Gorakhpur 80.40 19.60 31.80 68.20 87.17 12.83
58 Kushinagar 95.22 4.78 20.69 79.31 64.79 35.21
59 Deoria 90.29 9.71 27.79 72.21 68.51 31.49
60 Azamgarh 92.23 7.77 24.07 75.93 71.90 28.10
61 Mau 78.61 21.39 37.48 62.52 80.71 19.29
62 Ballia 90.64 9.36 20.92 79.08 63.09 36.91
63 Jaunpur 92.32 7.68 22.77 77.23 80.63 19.37
64 Ghazipur 92.57 7.43 15.99 84.01 71.87 28.13
65 Chandauli 87.05 12.95 27.72 72.28 74.64 25.36
66 Varanasi 55.65 44.35 39.66 60.34 90.12 9.88
67 SantRavidas Nagar (Bhadohi)
85.56 14.44 32.13 67.87 71.93 28.07
68 Mirzapur 85.84 14.16 30.71 69.29 77.64 22.36
69 Sonbhadra 81.77 18.23 17.18 82.82 83.31 16.69
70 Etah 84.57 15.43 14.01 85.99 78.50 21.50
71 Kanshiram Nagar 80.58 19.42 11.04 88.96 63.95 36.05
72 Total 77.37 22.63 23.77 76.23 81.42 18.58

CRISIL Infrastructure Advisory
24x7 Power for All (Uttar Pradesh) 82
Table 40: Projected category-wise sales (in MU) combined for six distribution utilities
Categories Projections
FY17 FY18 FY19
Domestic 35427 46092 57423
Commercial 5762 6354 7010
Public lamps 937 1003 1076
Public & private institutions 1601 1699 1807
Small private tubewell 10199 10709 10849
Small industries 3244 3433 3636
Public water works 1900 2098 2324
State tubewells 3249 3411 3582
Temporary connections 261 316 384
Departmental employees 555 606 663
Non-industrial bulk load 2877 3236 3644
Large & heavy industries 12849 13698 14621
Railway traction 1051 1148 1265
Medium & large pumped canals 1021 1068 1117
Extra & bulk sales 2855 2858 2862
Energy efficiency 0 -2598 -9092
Total 83789 95131 103173
Table 41: Energy requirement (in MU) and peak demand (in MW) for MVVNL
Particulars FY17 FY18 FY19 FY20 FY21 FY22
Total sale (MU) 14250 16270 17616 19859 21393 23072
Distribution loss 18.31% 14.71% 12.17% 11.99% 11.99% 11.99%
Energy input at distribution interface 17444 19076 20058 22566 24309 26217
Intra-state transmission losses 3.59% 3.59% 3.59% 3.59% 3.59% 3.59%
Total energy requirement at state boundary (MU) 18093 19786 20805 23406 25214 27193
Load factor 71.6% 74.9% 74.1% 74.1% 74.1% 74.1%
Maximum demand (MW) 2885 3014 3204 3604 3883 4187
Table 42: Energy requirement (in MU) and peak demand (in MW) for DVVNL
Particulars FY17 FY18 FY19 FY20 FY21 FY22
Total sale (MU) 22307 25805 28261 32840 36291 40153
Distribution loss 21.49% 16.81% 13.47% 12.47% 12.47% 12.47%
Energy input at distribution interface 28411 31020 32661 37518 41462 45874
Intra-state transmission losses 3.59% 3.59% 3.59% 3.59% 3.59% 3.59%
Total energy requirement at state boundary (MU) 29469 32175 33877 38915 43006 47582
Load factor 71.6% 74.9% 74.1% 74.1% 74.1% 74.1%
Maximum demand (MW) 4699 4902 5217 5992 6622 7327
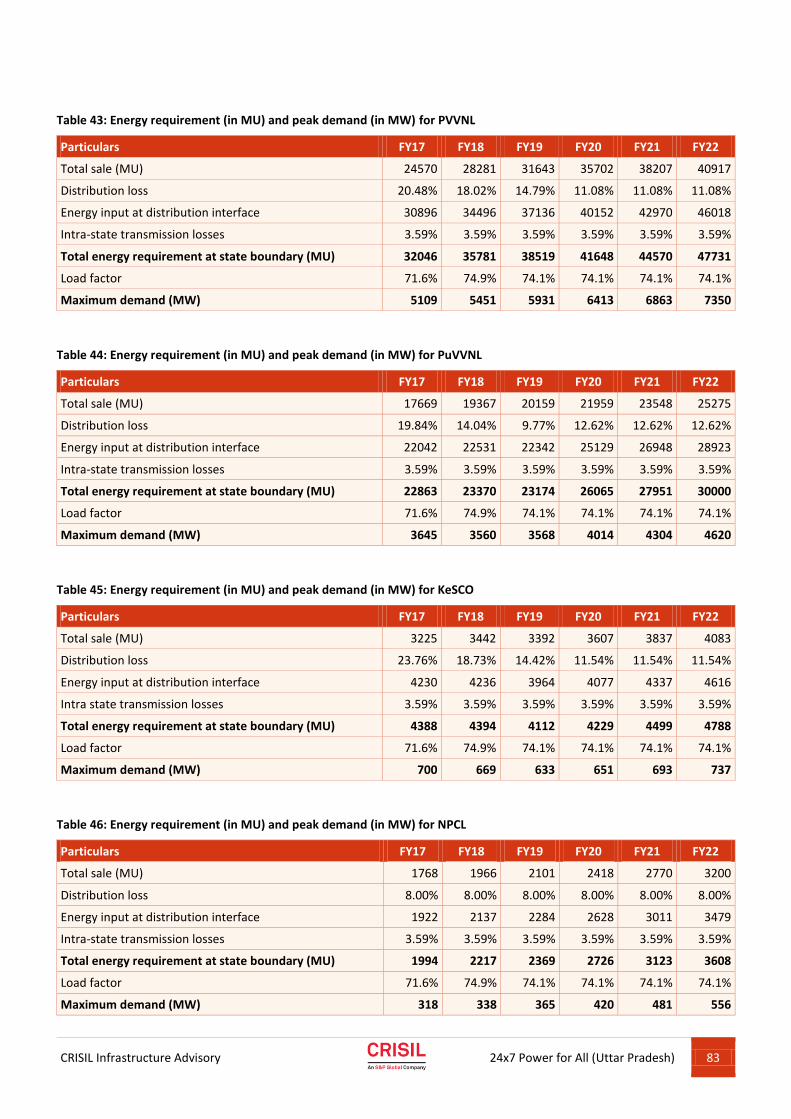
CRISIL Infrastructure Advisory
24x7 Power for All (Uttar Pradesh) 83
Table 43: Energy requirement (in MU) and peak demand (in MW) for PVVNL
Particulars FY17 FY18 FY19 FY20 FY21 FY22
Total sale (MU) 24570 28281 31643 35702 38207 40917
Distribution loss 20.48% 18.02% 14.79% 11.08% 11.08% 11.08%
Energy input at distribution interface 30896 34496 37136 40152 42970 46018
Intra-state transmission losses 3.59% 3.59% 3.59% 3.59% 3.59% 3.59%
Total energy requirement at state boundary (MU) 32046 35781 38519 41648 44570 47731
Load factor 71.6% 74.9% 74.1% 74.1% 74.1% 74.1%
Maximum demand (MW) 5109 5451 5931 6413 6863 7350
Table 44: Energy requirement (in MU) and peak demand (in MW) for PuVVNL
Particulars FY17 FY18 FY19 FY20 FY21 FY22
Total sale (MU) 17669 19367 20159 21959 23548 25275
Distribution loss 19.84% 14.04% 9.77% 12.62% 12.62% 12.62%
Energy input at distribution interface 22042 22531 22342 25129 26948 28923
Intra-state transmission losses 3.59% 3.59% 3.59% 3.59% 3.59% 3.59%
Total energy requirement at state boundary (MU) 22863 23370 23174 26065 27951 30000
Load factor 71.6% 74.9% 74.1% 74.1% 74.1% 74.1%
Maximum demand (MW) 3645 3560 3568 4014 4304 4620
Table 45: Energy requirement (in MU) and peak demand (in MW) for KeSCO
Particulars FY17 FY18 FY19 FY20 FY21 FY22
Total sale (MU) 3225 3442 3392 3607 3837 4083
Distribution loss 23.76% 18.73% 14.42% 11.54% 11.54% 11.54%
Energy input at distribution interface 4230 4236 3964 4077 4337 4616
Intra state transmission losses 3.59% 3.59% 3.59% 3.59% 3.59% 3.59%
Total energy requirement at state boundary (MU) 4388 4394 4112 4229 4499 4788
Load factor 71.6% 74.9% 74.1% 74.1% 74.1% 74.1%
Maximum demand (MW) 700 669 633 651 693 737
Table 46: Energy requirement (in MU) and peak demand (in MW) for NPCL
Particulars FY17 FY18 FY19 FY20 FY21 FY22
Total sale (MU) 1768 1966 2101 2418 2770 3200
Distribution loss 8.00% 8.00% 8.00% 8.00% 8.00% 8.00%
Energy input at distribution interface 1922 2137 2284 2628 3011 3479
Intra-state transmission losses 3.59% 3.59% 3.59% 3.59% 3.59% 3.59%
Total energy requirement at state boundary (MU) 1994 2217 2369 2726 3123 3608
Load factor 71.6% 74.9% 74.1% 74.1% 74.1% 74.1%
Maximum demand (MW) 318 338 365 420 481 556
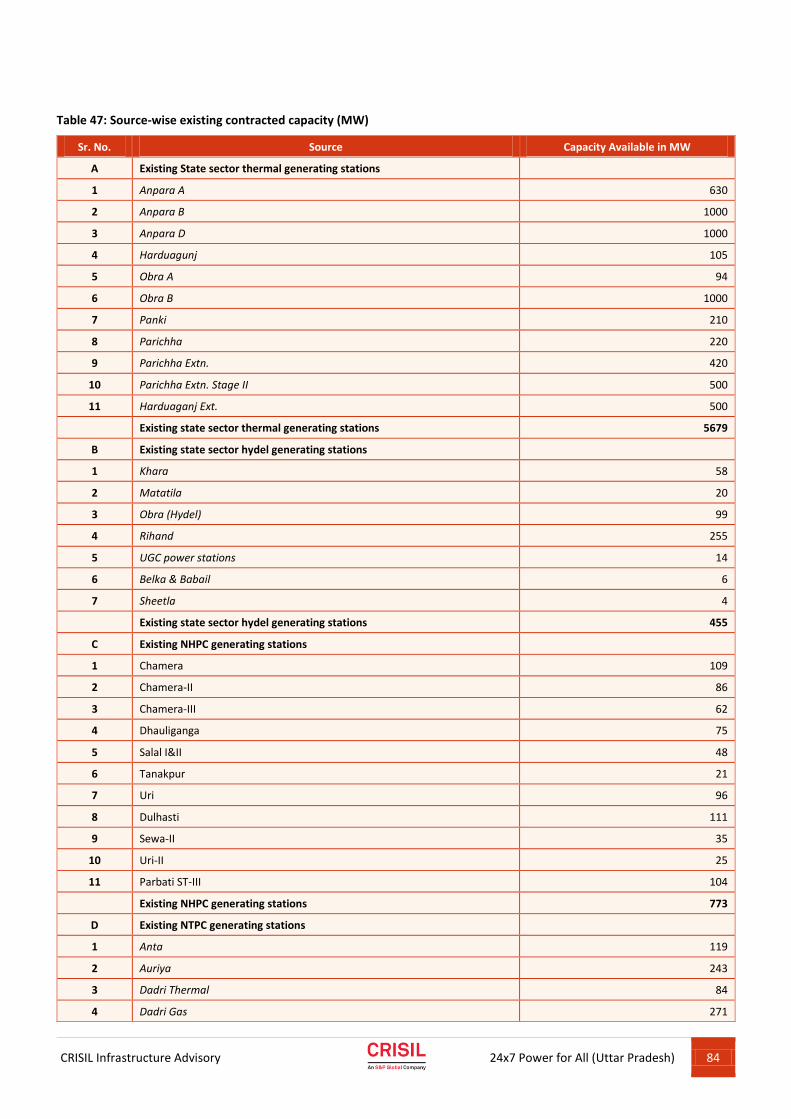
CRISIL Infrastructure Advisory
24x7 Power for All (Uttar Pradesh) 84
Table 47: Source-wise existing contracted capacity (MW)
Sr. No. Source Capacity Available in MW
A Existing State sector thermal generating stations
1 Anpara A 630
2 Anpara B 1000
3 Anpara D 1000
4 Harduagunj 105
5 Obra A 94
6 Obra B 1000
7 Panki 210
8 Parichha 220
9 Parichha Extn. 420
10 Parichha Extn. Stage II 500
11 Harduaganj Ext. 500
Existing state sector thermal generating stations 5679
B Existing state sector hydel generating stations
1 Khara 58
2 Matatila 20
3 Obra (Hydel) 99
4 Rihand 255
5 UGC power stations 14
6 Belka & Babail 6
7 Sheetla 4
Existing state sector hydel generating stations 455
C Existing NHPC generating stations
1 Chamera 109
2 Chamera-II 86
3 Chamera-III 62
4 Dhauliganga 75
5 Salal I&II 48
6 Tanakpur 21
7 Uri 96
8 Dulhasti 111
9 Sewa-II 35
10 Uri-II 25
11 Parbati ST-III 104
Existing NHPC generating stations 773
D Existing NTPC generating stations
1 Anta 119
2 Auriya 243
3 Dadri Thermal 84
4 Dadri Gas 271
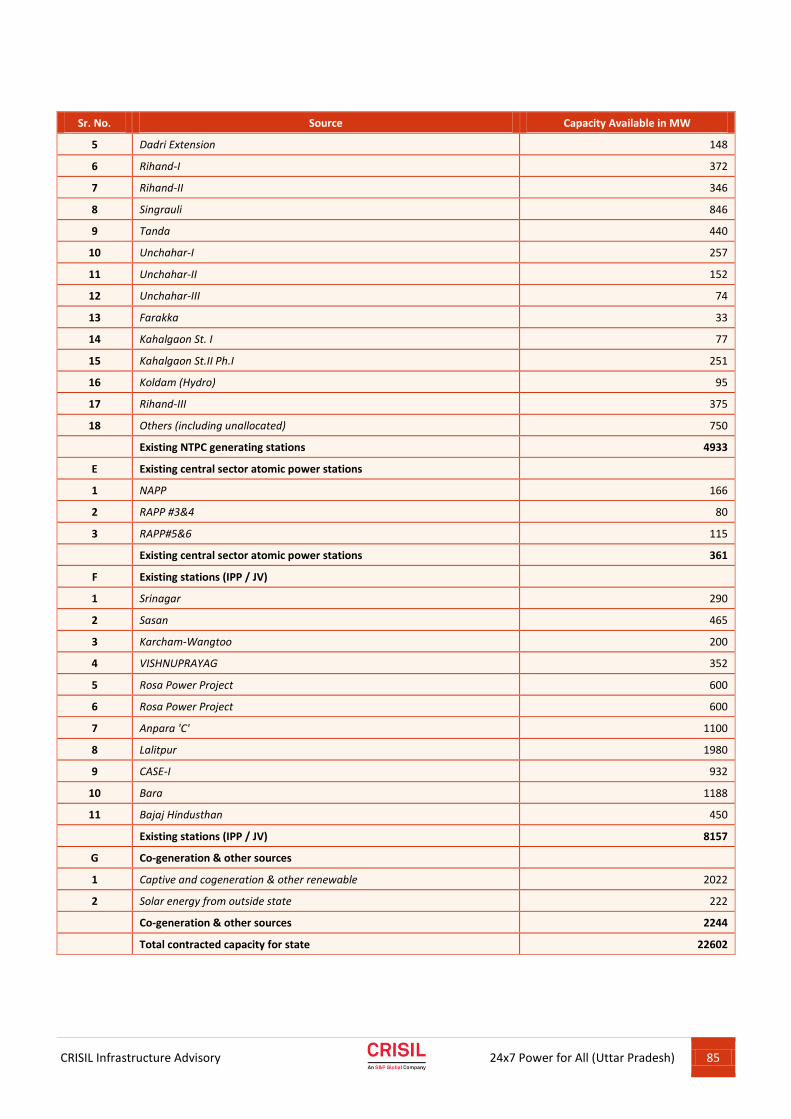
CRISIL Infrastructure Advisory
24x7 Power for All (Uttar Pradesh) 85
Sr. No. Source Capacity Available in MW
5 Dadri Extension 148
6 Rihand-I 372
7 Rihand-II 346
8 Singrauli 846
9 Tanda 440
10 Unchahar-I 257
11 Unchahar-II 152
12 Unchahar-III 74
13 Farakka 33
14 Kahalgaon St. I 77
15 Kahalgaon St.II Ph.I 251
16 Koldam (Hydro) 95
17 Rihand-III 375
18 Others (including unallocated) 750
Existing NTPC generating stations 4933
E Existing central sector atomic power stations
1 NAPP 166
2 RAPP #3&4 80
3 RAPP#5&6 115
Existing central sector atomic power stations 361
F Existing stations (IPP / JV)
1 Srinagar 290
2 Sasan 465
3 Karcham-Wangtoo 200
4 VISHNUPRAYAG 352
5 Rosa Power Project 600
6 Rosa Power Project 600
7 Anpara 'C' 1100
8 Lalitpur 1980
9 CASE-I 932
10 Bara 1188
11 Bajaj Hindusthan 450
Existing stations (IPP / JV) 8157
G Co-generation & other sources
1 Captive and cogeneration & other renewable 2022
2 Solar energy from outside state 222
Co-generation & other sources 2244
Total contracted capacity for state 22602
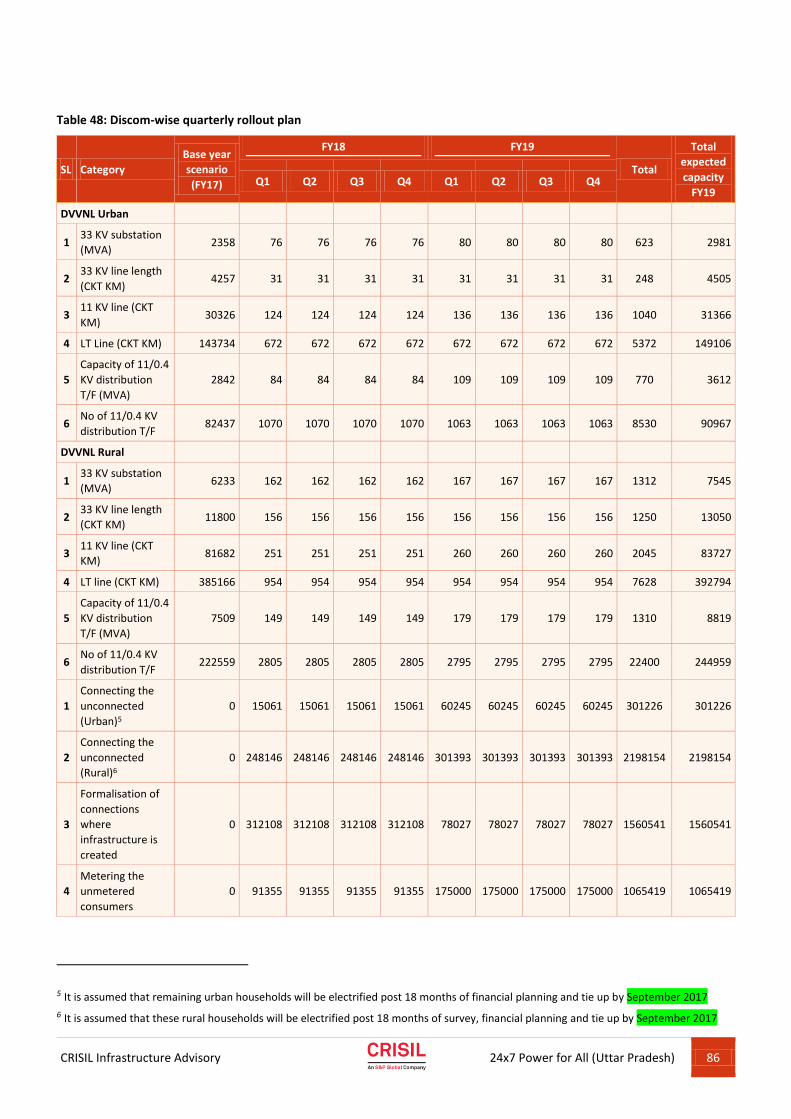
CRISIL Infrastructure Advisory
24x7 Power for All (Uttar Pradesh) 86
Table 48: Discom-wise quarterly rollout plan
SL Category
Base year
scenario
(FY17)
FY18 FY19
Total
Total
expected
capacity
FY19 Q1 Q2 Q3 Q4 Q1 Q2 Q3 Q4
DVVNL Urban
1 33 KV substation
(MVA) 2358 76 76 76 76 80 80 80 80 623 2981
2 33 KV line length
(CKT KM) 4257 31 31 31 31 31 31 31 31 248 4505
3 11 KV line (CKT
KM) 30326 124 124 124 124 136 136 136 136 1040 31366
4 LT Line (CKT KM) 143734 672 672 672 672 672 672 672 672 5372 149106
5
Capacity of 11/0.4
KV distribution
T/F (MVA)
2842 84 84 84 84 109 109 109 109 770 3612
6 No of 11/0.4 KV
distribution T/F 82437 1070 1070 1070 1070 1063 1063 1063 1063 8530 90967
DVVNL Rural
1 33 KV substation
(MVA) 6233 162 162 162 162 167 167 167 167 1312 7545
2 33 KV line length
(CKT KM) 11800 156 156 156 156 156 156 156 156 1250 13050
3 11 KV line (CKT
KM) 81682 251 251 251 251 260 260 260 260 2045 83727
4 LT line (CKT KM) 385166 954 954 954 954 954 954 954 954 7628 392794
5
Capacity of 11/0.4
KV distribution
T/F (MVA)
7509 149 149 149 149 179 179 179 179 1310 8819
6 No of 11/0.4 KV
distribution T/F 222559 2805 2805 2805 2805 2795 2795 2795 2795 22400 244959
1
Connecting the
unconnected
(Urban)5
0 15061 15061 15061 15061 60245 60245 60245 60245 301226 301226
2
Connecting the
unconnected
(Rural)6
0 248146 248146 248146 248146 301393 301393 301393 301393 2198154 2198154
3
Formalisation of
connections
where
infrastructure is
created
0 312108 312108 312108 312108 78027 78027 78027 78027 1560541 1560541
4
Metering the
unmetered
consumers
0 91355 91355 91355 91355 175000 175000 175000 175000 1065419 1065419
5 It is assumed that remaining urban households will be electrified post 18 months of financial planning and tie up by September 2017
6 It is assumed that these rural households will be electrified post 18 months of survey, financial planning and tie up by September 2017

CRISIL Infrastructure Advisory
24x7 Power for All (Uttar Pradesh) 87
SL Category
Base year
scenario
(FY17)
FY18 FY19
Total
Total
expected
capacity
FY19 Q1 Q2 Q3 Q4 Q1 Q2 Q3 Q4
PuVVNL Urban
1 33 KV substation
(MVA) 3160 91 91 91 91 108 108 108 108 795 3955
2 33 KV line length
(CKT KM) 3520 150 150 150 150 53 53 53 53 810 4330
3 11 KV line (CKT
KM) 39745 1050 1050 1050 1050 1103 1103 1103 1103 8610 48355
4 LT line (CKT KM) 105000 1125 1125 1125 1125 600 600 600 600 6900 111900
5
Capacity of 11/0.4
KV distribution
T/F (MVA)
3500 87 87 87 87 79 79 79 79 662 4162
6 No of 11/0.4 KV
distribution T/F 19573 3050 3050 3050 3050 1075 1075 1075 1075 16500 36073
PuVVNL Rural
1 33 KV substation
(MVA) 6250 173 173 173 173 196 196 196 196 1475 7725
2 33 KV line length
(CKT KM) 12895 350 350 350 350 123 123 123 123 1890 14785
3 11 KV line (CKT
KM) 119235 2075 2075 2075 2075 1898 1898 1898 1898 15890 135125
4 LT line (CKT KM) 294500 3350 3350 3350 3350 1900 1900 1900 1900 21000 315500
5
Capacity of 11/0.4
KV distribution
T/F (MVA)
9934 181 181 181 181 134 134 134 134 1260 11194
6 No of 11/0.4 KV
distribution T/F 332964 7673 7673 7673 7673 3425 3425 3425 3425 44392 377356
1
Connecting the
unconnected
(Urban) 7
0 15061 15061 15061 15061 60245 60245 60245 60245 301226 301226
2
Connecting the
unconnected
(Rural) 8
0 147816 147816 147816 147816 67504 67504 67504 67504 861282 861282
3
Formalisation of
connections
where
infrastructure is
created
0 236505 236505 236505 236505 59126 59126 59126 59126 1182525 1182525
4
Metering the
unmetered
consumers
0 423007 423007 423007 423007 282005 282005 282005 282005 2820045 2820045
7 It is assumed that remaining urban households will be electrified post 18 months of financial planning and tie up by September 2017.
8 It is assumed that these rural households will be electrified post 18 months of survey, financial planning and tie up by September 2017.
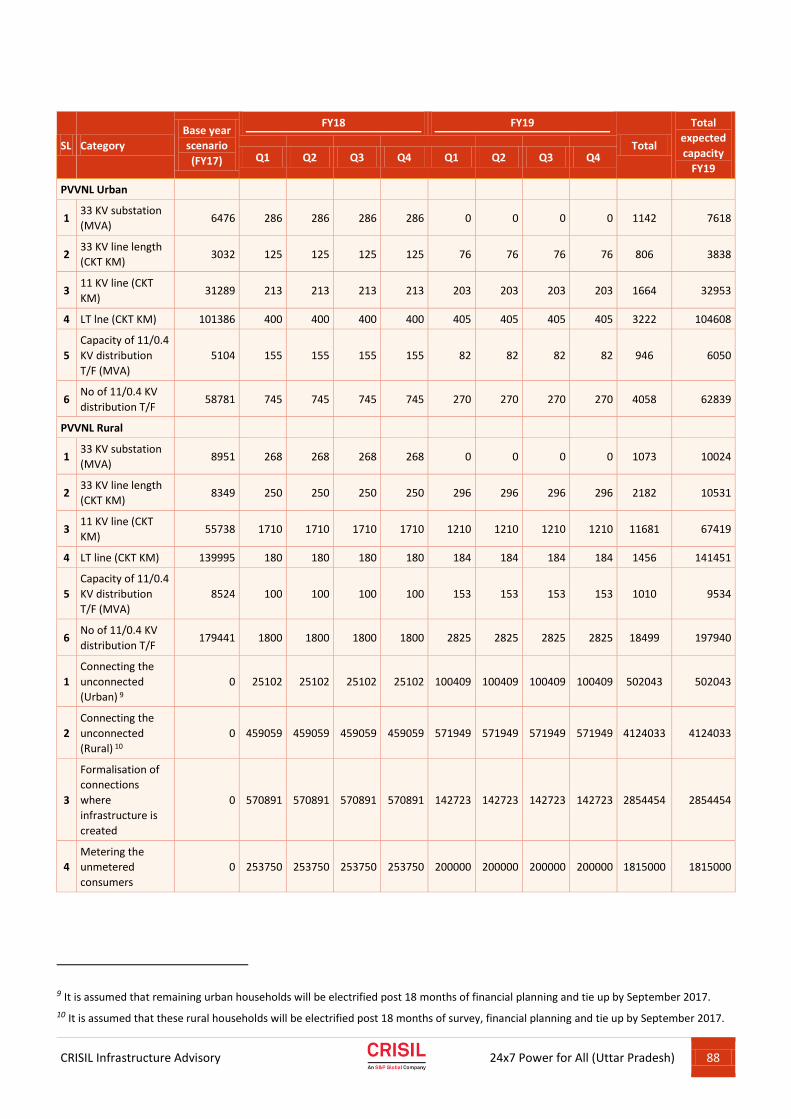
CRISIL Infrastructure Advisory
24x7 Power for All (Uttar Pradesh) 88
SL Category
Base year
scenario
(FY17)
FY18 FY19
Total
Total
expected
capacity
FY19 Q1 Q2 Q3 Q4 Q1 Q2 Q3 Q4
PVVNL Urban
1 33 KV substation
(MVA) 6476 286 286 286 286 0 0 0 0 1142 7618
2 33 KV line length
(CKT KM) 3032 125 125 125 125 76 76 76 76 806 3838
3 11 KV line (CKT
KM) 31289 213 213 213 213 203 203 203 203 1664 32953
4 LT lne (CKT KM) 101386 400 400 400 400 405 405 405 405 3222 104608
5
Capacity of 11/0.4
KV distribution
T/F (MVA)
5104 155 155 155 155 82 82 82 82 946 6050
6 No of 11/0.4 KV
distribution T/F 58781 745 745 745 745 270 270 270 270 4058 62839
PVVNL Rural
1 33 KV substation
(MVA) 8951 268 268 268 268 0 0 0 0 1073 10024
2 33 KV line length
(CKT KM) 8349 250 250 250 250 296 296 296 296 2182 10531
3 11 KV line (CKT
KM) 55738 1710 1710 1710 1710 1210 1210 1210 1210 11681 67419
4 LT line (CKT KM) 139995 180 180 180 180 184 184 184 184 1456 141451
5
Capacity of 11/0.4
KV distribution
T/F (MVA)
8524 100 100 100 100 153 153 153 153 1010 9534
6 No of 11/0.4 KV
distribution T/F 179441 1800 1800 1800 1800 2825 2825 2825 2825 18499 197940
1
Connecting the
unconnected
(Urban) 9
0 25102 25102 25102 25102 100409 100409 100409 100409 502043 502043
2
Connecting the
unconnected
(Rural) 10
0 459059 459059 459059 459059 571949 571949 571949 571949 4124033 4124033
3
Formalisation of
connections
where
infrastructure is
created
0 570891 570891 570891 570891 142723 142723 142723 142723 2854454 2854454
4
Metering the
unmetered
consumers
0 253750 253750 253750 253750 200000 200000 200000 200000 1815000 1815000
9 It is assumed that remaining urban households will be electrified post 18 months of financial planning and tie up by September 2017.
10 It is assumed that these rural households will be electrified post 18 months of survey, financial planning and tie up by September 2017.
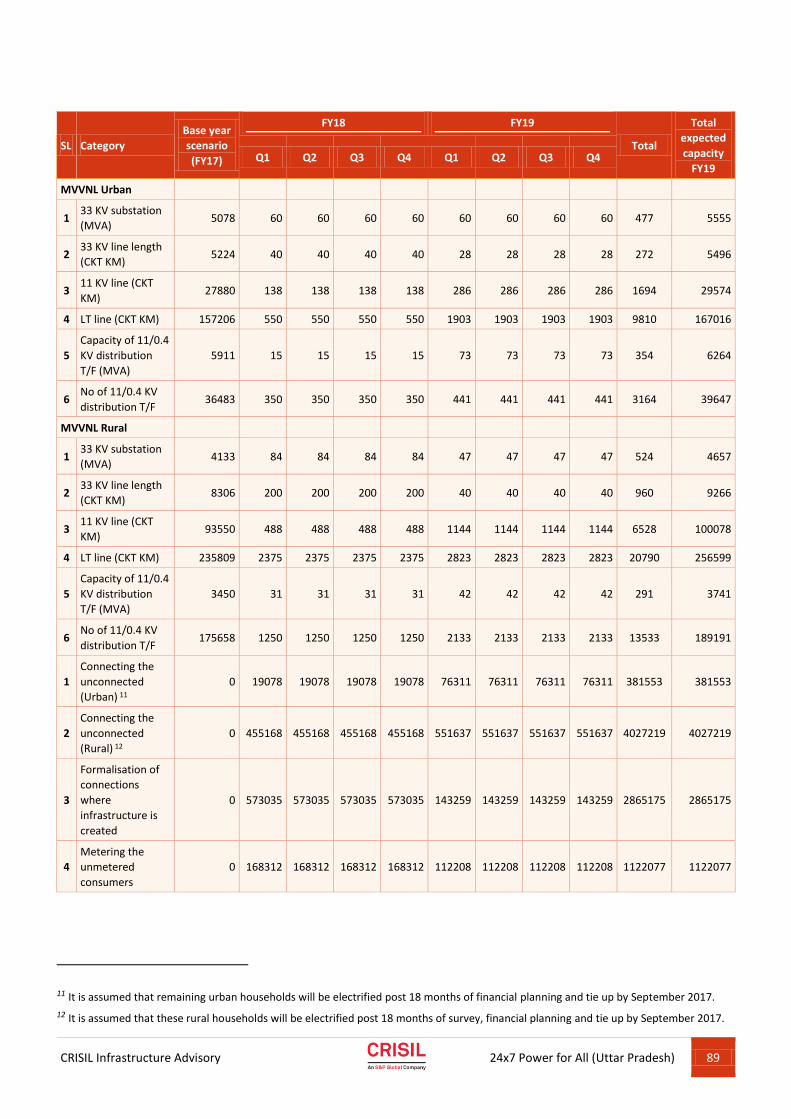
CRISIL Infrastructure Advisory
24x7 Power for All (Uttar Pradesh) 89
SL Category
Base year
scenario
(FY17)
FY18 FY19
Total
Total
expected
capacity
FY19 Q1 Q2 Q3 Q4 Q1 Q2 Q3 Q4
MVVNL Urban
1 33 KV substation
(MVA) 5078 60 60 60 60 60 60 60 60 477 5555
2 33 KV line length
(CKT KM) 5224 40 40 40 40 28 28 28 28 272 5496
3 11 KV line (CKT
KM) 27880 138 138 138 138 286 286 286 286 1694 29574
4 LT line (CKT KM) 157206 550 550 550 550 1903 1903 1903 1903 9810 167016
5
Capacity of 11/0.4
KV distribution
T/F (MVA)
5911 15 15 15 15 73 73 73 73 354 6264
6 No of 11/0.4 KV
distribution T/F 36483 350 350 350 350 441 441 441 441 3164 39647
MVVNL Rural
1 33 KV substation
(MVA) 4133 84 84 84 84 47 47 47 47 524 4657
2 33 KV line length
(CKT KM) 8306 200 200 200 200 40 40 40 40 960 9266
3 11 KV line (CKT
KM) 93550 488 488 488 488 1144 1144 1144 1144 6528 100078
4 LT line (CKT KM) 235809 2375 2375 2375 2375 2823 2823 2823 2823 20790 256599
5
Capacity of 11/0.4
KV distribution
T/F (MVA)
3450 31 31 31 31 42 42 42 42 291 3741
6 No of 11/0.4 KV
distribution T/F 175658 1250 1250 1250 1250 2133 2133 2133 2133 13533 189191
1
Connecting the
unconnected
(Urban) 11
0 19078 19078 19078 19078 76311 76311 76311 76311 381553 381553
2
Connecting the
unconnected
(Rural) 12
0 455168 455168 455168 455168 551637 551637 551637 551637 4027219 4027219
3
Formalisation of
connections
where
infrastructure is
created
0 573035 573035 573035 573035 143259 143259 143259 143259 2865175 2865175
4
Metering the
unmetered
consumers
0 168312 168312 168312 168312 112208 112208 112208 112208 1122077 1122077
11 It is assumed that remaining urban households will be electrified post 18 months of financial planning and tie up by September 2017.
12 It is assumed that these rural households will be electrified post 18 months of survey, financial planning and tie up by September 2017.
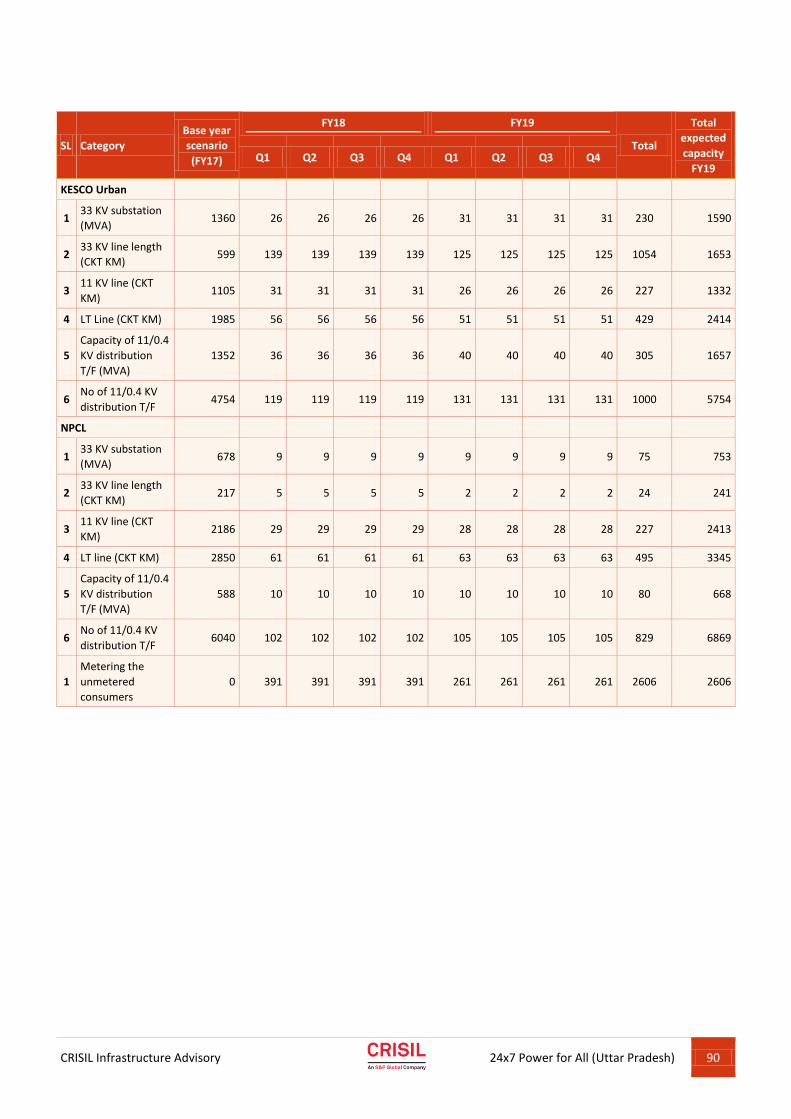
CRISIL Infrastructure Advisory
24x7 Power for All (Uttar Pradesh) 90
SL Category
Base year
scenario
(FY17)
FY18 FY19
Total
Total
expected
capacity
FY19 Q1 Q2 Q3 Q4 Q1 Q2 Q3 Q4
KESCO Urban
1 33 KV substation
(MVA) 1360 26 26 26 26 31 31 31 31 230 1590
2 33 KV line length
(CKT KM) 599 139 139 139 139 125 125 125 125 1054 1653
3 11 KV line (CKT
KM) 1105 31 31 31 31 26 26 26 26 227 1332
4 LT Line (CKT KM) 1985 56 56 56 56 51 51 51 51 429 2414
5
Capacity of 11/0.4
KV distribution
T/F (MVA)
1352 36 36 36 36 40 40 40 40 305 1657
6 No of 11/0.4 KV
distribution T/F 4754 119 119 119 119 131 131 131 131 1000 5754
NPCL
1 33 KV substation
(MVA) 678 9 9 9 9 9 9 9 9 75 753
2 33 KV line length
(CKT KM) 217 5 5 5 5 2 2 2 2 24 241
3 11 KV line (CKT
KM) 2186 29 29 29 29 28 28 28 28 227 2413
4 LT line (CKT KM) 2850 61 61 61 61 63 63 63 63 495 3345
5
Capacity of 11/0.4
KV distribution
T/F (MVA)
588 10 10 10 10 10 10 10 10 80 668
6 No of 11/0.4 KV
distribution T/F 6040 102 102 102 102 105 105 105 105 829 6869
1
Metering the
unmetered
consumers
0 391 391 391 391 261 261 261 261 2606 2606
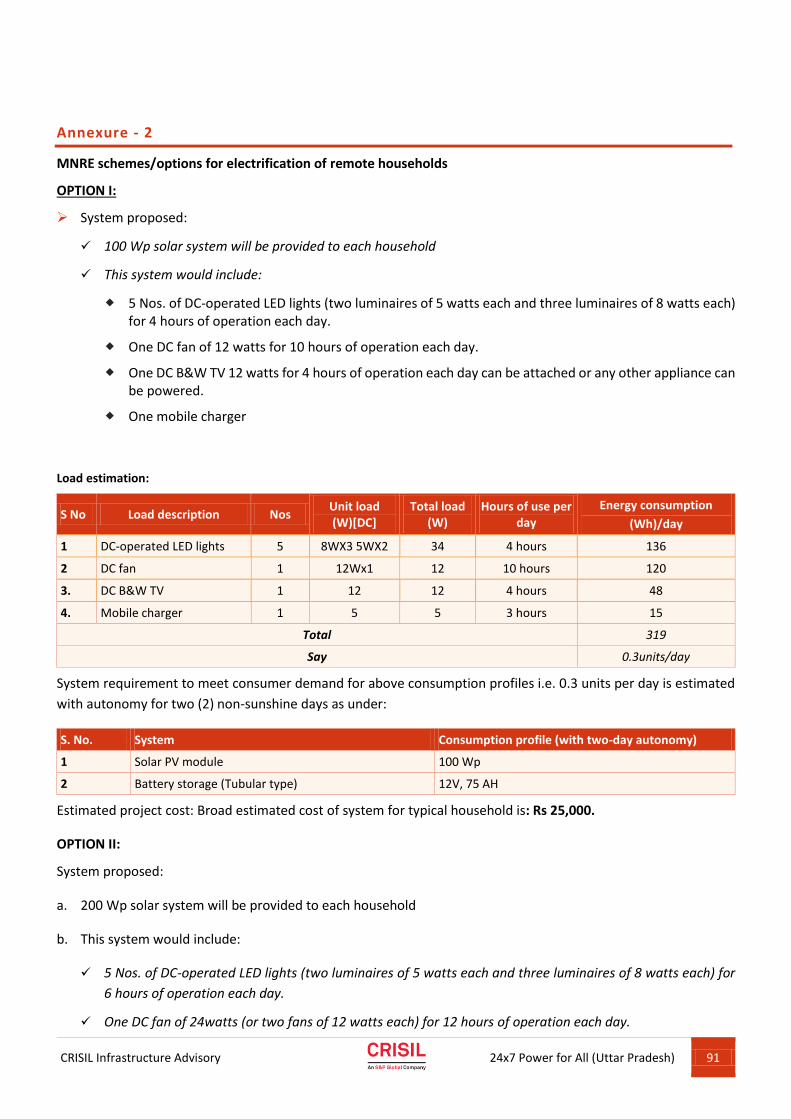
CRISIL Infrastructure Advisory
24x7 Power for All (Uttar Pradesh) 91
Annexure - 2
MNRE schemes/options for electrification of remote households
OPTION I:
System proposed:
100 Wp solar system will be provided to each household
This system would include:
5 Nos. of DC-operated LED lights (two luminaires of 5 watts each and three luminaires of 8 watts each) for 4 hours of operation each day.
One DC fan of 12 watts for 10 hours of operation each day.
One DC B&W TV 12 watts for 4 hours of operation each day can be attached or any other appliance can be powered.
One mobile charger
Load estimation:
S No Load description Nos Unit load (W)[DC]
Total load (W)
Hours of use per day
Energy consumption
(Wh)/day
1 DC-operated LED lights 5 8WX3 5WX2 34 4 hours 136
2 DC fan 1 12Wx1 12 10 hours 120
3. DC B&W TV 1 12 12 4 hours 48
4. Mobile charger 1 5 5 3 hours 15
Total 319
Say 0.3units/day
System requirement to meet consumer demand for above consumption profiles i.e. 0.3 units per day is estimated
with autonomy for two (2) non-sunshine days as under:
S. No. System Consumption profile (with two-day autonomy)
1 Solar PV module 100 Wp
2 Battery storage (Tubular type) 12V, 75 AH
Estimated project cost: Broad estimated cost of system for typical household is: Rs 25,000.
OPTION II:
System proposed:
a. 200 Wp solar system will be provided to each household
b. This system would include:
5 Nos. of DC-operated LED lights (two luminaires of 5 watts each and three luminaires of 8 watts each) for
6 hours of operation each day.
One DC fan of 24watts (or two fans of 12 watts each) for 12 hours of operation each day.
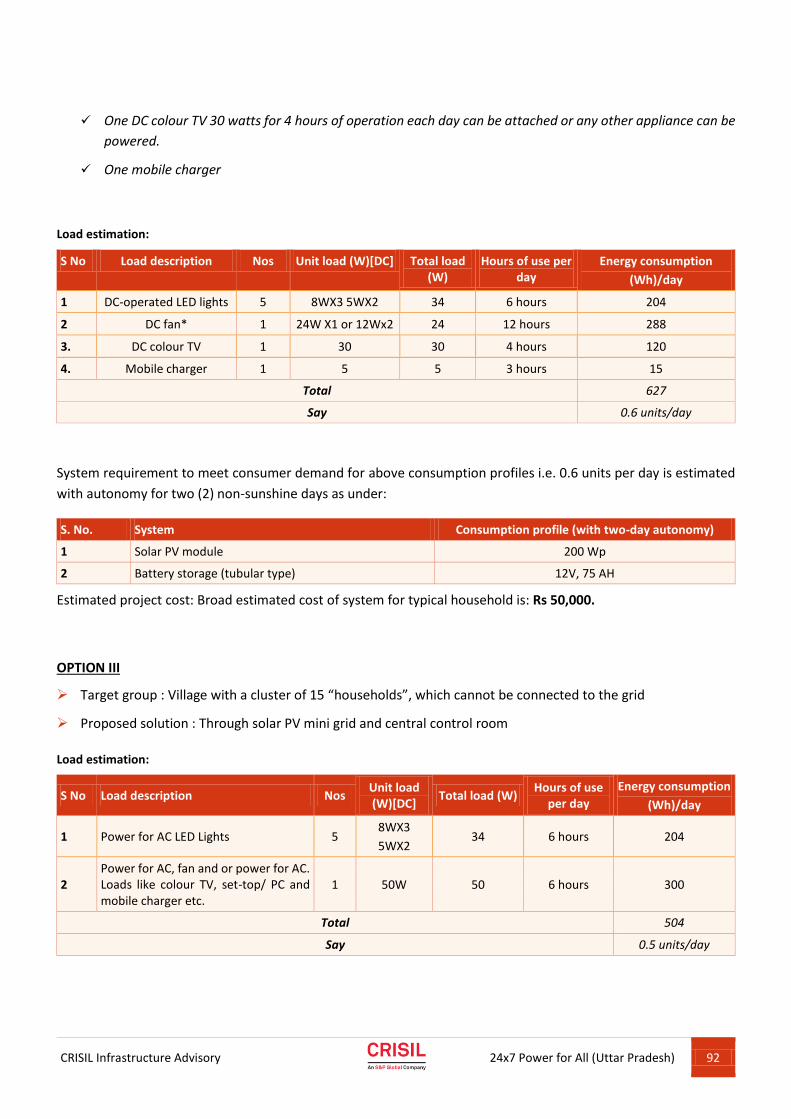
CRISIL Infrastructure Advisory
24x7 Power for All (Uttar Pradesh) 92
One DC colour TV 30 watts for 4 hours of operation each day can be attached or any other appliance can be
powered.
One mobile charger
Load estimation:
S No Load description Nos Unit load (W)[DC] Total load (W)
Hours of use per day
Energy consumption
(Wh)/day
1 DC-operated LED lights 5 8WX3 5WX2 34 6 hours 204
2 DC fan* 1 24W X1 or 12Wx2 24 12 hours 288
3. DC colour TV 1 30 30 4 hours 120
4. Mobile charger 1 5 5 3 hours 15
Total 627
Say 0.6 units/day
System requirement to meet consumer demand for above consumption profiles i.e. 0.6 units per day is estimated
with autonomy for two (2) non-sunshine days as under:
S. No. System Consumption profile (with two-day autonomy)
1 Solar PV module 200 Wp
2 Battery storage (tubular type) 12V, 75 AH
Estimated project cost: Broad estimated cost of system for typical household is: Rs 50,000.
OPTION III
Target group : Village with a cluster of 15 “households”, which cannot be connected to the grid
Proposed solution : Through solar PV mini grid and central control room
Load estimation:
S No Load description Nos Unit load (W)[DC]
Total load (W) Hours of use
per day
Energy consumption
(Wh)/day
1 Power for AC LED Lights 5 8WX3
5WX2 34 6 hours 204
2 Power for AC, fan and or power for AC. Loads like colour TV, set-top/ PC and mobile charger etc.
1 50W 50 6 hours 300
Total 504
Say 0.5 units/day
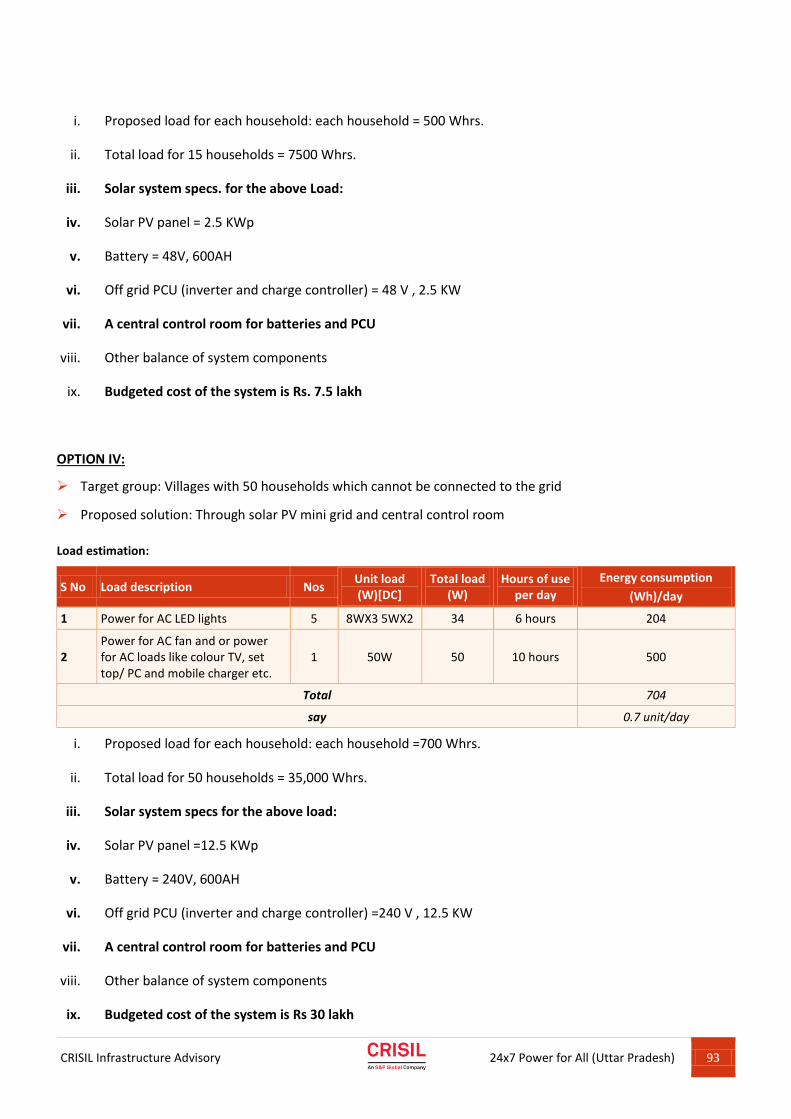
CRISIL Infrastructure Advisory
24x7 Power for All (Uttar Pradesh) 93
i. Proposed load for each household: each household = 500 Whrs.
ii. Total load for 15 households = 7500 Whrs.
iii. Solar system specs. for the above Load:
iv. Solar PV panel = 2.5 KWp
v. Battery = 48V, 600AH
vi. Off grid PCU (inverter and charge controller) = 48 V , 2.5 KW
vii. A central control room for batteries and PCU
viii. Other balance of system components
ix. Budgeted cost of the system is Rs. 7.5 lakh
OPTION IV:
Target group: Villages with 50 households which cannot be connected to the grid
Proposed solution: Through solar PV mini grid and central control room
Load estimation:
S No Load description Nos Unit load (W)[DC]
Total load (W)
Hours of use per day
Energy consumption
(Wh)/day
1 Power for AC LED lights 5 8WX3 5WX2 34 6 hours 204
2 Power for AC fan and or power for AC loads like colour TV, set top/ PC and mobile charger etc.
1 50W 50 10 hours 500
Total 704
say 0.7 unit/day
i. Proposed load for each household: each household =700 Whrs.
ii. Total load for 50 households = 35,000 Whrs.
iii. Solar system specs for the above load:
iv. Solar PV panel =12.5 KWp
v. Battery = 240V, 600AH
vi. Off grid PCU (inverter and charge controller) =240 V , 12.5 KW
vii. A central control room for batteries and PCU
viii. Other balance of system components
ix. Budgeted cost of the system is Rs 30 lakh
CRISIL Infrastructure Advisory
24x7 Power for All (Uttar Pradesh) 94
PROPOSED SCHEME:
MNRE may provide subsidy at the rate of 40% through NCEF
A network of local technicians will have to be created for service and repairs.
Some local agencies / NGOs will have to be involved to ensure upkeep and proper use through awareness and
training of users.
The beneficiary may be asked to keep some fixed amount as “reserves” like for battery replacement in future.
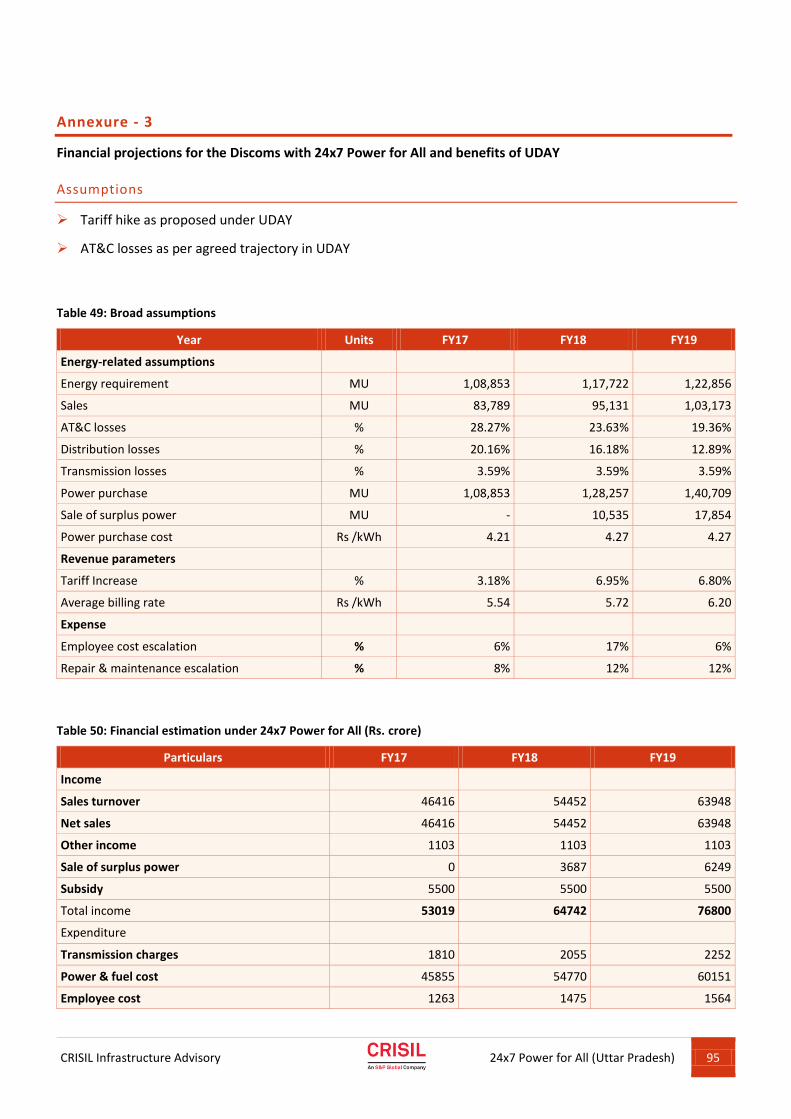
CRISIL Infrastructure Advisory
24x7 Power for All (Uttar Pradesh) 95
Annexure - 3
Financial projections for the Discoms with 24x7 Power for All and benefits of UDAY
Assumptions
Tariff hike as proposed under UDAY
AT&C losses as per agreed trajectory in UDAY
Table 49: Broad assumptions
Year Units FY17 FY18 FY19
Energy-related assumptions
Energy requirement MU 1,08,853 1,17,722 1,22,856
Sales MU 83,789 95,131 1,03,173
AT&C losses % 28.27% 23.63% 19.36%
Distribution losses % 20.16% 16.18% 12.89%
Transmission losses % 3.59% 3.59% 3.59%
Power purchase MU 1,08,853 1,28,257 1,40,709
Sale of surplus power MU - 10,535 17,854
Power purchase cost Rs /kWh 4.21 4.27 4.27
Revenue parameters
Tariff Increase % 3.18% 6.95% 6.80%
Average billing rate Rs /kWh 5.54 5.72 6.20
Expense
Employee cost escalation % 6% 17% 6%
Repair & maintenance escalation % 8% 12% 12%
Table 50: Financial estimation under 24x7 Power for All (Rs. crore)
Particulars FY17 FY18 FY19
Income
Sales turnover 46416 54452 63948
Net sales 46416 54452 63948
Other income 1103 1103 1103
Sale of surplus power 0 3687 6249
Subsidy 5500 5500 5500
Total income 53019 64742 76800
Expenditure
Transmission charges 1810 2055 2252
Power & fuel cost 45855 54770 60151
Employee cost 1263 1475 1564
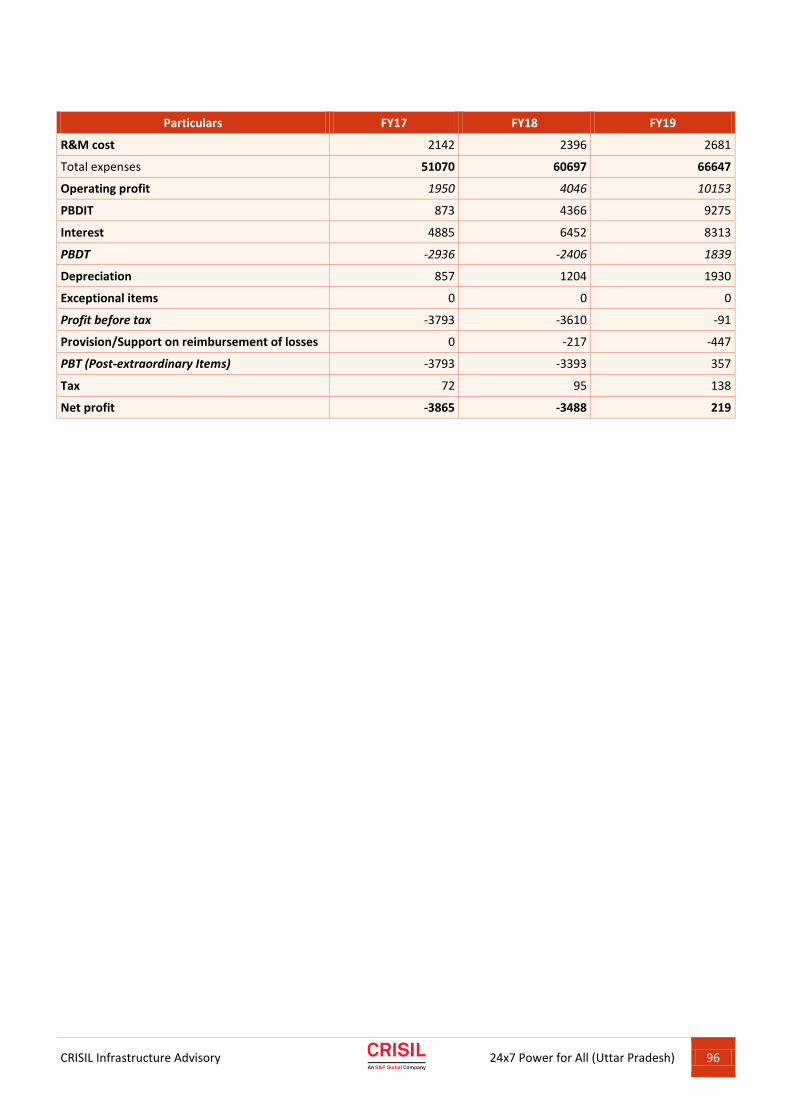
CRISIL Infrastructure Advisory
24x7 Power for All (Uttar Pradesh) 96
Particulars FY17 FY18 FY19
R&M cost 2142 2396 2681
Total expenses 51070 60697 66647
Operating profit 1950 4046 10153
PBDIT 873 4366 9275
Interest 4885 6452 8313
PBDT -2936 -2406 1839
Depreciation 857 1204 1930
Exceptional items 0 0 0
Profit before tax -3793 -3610 -91
Provision/Support on reimbursement of losses 0 -217 -447
PBT (Post-extraordinary Items) -3793 -3393 357
Tax 72 95 138
Net profit -3865 -3488 219
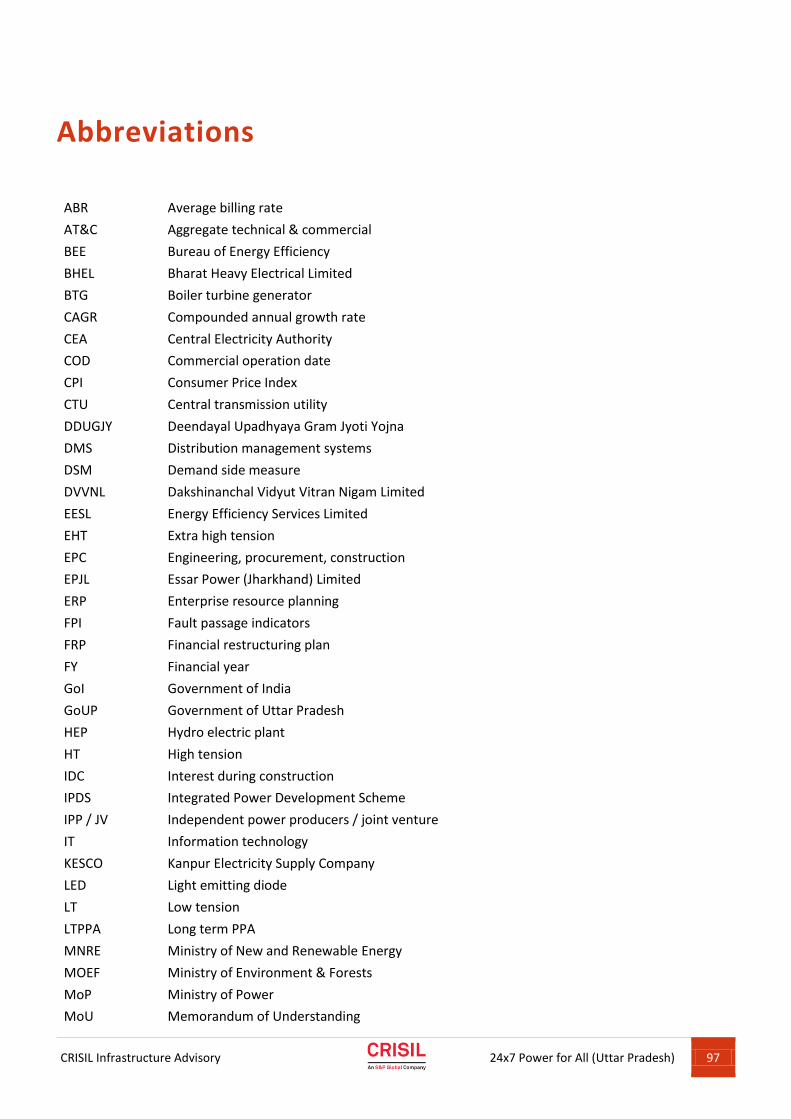
CRISIL Infrastructure Advisory
24x7 Power for All (Uttar Pradesh) 97
Abbreviations
ABR Average billing rate
AT&C Aggregate technical & commercial
BEE Bureau of Energy Efficiency
BHEL Bharat Heavy Electrical Limited
BTG Boiler turbine generator
CAGR Compounded annual growth rate
CEA Central Electricity Authority
COD Commercial operation date
CPI Consumer Price Index
CTU Central transmission utility
DDUGJY Deendayal Upadhyaya Gram Jyoti Yojna
DMS Distribution management systems
DSM Demand side measure
DVVNL Dakshinanchal Vidyut Vitran Nigam Limited
EESL Energy Efficiency Services Limited
EHT Extra high tension
EPC Engineering, procurement, construction
EPJL Essar Power (Jharkhand) Limited
ERP Enterprise resource planning
FPI Fault passage indicators
FRP Financial restructuring plan
FY Financial year
GoI Government of India
GoUP Government of Uttar Pradesh
HEP Hydro electric plant
HT High tension
IDC Interest during construction
IPDS Integrated Power Development Scheme
IPP / JV Independent power producers / joint venture
IT Information technology
KESCO Kanpur Electricity Supply Company
LED Light emitting diode
LT Low tension
LTPPA Long term PPA
MNRE Ministry of New and Renewable Energy
MOEF Ministry of Environment & Forests
MoP Ministry of Power
MoU Memorandum of Understanding
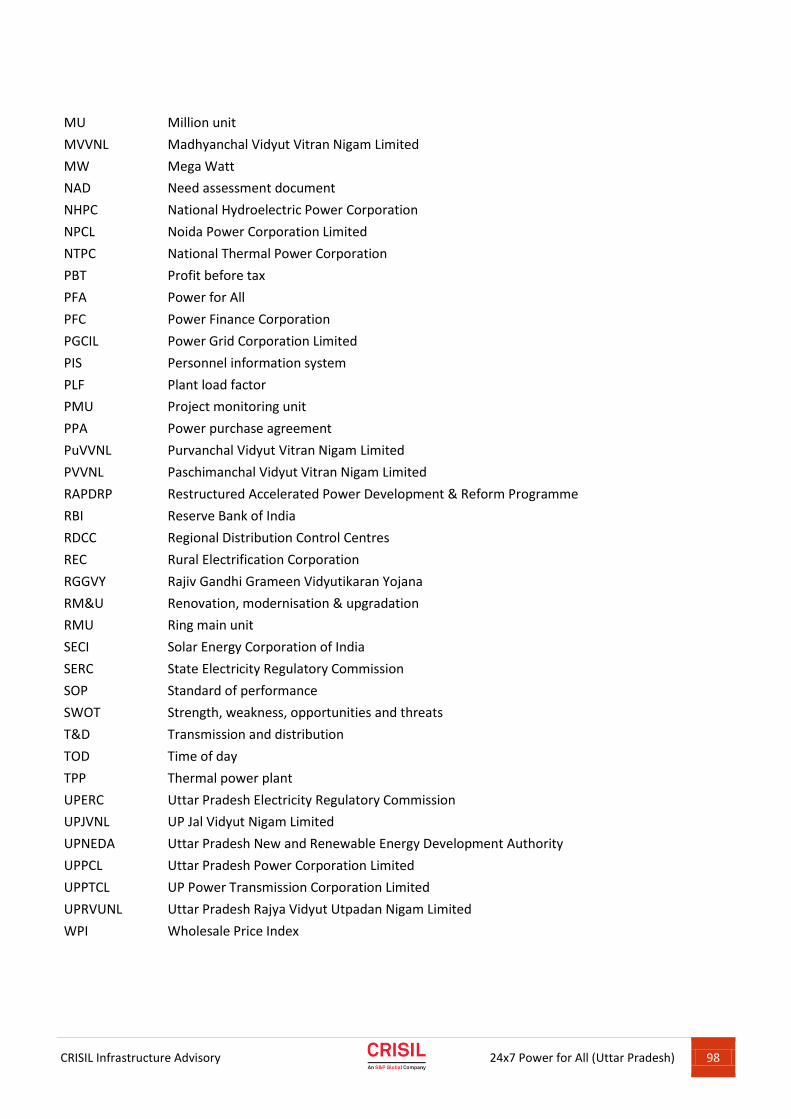
CRISIL Infrastructure Advisory
24x7 Power for All (Uttar Pradesh) 98
MU Million unit
MVVNL Madhyanchal Vidyut Vitran Nigam Limited
MW Mega Watt
NAD Need assessment document
NHPC National Hydroelectric Power Corporation
NPCL Noida Power Corporation Limited
NTPC National Thermal Power Corporation
PBT Profit before tax
PFA Power for All
PFC Power Finance Corporation
PGCIL Power Grid Corporation Limited
PIS Personnel information system
PLF Plant load factor
PMU Project monitoring unit
PPA Power purchase agreement
PuVVNL Purvanchal Vidyut Vitran Nigam Limited
PVVNL Paschimanchal Vidyut Vitran Nigam Limited
RAPDRP Restructured Accelerated Power Development & Reform Programme
RBI Reserve Bank of India
RDCC Regional Distribution Control Centres
REC Rural Electrification Corporation
RGGVY Rajiv Gandhi Grameen Vidyutikaran Yojana
RM&U Renovation, modernisation & upgradation
RMU Ring main unit
SECI Solar Energy Corporation of India
SERC State Electricity Regulatory Commission
SOP Standard of performance
SWOT Strength, weakness, opportunities and threats
T&D Transmission and distribution
TOD Time of day
TPP Thermal power plant
UPERC Uttar Pradesh Electricity Regulatory Commission
UPJVNL UP Jal Vidyut Nigam Limited
UPNEDA Uttar Pradesh New and Renewable Energy Development Authority
UPPCL Uttar Pradesh Power Corporation Limited
UPPTCL UP Power Transmission Corporation Limited
UPRVUNL Uttar Pradesh Rajya Vidyut Utpadan Nigam Limited
WPI Wholesale Price Index

CRISIL Infrastructure Advisory
24x7 Power for All (Uttar Pradesh) 99
About CRISIL Limited
CRISIL is a global, agile and innovative analytics company driven by its mission of making markets function better. We are India’s
foremost provider of ratings, data, research, analytics and solutions. A strong track record of growth, culture of innovation and
global footprint sets us apart. We have delivered independent opinions, actionable insights, and efficient solutions to over
100,000 customers.
We are majority owned by S&P Global Inc., a leading provider of transparent and independent ratings, benchmarks, analytics
and data to the capital and commodity markets worldwide.
About CRISIL Infrastructure Advisory
CRISIL Infrastructure Advisory is a leading advisor to regulators and governments, multilateral agencies, investors, and large
public and private sector firms. We help shape public policy and enable infrastructure development. Our services span a wide
array of infrastructure development activities. Our work in the areas of policy formulation, regulation, design and
implementation of public-private partnership (PPP) frameworks and infrastructure financing mechanisms helps create a vibrant
ecosystem for infrastructure development. Our services at the project level include bid process management, valuations and
due diligence to enable investment decisions. We are known for our core values of independence and analytical rigour
combined with deep domain expertise. Our teams have expertise across the complete range of infrastructure sectors - urban
development, energy, transport and logistics, natural resources, education, and healthcare. We have a rich understanding of
PPP and financing related issues. We operate in India and 22 other emerging economies in Asia, Africa, and the Middle East.
CRISIL Infrastructure Advisory is a division of CRISIL Risk and Infrastructure Solutions Limited, a wholly owned subsidiary of
CRISIL Limited.