2364 Tempest Report - geoscience.nt.gov.au · Wiso & Reynolds Range, N.T. TEMPEST Survey – Toro...
38
Wiso & Reynolds Range, Northern Territory TEMPEST Airborne Geophysical Survey Acquisition and Processing Report for Toro Energy Ltd. Prepared by : M. Wheeler-Carver W. Tran Authorised for release by : ………………………….. ………………………….. Survey flown: November – December 2012 by Fugro Airborne Surveys 435 Scarborough Beach Road, Osborne Park WA 6017, Australia Tel: (61-8) 9273 6400 Fax: (61-8) 9273 6466 FAS JOB # 2364
Transcript of 2364 Tempest Report - geoscience.nt.gov.au · Wiso & Reynolds Range, N.T. TEMPEST Survey – Toro...

Wiso & Reynolds Range, Northern Territory
TEMPEST Airborne Geophysical Survey
Acquisition and Processing Report
for
Toro Energy Ltd.
Prepared by : M. Wheeler-Carver W. Tran Authorised for release by : ………………………….. …………………………..
Survey flown: November – December 2012
by
Fugro Airborne Surveys 435 Scarborough Beach Road, Osborne Park WA 6017, Australia
Tel: (61-8) 9273 6400 Fax: (61-8) 9273 6466
FAS JOB # 2364
Wiso & Reynolds Range, N.T. TEMPEST Survey – Toro Energy Limited Job No. 2364 Page 2
CONTENTS
1. SURVEY OPERATIONS AND LOGISTICS ................................................................................ 4
1.1 INTRODUCTION ...................................................................................................................... 4 1.2 SURVEY BASE ....................................................................................................................... 4 1.3 SURVEY PERSONNEL ............................................................................................................. 4 1.4 AREA MAP ............................................................................................................................ 5 1.5 GENERAL DISCLAIMER ........................................................................................................... 5
2. SURVEY SPECIFICATIONS AND PARAMETERS .................................................................... 6
2.1 AREA CO-ORDINATES ............................................................................................................ 6 2.2 SURVEY AREA PARAMETERS .................................................................................................. 6 2.3 JOB SAFETY PLAN ................................................................................................................. 6
3. AIRCRAFT EQUIPMENT AND SPECIFICATIONS..................................................................... 7
3.1 AIRCRAFT ............................................................................................................................. 7 3.2 TEMPEST SYSTEM SPECIFICATIONS ...................................................................................... 7
3.2.1 EM Receiver and Logging Computer............................................................................. 7 3.2.2 TEMPEST Transmitter .................................................................................................. 8 3.2.3 TEMPEST 3-Axis Towed Bird Assembly ....................................................................... 8
3.3 FASDAS SURVEY COMPUTER................................................................................................ 8 3.3.1 Cesium Vapour Magnetometer Sensor ......................................................................... 8 3.3.2 Magnetometer Processor Board.................................................................................... 8 3.3.3 Fluxgate Magnetometer ................................................................................................ 8 3.3.4 GPS Receiver ............................................................................................................... 8 3.3.5 Differential GPS Demodulator ....................................................................................... 8
3.4 NAVIGATION SYSTEM ............................................................................................................. 9 3.5 ALTIMETER SYSTEM ............................................................................................................... 9
3.5.1 Radar Altimeter............................................................................................................. 9 3.5.2 Laser Altimeter ............................................................................................................. 9 3.5.3 Barometric Altimeter ..................................................................................................... 9
3.6 VIDEO TRACKING SYSTEM ...................................................................................................... 9 3.7 DATA RECORDED BY THE AIRBORNE ACQUISITION EQUIPMENT .................................................. 9
4. GROUND DATA ACQUISITION EQUIPMENT AND SPECIFICATIONS................................... 10
4.1 GPS BASE STATION ............................................................................................................ 10
5. EM AND OTHER CALIBRATIONS AND MONITORING........................................................... 13
5.1 TRANSMITTER-OFF ............................................................................................................... 13 5.2 NOISE ADDITIVE .................................................................................................................. 13 5.3 ZERO.................................................................................................................................. 13 5.4 SWOOPS ............................................................................................................................. 13 5.5 PARALLAX CHECKS ............................................................................................................. 13 5.6 RADAR ALTIMETER CALIBRATION .......................................................................................... 14 5.7 HEADING ERROR CHECKS .................................................................................................... 14
6. DATA PROCESSING ............................................................................................................... 15
6.1 FIELD DATA PROCESSING..................................................................................................... 15 6.1.1 Quality Control Specifications ..................................................................................... 15 6.1.2 In-Field Data Processing ............................................................................................. 15
6.2 FINAL DATA PROCESSING .................................................................................................... 15 6.2.1 Derived Topography ................................................................................................... 15 6.2.2 Electromagnetic Data Processing ............................................................................... 17 6.2.3 Conductivity Depth Images (CDI) ................................................................................ 20 6.2.4 System Specifications for Modelling TEMPEST Data .................................................. 20 6.2.5 Delivered Products ..................................................................................................... 21

Wiso & Reynolds Range, N.T. TEMPEST Survey – Toro Energy Limited Job No. 2364 Page 3
7. REFERENCES ......................................................................................................................... 22
APPENDIX I – WEEKLY ACQUISITION REPORTS ........................................................................ 23
APPENDIX II – LOCATED DATA FORMATS.................................................................................. 27
APPENDIX III – LIST OF ALL SUPPLIED DATA AND PRODUCTS ............................................... 38

Wiso & Reynolds Range, N.T. TEMPEST Survey – Toro Energy Limited Job No. 2364 Page 4
1. SURVEY OPERATIONS AND LOGISTICS 1.1 Introduction Between the 14th November and the 6th December 2012, Fugro Airborne Surveys Pty. Ltd. (FAS) undertook an airborne TEMPEST electromagnetic survey for Toro Energy Limited, over the Wiso & Reynolds Range Project areas in Nothern Territory. The survey consisted of three areas, Wiso, Reynolds Range 1 & Reynolds Rage 2. Total coverage of the survey areas amounted to 2512 line kilometres flown in 17 flights. The survey was flown using a SHORTS SKYVAN aircraft, registration VH-WGT owned and operated by FAS. This report summarises the procedures and equipment used by FAS in the acquisition, verification and processing of the airborne geophysical data. 1.2 Survey Base The survey was based out of Alice Springs, Ti Tree and Barrow Creek in the Northern Territory. The survey aircraft was operated from Alice Springs Airport, Ti Tree Airstrip and Barrow Creek Airstrip with the aircraft fuel available on site. A temporary office was set up at the, Best Western Elkira Resort Motel, Ti Tree Roadhouse and Barrow Creek Roadhouse, where all survey operations were run and the post-flight data verification was performed. 1.3 Survey Personnel The following personnel were involved in this project: Project Supervision - Acquisition Richard Butterfield - Processing Denis Cowey On-site Crew Leader Terry Mondon Pilot/s Grant Hamilton System Operator/s Terry Mondon Field Data Processing Matthew Wheeler-Carver Office Data Processing Joanne Cowburn, Doug Gay, Matthew Wheeler-Carver
Wiso & Reynolds Range, N.T. TEMPEST Survey – Toro Energy Limited Job No. 2364 Page 5
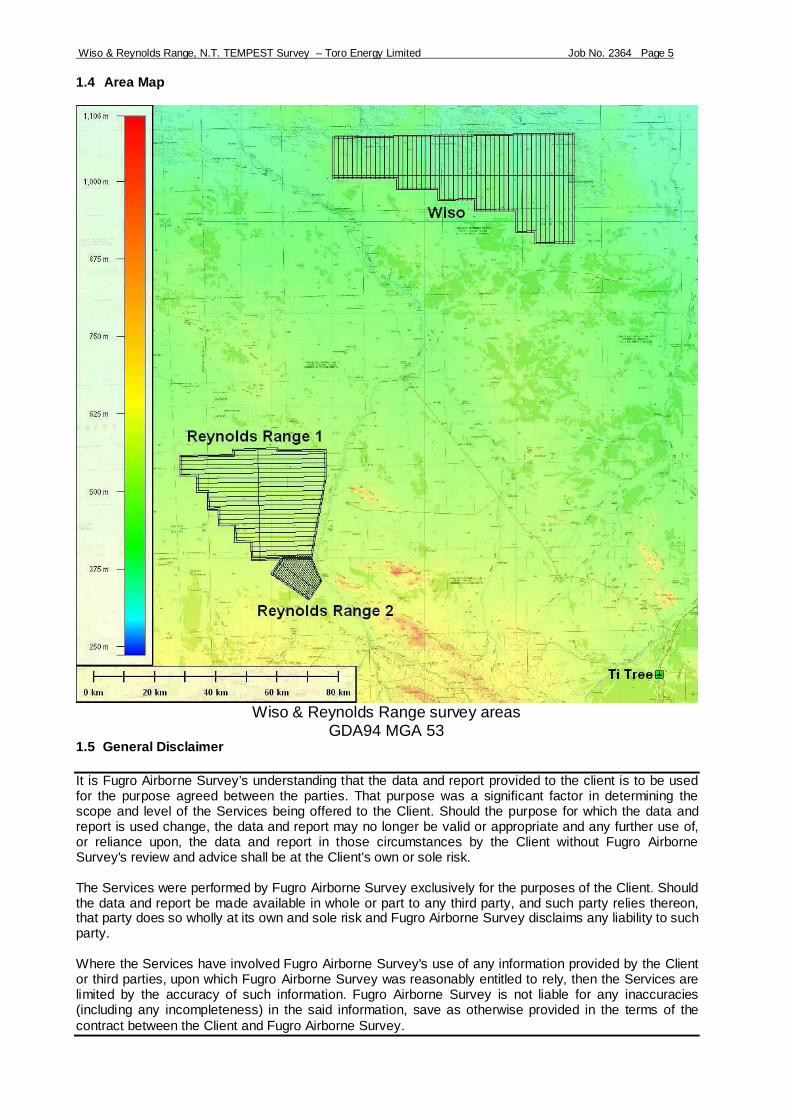
1.4 Area Map
Wiso & Reynolds Range survey areas
GDA94 MGA 53 1.5 General Disclaimer It is Fugro Airborne Survey’s understanding that the data and report provided to the client is to be used for the purpose agreed between the parties. That purpose was a significant factor in determining the scope and level of the Services being offered to the Client. Should the purpose for which the data and report is used change, the data and report may no longer be valid or appropriate and any further use of, or reliance upon, the data and report in those circumstances by the Client without Fugro Airborne Survey's review and advice shall be at the Client's own or sole risk. The Services were performed by Fugro Airborne Survey exclusively for the purposes of the Client. Should the data and report be made available in whole or part to any third party, and such party relies thereon, that party does so wholly at its own and sole risk and Fugro Airborne Survey disclaims any liability to such party. Where the Services have involved Fugro Airborne Survey's use of any information provided by the Client or third parties, upon which Fugro Airborne Survey was reasonably entitled to rely, then the Services are limited by the accuracy of such information. Fugro Airborne Survey is not liable for any inaccuracies (including any incompleteness) in the said information, save as otherwise provided in the terms of the contract between the Client and Fugro Airborne Survey.

Wiso & Reynolds Range, N.T. TEMPEST Survey – Toro Energy Limited Job No. 2364 Page 6
2. SURVEY SPECIFICATIONS AND PARAMETERS 2.1 Area Co-ordinates The survey areas were located within GDA94 MGA Zone 53S, Central Meridian = 135 (Note - Co-ordinates in GDA94/MGA Zone 53S) Area 1 (Wiso) – North - South lines Easting Northing 230236 7727369 308236 7728537 308236 7693420 296236 7693279 296236 7697046 290236 7696996 290236 7704088 276736 7704065 276736 7707584 264736 7707484 264736 7711080 251236 7711072 251236 7714527 230236 7714535 Area 2 (Reynolds 1) – 89° - 269° lines Easting Northing 227271 7616285 222484 7590416 212248 7590513 212174 7590428 203706 7590272
203473 7595788 198268 7595866 198112 7601227 193062 7601227 192907 7606587 189489 7606509 189333 7612103 185837 7612103 185837 7617541 180477 7617386 180399 7623057 197724 7623446 197646 7625310 211475 7625543 211552 7624805 227168 7624961 Area 3 (Reynolds 2) – 35°- 215° lines Easting Northing 222099 7577067 210248 7585025 214013 7590416 222442 7590374 225693 7582372
2.2 Survey Area Parameters Job Number - 2364 Survey Company - Fugro Airborne Surveys Pty Ltd Date Flown - 14th November – 6th December 2012 Client - Toro Energy Limited EM System - 25 Hz TEMPEST Navigation - Real-time differential GPS Datum - GDA94 Projection - MGA Zone 53S Area Names - Wiso & Reynods Range 1 & Reynolds Range 2, N.T. Nominal Terrain Clearance - 100 m Traverse Line Spacing - 1500 m (Area 1 & 2) - 500 m (Area 3) Traverse Line Direction - 000 – 180 degrees (Area 1) - 089 – 269 degrees (Area 2) - 035 – 215 degrees (Area 3) Traverse Line Numbers - 30001 – 30053 (Area 1) - 10001 – 10025 (Area 2) - 20001 – 10030 (Area 3) Line Kilometres Area 1 - 1288 km Line Kilometres Area 2 - 911 km Line Kilometres Area 3 - 313 km Total Survey Line Kilometres - 2512 km 2.3 Job Safety Plan A Job Safety Plan was prepared and implemented in accordance with the Fugro Airborne Surveys Occupational Safety & Health Management System.

Wiso & Reynolds Range, N.T. TEMPEST Survey – Toro Energy Limited Job No. 2364 Page 7
3. AIRCRAFT EQUIPMENT AND SPECIFICATIONS 3.1 Aircraft Manufacturer - SHORTS Model - SKYVAN Registration - VH-WGT Ownership - Fugro Airborne Surveys Pty Ltd
3.2 TEMPEST System Specifications Specifications of the TEMPEST Airborne EM System (Lane et al., 2000) are: • Base frequency - 25 Hz • Transmitter area - 186 m2 • Transmitter turns - 1 • Waveform - Square • Duty cycle - 50% • Transmitter pulse width - 10 ms • Transmitter off-time - 10 ms • Peak current - 300 A • Peak moment - 55800 Am2 • Average moment - 27900 Am2 • Sample rate - 75 kHz on X and Z • Sample interval - 13 microseconds • Samples per half-cycle - 1500 • System bandwidth - 25 Hz to 37.5 kHz • Flying height - 100 m (subject to safety considerations) • EM sensor - Towed bird with 3 component dB/dt coils • Tx-Rx horizontal separation - 115 m (nominal) • Tx-Rx vertical separation - 40 m (nominal) • Stacked data output interval - 200 ms (~12 m) • Number of output windows - 15 • Window centre times - 13 µs to 16.2 ms • Magnetometer - Stinger-mounted cesium vapour • Magnetometer compensation - Fully digital • Magnetometer output interval - 200 ms (~12 m) • Magnetometer resolution - 0.001 nT • Typical noise level - 1.0 nT • GPS cycle rate - 1 second
3.2.1 EM Receiver and Logging Computer The EM receiver computer was an EMFASDAS. The EM receiver computer executes a proprietary program for system control, timing, data acquisition and recording. Control, triggering and timing is provided to the TEMPEST transmitter and Digital Signal Processing (DSP) boards by the timing card, which ensures that all waveform generation and sampling is accomplished with high accuracy. The timing card is synchronised to the Global Positioning System (GPS) through the use of the Pulse Per Second (PPS) output from the system GPS card. Synchronisation is also provided to the magnetometer processor card for the purpose of accurate magnetic sampling with respect to the EM transmitter waveform. The EM receiver computer displays information on the main screen during system calibrations and survey line acquisition to enable the airborne operator to assess the data quality and performance of the system.

Wiso & Reynolds Range, N.T. TEMPEST Survey – Toro Energy Limited Job No. 2364 Page 8
3.2.2 TEMPEST Transmitter The transmitted waveform is a square wave of alternating polarity, which is triggered directly from the EM receiver computer. The nominal transmitter base frequency was 25 Hz with a pulse width of 10 ms (50 % duty cycle). Loop current waveform monitoring is provided by a current transformer located directly in the loop current path to allow for full logging of the waveform shape and amplitude, which is sampled by the EM receiver.
3.2.3 TEMPEST 3-Axis Towed Bird Assembly The TEMPEST 3-axis towed bird assembly provides accurate low noise sampling of the X (horizontal in line), Y (horizontal transverse) and Z (vertical) components of the electromagnetic field. The receiver coils measure the time rate of change of the magnetic field (dB/dt). Signals from each axis are transferred to the aircraft through a tow cable specifically designed for its electrical and mechanical properties.
3.3 FASDAS Survey Computer The Survey computer executes a proprietary program for acquisition and recording of location, magnetic and ancillary data. Data are presented both numerically and graphically in real time on the Video Graphics Array (VGA) Liquid Crystal Display (LCD) display, which provides an on-line display capability. The operator may alter the sensitivity of the displays on-line to assist in quality control. Selected EM data are transferred from the EM receiver computer to the SURVEY computer for quality control (QC) display.
3.3.1 Cesium Vapour Magnetometer Sensor A cesium vapour magnetometer sensor is utilised on the aircraft and consists of the sensor head and cable, and the sensor electronics. The sensor head is housed at the end of a composite material tail stinger.
3.3.2 Magnetometer Processor Board A FASDAS magnetometer processor board is used for de-coupling and processing the Larmor frequency output of the magnetometer sensor. The processor board interfaces with the survey computer, which initiates data sampling and transfer for precise sample intervals and also with the EM receiver computer to ensure that the magnetic samples remain synchronised with the EM system.
3.3.3 Fluxgate Magnetometer A tail stinger mounted Bartington MAG-03MC three-axis fluxgate magnetometer is used to provide information on the attitude of the aircraft. This information is used for compensation of the measured magnetic total field.
3.3.4 GPS Receiver A Novatel GPScard 951R is utilised for airborne positioning and navigation. Satellite range data are recorded for generating post processed differential solutions.
3.3.5 Differential GPS Demodulator The OMNISTAR differential GPS service provides real time differential corrections.

Wiso & Reynolds Range, N.T. TEMPEST Survey – Toro Energy Limited Job No. 2364 Page 9
3.4 Navigation System A FASDAS Navigation Computer was used for real-time navigation. These computers load a pre-programmed flight plan from disk which contains boundary co-ordinates, line start and end co-ordinates, local co-ordinate system parameters, line spacing, and cross track definitions. The World Geodetic System 1984 (WGS84) latitude and longitude positional data received from the Novatel GPS card contained in the SURVEY computer is transformed to the local co-ordinate system for calculation of the cross track and distance to go values. This information, along with ground heading and ground speed, is displayed to the pilot numerically and graphically on a two line LCD display, and on an analogue Horizontal Strip Indicator (HSI). It is also presented on a LCD screen in conjunction with a pictorial representation of the survey area, survey lines, and ongoing flight path. The Navigation computers are interlocked to the SURVEY computer for auto selection and verification of the line to be flown. The GPS information passed to the navigation computer is corrected using the received real time differential data from the OMNISTAR service, enabling the aircraft to fly as close to the intended track as possible.
3.5 Altimeter System
3.5.1 Radar Altimeter
Model: Collins RL 50 radio altimeter system Sample interval: 0.2 second Accuracy: +/- 1.5 % of indicated altitude. The Collins radio altimeter is a high quality instrument whose output is factory calibrated. It is fitted with a test function which checks the calibration of a terrain clearance of 100 feet, and altitudes which are multiples of 100 feet. The aircraft radio altitude is recorded onto digital tape as well as displayed on the aircraft chart recorder. The recorded value is the average of the altimeters output during the previous second.
3.5.2 Laser Altimeter
Model: Optech 501SB (WGT) Sample interval: 0.2 second Accuracy: ± 0.05m at survey altitude
3.5.3 Barometric Altimeter Output of a Digiquartz 215A-101pressure transducer is used for calculating the barometric altitude of the aircraft. The atmospheric pressure is taken from a gimbal-mounted probe projecting 0.5 metres from the wing tip of the aircraft and fed to the transducer mounted in the aircraft wingtip.
3.6 Video Tracking System The video file recorded by the digital video system is synchronised with the geophysical record by a digital fiducial display. It is also labelled with GPS latitude and longitude information and survey line number.
3.7 Data Recorded by the Airborne Acquisition Equipment With the FASDAS acquisition system the raw EM data including fiducial, local time, X and Z axis sensor response, current monitor and bird auxiliary sensor output are recorded on the EM receiver computer as “*.raw” EM files. Logging to the files is continuous, however, a new *.raw EM file is created when the size of the previous one reaches 1Gb. The FASDAS Survey computer records a continuous MSD file which contains all other ancillary data including magnetic, altimeter, GPS and analogue channels.

Wiso & Reynolds Range, N.T. TEMPEST Survey – Toro Energy Limited Job No. 2364 Page 10
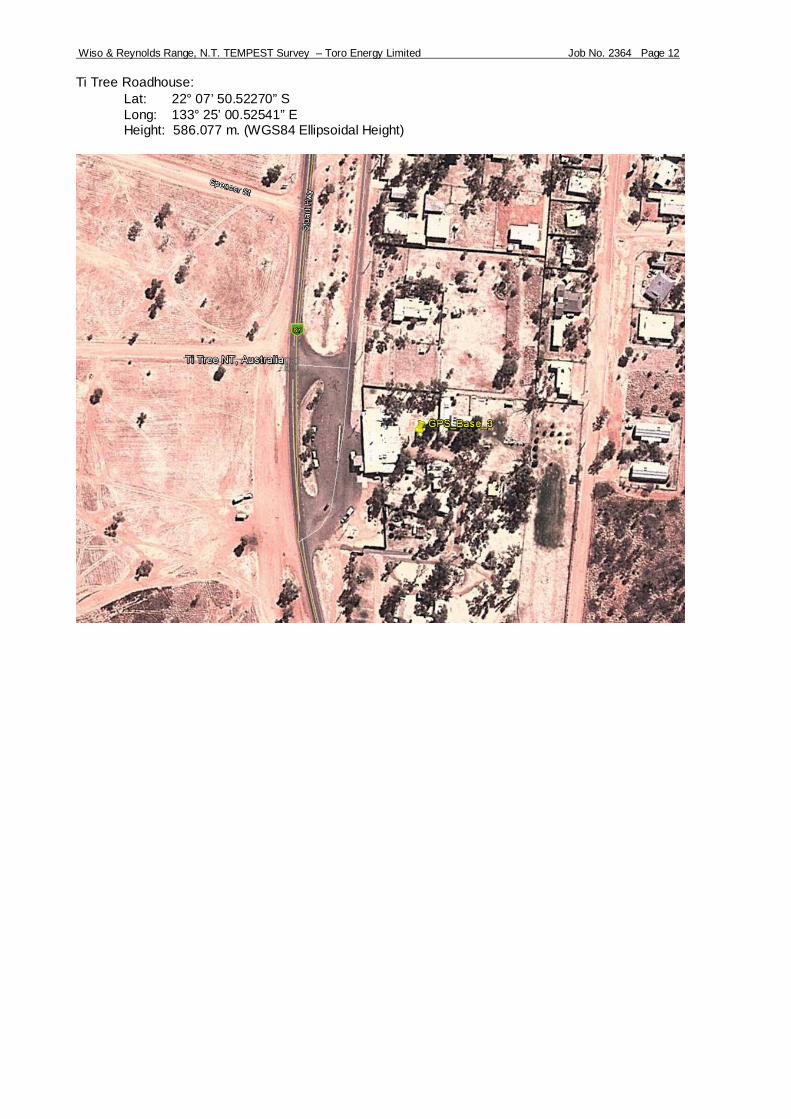
4. GROUND DATA ACQUISITION EQUIPMENT AND SPECIFICATIONS 4.1 GPS Base Station Three independent GPS base logging stations were set up; one at Alice Springs airport, Barrow Creek airport and Ti Tree roadhouse. The sensor was contained in the CF1 unit. Each GPS base station position was calculated by logging data continuously at the base position over a period of approximately 24 hours. These data were then statistically averaged to obtain the position of the base station using GrafNav software. The calculated GPS base positions were (in WGS84): Alice Springs Airport:
Lat: 23° 48’ 01.38028” S Long: 133° 53’ 47.90496” E Height: 561.489 m. (WGS84 Ellipsoidal Height)

Wiso & Reynolds Range, N.T. TEMPEST Survey – Toro Energy Limited Job No. 2364 Page 11
Barrow Creek Airport: Lat: 21° 32’ 26.17934” S Long: 133° 52’ 15.75698” E Height: 545.595 m. (WGS84 Ellipsoidal Height)
Wiso & Reynolds Range, N.T. TEMPEST Survey – Toro Energy Limited Job No. 2364 Page 12
Ti Tree Roadhouse: Lat: 22° 07’ 50.52270” S Long: 133° 25’ 00.52541” E Height: 586.077 m. (WGS84 Ellipsoidal Height)

Wiso & Reynolds Range, N.T. TEMPEST Survey – Toro Energy Limited Job No. 2364 Page 13
5. EM AND OTHER CALIBRATIONS AND MONITORING At the beginning and end of each individual survey flight, the EM system is checked for background noise levels and performance. All of these checks are conducted at a nominal terrain clearance of 600 m (2000 ft) to eliminate ground response. These checks include:-
5.1 Transmitter-off These lines are recorded in straight and level flight with the system in standard survey geometry, with the transmitter turned off and bird response turned on to observe ambient noise and to check for noise in the receiver system (bird/coils � tow cable � winch � computer). Note: FFFF is the flight number and PP is the attempt number. Post-Flight Transmitter-off: Line 906FFFFPP
5.2 Noise Additive These lines are recorded in straight and level flight with the system in standard survey geometry, with the transmitter on and the bird response turned off at the tow cable winch. This is to check the noise contribution from the acquisition system and is used in deconvolution of survey line data. Note: FFFF is the flight number and PP is the attempt number. Pre-Flight Noise Additive: Line 901FFFFPP Post-Flight Transmitter-off: Line 904FFFFPP
5.3 Zero These lines are recorded in straight and level flight with the system in standard survey configuration with transmitter and receiver turned on. This is used to determine the system’s response in the absence of ground signal and is used to determine a standard waveform for deconvolution of survey lines. Note: FFFF is the flight number and PP is the attempt number. Additionally, through all these calibrations the airborne operator can assess the system and ambient noise levels. Pre-Flight Zero: Line 902FFFFPP Post-Flight Zero: Line 905FFFFPP
5.4 Swoops This line is recorded immediately after the pre-flight zero. During this manoeuvre the pilot conducts a series of ‘swoop’ manoeuvres (pitch up/pitch down) over approximately 30-40 seconds to vary the position of the towed sensor relative to the aircraft. The EM data are monitored by the airborne operator to confirm correct operation of the system during the manoeuvre. This data is used to determine coefficients used in the processing to compensate for such variations in the survey data. Note: FFFF is the flight number and PP is the attempt number. Pre-Flight Swoop: Line 903FFFFPP
5.5 Parallax Checks Due to the relative positions of the EM towed bird and the magnetometer instruments on the aircraft and to processing / recording time lags, raw readings from each vary in position. To correct for this and to align selected anomaly features on lines flown in opposite directions, magnetics, EM data and the altimeters are ‘parallaxed’ with respect to the position information. System parallax is checked occasionally or following any major changes in the aircraft system, which are likely to affect the parallax values.

Wiso & Reynolds Range, N.T. TEMPEST Survey – Toro Energy Limited Job No. 2364 Page 14
Variable Parallax Value GPS 0 s
Radar Altimeter 0 s Laser Altimeter 0 s
EM - X - 9.2 s EM – Z - 9.4 s
5.6 Radar Altimeter Calibration The radar altimeter is checked for accuracy and linearity every 12 months or when any change in a key system component requires this procedure to be carried out. This calibration allows the radar altimeter data to be compared and assessed with other height data (GPS and barometric) to confirm the accuracy of the radar altimeter over its operating range. Absolute radar and barometric altimeter calibration was carried out over water at Mandurah, Western Australia, and was successful in calibrating the radar altimeter to information provided by the GPS and barometer instrument. Calibration factors were as expected. The calibration procedure also provides parallax information required for positional correction of the radar and GPS altimeters.
5.7 Heading Error Checks Historically, heading error checks have been part of the aeromagnetic data acquisition procedure but they are no longer used. Fugro Airborne Surveys now calculates these effects using the aircraft magnetic compensation system and specially developed software. The precision to which these effects are now calculated and corrected for is far in excess of the manual methods used in the past.

Wiso & Reynolds Range, N.T. TEMPEST Survey – Toro Energy Limited Job No. 2364 Page 15
6. DATA PROCESSING
6.1 Field Data Processing
6.1.1 Quality Control Specifications
6.1.1.1 Navigation Tolerance The re-flight specifications applied for the duration of the survey were: Electronic Navigation - absence of electronic navigation data (e.g. GPS base station fails). Flight Path - where the flightpath deviates from the flightplan by more than 750 metres for more than 5 km. The line spacing measurements to be used in determining such reflights will be made from the field flight path recovery Altitude - terrain clearance continuously exceeds the nominal terrain clearance by plus or minus 30 m over a distance of 5 km or more unless to do so would, in the sole opinion of the pilot, jeopardise the safety of the aircraft or the crew or the equipment or would be in contravention of the Civil Aviation Safety Authority regulation such as those pertaining to built up areas.
6.1.1.2 Electromagnetic Data The quality control checks on the electromagnetic data were: Noise - where RMS noise in the last channel of the EM data exceeds 0.1 fT over 3 km for B-field (assessed in a resistive region) or where FAS believes an important anomaly is rendered un-interpretable. Sferics – where sferic activity renders a potential anomaly un-interpretable.
6.1.2 In-Field Data Processing Following acquisition, multiple copies of the EM data are made onto DVDs or CDs. The EM, location, magnetic and ancillary data are then processed at the field base to the point that the quality of the data from each flight can be fully assessed. Copies of the raw and processed data are then transferred to Perth for final data processing. A more comprehensive statement of EM data processing is given in section 6.2.3.
6.2 Final Data Processing
6.2.1 Derived Topography Aircraft navigation whilst in survey mode is via real time differential GPS, obtained by combining broadcast differential corrections with on-board GPS measurements. Terrain clearance is measured with a laser altimeter. The ground elevation, relative to the WGS84 spheroid used by GPS receiver units, is obtained by finding the difference between the terrain clearance (from the final processed and edited laser altimeter) and the aircraft GPS antenna altitude above the ellipsoid (GPS height derived from post-processing of the DGPS data using the field base station data), and taking into account that the laser altimeter is mounted 2.3 metres below the GPS antenna. The digital elevation model derived from this survey can be expected to have an absolute accuracy of +/- several metres in areas of low to moderate topographic relief. Sources of error include uncertainty in the height of the GPS base station, variations in the laser altimeter characteristics over ground of varying

Wiso & Reynolds Range, N.T. TEMPEST Survey – Toro Energy Limited Job No. 2364 Page 16
surface characteristics (ie. false and non-returns are more prevalent over dense vegetation and water, respectively), and the finite footprint of the laser altimeter. Following this, where appropriate, tie line and micro-levelling was applied in order to more subtly level the data. The algorithms are FAS proprietary operations used to remove the small across-line corrugations that may appear in the gridded data. The micro-levelling process attempts to de-corrugate the data without destroying the data’s integrity. This is achieved by confining the changes to very small values and applying them as a correction to the along-line data. An N-Value is then subtracted to correct the final data to the Australian Height Datum (AHD). The accuracy of the elevation calculation is directly dependent on the accuracy of the two input parameters, laser altitude and GPS altitude. The GPS altitude value is dependent on the number of available satellites, plus the accuracy of the averaged GPS base position. Although post-processing of GPS data will yield X and Y accuracies in the order of 0.5 metres, the accuracy of the altitude value is usually much less, but generally still within 1-2 metres. Further inaccuracies may be introduced during the interpolation and gridding process as only 1 out of every 5 points across-line is real data. Furthermore, along line obstructions may cause the pilot to veer laterally and so data interpolated between lines may vary significantly from real topography, and do not show artificial vertical obstructions. Because of the inherent inaccuracies of this method, no guarantee is made or implied that the information displayed is a true representation of the height above sea level. Although this product may be of some use as a general reference, THIS PRODUCT MUST NOT BE USED FOR NAVIGATION PURPOSES.

Wiso & Reynolds Range, N.T. TEMPEST Survey – Toro Energy Limited Job No. 2364 Page 17
6.2.2 Electromagnetic Data Processing Details of the pre-processing applied to TEMPEST data can be found in Lane et al. (2000).
6.2.2.1 Standard EM Processing Calibration High altitude calibration data are used to characterise the system response in the absence of any ground response. Cleaning and Stacking Routines to suppress sferic noise, powerline noise, VLF noise, and coil motion noise (collectively termed “cleaning” and to stack the data are applied to the survey line data. Output from the stacking filter is drawn at 0.2 second intervals. The stacked data are saved to file as an internal data management practice. Deconvolution and Binning The survey height stacked data are deconvolved using the high altitude reference waveform. The effect of currents in the transmitter loop and airframe (“primary”) are then removed, leaving a “pure” ground response. The deconvolved ground response data are then transformed to B-field response for a perfect 100% duty cycle square wave. Finally, the evenly spaced samples are binned into a number of windows. Table of TEMPEST window information for 25Hz base frequency Window # Start
sample End
sample No of
samples start time
(s) End time
(s) centre time
(s) centre
time (ms)
1 1 2 2 0.000007 0.000020 0.000013 0.013 2 3 4 2 0.000033 0.000047 0.000040 0.040 3 5 6 2 0.000060 0.000073 0.000067 0.067 4 7 10 4 0.000087 0.000127 0.000107 0.107 5 11 16 6 0.000140 0.000207 0.000173 0.173 6 17 26 10 0.000220 0.000340 0.000280 0.280 7 27 42 16 0.000353 0.000553 0.000453 0.453 8 43 66 24 0.000567 0.000873 0.000720 0.720 9 67 102 36 0.000887 0.001353 0.001120 1.120 10 103 158 56 0.001367 0.002100 0.001733 1.733 11 159 246 88 0.002113 0.003273 0.002693 2.693 12 247 384 138 0.003287 0.005113 0.004200 4.200 13 385 600 216 0.005127 0.007993 0.006560 6.560 14 601 930 330 0.008007 0.012393 0.010200 10.200 15 931 1500 570 0.012407 0.019993 0.016200 16.200
The data are reviewed after windowing. Any decisions involving re-flights due to AEM factors are made at this point. Raw and Final EM Data The “raw” or “uncorrected” EM amplitudes reflect, not only the variations in ground conductivity, but the variations in geometry of the various parts of the EM measurements (i.e. transmitter loop pitch, transmitter loop roll, transmitter loop terrain clearance, transmitter loop to receiver coil horizontal longitudinal separation, transmitter loop to receiver coil horizontal transverse separation, and transmitter loop to receiver coil vertical separation) during the survey. For example, the largest influence on the early time EM amplitude is the terrain clearance of the transmitter loop. The larger the terrain clearance is, the smaller the amplitude. Later window times (larger window number) show diminished variations due to terrain clearance.
Wiso & Reynolds Range, N.T. TEMPEST Survey – Toro Energy Limited Job No. 2364 Page 18
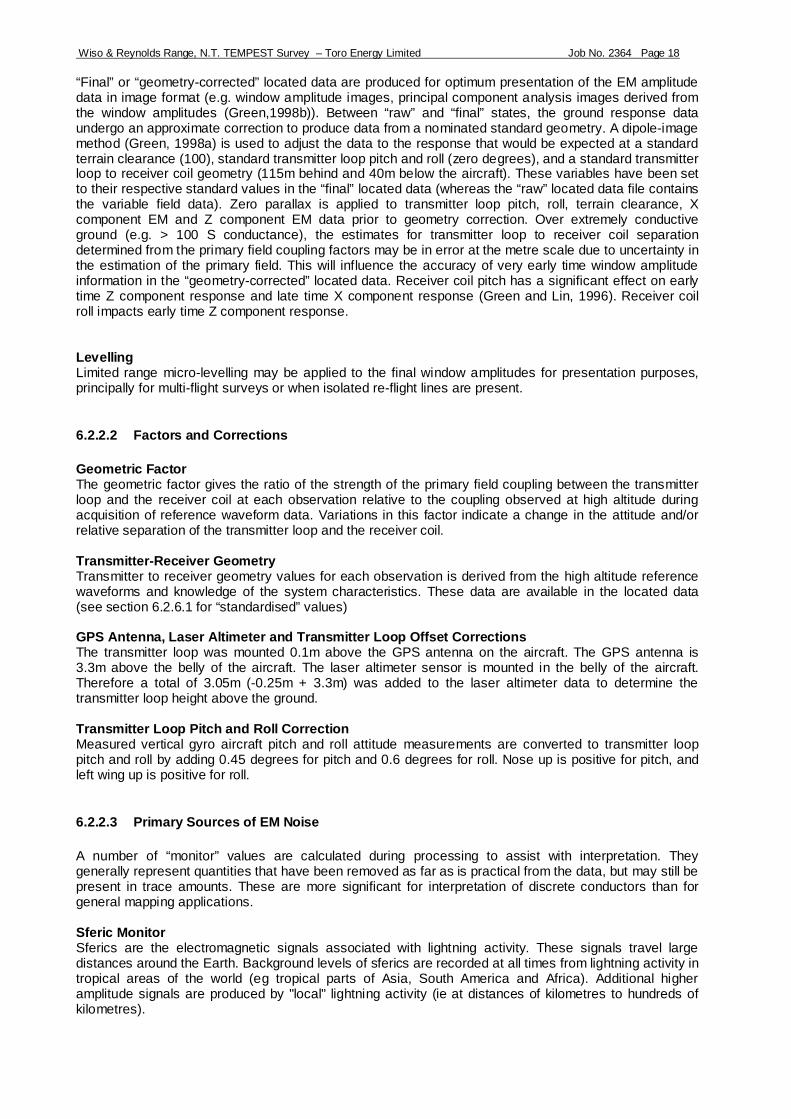
“Final” or “geometry-corrected” located data are produced for optimum presentation of the EM amplitude data in image format (e.g. window amplitude images, principal component analysis images derived from the window amplitudes (Green,1998b)). Between “raw” and “final” states, the ground response data undergo an approximate correction to produce data from a nominated standard geometry. A dipole-image method (Green, 1998a) is used to adjust the data to the response that would be expected at a standard terrain clearance (100), standard transmitter loop pitch and roll (zero degrees), and a standard transmitter loop to receiver coil geometry (115m behind and 40m below the aircraft). These variables have been set to their respective standard values in the “final” located data (whereas the “raw” located data file contains the variable field data). Zero parallax is applied to transmitter loop pitch, roll, terrain clearance, X component EM and Z component EM data prior to geometry correction. Over extremely conductive ground (e.g. > 100 S conductance), the estimates for transmitter loop to receiver coil separation determined from the primary field coupling factors may be in error at the metre scale due to uncertainty in the estimation of the primary field. This will influence the accuracy of very early time window amplitude information in the “geometry-corrected” located data. Receiver coil pitch has a significant effect on early time Z component response and late time X component response (Green and Lin, 1996). Receiver coil roll impacts early time Z component response. Levelling Limited range micro-levelling may be applied to the final window amplitudes for presentation purposes, principally for multi-flight surveys or when isolated re-flight lines are present.
6.2.2.2 Factors and Corrections Geometric Factor The geometric factor gives the ratio of the strength of the primary field coupling between the transmitter loop and the receiver coil at each observation relative to the coupling observed at high altitude during acquisition of reference waveform data. Variations in this factor indicate a change in the attitude and/or relative separation of the transmitter loop and the receiver coil. Transmitter-Receiver Geometry Transmitter to receiver geometry values for each observation is derived from the high altitude reference waveforms and knowledge of the system characteristics. These data are available in the located data (see section 6.2.6.1 for “standardised” values) GPS Antenna, Laser Altimeter and Transmitter Loop Offset Corrections The transmitter loop was mounted 0.1m above the GPS antenna on the aircraft. The GPS antenna is 3.3m above the belly of the aircraft. The laser altimeter sensor is mounted in the belly of the aircraft. Therefore a total of 3.05m (-0.25m + 3.3m) was added to the laser altimeter data to determine the transmitter loop height above the ground. Transmitter Loop Pitch and Roll Correction Measured vertical gyro aircraft pitch and roll attitude measurements are converted to transmitter loop pitch and roll by adding 0.45 degrees for pitch and 0.6 degrees for roll. Nose up is positive for pitch, and left wing up is positive for roll.
6.2.2.3 Primary Sources of EM Noise A number of “monitor” values are calculated during processing to assist with interpretation. They generally represent quantities that have been removed as far as is practical from the data, but may still be present in trace amounts. These are more significant for interpretation of discrete conductors than for general mapping applications. Sferic Monitor Sferics are the electromagnetic signals associated with lightning activity. These signals travel large distances around the Earth. Background levels of sferics are recorded at all times from lightning activity in tropical areas of the world (eg tropical parts of Asia, South America and Africa). Additional higher amplitude signals are produced by "local" lightning activity (ie at distances of kilometres to hundreds of kilometres).
Wiso & Reynolds Range, N.T. TEMPEST Survey – Toro Energy Limited Job No. 2364 Page 19
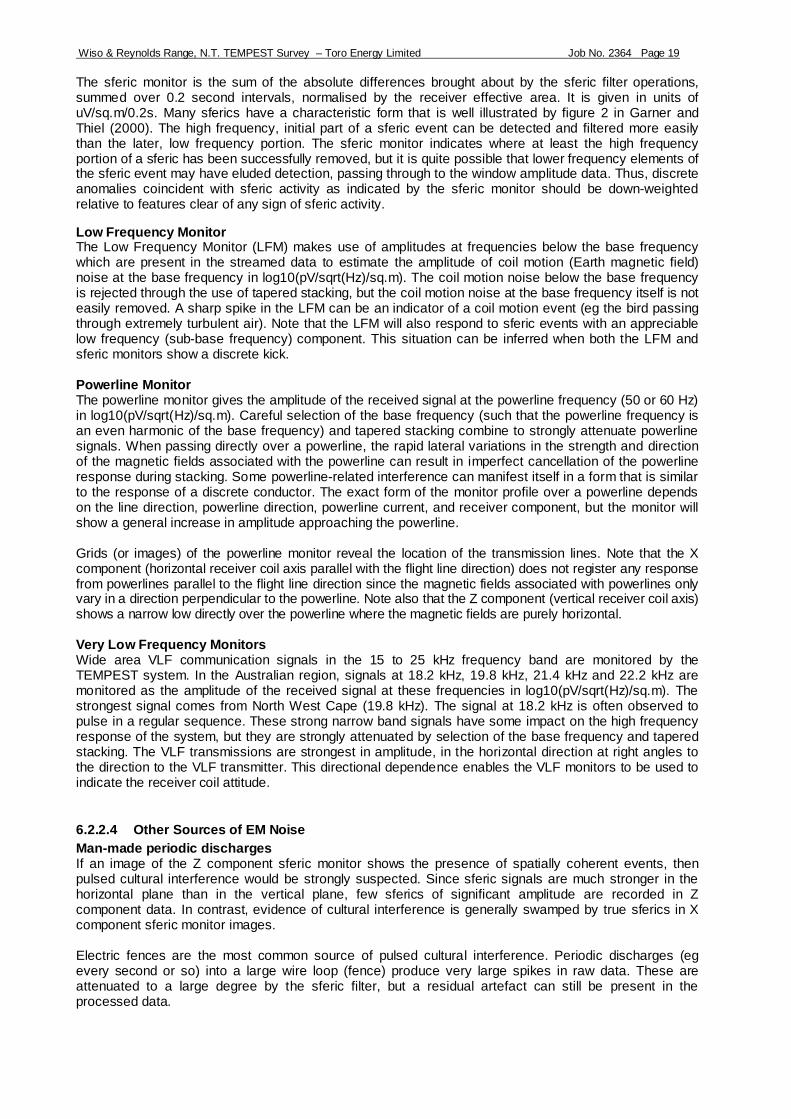
The sferic monitor is the sum of the absolute differences brought about by the sferic filter operations, summed over 0.2 second intervals, normalised by the receiver effective area. It is given in units of uV/sq.m/0.2s. Many sferics have a characteristic form that is well illustrated by figure 2 in Garner and Thiel (2000). The high frequency, initial part of a sferic event can be detected and filtered more easily than the later, low frequency portion. The sferic monitor indicates where at least the high frequency portion of a sferic has been successfully removed, but it is quite possible that lower frequency elements of the sferic event may have eluded detection, passing through to the window amplitude data. Thus, discrete anomalies coincident with sferic activity as indicated by the sferic monitor should be down-weighted relative to features clear of any sign of sferic activity. Low Frequency Monitor The Low Frequency Monitor (LFM) makes use of amplitudes at frequencies below the base frequency which are present in the streamed data to estimate the amplitude of coil motion (Earth magnetic field) noise at the base frequency in log10(pV/sqrt(Hz)/sq.m). The coil motion noise below the base frequency is rejected through the use of tapered stacking, but the coil motion noise at the base frequency itself is not easily removed. A sharp spike in the LFM can be an indicator of a coil motion event (eg the bird passing through extremely turbulent air). Note that the LFM will also respond to sferic events with an appreciable low frequency (sub-base frequency) component. This situation can be inferred when both the LFM and sferic monitors show a discrete kick. Powerline Monitor The powerline monitor gives the amplitude of the received signal at the powerline frequency (50 or 60 Hz) in log10(pV/sqrt(Hz)/sq.m). Careful selection of the base frequency (such that the powerline frequency is an even harmonic of the base frequency) and tapered stacking combine to strongly attenuate powerline signals. When passing directly over a powerline, the rapid lateral variations in the strength and direction of the magnetic fields associated with the powerline can result in imperfect cancellation of the powerline response during stacking. Some powerline-related interference can manifest itself in a form that is similar to the response of a discrete conductor. The exact form of the monitor profile over a powerline depends on the line direction, powerline direction, powerline current, and receiver component, but the monitor will show a general increase in amplitude approaching the powerline. Grids (or images) of the powerline monitor reveal the location of the transmission lines. Note that the X component (horizontal receiver coil axis parallel with the flight line direction) does not register any response from powerlines parallel to the flight line direction since the magnetic fields associated with powerlines only vary in a direction perpendicular to the powerline. Note also that the Z component (vertical receiver coil axis) shows a narrow low directly over the powerline where the magnetic fields are purely horizontal. Very Low Frequency Monitors Wide area VLF communication signals in the 15 to 25 kHz frequency band are monitored by the TEMPEST system. In the Australian region, signals at 18.2 kHz, 19.8 kHz, 21.4 kHz and 22.2 kHz are monitored as the amplitude of the received signal at these frequencies in log10(pV/sqrt(Hz)/sq.m). The strongest signal comes from North West Cape (19.8 kHz). The signal at 18.2 kHz is often observed to pulse in a regular sequence. These strong narrow band signals have some impact on the high frequency response of the system, but they are strongly attenuated by selection of the base frequency and tapered stacking. The VLF transmissions are strongest in amplitude, in the horizontal direction at right angles to the direction to the VLF transmitter. This directional dependence enables the VLF monitors to be used to indicate the receiver coil attitude.
6.2.2.4 Other Sources of EM Noise Man-made periodic discharges If an image of the Z component sferic monitor shows the presence of spatially coherent events, then pulsed cultural interference would be strongly suspected. Since sferic signals are much stronger in the horizontal plane than in the vertical plane, few sferics of significant amplitude are recorded in Z component data. In contrast, evidence of cultural interference is generally swamped by true sferics in X component sferic monitor images. Electric fences are the most common source of pulsed cultural interference. Periodic discharges (eg every second or so) into a large wire loop (fence) produce very large spikes in raw data. These are attenuated to a large degree by the sferic filter, but a residual artefact can still be present in the processed data.

Wiso & Reynolds Range, N.T. TEMPEST Survey – Toro Energy Limited Job No. 2364 Page 20
Coil motion / Earth field noise A change in coupling between the receiver coil and the ambient magnetic field will induce a voltage in the receiver coil. This noise is referred to as coil motion or Earth field noise. Receiver coils in the towed bird are suspended in a fashion that attempts to keep this noise below the noise floor at frequencies equal to and above the base frequency of the system. Severe turbulence, however, can result in ‘coil knock events’ that introduce noise into the processed data. Grounded metal objects Grounded extensive metal objects such as pipelines and rail lines can qualify as conductors and may produce a response that is visible in processed data. Grounded metal objects produce a response similar to shallow, highly conductive, steeply dipping conductors. These objects can sometimes be identified from good quality topographic maps, from aerial photographs, by viewing the tracking video, from their unusual spatial distribution (ie often a series of linear segments) and in some circumstances from their effect on the powerline monitor. A powerline running close to a long metal object will induce a 50 Hz response in the object.
6.2.3 Conductivity Depth Images (CDI) CDI conductivity sections for TEMPEST data were calculated using EMFlow and then modified to reflect the finite depth of investigation using an in-house routine, Sigtime. The Sigtime routine removes many of the spurious conductive features that appear at depth as a result of fitting long time constant exponential decays to very small amplitude features in the late times. For each observation, the time when the response falls below a signal threshold amplitude is determined. This time is transformed into a diffusion depth with reference to the conductivity values determined for that observation. Anomalous conductivity values below this depth are replaced by background values or set to undefined, reflecting the uncertainty in their origin. The settings and options applied are indicated in the appropriate header files for Sigtime output. This procedure is different to that which would be obtained by filtering conductivity values using either a constant time or constant depth across the entire line. The “final” Z component EM data were input into version 5.10 of EMFlow to calculate Conductivity Depth Images (CDI). Conductivity values were calculated at each point then run through Sigtime. EMFlow was developed within the CRC-AMET through AMIRA research projects (Macnae et al, 1998, Macnae and Zonghou, 1998, Stolz and Macnae, 1998). The software has been commercialised by Encom Technology Pty Ltd. Examples of TEMPEST conductivity data can be seen in Lane et al. (2000), Lane et al. (1999), and Lane and Pracillio (2000). Conductivity values were calculated to a depth of 500 m below surface at each point, using a depth increment of 5 m and a conductivity range of 0.5-50 mS/m for area 1 and 0.4-225 mS/m for areas 2 and 3.
6.2.4 System Specifications for Modelling TEMPEST Data Differences between the specifications for the acquisition system, and those of the virtual system for which processed results are given, must be kept in mind when forward modelling, transforming or inverting TEMPEST data. Acquisition is carried out with a 50% duty cycle square transmitter current waveform and dB/dt sensors. During processing, TEMPEST EM data are transformed to the response that would be obtained with a B-field sensor for a 100% duty cycle square waveform at the base frequency, involving a 1A change in current (from -0.5A to +0.5A to -0.5A) in a 1sq.m transmitter. Data are given in units of femtotesla (fT = 10-15 Tesla). It is this configuration, rather than the actual acquisition configuration, which must be specified when modelling TEMPEST data. Window timing information is given above (see section 6.2.3).

Wiso & Reynolds Range, N.T. TEMPEST Survey – Toro Energy Limited Job No. 2364 Page 21
6.2.4.1 Standard Height and Geometry The “final” EM data have been standardised through an approximate transformation to a standard transmitter loop terrain clearance, transmitter loop pitch and roll of zero degrees, and a fixed transmitter loop to receiver coil geometry (roughly equal to the average “raw” geometry values). Transmitter loop pitch, transmitter loop roll and transmitter loop terrain clearance values for each observation have been modified to reflect the standard values. Hence, the “final” (fixed) geometry values should be used if modelling with the final X- and Z-component amplitude data - the following table summarises the values used to correct the transmitter height/pitch/roll/geometry to. Table of values used to standardise transmitter loop height, pitch, roll and geometry Variable Standardised value Transmitter loop pitch 0 degrees Transmitter loop roll 0 degrees Transmitter loop terrain clearance 100 metres Transmitter loop – to – receiver coil geometry 115 m behind and 40 m below the aircraft
6.2.4.2 Parallax The located data files utilise the following parallax values :- • radar altimeter = 0 fiducials (0 observations from the zero parallax position), • EM X-component = -9.2 fiducials (46 observation from the zero parallax position), • EM Z-component = -9.4 fiducials (47 observations from the zero parallax position), For the Tempest Airborne EM system, due to the asymmetry in the transmitter loop-receiver coil geometry with respect to flight direction, there is no single EM parallax value which will align the peak response for all conductivity distributions for lines flown in opposite directions. The choice of EM parallax value depends on the intended usage, but with the predominance of broad, shallowly dipping conductors, and the client’s desire to grid the data, parallax has been applied so that data are optimised for gridding. The ‘optimum’ depends on the conductor depth, the acquisition geometry and the delay time, and hence, the selected value will be a compromise. (NB negative parallax values are defined in this case as shifting the indicated quantity forward along line to larger fiducial values. Location information remains in the zero parallax state)
6.2.5 Delivered Products Appendix III contains a complete list of all data supplied digitally. Digital ascii located data and a Geosoft GDB format was produced, containing the raw and final, X and Z EM data, conductivity data as well as digital terrain. Stacked CDI sections and CDI-multiplots (Z component) in Adobe PDF format. Grids (in ER Mapper format) of all X and Z EM windows and digital elevation were produced. A flight path map was delivered in Oasis “.map” format and “.png” image format. Acquisition and processing report in hardcopy and digital PDF format.
Wiso & Reynolds Range, N.T. TEMPEST Survey – Toro Energy Limited Job No. 2364 Page 22
7. REFERENCES Garner, S.J., Thiel, D.V., 2000, Broadband (ULF-VLF) surface impedance measurements using MIMDAS:
Exploration Geophysics, 31, 173-178. Green, A., 1998. Altitude correction of time domain AEM data for image display and geological mapping,
using the Apparent Dipole Depth (ADD) method. Expl. Geoph. 29, 87-91. Green, A., 1998. The use of multivariate statistical techniques for the analysis and display of AEM data.
Expl. Geoph. 29, 77-82. Green, A., Lin, Z., 1996. Effect of uncertain or changing system geometry on airborne transient
electromagnetic data: CSIRO Expl. and Mining Research News No. 6, August 1996, 9-11, CSIRO Division of Exploration and Mining.
Jupp, D.L.B. and Vozoff, K., 1975, Stable iterative methods for geophysical inversion: Geophysical Journal of the Royal Astronomical Society, vol. 42, pp. 957-976. Lane, R., 2000, Conductive unit parameters : summarising complex conductivity distributions: Paper
accepted for presentation at the SEG Annual Meeting, August 2000. Lane, R., Green, A., Golding, C., Owers, M., Pik, P., Plunkett, C., Sattel, D., Thorn, B., 2000, An example
of 3D conductivity mapping using the TEMPEST airborne electromagnetic system: Exploration Geophysics, 31, 162-172.
Lane, R., Leeming, P., Owers, M., Triggs, D., 1999, Undercover assignment for TEMPEST: Preview,
Issue 82, 17-21. Lane, R., Pracilio, G., 2000: Visualisation of sub-surface conductivity derived from airborne EM, SAGEEP
2000, 101-111.

Wiso & Reynolds Range, N.T. TEMPEST Survey – Toro Energy Limited Job No. 2364 Page 23
APPENDIX I – Weekly Acquisition Reports

Wiso & Reynolds Range, N.T. TEMPEST Survey – Toro Energy Limited Job No. 2364 Page 24
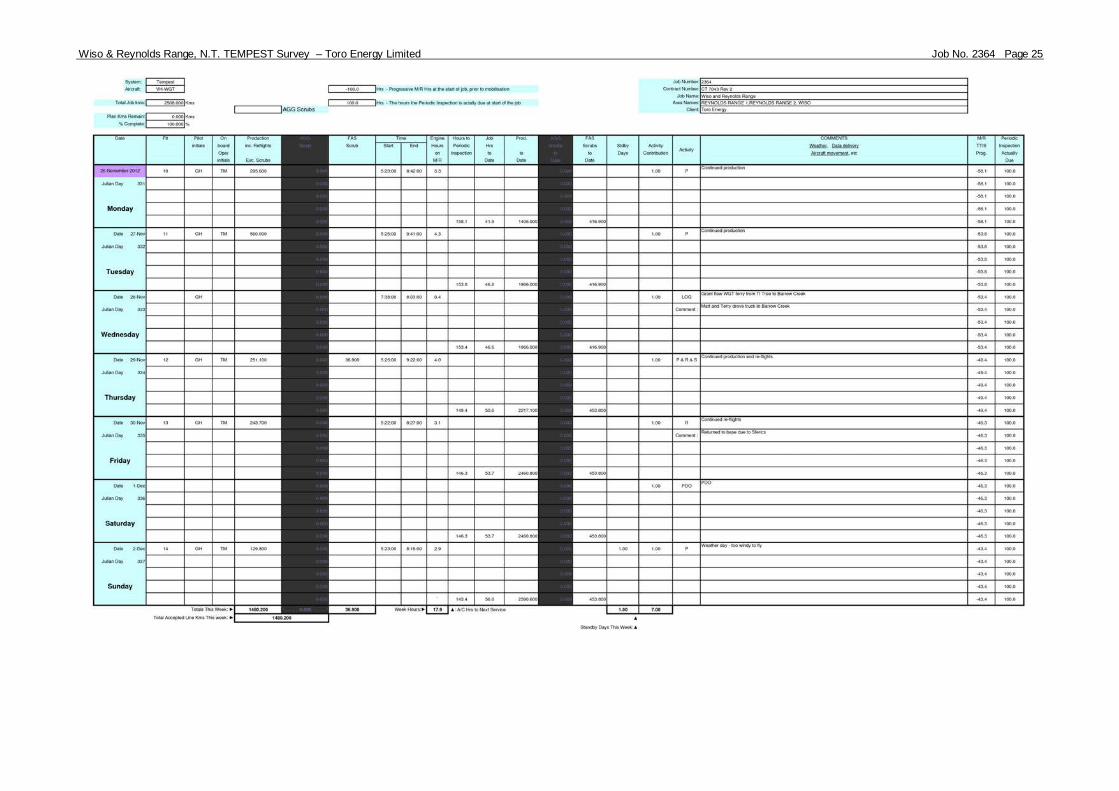
Wiso & Reynolds Range, N.T. TEMPEST Survey – Toro Energy Limited Job No. 2364 Page 25

Wiso & Reynolds Range, N.T. TEMPEST Survey – Toro Energy Limited Job No. 2364 Page 26

Wiso & Reynolds Range, N.T. TEMPEST Survey – Toro Energy Limited Job No. 2364 Page 27
APPENDIX II – Located Data Formats
Headers for final data files FINAL EM
AREA 1 COMM FAS PROJECT NUMBER 2364 COMM AREA NUMBER: 1 COMM SURVEY COMPANY: Fugro Airborne Surveys COMM CLIENT: Toro Energy Ltd. COMM SURVEY TYPE: 25Hz TEMPEST Survey COMM AREA NAME: Wiso COMM STATE: NT COMM COUNTRY: Australia COMM SURVEY FLOWN: November to December 2012 COMM LOCATED DATA CREATED: February 2012 COMM COMM DATUM: GDA94 COMM PROJECTION: MGA COMM ZONE: 53 COMM COMM SURVEY SPECIFICATIONS COMM COMM TRAVERSE LINE SPACING: 1500 m COMM TRAVERSE LINE DIRECTION: 0 - 180 deg COMM TIE LINE DIRECTION: 90 - 270 deg COMM NOMINAL TERRAIN CLEARANCE: 100 m COMM FINAL LINE KILOMETRES: 1288 km COMM COMM LINE NUMBERING COMM COMM TRAVERSE LINE NUMBERS: L3000101 - L3005301 COMM TIE LINE NUMBERS: T3900101 COMM COMM SURVEY EQUIPMENT COMM COMM AIRCRAFT: SHORTS SKYVAN, VH-WGT COMM COMM MAGNETOMETER: Scintrex Cs-2 Cesium Vapour COMM INSTALLATION: Stinger mounted COMM RESOLUTION: 0.001 nT COMM RECORDING INTERVAL: 0.2 s COMM COMM ELECTROMAGNETIC SYSTEM: 25Hz TEMPEST COMM INSTALLATION: Transmitter loop mounted on the aircraft COMM Receiver coils in a towed bird COMM COIL ORIENTATION: X,Z COMM RECORDING INTERVAL: 0.2 s COMM SYSTEM GEOMETRY: COMM HPRG CORRECTED RECEIVER DISTANCE BEHIND THE TRANSMITTER: -115.0 m COMM HPRG CORRECTED RECEIVER DISTANCE BELOW THE TRANSMITTER: -40.0 m COMM COMM RADAR ALTIMETER: Collins RL-50 COMM RECORDING INTERVAL: 0.2 s COMM COMM LASER ALTIMETER: Optech 501SB COMM RECORDING INTERVAL: 0.2 s COMM COMM NAVIGATION: Real-time differential GPS

Wiso & Reynolds Range, N.T. TEMPEST Survey – Toro Energy Limited Job No. 2364 Page 28
COMM RECORDING INTERVAL: 1.0 s COMM COMM ACQUISITION SYSTEM: FASDAS COMM COMM DATA PROCESSING COMM COMM TERRAIN CLEARANCE DATA COMM LASER ALTIMETER: PARALLAX CORRECTION APPLIED 0.0 s COMM RADAR ALTIMETER: PARALLAX CORRECTION APPLIED 0.0 s COMM COMM GPS ALTITUDE DATA COMM PARALLAX CORRECTION APPLIED 0.0 s COMM COMM DIGITAL TERRAIN DATA COMM DTM CALCULATED [DTM = GPS ALTITUDE - (LASER ALT + SENSOR SEPARATION)] COMM DATA CORRECTED TO AUSTRALIAN HEIGHT DATUM COMM DATA HAVE BEEN MICROLEVELLED COMM COMM ELECTROMAGNETIC DATA COMM SYSTEM PARALLAX REMOVED, AS FOLLOWS: COMM X-COMPONENT EM DATA -9.2 s COMM Z-COMPONENT EM DATA -9.4 s COMM DATA CORRECTED FOR TRANSMITTER HEIGHT, PITCH AND ROLL COMM DATA CORRECTED FOR TRANSMITTER-RECEIVER GEOMETRY VARIATIONS COMM DATA HAVE BEEN MICROLEVELLED COMM CONDUCTIVITY DEPTH INVERSION CALCULATED EMFlow V5.10 COMM CONDUCTIVITY DEPTH RANGE 000 - 500 m COMM CONDUCTIVITY DEPTH INTERVAL 5 m COMM CONDUCTIVITIES CALCULATED USING HPRG CORRECTED EMZ DATA COMM COMM ---------------------------------------------------------------------- COMM DISCLAIMER COMM ---------------------------------------------------------------------- COMM It is Fugro Airborne Survey’s understanding that the data provided to COMM the client is to be used for the purpose agreed between the parties. COMM That purpose was a significant factor in determining the scope and COMM level of the Services being offered to the Client. Should the purpose COMM for which the data is used change, the data may no longer be valid or COMM appropriate and any further use of, or reliance upon, the data in COMM those circumstances by the Client without Fugro Airborne Survey's COMM review and advice shall be at the Client's own or sole risk. COMM COMM The Services were performed by Fugro Airborne Survey exclusively for COMM the purposes of the Client. Should the data be made available in whole COMM or part to any third party, and such party relies thereon, that party COMM does so wholly at its own and sole risk and Fugro Airborne Survey COMM disclaims any liability to such party. COMM COMM Where the Services have involved Fugro Airborne Survey's use of any COMM information provided by the Client or third parties, upon which COMM Fugro Airborne Survey was reasonably entitled to rely, then the COMM Services are limited by the accuracy of such information. Fugro COMM Airborne Survey is not liable for any inaccuracies (including any COMM incompleteness) in the said information, save as otherwise provided COMM in the terms of the contract between the Client and Fugro Airborne COMM Survey. COMM COMM With regard to DIGITAL TERRAIN DATA, the accuracy of the elevation COMM calculation is directly dependent on the accuracy of the two input COMM parameters laser altitude and GPS altitude. The laser and radar altitude COMM value may be erroneous in areas of heavy tree cover, where the altimeters COMM reflect the distance to the tree canopy rather than the ground. The GPS

Wiso & Reynolds Range, N.T. TEMPEST Survey – Toro Energy Limited Job No. 2364 Page 29
COMM altitude value is primarily dependent on the number of available satellites. COMM Although post-processing of GPS data will yield X and Y accuracies in the COMM order of 1-2 metres, the accuracy of the altitude value is usually COMM much less, sometimes in the ±5 metre range. Further inaccuracies COMM may be introduced during the interpolation and gridding process. COMM Because of the inherent inaccuracies of this method, no guarantee is COMM made or implied that the information displayed is a true COMM representation of the height above sea level. Although this product COMM may be of some use as a general reference, COMM THIS PRODUCT MUST NOT BE USED FOR NAVIGATION PURPOSES. COMM ---------------------------------------------------------------------- COMM COMM ELECTROMAGNETIC SYSTEM COMM COMM TEMPEST IS A TIME-DOMAIN SQUARE-WAVE SYSTEM, COMM TRANSMITTING AT A BASE FREQUENCY OF 25Hz, COMM WITH 2 ORTHOGONAL-AXIS RECEIVER COILS IN A TOWED BIRD. COMM FINAL EM OUTPUT IS RECORDED 5 TIMES PER SECOND. COMM THE TIMES (IN MILLISECONDS) FOR THE 15 WINDOWS ARE: COMM COMM WINDOW START END CENTRE COMM 1 0.007 0.020 0.013 COMM 2 0.033 0.047 0.040 COMM 3 0.060 0.073 0.067 COMM 4 0.087 0.127 0.107 COMM 5 0.140 0.207 0.173 COMM 6 0.220 0.340 0.280 COMM 7 0.353 0.553 0.453 COMM 8 0.567 0.873 0.720 COMM 9 0.887 1.353 1.120 COMM 10 1.367 2.100 1.733 COMM 11 2.113 3.273 2.693 COMM 12 3.287 5.113 4.200 COMM 13 5.127 7.993 6.560 COMM 14 8.007 12.393 10.200 COMM 15 12.407 19.993 16.200 COMM COMM PULSE WIDTH: 10 ms COMM COMM TEMPEST EM data are transformed to the response that would be COMM obtained with a B-field sensor for a 100% duty cycle square COMM waveform at the base frequency, involving a 1A change in COMM current (from -0.5A to +0.5A to -0.5A) in a 1sq.m transmitter. COMM It is this configuration, rather than the actual acquisition COMM configuration, which must be specified when modelling TEMPEST data. COMM COMM COMM LOCATED DATA FORMAT COMM COMM Output field format : ASCII ASEG-GDF COMM COMM FIELD UNITS NULL FORMAT COMM Line -99999999 I10 COMM Flight -99 I4 COMM Fiducial -999999.9 F8.1 COMM Project_FAS -9999 I6 COMM Date -9999999 I9 COMM Time s -9999.9 F8.1 COMM Bearing deg -99 I4 COMM Latitude deg -99.9999999 F12.7 COMM Longitude deg -999.9999999 F13.7 COMM Easting m -99999.99 F10.2
Wiso & Reynolds Range, N.T. TEMPEST Survey – Toro Energy Limited Job No. 2364 Page 30
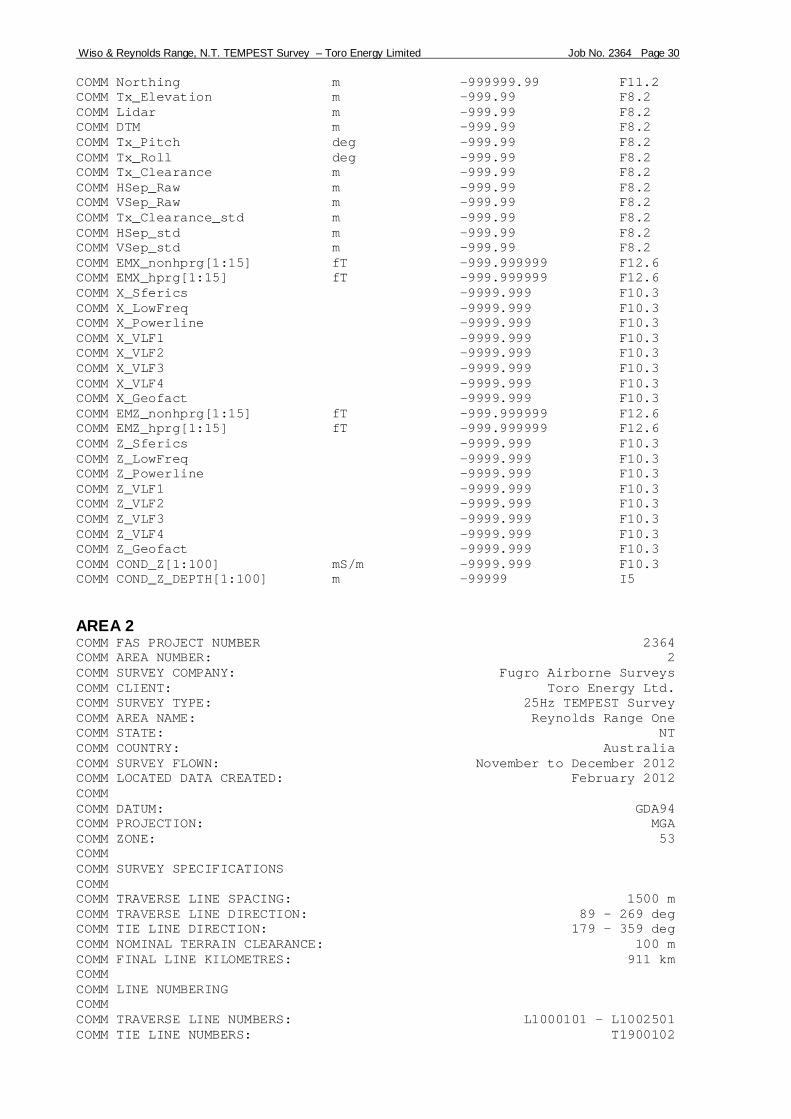
COMM Northing m -999999.99 F11.2 COMM Tx_Elevation m -999.99 F8.2 COMM Lidar m -999.99 F8.2 COMM DTM m -999.99 F8.2 COMM Tx_Pitch deg -999.99 F8.2 COMM Tx_Roll deg -999.99 F8.2 COMM Tx_Clearance m -999.99 F8.2 COMM HSep_Raw m -999.99 F8.2 COMM VSep_Raw m -999.99 F8.2 COMM Tx_Clearance_std m -999.99 F8.2 COMM HSep_std m -999.99 F8.2 COMM VSep_std m -999.99 F8.2 COMM EMX_nonhprg[1:15] fT -999.999999 F12.6 COMM EMX_hprg[1:15] fT -999.999999 F12.6 COMM X_Sferics -9999.999 F10.3 COMM X_LowFreq -9999.999 F10.3 COMM X_Powerline -9999.999 F10.3 COMM X_VLF1 -9999.999 F10.3 COMM X_VLF2 -9999.999 F10.3 COMM X_VLF3 -9999.999 F10.3 COMM X_VLF4 -9999.999 F10.3 COMM X_Geofact -9999.999 F10.3 COMM EMZ_nonhprg[1:15] fT -999.999999 F12.6 COMM EMZ_hprg[1:15] fT -999.999999 F12.6 COMM Z_Sferics -9999.999 F10.3 COMM Z_LowFreq -9999.999 F10.3 COMM Z_Powerline -9999.999 F10.3 COMM Z_VLF1 -9999.999 F10.3 COMM Z_VLF2 -9999.999 F10.3 COMM Z_VLF3 -9999.999 F10.3 COMM Z_VLF4 -9999.999 F10.3 COMM Z_Geofact -9999.999 F10.3 COMM COND_Z[1:100] mS/m -9999.999 F10.3 COMM COND_Z_DEPTH[1:100] m -99999 I5
AREA 2 COMM FAS PROJECT NUMBER 2364 COMM AREA NUMBER: 2 COMM SURVEY COMPANY: Fugro Airborne Surveys COMM CLIENT: Toro Energy Ltd. COMM SURVEY TYPE: 25Hz TEMPEST Survey COMM AREA NAME: Reynolds Range One COMM STATE: NT COMM COUNTRY: Australia COMM SURVEY FLOWN: November to December 2012 COMM LOCATED DATA CREATED: February 2012 COMM COMM DATUM: GDA94 COMM PROJECTION: MGA COMM ZONE: 53 COMM COMM SURVEY SPECIFICATIONS COMM COMM TRAVERSE LINE SPACING: 1500 m COMM TRAVERSE LINE DIRECTION: 89 - 269 deg COMM TIE LINE DIRECTION: 179 - 359 deg COMM NOMINAL TERRAIN CLEARANCE: 100 m COMM FINAL LINE KILOMETRES: 911 km COMM COMM LINE NUMBERING COMM COMM TRAVERSE LINE NUMBERS: L1000101 - L1002501 COMM TIE LINE NUMBERS: T1900102

Wiso & Reynolds Range, N.T. TEMPEST Survey – Toro Energy Limited Job No. 2364 Page 31
COMM COMM SURVEY EQUIPMENT COMM COMM AIRCRAFT: SHORTS SKYVAN, VH-WGT COMM COMM MAGNETOMETER: Scintrex Cs-2 Cesium Vapour COMM INSTALLATION: Stinger mounted COMM RESOLUTION: 0.001 nT COMM RECORDING INTERVAL: 0.2 s COMM COMM ELECTROMAGNETIC SYSTEM: 25Hz TEMPEST COMM INSTALLATION: Transmitter loop mounted on the aircraft COMM Receiver coils in a towed bird COMM COIL ORIENTATION: X,Z COMM RECORDING INTERVAL: 0.2 s COMM SYSTEM GEOMETRY: COMM HPRG CORRECTED RECEIVER DISTANCE BEHIND THE TRANSMITTER: -115.0 m COMM HPRG CORRECTED RECEIVER DISTANCE BELOW THE TRANSMITTER: -40.0 m COMM COMM RADAR ALTIMETER: Collins RL-50 COMM RECORDING INTERVAL: 0.2 s COMM COMM LASER ALTIMETER: Optech 501SB COMM RECORDING INTERVAL: 0.2 s COMM COMM NAVIGATION: Real-time differential GPS COMM RECORDING INTERVAL: 1.0 s COMM COMM ACQUISITION SYSTEM: FASDAS COMM COMM DATA PROCESSING COMM COMM TERRAIN CLEARANCE DATA COMM LASER ALTIMETER: PARALLAX CORRECTION APPLIED 0.0 s COMM RADAR ALTIMETER: PARALLAX CORRECTION APPLIED 0.0 s COMM COMM GPS ALTITUDE DATA COMM PARALLAX CORRECTION APPLIED 0.0 s COMM COMM DIGITAL TERRAIN DATA COMM DTM CALCULATED [DTM = GPS ALTITUDE - (LASER ALT + SENSOR SEPARATION)] COMM DATA CORRECTED TO AUSTRALIAN HEIGHT DATUM COMM DATA HAVE BEEN MICROLEVELLED COMM COMM ELECTROMAGNETIC DATA COMM SYSTEM PARALLAX REMOVED, AS FOLLOWS: COMM X-COMPONENT EM DATA -9.2 s COMM Z-COMPONENT EM DATA -9.4 s COMM DATA CORRECTED FOR TRANSMITTER HEIGHT, PITCH AND ROLL COMM DATA CORRECTED FOR TRANSMITTER-RECEIVER GEOMETRY VARIATIONS COMM DATA HAVE BEEN MICROLEVELLED COMM CONDUCTIVITY DEPTH INVERSION CALCULATED EMFlow V5.10 COMM CONDUCTIVITY DEPTH RANGE 000 - 500 m COMM CONDUCTIVITY DEPTH INTERVAL 5 m COMM CONDUCTIVITIES CALCULATED USING HPRG CORRECTED EMZ DATA COMM COMM ---------------------------------------------------------------------- COMM DISCLAIMER COMM ---------------------------------------------------------------------- COMM It is Fugro Airborne Survey’s understanding that the data provided to COMM the client is to be used for the purpose agreed between the parties. COMM That purpose was a significant factor in determining the scope and COMM level of the Services being offered to the Client. Should the purpose COMM for which the data is used change, the data may no longer be valid or

Wiso & Reynolds Range, N.T. TEMPEST Survey – Toro Energy Limited Job No. 2364 Page 32
COMM appropriate and any further use of, or reliance upon, the data in COMM those circumstances by the Client without Fugro Airborne Survey's COMM review and advice shall be at the Client's own or sole risk. COMM COMM The Services were performed by Fugro Airborne Survey exclusively for COMM the purposes of the Client. Should the data be made available in whole COMM or part to any third party, and such party relies thereon, that party COMM does so wholly at its own and sole risk and Fugro Airborne Survey COMM disclaims any liability to such party. COMM COMM Where the Services have involved Fugro Airborne Survey's use of any COMM information provided by the Client or third parties, upon which COMM Fugro Airborne Survey was reasonably entitled to rely, then the COMM Services are limited by the accuracy of such information. Fugro COMM Airborne Survey is not liable for any inaccuracies (including any COMM incompleteness) in the said information, save as otherwise provided COMM in the terms of the contract between the Client and Fugro Airborne COMM Survey. COMM COMM With regard to DIGITAL TERRAIN DATA, the accuracy of the elevation COMM calculation is directly dependent on the accuracy of the two input COMM parameters laser altitude and GPS altitude. The laser and radar altitude COMM value may be erroneous in areas of heavy tree cover, where the altimeters COMM reflect the distance to the tree canopy rather than the ground. The GPS COMM altitude value is primarily dependent on the number of available satellites. COMM Although post-processing of GPS data will yield X and Y accuracies in the COMM order of 1-2 metres, the accuracy of the altitude value is usually COMM much less, sometimes in the ±5 metre range. Further inaccuracies COMM may be introduced during the interpolation and gridding process. COMM Because of the inherent inaccuracies of this method, no guarantee is COMM made or implied that the information displayed is a true COMM representation of the height above sea level. Although this product COMM may be of some use as a general reference, COMM THIS PRODUCT MUST NOT BE USED FOR NAVIGATION PURPOSES. COMM ---------------------------------------------------------------------- COMM COMM ELECTROMAGNETIC SYSTEM COMM COMM TEMPEST IS A TIME-DOMAIN SQUARE-WAVE SYSTEM, COMM TRANSMITTING AT A BASE FREQUENCY OF 25Hz, COMM WITH 2 ORTHOGONAL-AXIS RECEIVER COILS IN A TOWED BIRD. COMM FINAL EM OUTPUT IS RECORDED 5 TIMES PER SECOND. COMM THE TIMES (IN MILLISECONDS) FOR THE 15 WINDOWS ARE: COMM COMM WINDOW START END CENTRE COMM 1 0.007 0.020 0.013 COMM 2 0.033 0.047 0.040 COMM 3 0.060 0.073 0.067 COMM 4 0.087 0.127 0.107 COMM 5 0.140 0.207 0.173 COMM 6 0.220 0.340 0.280 COMM 7 0.353 0.553 0.453 COMM 8 0.567 0.873 0.720 COMM 9 0.887 1.353 1.120 COMM 10 1.367 2.100 1.733 COMM 11 2.113 3.273 2.693 COMM 12 3.287 5.113 4.200 COMM 13 5.127 7.993 6.560 COMM 14 8.007 12.393 10.200 COMM 15 12.407 19.993 16.200 COMM

Wiso & Reynolds Range, N.T. TEMPEST Survey – Toro Energy Limited Job No. 2364 Page 33
COMM PULSE WIDTH: 10 ms COMM COMM TEMPEST EM data are transformed to the response that would be COMM obtained with a B-field sensor for a 100% duty cycle square COMM waveform at the base frequency, involving a 1A change in COMM current (from -0.5A to +0.5A to -0.5A) in a 1sq.m transmitter. COMM It is this configuration, rather than the actual acquisition COMM configuration, which must be specified when modelling TEMPEST data. COMM COMM COMM LOCATED DATA FORMAT COMM COMM Output field format : ASCII ASEG-GDF COMM COMM FIELD UNITS NULL FORMAT COMM Line -99999999 I10 COMM Flight -99 I4 COMM Fiducial -999999.9 F8.1 COMM Project_FAS -9999 I6 COMM Date -9999999 I9 COMM Time s -9999.9 F8.1 COMM Bearing deg -99 I4 COMM Latitude deg -99.9999999 F12.7 COMM Longitude deg -999.9999999 F13.7 COMM Easting m -99999.99 F10.2 COMM Northing m -999999.99 F11.2 COMM Tx_Elevation m -999.99 F8.2 COMM Lidar m -999.99 F8.2 COMM DTM m -999.99 F8.2 COMM Tx_Pitch deg -999.99 F8.2 COMM Tx_Roll deg -999.99 F8.2 COMM Tx_Clearance m -999.99 F8.2 COMM HSep_Raw m -999.99 F8.2 COMM VSep_Raw m -999.99 F8.2 COMM Tx_Clearance_std m -999.99 F8.2 COMM HSep_std m -999.99 F8.2 COMM VSep_std m -999.99 F8.2 COMM EMX_nonhprg[1:15] fT -999.999999 F12.6 COMM EMX_hprg[1:15] fT -999.999999 F12.6 COMM X_Sferics -9999.999 F10.3 COMM X_LowFreq -9999.999 F10.3 COMM X_Powerline -9999.999 F10.3 COMM X_VLF1 -9999.999 F10.3 COMM X_VLF2 -9999.999 F10.3 COMM X_VLF3 -9999.999 F10.3 COMM X_VLF4 -9999.999 F10.3 COMM X_Geofact -9999.999 F10.3 COMM EMZ_nonhprg[1:15] fT -999.999999 F12.6 COMM EMZ_hprg[1:15] fT -999.999999 F12.6 COMM Z_Sferics -9999.999 F10.3 COMM Z_LowFreq -9999.999 F10.3 COMM Z_Powerline -9999.999 F10.3 COMM Z_VLF1 -9999.999 F10.3 COMM Z_VLF2 -9999.999 F10.3 COMM Z_VLF3 -9999.999 F10.3 COMM Z_VLF4 -9999.999 F10.3 COMM Z_Geofact -9999.999 F10.3 COMM COND_Z[1:100] mS/m -9999.999 F10.3 COMM COND_Z_DEPTH[1:100] m -99999 I5
AREA 3 COMM FAS PROJECT NUMBER 2364 COMM AREA NUMBER: 3

Wiso & Reynolds Range, N.T. TEMPEST Survey – Toro Energy Limited Job No. 2364 Page 34
COMM SURVEY COMPANY: Fugro Airborne Surveys COMM CLIENT: Toro Energy Ltd. COMM SURVEY TYPE: 25Hz TEMPEST Survey COMM AREA NAME: Reynolds Range Two COMM STATE: NT COMM COUNTRY: Australia COMM SURVEY FLOWN: November to December 2012 COMM LOCATED DATA CREATED: February 2012 COMM COMM DATUM: GDA94 COMM PROJECTION: MGA COMM ZONE: 53 COMM COMM SURVEY SPECIFICATIONS COMM COMM TRAVERSE LINE SPACING: 500 m COMM TRAVERSE LINE DIRECTION: 35 - 215 deg COMM TIE LINE DIRECTION: 125 - 305 deg COMM NOMINAL TERRAIN CLEARANCE: 100 m COMM FINAL LINE KILOMETRES: 313 km COMM COMM LINE NUMBERING COMM COMM TRAVERSE LINE NUMBERS: L2000101 - L2003001 COMM TIE LINE NUMBERS: T2900101 COMM COMM SURVEY EQUIPMENT COMM COMM AIRCRAFT: SHORTS SKYVAN, VH-WGT COMM COMM MAGNETOMETER: Scintrex Cs-2 Cesium Vapour COMM INSTALLATION: Stinger mounted COMM RESOLUTION: 0.001 nT COMM RECORDING INTERVAL: 0.2 s COMM COMM ELECTROMAGNETIC SYSTEM: 25Hz TEMPEST COMM INSTALLATION: Transmitter loop mounted on the aircraft COMM Receiver coils in a towed bird COMM COIL ORIENTATION: X,Z COMM RECORDING INTERVAL: 0.2 s COMM SYSTEM GEOMETRY: COMM HPRG CORRECTED RECEIVER DISTANCE BEHIND THE TRANSMITTER: -115.0 m COMM HPRG CORRECTED RECEIVER DISTANCE BELOW THE TRANSMITTER: -40.0 m COMM COMM RADAR ALTIMETER: Collins RL-50 COMM RECORDING INTERVAL: 0.2 s COMM COMM LASER ALTIMETER: Optech 501SB COMM RECORDING INTERVAL: 0.2 s COMM COMM NAVIGATION: Real-time differential GPS COMM RECORDING INTERVAL: 1.0 s COMM COMM ACQUISITION SYSTEM: FASDAS COMM COMM DATA PROCESSING COMM COMM TERRAIN CLEARANCE DATA COMM LASER ALTIMETER: PARALLAX CORRECTION APPLIED 0.0 s COMM RADAR ALTIMETER: PARALLAX CORRECTION APPLIED 0.0 s COMM COMM GPS ALTITUDE DATA COMM PARALLAX CORRECTION APPLIED 0.0 s COMM

Wiso & Reynolds Range, N.T. TEMPEST Survey – Toro Energy Limited Job No. 2364 Page 35
COMM DIGITAL TERRAIN DATA COMM DTM CALCULATED [DTM = GPS ALTITUDE - (LASER ALT + SENSOR SEPARATION)] COMM DATA CORRECTED TO AUSTRALIAN HEIGHT DATUM COMM DATA HAVE BEEN MICROLEVELLED COMM COMM ELECTROMAGNETIC DATA COMM SYSTEM PARALLAX REMOVED, AS FOLLOWS: COMM X-COMPONENT EM DATA -9.2 s COMM Z-COMPONENT EM DATA -9.4 s COMM DATA CORRECTED FOR TRANSMITTER HEIGHT, PITCH AND ROLL COMM DATA CORRECTED FOR TRANSMITTER-RECEIVER GEOMETRY VARIATIONS COMM DATA HAVE BEEN MICROLEVELLED COMM CONDUCTIVITY DEPTH INVERSION CALCULATED EMFlow V5.10 COMM CONDUCTIVITY DEPTH RANGE 000 - 500 m COMM CONDUCTIVITY DEPTH INTERVAL 5 m COMM CONDUCTIVITIES CALCULATED USING LEVELLED HPRG CORRECTED EMZ DATA COMM COMM ---------------------------------------------------------------------- COMM DISCLAIMER COMM ---------------------------------------------------------------------- COMM It is Fugro Airborne Survey’s understanding that the data provided to COMM the client is to be used for the purpose agreed between the parties. COMM That purpose was a significant factor in determining the scope and COMM level of the Services being offered to the Client. Should the purpose COMM for which the data is used change, the data may no longer be valid or COMM appropriate and any further use of, or reliance upon, the data in COMM those circumstances by the Client without Fugro Airborne Survey's COMM review and advice shall be at the Client's own or sole risk. COMM COMM The Services were performed by Fugro Airborne Survey exclusively for COMM the purposes of the Client. Should the data be made available in whole COMM or part to any third party, and such party relies thereon, that party COMM does so wholly at its own and sole risk and Fugro Airborne Survey COMM disclaims any liability to such party. COMM COMM Where the Services have involved Fugro Airborne Survey's use of any COMM information provided by the Client or third parties, upon which COMM Fugro Airborne Survey was reasonably entitled to rely, then the COMM Services are limited by the accuracy of such information. Fugro COMM Airborne Survey is not liable for any inaccuracies (including any COMM incompleteness) in the said information, save as otherwise provided COMM in the terms of the contract between the Client and Fugro Airborne COMM Survey. COMM COMM With regard to DIGITAL TERRAIN DATA, the accuracy of the elevation COMM calculation is directly dependent on the accuracy of the two input COMM parameters laser altitude and GPS altitude. The laser and radar altitude COMM value may be erroneous in areas of heavy tree cover, where the altimeters COMM reflect the distance to the tree canopy rather than the ground. The GPS COMM altitude value is primarily dependent on the number of available satellites. COMM Although post-processing of GPS data will yield X and Y accuracies in the COMM order of 1-2 metres, the accuracy of the altitude value is usually COMM much less, sometimes in the ±5 metre range. Further inaccuracies COMM may be introduced during the interpolation and gridding process. COMM Because of the inherent inaccuracies of this method, no guarantee is COMM made or implied that the information displayed is a true COMM representation of the height above sea level. Although this product COMM may be of some use as a general reference, COMM THIS PRODUCT MUST NOT BE USED FOR NAVIGATION PURPOSES. COMM ---------------------------------------------------------------------- COMM
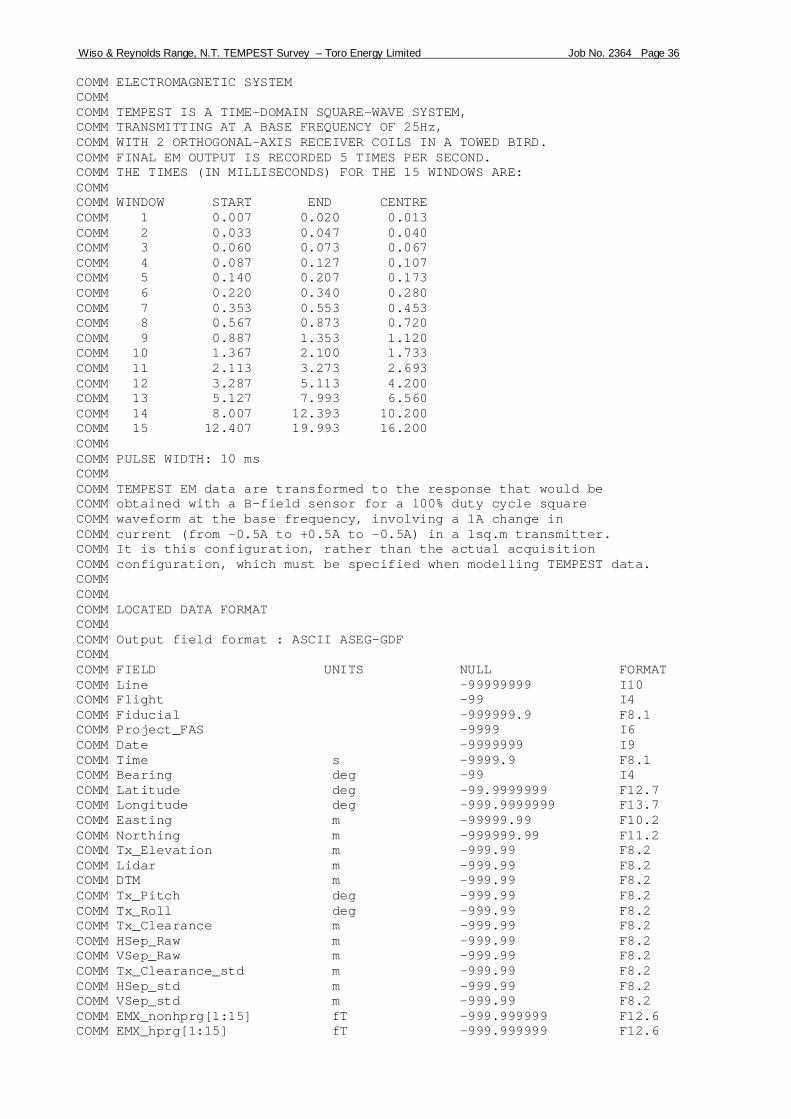
Wiso & Reynolds Range, N.T. TEMPEST Survey – Toro Energy Limited Job No. 2364 Page 36
COMM ELECTROMAGNETIC SYSTEM COMM COMM TEMPEST IS A TIME-DOMAIN SQUARE-WAVE SYSTEM, COMM TRANSMITTING AT A BASE FREQUENCY OF 25Hz, COMM WITH 2 ORTHOGONAL-AXIS RECEIVER COILS IN A TOWED BIRD. COMM FINAL EM OUTPUT IS RECORDED 5 TIMES PER SECOND. COMM THE TIMES (IN MILLISECONDS) FOR THE 15 WINDOWS ARE: COMM COMM WINDOW START END CENTRE COMM 1 0.007 0.020 0.013 COMM 2 0.033 0.047 0.040 COMM 3 0.060 0.073 0.067 COMM 4 0.087 0.127 0.107 COMM 5 0.140 0.207 0.173 COMM 6 0.220 0.340 0.280 COMM 7 0.353 0.553 0.453 COMM 8 0.567 0.873 0.720 COMM 9 0.887 1.353 1.120 COMM 10 1.367 2.100 1.733 COMM 11 2.113 3.273 2.693 COMM 12 3.287 5.113 4.200 COMM 13 5.127 7.993 6.560 COMM 14 8.007 12.393 10.200 COMM 15 12.407 19.993 16.200 COMM COMM PULSE WIDTH: 10 ms COMM COMM TEMPEST EM data are transformed to the response that would be COMM obtained with a B-field sensor for a 100% duty cycle square COMM waveform at the base frequency, involving a 1A change in COMM current (from -0.5A to +0.5A to -0.5A) in a 1sq.m transmitter. COMM It is this configuration, rather than the actual acquisition COMM configuration, which must be specified when modelling TEMPEST data. COMM COMM COMM LOCATED DATA FORMAT COMM COMM Output field format : ASCII ASEG-GDF COMM COMM FIELD UNITS NULL FORMAT COMM Line -99999999 I10 COMM Flight -99 I4 COMM Fiducial -999999.9 F8.1 COMM Project_FAS -9999 I6 COMM Date -9999999 I9 COMM Time s -9999.9 F8.1 COMM Bearing deg -99 I4 COMM Latitude deg -99.9999999 F12.7 COMM Longitude deg -999.9999999 F13.7 COMM Easting m -99999.99 F10.2 COMM Northing m -999999.99 F11.2 COMM Tx_Elevation m -999.99 F8.2 COMM Lidar m -999.99 F8.2 COMM DTM m -999.99 F8.2 COMM Tx_Pitch deg -999.99 F8.2 COMM Tx_Roll deg -999.99 F8.2 COMM Tx_Clearance m -999.99 F8.2 COMM HSep_Raw m -999.99 F8.2 COMM VSep_Raw m -999.99 F8.2 COMM Tx_Clearance_std m -999.99 F8.2 COMM HSep_std m -999.99 F8.2 COMM VSep_std m -999.99 F8.2 COMM EMX_nonhprg[1:15] fT -999.999999 F12.6 COMM EMX_hprg[1:15] fT -999.999999 F12.6

Wiso & Reynolds Range, N.T. TEMPEST Survey – Toro Energy Limited Job No. 2364 Page 37
COMM X_Sferics -9999.999 F10.3 COMM X_LowFreq -9999.999 F10.3 COMM X_Powerline -9999.999 F10.3 COMM X_VLF1 -9999.999 F10.3 COMM X_VLF2 -9999.999 F10.3 COMM X_VLF3 -9999.999 F10.3 COMM X_VLF4 -9999.999 F10.3 COMM X_Geofact -9999.999 F10.3 COMM EMZ_nonhprg[1:15] fT -999.999999 F12.6 COMM EMZ_hprg[1:15] fT -999.999999 F12.6 COMM Z_Sferics -9999.999 F10.3 COMM Z_LowFreq -9999.999 F10.3 COMM Z_Powerline -9999.999 F10.3 COMM Z_VLF1 -9999.999 F10.3 COMM Z_VLF2 -9999.999 F10.3 COMM Z_VLF3 -9999.999 F10.3 COMM Z_VLF4 -9999.999 F10.3 COMM Z_Geofact -9999.999 F10.3 COMM COND_Z[1:100] mS/m -9999.999 F10.3 COMM COND_Z_DEPTH[1:100] m -99999 I5

Wiso & Reynolds Range, N.T. TEMPEST Survey – Toro Energy Limited Job No. 2364 Page 38
APPENDIX III – List of all Supplied Data and Products STANDARD DELIVERABLES
• Raw Products o Raw Grids (Georeferenced TIFF format)
� Raw CDI’s for all of the survey lines � Raw EM Channels (X and Z) for all 15 windows
• Preliminary Products o Preliminary Grids (ERMapper format GDA94 MGA53S)
� Digital Terrain Model � 15 channels of X-component � 15 channels of Z-component � EM Time Constant for X-component � EM Time Constant for Z-component
• Final Products o Final Located Data (ASEG-GDF II Format)
� 2364_[1,2,3]_Final.des - header file describing the contents of the located data � 2364_[1,2,3]_Final.asc - flat ascii file containing located EM and digital terrain
data � 2364_[1,2,3]_Final.gdb - Geosoft database file containing located EM and digital
terrain data
o Final Grids (ERMapper format GDA94 MGA53S) � Digital Terrain Model � 15 channels of X-component � 15 channels of Z-component � EM Time Constant for X-component � EM Time Constant for Z-component
o Final Digital Products
� Flight Path map (PNG format) � Z-Component Conductivity Depth Image (CDI) Multiplots & Stacked sections
(PDF format)
o Acquisition and Processing Report � Delivered as hardcopy and digitally in PDF format
• Additional Products
o Additional Grids � Georeferenced CDI in Georeferenced TIFF [TIF], Enhanced Compression
Wavelet [ECW] and Geosoft Grid [GRD] formats