2.2 Phase II Clinical Trials - web.njit.edu
34
CHAPTER 2 ST 520, D. Zhang 2.2 Phase II Clinical Trials Phase II clinical trials usually are conducted to assess • feasibility of treatment • side effects and toxicity • logistics of administration and cost • dose finding (lowest dose level with good efficacy) Major issue: Is there enough evidence of efficacy of the new drug to move to phase III? Surrogate markers are often used. Usually, one-arm (no comparison) Slide 99
Transcript of 2.2 Phase II Clinical Trials - web.njit.edu

CHAPTER 2 ST 520, D. Zhang
2.2 Phase II Clinical Trials
Phase II clinical trials usually are conducted to assess
• feasibility of treatment
• side effects and toxicity
• logistics of administration and cost
• dose finding (lowest dose level with good efficacy)
Major issue: Is there enough evidence of efficacy of the new drug to
move to phase III?
Surrogate markers are often used.
Usually, one-arm (no comparison)
Slide 99
Wenge
Text Box
Wenge
Text Box

CHAPTER 2 ST 520, D. Zhang
Example: Suppose a new drug is developed for patients with lung
cancer. Ultimately, we would like to know whether this drug will extend
the life of lung cancer patients as compared to currently available
treatments. Establishing the effect of a new drug on survival would
require a long study with relatively large number of patients and thus
may not be suitable as a screening mechanism. Instead, during phase II,
the effect of the new drug may be assessed based on tumor shrinkage in
the first few weeks of treatment. If the new drug shrinks tumors
sufficiently for a sufficiently large proportion of patients, then this may
be used as evidence for further testing.
Slide 100
Wenge
Text Box
Wenge
Text Box

CHAPTER 2 ST 520, D. Zhang
In this example,
Overall (or disease-free) survival time = clinical endpoint
tumor shrinkage = surrogate markers
Other examples of surrogate markers are
• Lowering blood pressure or cholesterol for patients with heart disease
• Increasing CD4 counts or decreasing viral load for patients with HIV
disease
Slide 101
Wenge
Text Box
Wenge
Text Box

CHAPTER 2 ST 520, D. Zhang
Caution in using surrogate markers:
• surrogacy is difficult to establish.
• If the new drug has no effect on the surrogate markers, it is
probably more likely that the new drug will have no effect on the
final clinical endpoint.
• However, sometimes it is possible that the new drug may have effect
on the surrogate markers but have no effect on the final clinical
endpoint.
Slide 102
Wenge
Text Box
Wenge
Text Box

CHAPTER 2 ST 520, D. Zhang
Statistical Issues and Methods:
Goal: estimate the effect of the new drug on some endpoint (a
surrogate marker, safety endpoint, etc) with enough precision to decide
whether we investigate the new drug in phase III.
Examples:
• probability of a random patient responding to treatment (response
has to be unambiguously defined)
• probability that a treated patient has side effects
• average decrease in blood pressure over a two week period
Slide 103
Wenge
Text Box
Wenge
Text Box

CHAPTER 2 ST 520, D. Zhang
Consider a binary endpoint:
whether or not a patient responds to the new drug; whether or not a
patient will have side effects, etc.
Suppose n patients are treated with the new drug:
X ∼ bin(n, π)
• X = total number of patients who respond to the new drug
• π = population response rate (if the whole patient population is
given the new drug.)
One objective: estimate π with enough precision.
Slide 104
Wenge
Text Box
Wenge
Text Box

CHAPTER 2 ST 520, D. Zhang
Properties of a binomial distribution:
• E(X) = nπ, where E(·) denotes the expectation of a random
variable.
• V ar(X) = nπ(1 − π), where V ar(·) denotes the variance of a
random variable.
• P (X = k) =
n
k
πk(1 − π)n−k, where P (·) denotes the
probability of an event, and
n
k
= n!
k!(n−k)!
• Denote the sample proportion by p = X/n, then
⋆ E(p) = π
⋆ V ar(p) = π(1 − π)/n
• When n is sufficiently large, the distribution of the sample
proportion p = X/n is well approximated by a normal distribution
Slide 105
Wenge
Text Box
Wenge
Text Box

CHAPTER 2 ST 520, D. Zhang
with mean π and variance π(1 − π)/n.
p ∼ N(π, π(1 − π)/n)
• A large sample (1 − α) CI of π can be constructed as
p± zα/2{p(1 − p)/n}1/2.
• A large sample 95% CI of π:
p± 1.96{p(1 − p)/n}1/2.
• Can be used to calculate sample size n.
Slide 106
Wenge
Text Box
Wenge
Text Box

CHAPTER 2 ST 520, D. Zhang
Example: Suppose our best guess for the response rate of a new drug
is about 35%; if we want the precision of our estimator to be such that
the 95% confidence interval is within 15% of the true π, then we need
1.96
{(.35)(.65)
n
}1/2
= .15,
or
n =(1.96)2(.35)(.65)
(.15)2= 39 patients.
Slide 107
Wenge
Text Box
Wenge
Text Box

CHAPTER 2 ST 520, D. Zhang
Exact Confidence Intervals
If nπ or n(1 − π) is small, then the normal approximation may not be
accurate.
=⇒ Exact CI.
Definition: A (1 − α)-th confidence region (interval) for π: C(k) (k =
observed # of response) such that
Pπ{C(X) ⊃ π} ≥ 1 − α, for all 0 ≤ π ≤ 1.
Question: How to find C(k) for given k responses out of n patients?
Slide 108
Wenge
Text Box
Wenge
Text Box

CHAPTER 2 ST 520, D. Zhang
Consider testing the following hypothesis:
H0 : π = π0 v.s. Ha : π 6= π0
for some π0.
• Intuitively, we would reject H0 if k is too small or too large.
• Equivalently, we would accept H0 if k is neither too small nor too
large; that is, there is an interval (or region) A(π0) (determined by
π0) such that we would not reject (and hence accept) H0 if
k ∈ A(π0).
• A(π0) is called the acceptance region.
• If we set the type I error probability of the above testing procedure
at α, then we have:
P [X ∈ A(π0)|H0] ≥ 1 − α for X ∼ bin(n, π0).
Slide 109
Wenge
Text Box
Wenge
Text Box

CHAPTER 2 ST 520, D. Zhang
• For given observed k, solving k ∈ A(π0) will usually give us an
interval C(k) = [πL(k), πU (k)], which is the exact (1 − α) CI of π.
• Suppose we observe k responses out of n patients, then for any
π0 ∈ [πL(k), πU (k)], we would not reject H0
• That is, the above CI consists of all values of π0 which is consistent
with H0 given k.
• Question: How to find πL(k) and πU (k)?
Slide 110
Wenge
Text Box
Wenge
Text Box

CHAPTER 2 ST 520, D. Zhang
Figure 1: Exact confidence intervals
parameter space (pi)
sam
ple
spac
e (
x={0
,1,..
.,n}
)
0 pi_L(k) pi pi_U(k) 1
0
k
n
<=alpha/2
A(pi)
<=alpha/2
Slide 111
Wenge
Text Box
Wenge
Text Box

CHAPTER 2 ST 520, D. Zhang
• The figure indicates that for given k, πL(k) and πU (k) have to
satisfy
PπL(k)[X ≥ k] =
n∑
j=k
n
j
πL(k)j{1 − πL(k)}n−j = α/2,
PπU (k)[X ≤ k] =k∑
j=0
n
j
πU (k)j{1 − πU (k)}n−j = α/2.
• πL(k) and πU (k) can be solved using binomial tables or through
statistical software.
• When k = 0, the first equation has no solution. Set πL(k) = 0.
πU (k) can be solved.
• When k = n, the second equation has no solution. Set πU (k) = 1.
πL(k) can be solved.
Slide 112
Wenge
Text Box
Wenge
Text Box

CHAPTER 2 ST 520, D. Zhang
• Remark: Since X has a discrete distribution, the way we define
the (1 − α)-th confidence interval above will yield
Pπ{π ∈ [πL(k), πU (k)]} > 1 − α
(strict inequality) for most values of 0 ≤ π ≤ 1. Strict equality
cannot be achieved because of the discreteness of the binomial
random variable.
Slide 113
Wenge
Text Box
Wenge
Text Box

CHAPTER 2 ST 520, D. Zhang
Example: Suppose in a Phase II clinical trial, 3 of 19 patients respond
to α-interferon treatment for multiple sclerosis.
• 95% CI of π based Normal approximation:
3
19± 1.96
( 319 × 16
19
19
)1/2
= [−.006, .322].
• Exact 95% CI: need to find out πL(3) and πU (3) (n = 19, k = 3)
such that
PπL(3)(X ≥ 3) = .025 ⇐⇒ PπL(3)(X ≤ 2) = .975
PπU (3)(X ≤ 3) = .025.
=⇒ (using binomial tables)
πL(3) ≈ .03, πU (3) ≈ .40
Slide 114
Wenge
Text Box
Wenge
Text Box

CHAPTER 2 ST 520, D. Zhang
Figure 2: Find Exact CI
0.0 0.2 0.4 0.6 0.8 1.0
0.0
0.2
0.4
0.6
0.8
1.0
p
h(p)
h(p) = P[X <= 3] or h(p) = P[X <= 2] for X ~ Bin(19, p)
0.3957846
0.0338P[X<=3]P[X<=2]
Slide 115
Wenge
Text Box
Wenge
Text Box

CHAPTER 2 ST 520, D. Zhang
• SAS function for P [X ≤ k] where X ∼ bin(n, p):
probbnml(p, n, k)
• R function for P [X ≤ k]:
pbinom(k, n, p)
Slide 116
Wenge
Text Box
Wenge
Text Box

CHAPTER 2 ST 520, D. Zhang
options ls=80 ps=200 nodate;
data binprob;
do pi=0.35 to 0.45 by 0.01;
prob = probbnml(pi, 19, 3);
output;
end;
run;
proc print data=binprob;
run;
Obs pi prob
1 0.35 0.059140
2 0.36 0.049483
3 0.37 0.041180
4 0.38 0.034083
5 0.39 0.028053
6 0.40 0.022959
7 0.41 0.018683
8 0.42 0.015115
9 0.43 0.012156
10 0.44 0.009717
11 0.45 0.007719
Slide 117
Wenge
Text Box
Wenge
Text Box

CHAPTER 2 ST 520, D. Zhang
Gehan’s Two-Stage Design
One goal of a phase II trial is to discard ineffective treatments early.
Gehan’s Two-Stage Design achieves this goal with 2 stages in a
trial:
• Stage I: Give the new treatment to n0 patients. If no patient
responds, declare the treatment ineffective.
• Stage II: If at least one patient responds in stage I, add n− n0
patients and count the total number of patients responding to the
new treatment. Calculate point estimate of π and construct a CI for
π.
Slide 118
Wenge
Text Box
Wenge
Text Box

CHAPTER 2 ST 520, D. Zhang
How to determine n0 and n?
• Determine n0: denote X = # responses out of n0 patients.
P [X = 0] = (1 − π)n0 .
• π0 = minimal efficacy; that is, if π ≥ π0, we want to investigate the
new drug in phase III.
• We would like to control the probability of discarding the new drug
early if in fact it is promising.
• That is, n0 has to satisfy:
P [X = 0] = (1 − π)n0 ≤ α0 for all π ≥ π0,
where α0 is our tolerance.
Slide 119
Wenge
Text Box
Wenge
Text Box

CHAPTER 2 ST 520, D. Zhang
• Since P [X = 0] = (1− π)n0 is an deceasing function of π, only need
(1 − π0)n0 ≤ α0.
=⇒n0 log(1 − π0) ≤ log(α0)
=⇒n0 ≥ log(α0)
log(1 − π0)
• For example, π0 = 0.2, α0 = 0.05, then
n0 ≥ log(0.05)
log(1 − 0.2)= 14(round up).
• Determine n: based on precision of 95% CI.
• For example, want to be 95% sure that the estimate is within ±15%
of the minimum π0 = 0.2:
1.96
(.2 × .8
n
)1/2
= .15, or n = 28.
Slide 120
Wenge
Text Box
Wenge
Text Box

CHAPTER 2 ST 520, D. Zhang
0.0 0.2 0.4 0.6 0.8 1.0
0.0
0.2
0.4
0.6
0.8
1.0
p
h(p)
Probability of no reponse
n0=5n0=10n0=14
Slide 121
Wenge
Text Box
Wenge
Text Box

CHAPTER 2 ST 520, D. Zhang
Simon’s Two-Stage Design
Suppose two values π0 < π1 are pre-specified such that
pi = response rate
0 pi_0 pi_1 1
Drug is ineffective Indifference region Drug is effective
Slide 122
Wenge
Text Box
Wenge
Text Box

CHAPTER 2 ST 520, D. Zhang
• If π ≤ π0, then we want to declare the drug ineffective with high
probability, say 1 − α, where α is taken to be small.
• If π ≥ π1, then we want to consider this drug for further
investigation with high probability, say 1 − β, where β is taken to be
small.
The values of α and β are generally taken to be between .05 and .20.
Slide 123
Wenge
Text Box
Wenge
Text Box
CHAPTER 2 ST 520, D. Zhang
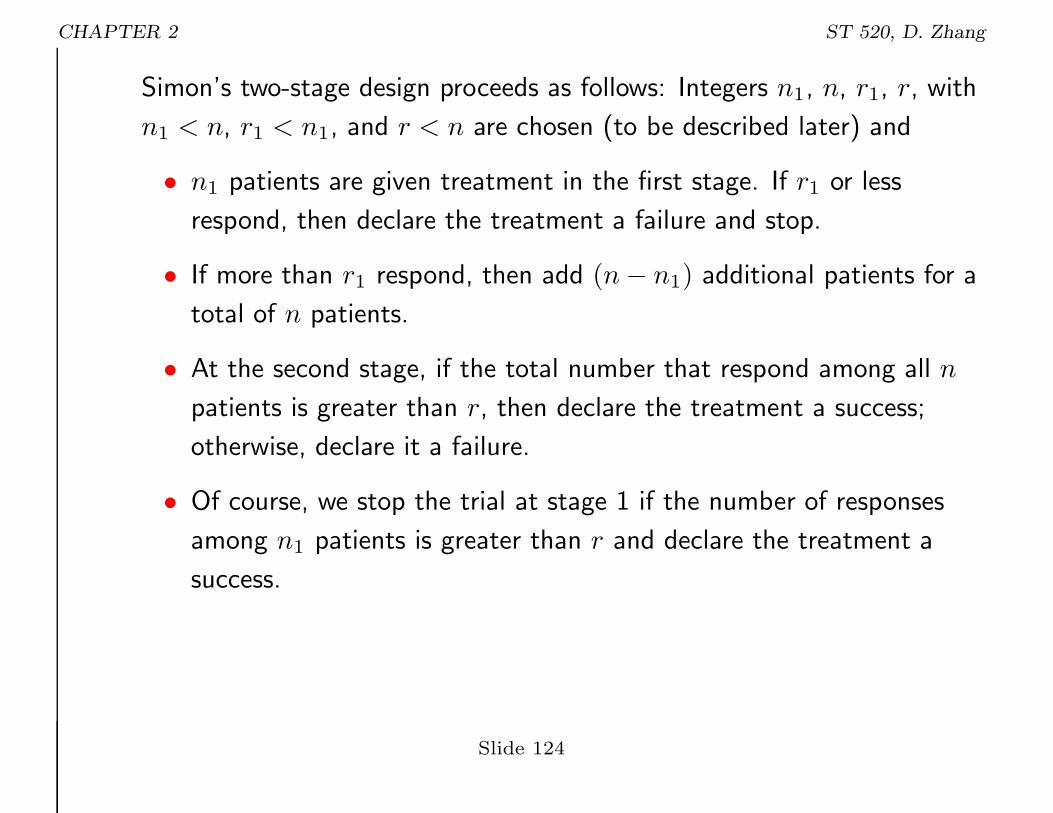
Simon’s two-stage design proceeds as follows: Integers n1, n, r1, r, with
n1 < n, r1 < n1, and r < n are chosen (to be described later) and
• n1 patients are given treatment in the first stage. If r1 or less
respond, then declare the treatment a failure and stop.
• If more than r1 respond, then add (n− n1) additional patients for a
total of n patients.
• At the second stage, if the total number that respond among all n
patients is greater than r, then declare the treatment a success;
otherwise, declare it a failure.
• Of course, we stop the trial at stage 1 if the number of responses
among n1 patients is greater than r and declare the treatment a
success.
Slide 124
Wenge
Text Box
Wenge
Text Box
CHAPTER 2 ST 520, D. Zhang
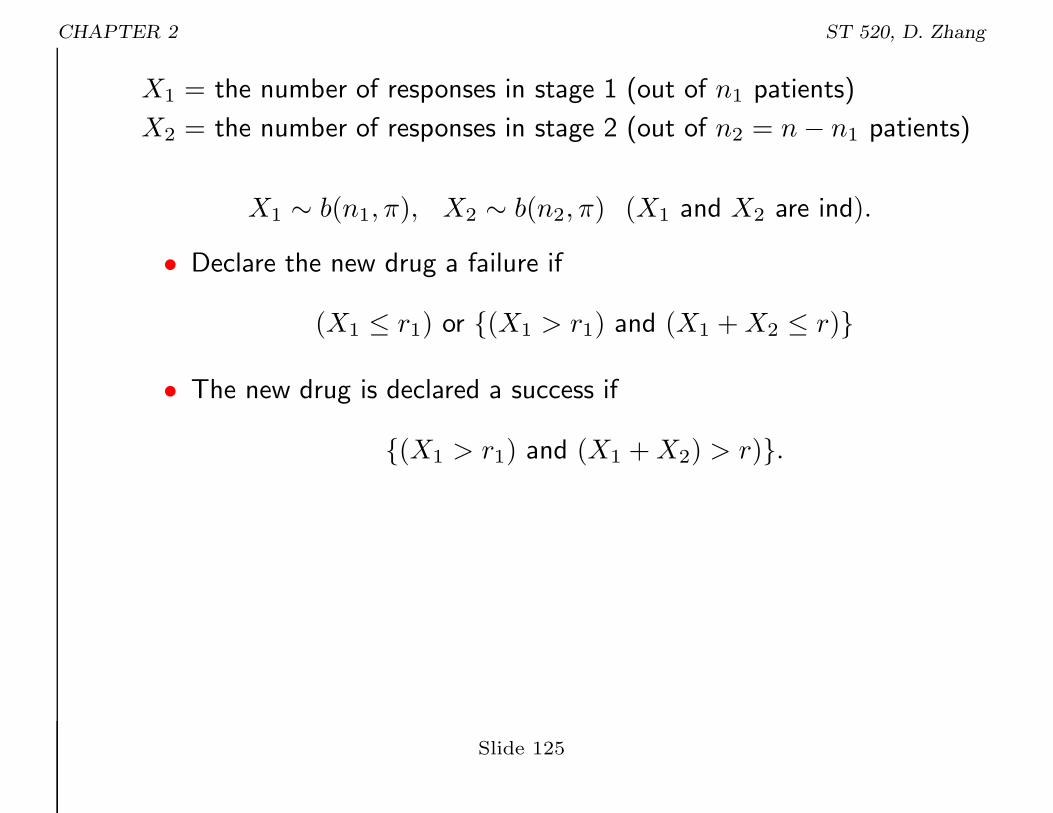
X1 = the number of responses in stage 1 (out of n1 patients)
X2 = the number of responses in stage 2 (out of n2 = n− n1 patients)
X1 ∼ b(n1, π), X2 ∼ b(n2, π) (X1 and X2 are ind).
• Declare the new drug a failure if
(X1 ≤ r1) or {(X1 > r1) and (X1 +X2 ≤ r)}
• The new drug is declared a success if
{(X1 > r1) and (X1 +X2) > r)}.
Slide 125
Wenge
Text Box
Wenge
Text Box

CHAPTER 2 ST 520, D. Zhang
• Design constraints =⇒
P{(X1 > r1) and (X1 +X2 > r)} ≤ α for all π ≤ π0 (2.1)
P{(X1 > r1) and (X1 +X2 > r)} ≥ 1 − β for all π ≥ π1 (2.2)
• Denote the power function by
h(π) = P{(X1 > r1) and (X1 +X2 > r)|π}.
• It can be shown that h(π) is an increasing function of π for any
n1, r1, n, r.
• Therefore, criteria (2.1) and (2.2) are equivalent to
P{(X1 > r1) and (X1 +X2 > r)|π = π0} = α
P{(X1 > r1) and (X1 +X2 > r)|π = π1} = 1 − β.
Slide 126
Wenge
Text Box
Wenge
Text Box

CHAPTER 2 ST 520, D. Zhang
Figure 3: Power Function of Simon’s Design
0.0 0.2 0.4 0.6 0.8 1.0
0.0
0.2
0.4
0.6
0.8
1.0
p
pow
er
Slide 127
Wenge
Text Box
Wenge
Text Box

CHAPTER 2 ST 520, D. Zhang
• How to calculate P{(X1 > r1) and (X1 +X2 > r)|π} for each π?
• By independence of X1 and X2:
P{(X1 > r1) and (X1 +X2 > r)|π}=
∑
m1>r1,m1+m2>r
P [X1 = m1, X2 = m2]
=∑
m1>r1,m1+m2>r
P [X1 = m1]P [X2 = m2]
Slide 128
Wenge
Text Box
Wenge
Text Box

CHAPTER 2 ST 520, D. Zhang
Figure 4: Example: n1 = 8, n = 14, X1 > 3, and X1 +X2 > 6
X_1
X_2
0 2 4 6 8
01
23
45
6
Slide 129
Wenge
Text Box
Wenge
Text Box

CHAPTER 2 ST 520, D. Zhang
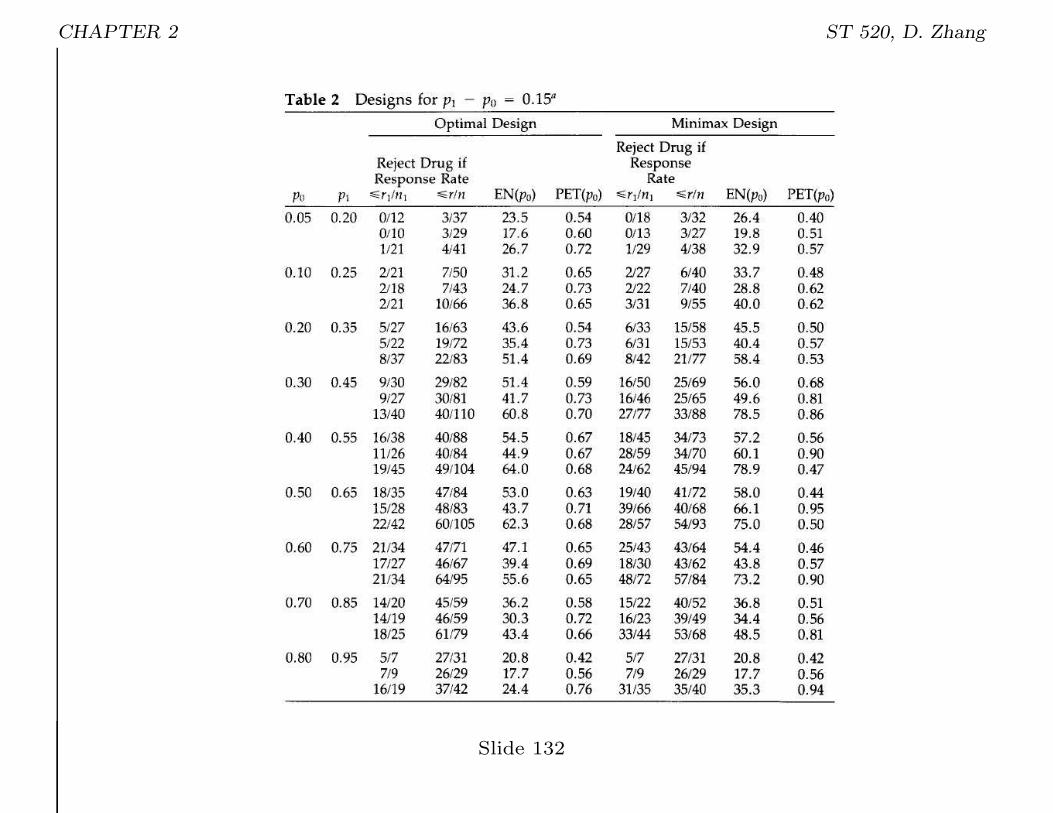
• Many combinations of (r1, n1, r, n) satisfy (2.1) and (2.2).
• “Optimal design” is the one that has smallest expected sample
size when π = π0 (when the new drug is ineffective)
• The expected sample size when π = π0:
n1P (stopping at stage 1) + nP (did not stop at stage 1)
= n1{P (X1 ≤ r1|π = π0) + P (X1 > r|π = π0)}+nP (r1 + 1 ≤ X1 ≤ r|π = π0)
• Through computer search, the optimal design can be identified.
• Simon, R. (1989). Optimal two-stage designs for Phase II clinical
trials. Controlled Clinical Trials. 10: 1-10.
• Software can be downloaded from Dr. Simon’s website (see class
website)
Slide 130
Wenge
Text Box
Wenge
Text Box

CHAPTER 2 ST 520, D. Zhang
Slide 131
Wenge
Text Box
Wenge
Text Box
CHAPTER 2 ST 520, D. Zhang
Slide 132
Wenge
Text Box
Wenge
Text Box