22. GAS HYDRATE AND FREE GAS SATURATIONS ESTIMATED …
25
Tréhu, A.M., Bohrmann, G., Torres, M.E., and Colwell, F.S. (Eds.) Proceedings of the Ocean Drilling Program, Scientific Results Volume 204 22. GAS HYDRATE AND FREE GAS SATURATIONS ESTIMATED FROM V ELOCITY LOGS ON HYDRATE RIDGE, OFFSHORE OREGON, USA 1 M.W. Lee 2 and T.S. Collett 2 ABSTRACT During Ocean Drilling Program Leg 204, nine sites were logged on the Oregon continental margin, where one of the objectives of the inte- grated downhole logging program was to determine the distribution and saturation of gas hydrates and free gas in an accretionary ridge and adjacent slope basin. Downhole logs measured at Sites 1244, 1245, and 1247, drilled on Hydrate Ridge, were analyzed to constrain the physical properties of in situ gas-hydrate-bearing sediments. Saturations of gas hydrate in pore space are estimated from shear-wave (S-wave) velocities using the modified Biot-Gassmann theory, referred to as the BGTL. The average gas hydrate saturations are 10%, 10%, and 6% for Site 1244 (76–127 meters below seafloor [mbsf]), Site 1245 (73–129 mbsf), and Site 1247 (74–129 mbsf), respectively, and are comparable to estimates from downhole electrical resistivity logs. Free gas saturations were also estimated from the Biot-Gassmann theory with parameters derived from the BGTL using compressional-wave (P-wave) velocities and from elastic moduli using both P- and S-wave velocities. The exact amount of free gas is difficult to determine because of the uncertainties associated with the mode of gas distribution (patchy or uniform), but both meth- ods provide comparable estimates for free gas saturations. This study suggests that free gas coexists with gas hydrate in the gas hydrate stabil- ity zone at these sites. This is the first reported evidence for coexistence of gas hydrate and free gas away from the summit vents. 1 Lee, M.W., and Collett, T.S., 2006. Gas hydrate and free gas saturations estimated from velocity logs on Hydrate Ridge, offshore Oregon, USA. In Tréhu, A.M., Bohrmann, G., Torres, M.E., and Colwell, F.S. (Eds.), Proc. ODP, Sci. Results, 204, 1–25 [Online]. Available from World Wide Web: <http://www-odp.tamu.edu/ publications/204_SR/VOLUME/ CHAPTERS/103.PDF>. [Cited YYYY- MM-DD] 2 U.S. Geological Survey, Denver Federal Center, Box 25046, MS-939, Denver CO 80225, USA. Correspondence author: [email protected] Initial receipt: 27 October 2004 Acceptance: 17 March 2005 Web publication: 13 January 2006 Ms 204SR-103
Transcript of 22. GAS HYDRATE AND FREE GAS SATURATIONS ESTIMATED …

Tréhu, A.M., Bohrmann, G., Torres, M.E., and Colwell, F.S. (Eds.)Proceedings of the Ocean Drilling Program, Scientific Results Volume 204
22. GAS HYDRATE AND FREE GAS SATURATIONS ESTIMATED FROM VELOCITY LOGS ON HYDRATE RIDGE, OFFSHORE OREGON, USA1
M.W. Lee2 and T.S. Collett2
ABSTRACT
During Ocean Drilling Program Leg 204, nine sites were logged onthe Oregon continental margin, where one of the objectives of the inte-grated downhole logging program was to determine the distributionand saturation of gas hydrates and free gas in an accretionary ridge andadjacent slope basin. Downhole logs measured at Sites 1244, 1245, and1247, drilled on Hydrate Ridge, were analyzed to constrain the physicalproperties of in situ gas-hydrate-bearing sediments. Saturations of gashydrate in pore space are estimated from shear-wave (S-wave) velocitiesusing the modified Biot-Gassmann theory, referred to as the BGTL. Theaverage gas hydrate saturations are 10%, 10%, and 6% for Site 1244(76–127 meters below seafloor [mbsf]), Site 1245 (73–129 mbsf), andSite 1247 (74–129 mbsf), respectively, and are comparable to estimatesfrom downhole electrical resistivity logs. Free gas saturations were alsoestimated from the Biot-Gassmann theory with parameters derivedfrom the BGTL using compressional-wave (P-wave) velocities and fromelastic moduli using both P- and S-wave velocities. The exact amount offree gas is difficult to determine because of the uncertainties associatedwith the mode of gas distribution (patchy or uniform), but both meth-ods provide comparable estimates for free gas saturations. This studysuggests that free gas coexists with gas hydrate in the gas hydrate stabil-ity zone at these sites. This is the first reported evidence for coexistenceof gas hydrate and free gas away from the summit vents.
1Lee, M.W., and Collett, T.S., 2006. Gas hydrate and free gas saturations estimated from velocity logs on Hydrate Ridge, offshore Oregon, USA. In Tréhu, A.M., Bohrmann, G., Torres, M.E., and Colwell, F.S. (Eds.), Proc. ODP, Sci. Results, 204, 1–25 [Online]. Available from World Wide Web: <http://www-odp.tamu.edu/publications/204_SR/VOLUME/CHAPTERS/103.PDF>. [Cited YYYY-MM-DD]2U.S. Geological Survey, Denver Federal Center, Box 25046, MS-939, Denver CO 80225, USA. Correspondence author: [email protected]
Initial receipt: 27 October 2004Acceptance: 17 March 2005Web publication: 13 January 2006Ms 204SR-103
M.W. LEE AND T.S. COLLETTGAS HYDRATE AND FREE GAS SATURATIONS FROM VELOCITY LOGS 2
INTRODUCTION
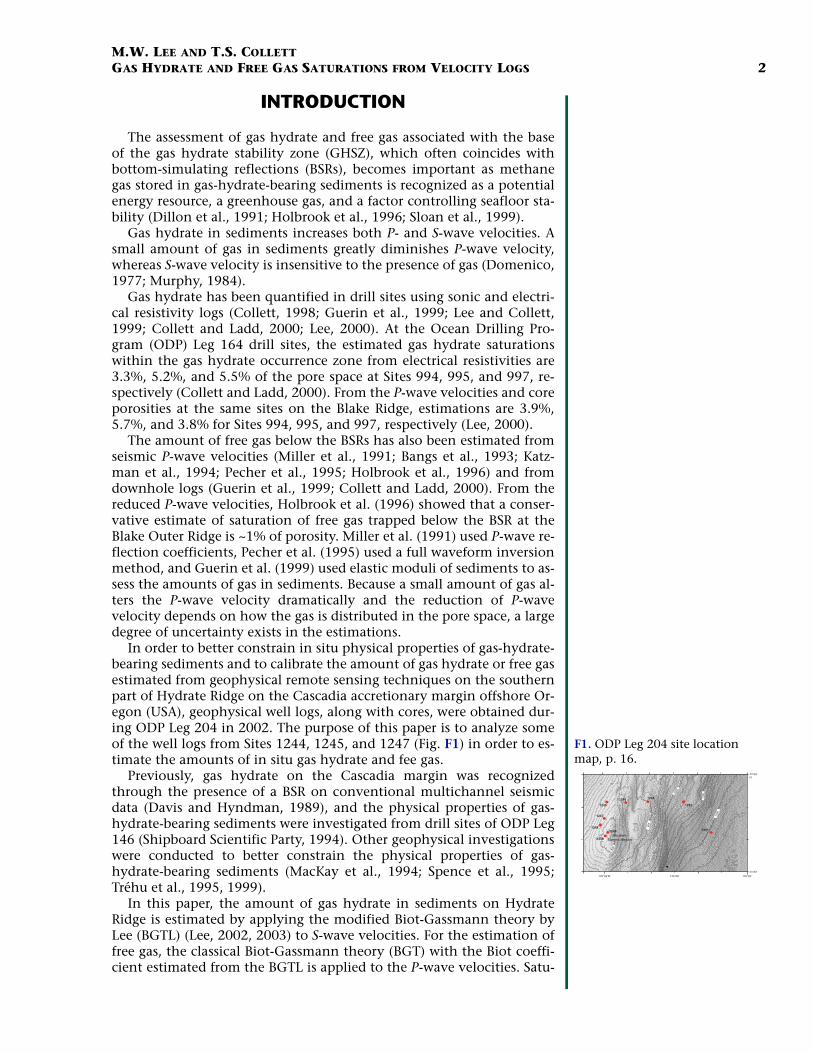
The assessment of gas hydrate and free gas associated with the baseof the gas hydrate stability zone (GHSZ), which often coincides withbottom-simulating reflections (BSRs), becomes important as methanegas stored in gas-hydrate-bearing sediments is recognized as a potentialenergy resource, a greenhouse gas, and a factor controlling seafloor sta-bility (Dillon et al., 1991; Holbrook et al., 1996; Sloan et al., 1999).
Gas hydrate in sediments increases both P- and S-wave velocities. Asmall amount of gas in sediments greatly diminishes P-wave velocity,whereas S-wave velocity is insensitive to the presence of gas (Domenico,1977; Murphy, 1984).
Gas hydrate has been quantified in drill sites using sonic and electri-cal resistivity logs (Collett, 1998; Guerin et al., 1999; Lee and Collett,1999; Collett and Ladd, 2000; Lee, 2000). At the Ocean Drilling Pro-gram (ODP) Leg 164 drill sites, the estimated gas hydrate saturationswithin the gas hydrate occurrence zone from electrical resistivities are3.3%, 5.2%, and 5.5% of the pore space at Sites 994, 995, and 997, re-spectively (Collett and Ladd, 2000). From the P-wave velocities and coreporosities at the same sites on the Blake Ridge, estimations are 3.9%,5.7%, and 3.8% for Sites 994, 995, and 997, respectively (Lee, 2000).
The amount of free gas below the BSRs has also been estimated fromseismic P-wave velocities (Miller et al., 1991; Bangs et al., 1993; Katz-man et al., 1994; Pecher et al., 1995; Holbrook et al., 1996) and fromdownhole logs (Guerin et al., 1999; Collett and Ladd, 2000). From thereduced P-wave velocities, Holbrook et al. (1996) showed that a conser-vative estimate of saturation of free gas trapped below the BSR at theBlake Outer Ridge is ~1% of porosity. Miller et al. (1991) used P-wave re-flection coefficients, Pecher et al. (1995) used a full waveform inversionmethod, and Guerin et al. (1999) used elastic moduli of sediments to as-sess the amounts of gas in sediments. Because a small amount of gas al-ters the P-wave velocity dramatically and the reduction of P-wavevelocity depends on how the gas is distributed in the pore space, a largedegree of uncertainty exists in the estimations.
In order to better constrain in situ physical properties of gas-hydrate-bearing sediments and to calibrate the amount of gas hydrate or free gasestimated from geophysical remote sensing techniques on the southernpart of Hydrate Ridge on the Cascadia accretionary margin offshore Or-egon (USA), geophysical well logs, along with cores, were obtained dur-ing ODP Leg 204 in 2002. The purpose of this paper is to analyze someof the well logs from Sites 1244, 1245, and 1247 (Fig. F1) in order to es-timate the amounts of in situ gas hydrate and fee gas.
Previously, gas hydrate on the Cascadia margin was recognizedthrough the presence of a BSR on conventional multichannel seismicdata (Davis and Hyndman, 1989), and the physical properties of gas-hydrate-bearing sediments were investigated from drill sites of ODP Leg146 (Shipboard Scientific Party, 1994). Other geophysical investigationswere conducted to better constrain the physical properties of gas-hydrate-bearing sediments (MacKay et al., 1994; Spence et al., 1995;Tréhu et al., 1995, 1999).
In this paper, the amount of gas hydrate in sediments on HydrateRidge is estimated by applying the modified Biot-Gassmann theory byLee (BGTL) (Lee, 2002, 2003) to S-wave velocities. For the estimation offree gas, the classical Biot-Gassmann theory (BGT) with the Biot coeffi-cient estimated from the BGTL is applied to the P-wave velocities. Satu-
1200
1100
1000
900
800
1244
1251
1245
1246
1250
1249
1247
125°09′W
44°36′N
44°33′
1248
1252
Southern Summit Region
125°06′ 125°03′
F1. ODP Leg 204 site location map, p. 16.

M.W. LEE AND T.S. COLLETTGAS HYDRATE AND FREE GAS SATURATIONS FROM VELOCITY LOGS 3
rations of gas hydrate estimated from velocity data are comparable tothose estimated from electrical resistivity data. Also, saturations of freegas are comparable to those estimated from density and nuclear mag-netic resonance (NMR) porosities.
THEORY
The effect of gas hydrate on velocities of unconsolidated sediments ismodeled using the BGTL (Lee, 2002, 2003). The effect of free gas on ve-locities of unconsolidated sediments is modeled by the BGT with pa-rameters derived from water-saturated sediments using the BGTL asdemonstrated by Lee (2004). The difference between the BGT and BGTLis in the calculation of shear modulus of water-saturated sediments.This section summarizes the essence of the BGTL.
Elastic velocities (i.e., compressional velocity [VP] and shear velocity[VS]) of sediments can be computed from the elastic moduli using thefollowing formulas:
VP = SQR[(k + 4µ/3)/ρ]
and
VS = SQR(µ/ρ), (1)
where
k = bulk modulus,µ = shear modulus, andρ = density of the formation.
The formation density is given by
ρ = (1 – φ)ρma + φρ fl, (2)
where
φ = porosity,ρma = matrix density, andρfl = pore fluid density.
Under the low-frequency assumption, the bulk modulus of fluid-sat-urated sediment (k) is given by the following formula in terms of the Biotcoefficient, β (Biot, 1941, 1956; Gassmann, 1951):
k = kma(1 – β) + β2M, (3)
where
1/M = [(β – φ)/kma] + (φ/kfl), (4)
and
kma = bulk modulus of matrix, andkfl = bulk modulus of pore fluid.

M.W. LEE AND T.S. COLLETTGAS HYDRATE AND FREE GAS SATURATIONS FROM VELOCITY LOGS 4
The term β2M represents the interaction of fluid filling the porositywith the solid skeleton of the formation, and the Biot coefficient mea-sures the ratio of volume change of the fluid to the volume change ofthe formation (Krief et al., 1990).
If it is assumed that the velocity ratio, VP/VS, is constant irrespectiveof porosity and is equal to the velocity ratio of matrix, the shear modu-lus of dry rock (µd) is given by (Krief et al., 1990):
µd = µma (1 – β), (5)
where µma is the shear modulus of the matrix. Conventionally, it is as-sumed that fluid in the pore space does not change the shear modulusof sediments. Therefore, the shear modulus of fluid-saturated sediment(µ) is the same as the dry shear modulus, (i.e., µ = µd), which is consis-tent with the BGT.
Lee (2004) derived the following shear modulus of water-saturatedsediment assuming VP/VS is a function of porosity:
µbgtl = [µmakma(1 – β)G2(1 – φ)2n + µmaβ2MG2(1 – φ)2n]/
{kma + 4µma[1 – G2(1 – φ)2n]/3}, (6)
where
µbgtl = the shear modulus calculated from equation 6, andG, n = BGTL parameters.
As opposed to equation 5, the shear modulus predicted from the BGTLdepends on the bulk modulus of fluid through M. Even though equation5 is not the BGT (but is consistent with the BGT), Lee (2002) designatedthe use of equations 3 and 5 as the BGT to differentiate from the BGTL,which uses equations 3 and 6 to calculate elastic velocities.
For soft formations or unconsolidated sediments, the following Biotcoefficient is used for the BGTL (Lee, 2002):
β = [–68.7421/(1 + e(φ + 0.40635)/0.09425)] + 0.98469. (7)
As indicated in Lee (2004), the appropriate Biot coefficient for velocitiesof partially gas saturated sediments (βbgt) is given by the following for-mula:
βbgt = 1 – (µbgtl/µma), (8)
and in equations 3 through 5, βbgt is substituted for β.Two kinds of gas saturation in the pore space are considered: uniform
and patch. Brie et al. (1995) suggested the following empirical mixinglaw based on the in situ downhole data:
kfl = (kw – kg)Swe + kg, (9)
where
Sw = water saturation,kg = bulk modulus of gas, and e = a calibration constant.

M.W. LEE AND T.S. COLLETTGAS HYDRATE AND FREE GAS SATURATIONS FROM VELOCITY LOGS 5
When e = 1, Brie et al.’s formula is the same as the isostrain (Voigt) av-erage, proposed by Domenico (1977). As e increases, the patch satura-tion approaches the characteristics of uniform saturation and approach-es nearly a uniform saturation at e = 40. Brie et al. (1995) showed thatmost downhole data they analyzed fit the mixing law with calibrationconstants between e = 2 and e = 5. However, other e values are appropri-ate depending on the frequency of measurement and the degree of con-solidation.
In the BGTL formulation, two parameters are introduced to matchthe predicted velocity ratio with the measured velocity ratio or velocity.As shown in Lee (2003), these parameters are somewhat constrained bythe nature of sediments, such as differential pressure, the degree of con-solidation, and clay volume content. Lee (2003) suggested the follow-ing formula for n, based on laboratory data compiled by Prasad (2002):
n = [10(0.426 – 0.235Log10p)]/m, (10)
where
p = differential pressure in MPa, and m = a parameter that depends on the degree of consolidation.
Usually, for unconsolidated sediments m varies from 1 to 2 and for con-solidated sediments m varies from 4 to 5.
The scale G is introduced to compensate for the effect of clay or gashydrate on the matrix material. Based on the data given by Han et al.(1986) and well logging data at the Mallik 5L-38 well, the following for-mula for G has been proposed (Lee, 2003; Lee and Collett, in press):
G = 0.9552 + 0.0448e–Cv/0.06714 – 0.18Ch2, (11)
where
Cv = the clay volume content, andCh = the saturation of gas hydrate in the pore space.
For a clean sandstone without gas hydrate, G = 1.In summary, in the framework of BGTL, the parameter n is the only
free parameter to choose, and it can be estimated by fitting the mea-sured velocities to calculated velocities. G is an empirically derived pa-rameter that depends on the clay volume content and gas hydratesaturations. The difference between the BGT and the BGTL is themethod of calculating the shear modulus of the water-saturated sedi-ments.
GEOLOGICAL SETTING
Hydrate Ridge is a 25-km-long and 15-km-wide ridge in the Cascadiaaccretionary complex, formed by the oblique subduction of Juan deFuca plate beneath North America at a rate of ~4.5 cm/yr. Sediment onthe subducting plate contains large volumes of sandy and silty turbidi-ties (MacKay, 1995). It is characterized by a northern summit at a waterdepth of 600 m and a southern summit at a water depth of 800 m (Ship-board Scientific Party, 2003). As in many accretionary complexes, gashydrate is present in this environment (Shipboard Scientific Party,

M.W. LEE AND T.S. COLLETTGAS HYDRATE AND FREE GAS SATURATIONS FROM VELOCITY LOGS 6
1994). Hydrate Ridge appears to be capped by hydrate, as indicated by astrong BSR (Tréhu et al., 1999) and by recovered samples of massive hy-drate (Bohrmann et al., 1998).
Site 1244 is located in ~890 m of water in the eastern flank of Hy-drate Ridge ~3 km northwest of the southern summit (Fig. F1), and aBSR is present at a depth of 124 mbsf. Site 1245 is located in 870 m ofwater on the western flank of Hydrate Ridge ~3 km northwest of thesouthern summit, and a BSR is present at a depth of ~134 mbsf. Site1247 is located in 845 m of water on the western flank of HydrateRidge, and a BSR is present at ~121–124 mbsf. All three sites are wellwithin the GHSZ (Shipboard Scientific Party, 2003). Unlike the summitregion, there is no evidence of venting of bubbles at the seafloor atthese sites.
DOWNHOLE LOGS
During Leg 204, conventional downhole wireline logs (CWL) andlogging while drilling (LWD) logs were acquired (Shipboard ScientificParty, 2003). The logs are not necessary obtained from the same hole;however, the holes are always very close to each other and the bestquality logs from the various holes were used for the analysis. The logsused in this analysis include density, P-wave velocity, S-wave velocity,natural gamma ray, electrical resistivity, and NMR logs acquired at Sites1244, 1245, and 1247 (Holes 1244E, 1245E, and 1247B are CWL holesand Holes 1244D, 1245A, and 1247A are LWD holes).
Because the density-derived porosity from CWL was degraded morethan that from the LWD logs owing to borehole rugosity, LWD density–derived porosity logs are used in all analyses, assuming a two-compo-nent system with a matrix density of 2.65 g/cm3 and a water density of1.03 g/cm3. Porosity correction due to the presence of gas hydrate is ac-complished simultaneously with the estimation of gas hydrate satura-tions (Lee and Collett, 1999).
Clay volume content is calculated from the gamma log using the for-mula pertinent to tertiary clastic with Gcn = 20 (API units) and Gsh = 120(API units), where Gcn and Gsh are gamma log response in a zone consid-ered clean and log response in a shale bed (Western Atlas, 1995), respec-tively. The average clay volume contents for Site 1244 (depth range =85–226 mbsf), Site 1245 (depth range = 85–294 mbsf), and Site 1247(depth range = 74–202 mbsf) are 13%, 18%, and 15%, respectively.
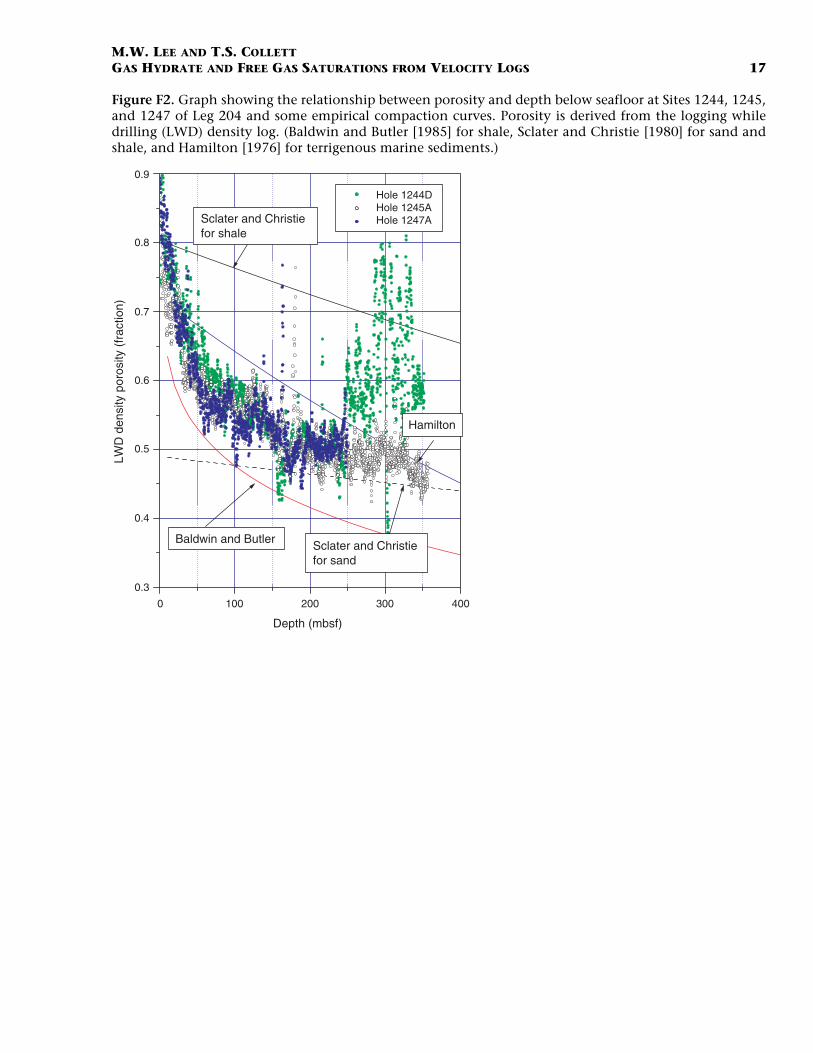
Figure F2 shows a relationship between LWD density–derived poros-ity and depth with several empirical compaction curves. The trends inthe measured porosities vs. depth at three sites are similar for depthsshallower than 250 mbsf. Abnormal porosities at Site 1244 for depthsdeeper than 250 mbsf are due to the degraded quality of the densitylogging data below 250 mbsf. Observed compaction trends lie betweenthe compaction curve for shale, derived by Baldwin and Butler (1985),and the compaction curve for terrigenous marine sediments, derived byHamilton (1976). Compaction curves by Sclater and Christie (1980) forsand and shale are approximately lower and upper limits of observedcompaction trends.
The velocity ratio, VP/VS, with respect to the LWD density–derivedporosity is shown in Figure F3. Figure F3A shows the measured velocityratios for entire logged intervals and Figure F3B shows measured ratiosonly for gas hydrate intervals, as interpreted by Collett et al. (this vol-ume). At each well, two distinct modes of velocity ratios with respect to
LWD
den
sity
por
osity
(fr
actio
n)
0.9
0.8
0.7
0.6
0.5
0.4
0.3
0 100 200 300 400
Depth (mbsf)
Sclater and Christie for shale
Hamilton
Baldwin and Butler Sclater and Christie for sand
Hole 1244D Hole 1245A Hole 1247A
F2. Porosity and depth, p. 17.
BGTL with n = 1.5
BGTL with n = 1
BGTL with n = 2.1
BGTL with n = 1.5
BGTL with n = 1
BGTL with n = 2.1
10
8
6
4
2
0
LWD density porosity (fraction)
0.0 0.2 0.4 0.6 0.8 0.0 0.2 0.4 0.6 0.8
LWD density porosity (fraction)
A B
VP/V
S
Hydrate effect Lower consolidation
Gas effect Higher consolidation
Site 1244 Site 1245 Site 1247
Hydrate effect Lower consolidation
Gas effect Higher consolidation
Only hydrated interval Site 1244 Site 1245 Site 1247
F3. Measured P- and S-wave veloc-ity ratios plotted against density-derived porosity with predicted velocity ratios calculated with var-ious BGTL parameters, p. 18.

M.W. LEE AND T.S. COLLETTGAS HYDRATE AND FREE GAS SATURATIONS FROM VELOCITY LOGS 7
porosity are indicated. For a given density-derived porosity, velocity ra-tios within the gas hydrate interval (Fig. F3B) are higher than those out-side the interval for all wells, indicating either the effect of free gas insediments on elastic velocities or the difference in the degree of consol-idation. Also at a given porosity, velocity ratios at Site 1244 are higherthan those at Sites 1245 and 1247, indicating that the degree of consol-idation is less at Site 1244. This implies that the BGTL parameter n or mfor Site 1244 is different from those for Sites 1245 and 1247. As indi-cated in Figure F3B, the exponent n appropriate for gas hydrated sedi-ments at Site 1244 is between n = 1.5 and n = 2.1, whereas it is betweenn = 1 and n = 1.5 for Sites 1245 and 1247.
In summary, the following observations can be made for density andvelocity logs (only CWL logs are used in this analysis):
1. LWD density–derived porosity generally follows the compactioncurve and shows limited scattering in the LWD-derived porosi-ties in the gas-hydrate-bearing interval (shallower than ~130mbsf), suggesting that the density log–derived porosities are ofhigh quality.
2. Each well log shows two distinct groups of Poisson’s (and VP/VS)ratios: one for the upper sedimentary section, affected by gas hy-drate, and the other for the lower sediment section, affected onlyby free gas. The decrease of Poisson’s ratio at each well from theupper to the lower section is caused partially by compaction andpartially by the effect of free gas on velocities.
3. For a given porosity, the VP/VS ratio at Site 1244 is highest,whereas the lowest ratio occurs at Site 1245; this implies that theBGTL parameter, m, is lowest at Site 1244 and highest at Site1245, which in turn implies that sediments at Site 1244 are lessconsolidated than those at Site 1245.
BASELINE CONDITIONS
In order to estimate the amount of gas hydrate or free gas in sedi-ments, elastic parameters for sediments without gas hydrate or free gasare required; these parameters serve as baseline conditions (no gas orgas hydrate in pore space) for estimating hydrocarbon saturations. Oneinteresting aspect of CWL velocity logs is that the measured VP is muchlower than the velocities anticipated for gas-hydrate-bearing sediments,particularly for Sites 1245 and 1247. It is speculated that the low VP isindicative of free gas in the sediment, which is either the free gas natu-rally coexisting with gas hydrate in the GHSZ or gas that has been disso-ciated from gas hydrate during drilling. If the amount of free gas issmall, the effect on VS is negligible. Therefore, in the case that a smallamount of free gas exists in sediments, VS is more appropriate to derivethe baseline conditions for non-gas-hydrate-bearing sediments.
Figure F4 shows the velocities measured below the GHSZ at each sitewith modeled velocities using the BGTL. S-wave velocity predicted fromthe BGTL with m = 2, p = 2 MPa, and Cv = 0.2 (solid line) follows the av-erage trend of the measured S-wave velocities at Site 1245 (open circles).For velocities at Site 1244, the BGTL with m = 1.3 (dashed line) matcheswell with the measured S-wave velocities (green dots). The BGTL with m= 1.8 (not shown) is optimal for velocities at Site 1247. However, corre-sponding P-wave velocities predicted from the BGTL indicate that pre-
LWD density porosity (fraction)
Vel
ocity
(km
/s)
2.0
1.5
1.0
0.5
0.0
0.2 0.4 0.6 0.8
P-wave
Site 1244 Site 1245 Site 1247 BGTL with m = 2, p = 2 MPa, CV = 0.2 BGTL with m = 1.3, p = 2 MPa, CV = 0.2
S-wave
F4. Measured P- and S-wave veloc-ities with respect to density-derived porosity with predicted velocities from the BGTL (baseline curves), p. 19.

M.W. LEE AND T.S. COLLETTGAS HYDRATE AND FREE GAS SATURATIONS FROM VELOCITY LOGS 8
dicted P-wave velocities are higher than observed P-wave velocities,implying the presence of free gas in sediments.
Therefore, m = 1.3, m = 2, and m = 1.8 are used for the BGTL parame-ters at Sites 1244, 1245, and 1247, respectively.
Figure F5 shows electrical resistivity vs. LWD density-derived porosi-ties for all measured depths for the three boreholes. The resistivity offormation (Rt) is given by the Archie relation
Rt = aRwφ–j, (12)
where
a, j = Archie parameters, and Rw = the resistivity of connate water.
The baseline resistivities for all three boreholes are interpreted based onthe trend of resistivity increase with respect to porosity decrease and aregiven by
Rt = 0.55φ–1.3 (13)
The exponent 1.3 is less than the Humble relationship (where the expo-nent = 2.15), but it is in the low end of the range of cementation factorshown by Jackson et al. (1978). The Archie parameter a and the resistiv-ity of connate water (Rw) is absorbed in the apparent resistivity
Ra (Ra = aRw), (14)
and Ra = 0.55 Ω-m is used for all the analysis of resistivity logs.
ESTIMATION OF GAS HYDRATEAND FREE GAS SATURATIONS
The amount of gas hydrate is estimated from S-wave velocities be-cause P-wave velocities are more affected by free gas. In order to accu-rately predict S-wave velocities and to estimate saturations of gashydrate, the BGTL with a depth-dependent exponent n (using depth-dependent differential pressure under normal hydraulic pressure), adepth-dependent G (using clay volume content and estimated Ch), andparameters shown in Table T1 are used. Saturations of gas hydrate arealso estimated from electrical resistivity logs using the Archie relation-ship.
Figure F6 shows the estimated gas hydrate saturations from S-wavevelocities (solid curve) and from the resistivity logs (dotted curve)within the GHSZ. The general trend and the magnitude of gas hydrateamount estimated from both S-wave velocity and resistivity logs arecomparable. The average saturations of gas hydrate estimated from S-wave velocities are 10.2%, 10.4%, and 6.1% at Sites 1244, 1245, and1247, respectively; those estimated form resistivities are 6.5%, 7.9%,and 4.5%, respectively (Table T2). Estimates from velocities are higherthan those from resistivities. The largest discrepancy occurs at Site1244, where the average gas hydrate estimated from S-wave velocity is>50% higher than that estimated from the resistivity logging data.
LWD resistivity (Ω·m)
LWD
den
sity
por
osity
(fr
actio
n)
1
0.5
0.31 4
LWD resistivity (Ω·m)
1 4
LWD resistivity (Ω·m)
1 4
A B CHole 1244D Hole 1245A Hole 1247A
Rt = 0.55/φ1.3Rt = 0.55/φ1.3
Rt = 0.55/φ1.3
F5. Measured electrical resistivity, p. 20.
T1. Elastic constants, p. 24.
Depth (mbsf)
75 100 125
Gas
hyd
rate
sat
urat
ion
(fra
ctio
n)
0.3
0.2
0.1
0.0
Depth (mbsf)
75 100 125
Depth (mbsf)
75 100 125
A B C
Site 1244 From LWD resistivity From CWL VS with m = 1.25
Site 1245 From LWD resistivity From CWL VS with m = 1.8
Site 1247 From LWD resistivity From CWL VS with m = 1.8
F6. Gas hydrate saturations esti-mated from the S-wave velocity, p. 21.
T2. Estimated saturation of gas hydrate and free gas, p. 25.

M.W. LEE AND T.S. COLLETTGAS HYDRATE AND FREE GAS SATURATIONS FROM VELOCITY LOGS 9
The amount of free gas can be estimated from two different methodsusing elastic velocities. The first method applies the BGT with parame-ters estimated from the BGTL to the P-wave velocity, as indicated in Lee(2004). The second method estimates free gas directly from the elasticmoduli of sediments.
Because the shallower sedimentary sections on Hydrate Ridge con-tain gas hydrates, the effect of gas hydrate on P-wave velocity needs tobe accounted for in the estimation of free gas. This is accomplished byincorporating the amount of gas hydrate estimated from S-wave veloc-ity into the P-wave velocity model. Figure F7 shows the estimated freegas as solid curves, whereas Table T2 contains the statistics of the esti-mated free gas saturations. The average saturations of free gas, assuminga patchy distribution with e = 8 (equation 11), are estimated to be 0.6%,1.4%, and 1.5% for Sites 1244, 1245, and 1247, respectively. The abovefree gas estimations are based on the P-wave velocity only. However, ifboth VP and VS are available, the amount of free gas can be estimated di-rectly from the moduli of the sediments (Brie et al., 1995; Murphy et al.,1993). From equations 1 and 8, the Biot coefficient for partially gas-saturated sediments can be written as follows:
βbgt = 1 – (µbgtl/µma) = 1 – (ρVS2/µma), (15)
where
VS = observed S-wave velocity, andρ = observed density.
From equation 3, the bulk modulus of formation can be written as
k = ρ(VP2 – 4VS
2/3) = kma(1 – βbgt) + βbgt2M. (16)
From equations 15 and 16, M can be calculated; gas saturations can becalculated from M and equation 9.
Figure F7 also shows free gas saturations estimated from elastic mod-uli; these are displayed as dotted curves. Because the effect of gas hy-drate is not accounted for in this analysis, we can only compare theestimated free gas saturations below the GHSZ; within this interval thetwo methods yield similar estimates of gas saturations.
DISCUSSION
Coexistence of Free Gas and Gas Hydrate
As mentioned previously, P-wave velocities within the GHSZ at allthree sites, particularly at Sites 1245 and 1247, are much lower thannormal velocities for water-saturated sediments, whereas the measuredS-wave velocities are a little higher than those for water-saturated sedi-ments. Low P-wave velocities coupled with slightly higher S-wavevelocities are speculated to be caused by the existence of free gas com-mingled with gas hydrate. Figures F6 and F7 indicate that the amountof free gas within the GHSZ is approximately proportional to theamount of gas hydrate and is almost continuous throughout the zone.
Several studies have shown that it is possible for free gas and gas hy-drate to coexist inside the GHSZ, as discussed below:
Gas
sat
urat
ion
(fra
ctio
n)
Depth (mbsf)
0.050
0.025
0.00050 100 150 200 250
A B C
Depth (mbsf)
50 100 150 200 250
Depth (mbsf)
50 100 150 200300
Hydrate-bearing interval
Hydrate-bearinginterval
Hydrate-bearing interval
Site 1247Estimation from BGTL with m = 1.8 and e = 8 Moduli (VP and VS)
Site 1245Estimation from BGTL with m = 2 and e = 8 Moduli (VP and VS)
Site 1244Estimation from BGTL with m = 1.3 and e = 8 Moduli (VP and VS)
F7. Estimated saturations of free gas using the BGT, p. 22.

M.W. LEE AND T.S. COLLETTGAS HYDRATE AND FREE GAS SATURATIONS FROM VELOCITY LOGS 10
1. Lee and Collett (unpubl. data) demonstrated that there exist freegas zones within the GHSZ at the Cirque-2 well, Alaska (USA), asevidenced by the lack of pore water needed to form gas hydrate.It is known that to form gas hydrate, not only gas but also wateris needed. One characteristic of this phenomenon is that thesefree gas zones are isolated from gas-hydrate-bearing sedimentsand appear as isolated occurrences of free gas. Somewhat contin-uous distribution of free gas in this study area may exclude thelack of water as a dominant cause of free gas within the GHSZ.
2. Guerin et al. (1999) showed that gas hydrate and free gas coexistat Site 995 of ODP Leg 164 below the BSR. Ruppel (1997) andHovland et al. (1997) reported a difference between the depth ofthe BSR and the theoretical bottom of the GHSZ. They associatedthis discrepancy with capillary forces developed in fine-grainedsediments, which reduce the temperature where gas hydratesdissociate. Gas hydrate grows preferentially in large pore spacesand, reciprocally, dissociates first in smaller pores with strongcapillary effects (Hovland et al., 1997). Guerin et al. (1999) spec-ulated that in the interval between the BSR and the GHSZ, gashydrate within smaller pores may have dissociated and releasedfree gas, while gas hydrate remains present within the largerpores. Therefore, two phases would then coexist in this intervalbetween the BSR and the bottom of the GHSZ. However, thisstudy differs from the results presented here for Leg 204, wherefree gas exists throughout the GHSZ.
3. Near Site 1250, a double BSR is observed. Double BSRs are oftenassociated with changes in the GHSZ over time caused by sea-floor deposition or erosion, sea level fluctuation, local variationin geothermal state, or differences in gas chemistry. The true na-ture of a double BSRs at this site is not known at this time, butits presence suggests that gas hydrate and free gas may coexistbetween the BSRs. Nevertheless, a double BSR cannot explain thecoexistence free gas and gas hydrate throughout the GHSZ.
4. Sometimes drilling induces the dissociation of gas hydrate nearthe borehole and releases free gas (Collett et al., 1999). If this isthe case, the amount of free gas recorded during or after drillingmay be proportional to the amount of gas hydrate in sediments.Free gas would temporarily coexist with gas hydrate in closeproximity to the borehole. This is one possible explanation forthe presence of free gas within the GHSZ observed at these sites.
5. Vigorous streams of methane bubbles have been observed ema-nating from vents or the seafloor in southern summit region(Heeschen et al., 2003). The presence of methane bubbles be-neath and at the seafloor suggest rapid transport of methanethrough the GHSZ along faults or fractures. Gorman et al. (2002)showed that the migration of methane gas through the GHSZ ina low-flux hydrate province is also possible (e.g., at the BlakeRidge). The presence of BSRs coupled with the proximity to thesummit region means that free gas may migrate through theGHSZ along faults or fractures at these sites. Therefore, it is likelythat free gas coexists with gas hydrate within the GHSZ in dy-namic systems.
Based on the above arguments, it is probable that gas hydrate coexistswith free gas either released by the dissociation of gas hydrate duringdrilling and/or transported along the fractures and faults.

M.W. LEE AND T.S. COLLETTGAS HYDRATE AND FREE GAS SATURATIONS FROM VELOCITY LOGS 11
Amounts of Gas Hydrate
As indicated in Table T2, the average gas hydrate saturations from S-wave velocities are 10.2% ± 3.7%, 10.4% ± 5.6%, and 6% ± 3.29% forSites 1244, 1245, and 1247, respectively. The amounts of gas hydrate es-timated from S-wave velocities in three holes are higher than those esti-mated from resistivities. The average saturation of 10% from the S-wavevelocity at Site 1244 is ~50% higher than that from the resistivity log.The gas hydrate saturation estimated at Site 1244 using the chlorideanomaly is between 2% and 8% (Shipboard Scientific Party, 2003),which is close to the estimate from resistivity. At Site 1245, low chloridesaturation anomalies are interpreted to reflect in situ hydrate satura-tions below 3%, with one anomaly suggesting a saturation of 15%. Itappears that the estimated gas hydrate saturations from S-wave veloci-ties are higher than those from resistivities or chloride anomalies atthese sites.
The difference between estimates from S-wave velocity and thosefrom the resistivity comes from many factors, such as
1. The locations of LWD wells and CWL wells are not identical. Forexample, at Site 1247, the holes are ~75 m apart. If the gas hy-drate saturations are heterogeneous, there may be some differ-ence between estimates, but it is unlikely that all three wellshave higher saturations from S-wave velocities.
2. The depth of investigation for CWL S-wave velocity and theLWD resistivity may be different. If drilling caused the dissocia-tion of gas hydrate, the effect of dissociation would be morepronounced near the borehole, at the shallow depth of investi-gation.
3. The assumed parameter, m, for the BGTL is lower than it shouldbe. This implies that the degree of consolidation at each well siteis underestimated. Therefore, the gas hydrate saturations couldhave been overestimated. Even though the estimates from S-wave velocities are higher than those from resistivities, a similarvariation of gas hydrate saturations with depth (Figure F6) sug-gests that the estimates are reasonable.
Moduli Method vs. BGT with VP
Figure F7 and Table T2 indicate that free gas saturations estimatedbelow the GHSZ from P-wave velocity using the BGT or from both P-wave and S-wave velocities using the moduli method are similar. Theactual amounts of free gas are dependent on the mode of gas distribu-tion or the calibration constant e. Therefore, it is not possible to deter-mine the accuracy of the estimated saturations depicted in Figure F7and Table T2. However, Figure F7 with Table T2 enables us to examinethe accuracy of each method under the same assumptions of gas distri-bution.
The BGT method with P-wave velocity computes the bulk modulusof sediments using the general Biot coefficient shown in equation 7 byincorporating the effect of differential pressure and consolidation or lo-cal conditions of sediments through the BGTL parameter n. On theother hand, the moduli method calculates the bulk modulus of sedi-ment directly from the measured P- and S-wave velocities. Therefore,the moduli method is more accurate and reflects better in situ proper-ties of sediments. A good agreement of saturations estimated from the

M.W. LEE AND T.S. COLLETTGAS HYDRATE AND FREE GAS SATURATIONS FROM VELOCITY LOGS 12
two methods suggests that (1) the BGTL parameters used in this studyare accurate and (2) the theory based on the BGT with parameters de-rived from the BGTL can be used to predict elastic velocities for partiallygas-saturated sediments. Therefore, if both VP and VS are available forthe estimation of gas saturations, the moduli method is preferable.However, in the case that only VP is available for an analysis, the BGTbased on the BGTL is a viable approach.
Mode of Gas Distribution and Amounts of Free Gas
The amounts of free gas estimated from the P-wave velocity data de-pend on saturation or distribution model of the free gas in the porespace as well as the magnitude of velocity reduction. As shown in equa-tion 9, the calibration constant controls the estimated free gas satura-tions. Lee (2004) indicates that an appropriate gas saturation model forpartially saturated unconsolidated sediments is e = 8, based on the databy Domenico (1977). However, it is difficult to assess the accuracy ofthe calibration constant without other independent estimations of freegas, because e depends on the frequency (Gei and Carcione, 2003) aswell as microstructure of the formation (Murphy et al., 1993). Usually,as the frequency of measurements increases, e decreases, but the preciserelation depends on the data.
The dotted line in Figure F8 shows the saturations of the free gas esti-mated from NMR and density porosities using the method of Freedman(1997). Comparing the free gas estimated shown in Figure F7, the freegas estimations from the NMR technique are about four times greaterthan free gas saturations estimated from velocities. Note that the com-parisons are not valid in the gas-hydrate-bearing intervals because theeffect of gas hydrate is not included in the estimation of free gas usingthe moduli method. As indicated in Figure F8, the general trends of freegas with respect to depth are similar to each other but the details aredifferent.
The saturations of free gas estimated from the NMR technique are in-dependent of the mode of gas distribution in the pore space. Therefore,if the NMR and density porosities are accurate, the dotted line in FigureF8 can be used as a ground truth of free gas saturations. The solid linein Figure F8 is the amount of free gas saturations estimated using themoduli method with e = 2 instead of e = 8, as used in Figure F7. The gassaturations using the moduli method with e = 2 is similar to those fromNMR and density porosities. If e = 2 instead of e = 8 is appropriate atthese borehole sites, the average free gas saturations estimated from theelastic velocities or the moduli are about four times that of those shownin Table T2. However, the amounts of free gas have not been indepen-dently confirmed at these sites. Without any additional data to con-strain the amounts of free gas at these sites, it is reasonable to say thatestimations using e = 2 and e = 8 correspond to upper and lower limits,respectively.
SUMMARY AND CONCLUSIONS
Based on the physical properties of sediments, such as elastic veloci-ties and electrical resistivity, the amounts of gas hydrate and free gas areestimated from downhole logs at Sites 1244, 1245, and 1247 of ODPLeg 204. In order to accurately estimate the amount of gas hydrate, S-wave velocities, not P-wave velocities, are used with the BGTL. This is
Gas
sat
urat
ion
(fra
ctio
n)
Depth (mbsf)
50 100 150 200 250 300
0.3
0.2
0.1
0.0
–0.1
Site 1245
From P- and S-wave velocities (moduli) with e = 2 From NMR and density log
Hydrate-bearing interval
F8. Estimated saturations of free gas, Site 1245, p. 23.

M.W. LEE AND T.S. COLLETTGAS HYDRATE AND FREE GAS SATURATIONS FROM VELOCITY LOGS 13
done because P-wave velocities are more strongly affected by the gas-hydrate-bearing sediments that are commingled with free gas withinthe gas hydrate stability zone, possibly owing to the dissociation of gashydrate during drilling or the migration of free gas through the GHSZ.The amounts of free gas are estimated from P-wave velocities using theBGT with parameters derived from the BGTL and are comparable tothose estimated from elastic moduli of sediments. However, theamounts of estimated free gas have a high degree of uncertainty, be-cause the calibration constant e is not well constrained and there is noavailable independent measurements of free gas amounts. This studyshows that:
1. At Site 1244, the average gas hydrate saturation within the GHSZis 10% from S-wave velocities, whereas it is 6.5% from electricalresistivities. If the calibration constant of e = 8 is appropriate, av-erage saturations of free gas between 127 and 226 mbsf are neg-ligible (0.4% and 0.3%, based on VP and moduli methods,respectively). However, the free gas estimates are 1.6% and 1.2%if e = 2 is used, which is comparable to that estimated from theNMR log.
2. At Site 1245, the average gas hydrate saturation within the GHSZis 10% from S-wave velocities, whereas it is 7.9% from electricalresistivity logs. Average saturations of free gas between 129 and294 mbsf are 1.6% and 1.7%, based on VP and the moduli meth-ods with e = 8, respectively. However, the free gas estimates are~6.4% and 6.8% if e = 2 is used.
3. At Site 1247, the average gas hydrate saturation within the GHSZis 6% from S-wave velocities, whereas it is 4.5% from electricalresistivity logs. Average saturations of free gas between 129 and197 mbsf are 1.7% and 2%, based on VP and moduli methodswith e = 8, respectively. However, the free gas estimates are~6.8% and 8% if e = 2 is used.
ACKNOWLEDGMENTS
We thank W.F. Agena, J.J. Miller, and P. Nelson for their commentson earlier version of this paper. We wish to thank Andrew Gorman,Anne Tréhu, and Warren Wood for many helpful suggestions. This re-search used samples and data provided by the Ocean Drilling Program(ODP). ODP is sponsored by the U.S. National Science Foundation(NSF) and participating countries under management of Joint Oceano-graphic Institutions (JOI), Inc. This work was partially funded by theU.S. Department of Energy under interagency agreement DE-A121-92MC29214.

M.W. LEE AND T.S. COLLETTGAS HYDRATE AND FREE GAS SATURATIONS FROM VELOCITY LOGS 14
REFERENCES
Baldwin, B., and Butler, C.O., 1985. Compaction curves. AAPG Bull., 69:622–626.Brie, A., Schlumberger, K.K., Pampuri, F., Marsala, A.F., and Meazza, O., 1995. Shear
sonic interpretation in gas-bearing sands [paper presented at Society of PetroleumEngineers Annual Technical Conference and Exhibition, Dallas, TX, 22–25 October1995], 30595.
Collett, T.S., Lewis, R.E., Dallimore, S.R., Lee, M.W., Mroz, T.H., and Uchida, T., 1999.Detailed evaluation of gas hydrate reservoir properties using JAPEX/JNOC/GSCMallik 2L-38 gas hydrate research well downhole well-log displays. In Dallimore,S.R., Uchida, T., and Collett, T.S. (Eds.), Scientific Results from JAPEX/JNOC/GSC Mal-lik 2L-38 Gas Hydrate Research Well, Mackenzie Delta, Northwest Territories, Canada.Bull.—Geol. Surv. Can., 544:295–311.
Dillon, W.P., Booth, J.S., Paul, C.K., Felhaber, K.L., Hutchinson, D.R., and Swift, B.A.,1991. Mapping of sub-seafloor reservoirs of a greenhouse gas: methane hydrates.Proc. Int. Symp. Marine Positioning, 545–554.
Freedman, R., 1997. Gas-corrected porosity from density-porosity and CMR measure-ments. In Allen, D., Crary, S., Freedman, B., Andreani, M., Klopf, W., Badry, R.,Flaum, C., Kenyon, B., Kleinberg, R., Gossenberg, P., Horkowitz, J., Logan, D.,Singer, J., and White, J. (Eds.), How to Use Borehole Nuclear Magnetic Resonance. Oil-field Rev., 9(2):54.
Gei, D., and Carcione, J.M., 2003. Acoustic properties of sediments saturated with gashydrate, free gas, and water. Geophys. Prospect., 51:141–157.
Gorman, A.R., Holbrook, W.S., Hornbach, M.J., Hackwith, K.L, Lazarralde, D., andPecher, I., 2002. Migration of methane gas through the hydrate stability zone in alow-flux hydrate province. Geology, 30:327–330.
Heeschen, K.U., Tréhu, A.M., and Collier, R.W., 2003. Distribution and height ofmethane bubble plumes on the Cascadia margin characterized by acoustic imag-ing. Geophys. Res. Lett., 30:1643–1646.
Jackson, P.D., Taylor-Smith, D., and Stanford, P.N., 1978. Resistivity-porosity-particleshape relationships for marine sands. Geophysics, 43(6):1250–1268.
Katzman, R., Holbrook, W.S., and Paull, C.K., 1994. Combined vertical-incidence andwide-angle seismic study of a gas hydrate zone, Blake Ridge. J. Geophys. Res., [SolidEarth], 99:17975–17995.
Krief, M., Garta, J., Stellingwerff, J., and Ventre, J., 1990. A petrophysical interpreta-tion using the velocities of P and S waves (full-waveform sonic). Log Anal., 31:355–369.
Lee, M.W., 2002. Biot-Gassmann theory for velocities of gas-hydrate-bearing sedi-ments. Geophysics, 66:763–771.
Lee, M.W., 2003. Elastic properties of overpressured and unconsolidated sediments.U.S. Geol. Surv. Bull., 2214.
Lee, M.W., 2004. Elastic velocities of partially gas-saturated unconsolidated sedi-ments. Mar. Pet. Geol., 21:641–650.
Lee, M.W., and Collett, T.S., 1999. Amount of gas hydrate estimated from compres-sional- and shear-wave velocities at the JAPEX/JNOC/GSC Mallik 2L-38 gas hydrateresearch well. In Dallimore, S.R., Uchida, T., and Collett, T.S. (Eds.), Scientific Resultsfrom JAPEX/JNOC/GSC Mallik 2L-38 Gas Hydrate Research Well, Mackenzie Delta,Northwest Territories, Canada. Bull.—Geol. Surv. Can., 544:312–322.
Lee, M.W., and Collett, T.S., in press. Assessment of gas hydrate saturations estimatedfrom sonic logs in the Mallik 5L-38 well, Canada. In Dallimore, S.R., and Collett,T.S. (Eds.), Scientific Results from Mallik 2000 Gas Hydrate Production Research WellProgram, Mackenzie Delta, Northwest Territories, Canada. Bull.—Geol. Surv. Can.,585.

M.W. LEE AND T.S. COLLETTGAS HYDRATE AND FREE GAS SATURATIONS FROM VELOCITY LOGS 15
MacKay, M.E., Jarrard, R.D., Westbrook, G.K., Hyndman, R.D., and the Shipboard Sci-entific Party of ODP Leg 146, 1994. Origin of bottom simulating reflectors: geo-physical evidence from the Cascadia accretionary prism. Geology, 22:459–462.
Murphy, W., Reischer, A., and Hsu, K., 1993. Modulus decomposition of compres-sional and shear velocities in sand bodies. Geophysics, 58:227–239.
Pecher, I.A., Minshull, T.A., Singh, S.C., and von Huene, R., 1995. Velocity structureof a bottom simulating reflector offshore Peru: result from full waveform inver-sion. Earth Planet. Sci. Lett., 139:459–469.
Prasad, M., 2002. Acoustic measurements in unconsolidated sands at low effectivepressure and overpressure detection. Geophysics, 67:405–412.
Shipboard Scientific Party, 2003. Leg 204 summary. In Tréhu, A.M, Bohrmann, G.,Rack, F.R., Torres, M.E., et al., Proc. ODP, Init. Repts., 204: College Station TX (OceanDrilling Program), 1–75.
Sloan, E.D., Brewer, P.G., Paull, C.K., Collett, T.S., Dillon, W.P., Holbrook, W.S., andKvenvolden, K.A., 1999. Future of gas hydrate research. Eos, Trans. Am. Geophys.Union, 80:247. (Abstract)
Western Atlas, 1995. Introduction to Wireline Log Analysis: Houston, TX (Western AtlasInternational Inc.).

M.W
. LE
E AN
D T
.S. CO
LL
ET
TG
AS H
YD
RA
TE A
ND
FR
EE G
AS S
AT
UR
AT
ION
S FRO
M V
EL
OC
ITY L
OG
S1
6
Figure
1200
1100
51
44°36′ N
44°33′125°03′
F1. ODP Leg 204 site location map. Modified from Shipboard Scientific Party (2003).
1000
900
800
1244
12
1245
1246
1250
1249
1247
125°09′W
1248
1252
Southern Summit Region
125°06′
M.W. LEE AND T.S. COLLETTGAS HYDRATE AND FREE GAS SATURATIONS FROM VELOCITY LOGS 17
Figure F2. Graph showing the relationship between porosity and depth below seafloor at Sites 1244, 1245,and 1247 of Leg 204 and some empirical compaction curves. Porosity is derived from the logging whiledrilling (LWD) density log. (Baldwin and Butler [1985] for shale, Sclater and Christie [1980] for sand andshale, and Hamilton [1976] for terrigenous marine sediments.)
LWD
den
sity
por
osity
(fr
actio
n)
0.9
0.8
0.7
0.6
0.5
0.4
0.3
0 100 200 300 400
Depth (mbsf)
Sclater and Christie for shale
Hamilton
Baldwin and Butler Sclater and Christie for sand
Hole 1244D Hole 1245A Hole 1247A

M.W. LEE AND T.S. COLLETTGAS HYDRATE AND FREE GAS SATURATIONS FROM VELOCITY LOGS 18
Figure F3. Measured P- and S-wave velocity ratios plotted against density-derived porosity with predictedvelocity ratios calculated with various modified Biot-Gassmann theory by Lee (BGTL) parameters. A. Allsamples. B. Samples within the gas hydrate stability zone (gas hydrated interval). LWD = logging whiledrilling.
BGTL with n = 1.5
BGTL with n = 1
BGTL with n = 2.1
BGTL with n = 1.5
BGTL with n = 1
BGTL with n = 2.1
10
8
6
4
2
0
LWD density porosity (fraction)
0.0 0.2 0.4 0.6 0.8 0.0 0.2 0.4 0.6 0.8
LWD density porosity (fraction)
A B
VP/V
S
Hydrate effect Lower consolidation
Gas effect Higher consolidation
Site 1244 Site 1245 Site 1247
Hydrate effect Lower consolidation
Gas effect Higher consolidation
Only hydrated interval Site 1244 Site 1245 Site 1247

M.W. LEE AND T.S. COLLETTGAS HYDRATE AND FREE GAS SATURATIONS FROM VELOCITY LOGS 19
Figure F4. Measured P- and S-wave velocities with respect to density-derived porosity with predicted veloc-ities from the modified Biot-Gassmann theory by Lee (BGTL) (baseline curves). Measured velocities for Sites1244, 1245, and 1247 are from depths between 130 and 225, 130 and 295, and 130 and 190 mbsf, respec-tively. LWD = logging while drilling.
LWD density porosity (fraction)
Vel
ocity
(km
/s)
2.0
1.5
1.0
0.5
0.0
0.2 0.4 0.6 0.8
P-wave
Site 1244 Site 1245 Site 1247 BGTL with m = 2, p = 2 MPa, CV = 0.2 BGTL with m = 1.3, p = 2 MPa, CV = 0.2
S-wave

M.W
. LE
E AN
D T
.S. CO
LL
ET
TG
AS H
YD
RA
TE A
ND
FR
EE G
AS S
AT
UR
AT
ION
S FRO
M V
EL
OC
ITY L
OG
S2
0
Figure d porosity with calculated resistivity using the Archie relation. Thedepth ween 0.2 and 372, 0.1 and 357, and 0.1 and 250 mbsf, respectively.A. Hol .
LWD
den
sity
por
osity
(fr
actio
n)
1
0.5
0.3
LWD resistivity (Ω·m)
1 4
A C Hole 1247A
Rt = 0.55/φ1.3
F5. Measured electrical resistivity with respect to LWD density–derive ranges of measured resistivities for Sites 1244, 1245, and 1247 are bete 1244D. B. Hole 1245A. C. Hole 1247A. LWD = logging while drilling
LWD resistivity (Ω·m)
1 4
LWD resistivity (Ω·m)
1 4
BHole 1244D Hole 1245A
Rt = 0.55/φ1.3Rt = 0.55/φ1.3

M.W
. LE
E AN
D T
.S. CO
LL
ET
TG
AS H
YD
RA
TE A
ND
FR
EE G
AS S
AT
UR
AT
ION
S FRO
M V
EL
OC
ITY L
OG
S2
1
Figure the BGTL and parameters shown in Table T1, p. 24, are denoted asheavy l resistivity logs. All estimates are smoothed using 11 points (averagesampl while drilling, CWL = conventional wireline logging.
Gas
hyd
rate
sat
urat
ion
(fra
ctio
n)
0.3
0.2
0.1
0.05
Depth (mbsf)
75 100 125
A C
Site 1247 From LWD resistivity From CWL VS with m = 1.8
F6. Gas hydrate saturations estimated from the S-wave velocity using solid lines. Dotted lines represent saturations estimated from electricaing = 0.15 m). A. Site 1244. B. Site 1245. C. Site 1247. LWD = logging
Depth (mbsf)
75 100 125
Depth (mbsf)
75 100 12
B
Site 1244 From LWD resistivity From CWL VS with m = 1.25
Site 1245 From LWD resistivity From CWL VS with m = 1.8

M.W
. LE
E AN
D T
.S. CO
LL
ET
TG
AS H
YD
RA
TE A
ND
FR
EE G
AS S
AT
UR
AT
ION
S FRO
M V
EL
OC
ITY L
OG
S2
2
Figure n theory by Lee (BGTL) with P-wave velocities (solid lines) and thoseestima with e = 8. All estimates are smoothed using 11 points (average sam-pling i
Gas
sat
urat
ion
(fra
ctio
n)
0.0
0.0
0.0
C
Depth (mbsf)
50 100 150 200300
Hydrate-bearing interval
Site 1247Estimation from BGTL with m = 1.8 and e = 8 Moduli (VP and VS)
F7. Estimated saturations of free gas using the modified Biot-Gassmanted using moduli method with P- and S-wave velocities (dotted lines) nterval = 0.15 m). A. Site 1244. B. Site 1245. C. Site 1247.
Depth (mbsf)
50
25
0050 100 150 200 250
A B
Depth (mbsf)
50 100 150 200 250
Hydrate-bearing interval
Hydrate-bearinginterval
Site 1245Estimation from BGTL with m = 2 and e = 8 Moduli (VP and VS)
Site 1244Estimation from BGTL with m = 1.3 and e = 8 Moduli (VP and VS)

M.W. LEE AND T.S. COLLETTGAS HYDRATE AND FREE GAS SATURATIONS FROM VELOCITY LOGS 23
Figure F8. Estimated saturations of free gas at Site 1245. The dotted line represents the estimated free gasfrom the nuclear magnetic resonance (NMR) and density-derived porosity logs, and the solid line repre-sents the estimated free gas using the moduli method with e = 2. All estimates are smoothed using 11 points(average sampling interval = 0.15 m).
Gas
sat
urat
ion
(fra
ctio
n)
Depth (mbsf)
50 100 150 200 250 300
0.3
0.2
0.1
0.0
–0.1
Site 1245
From P- and S-wave velocities (moduli) with e = 2 From NMR and density log
Hydrate-bearing interval

M.W. LEE AND T.S. COLLETTGAS HYDRATE AND FREE GAS SATURATIONS FROM VELOCITY LOGS 24
Table T1. Elastic constants.
Note: From Lee, 2004.
Elastic constant Value
Shear modulus of quartz 44 GpaBulk modulus of quartz 38 GpaShear modulus of clay 6.85 GpaBulk modulus of clay 20.9 GpaBulk modulus of water 2.29 GpaBulk modulus of gas 1.11 × 10⁻⁴ GpaDensity of quartz 2.65 g/cm3
Density of clay 2.58 g/cm3
Density of water 1 g/cm3
Density of gas 7.78 × 10⁻⁴ g/cm3

M.W. LEE AND T.S. COLLETTGAS HYDRATE AND FREE GAS SATURATIONS FROM VELOCITY LOGS 25
Table T2. Statistics of estimated saturation of gas hydrateand free gas.
Note: BGTL = Modified Biot-Gassmann theory by Lee, BGT = Biot-Gassmanntheory.
SiteGas hydrate
(Ch) (fraction)Gas
(Cg) (fraction)Depth(mbsf) Method
1244 0.102 ± 0.037 76–127 BGTL with VS
0.065 ± 0.039 76–127 Archie with resistivity0.006 ± 0.005 76–226 BGT with VP 0.004 ± 0.005 127–226 BGT with VP
0.003 ± 0.003 127–226 Moduli with VP and VS
1245 0.104 ± 0.056 73–129 BGTL with VS
0.079 ± 0.0550 73–129 Archie with resistivity0.016 ± 0.009 73–294 BGT with VP
0.016 ± 0.007 129–294 BGT with VP
0.017 ± 0.006 74–129 Moduli with VP and VS
1247 0.061 ± 0.032 74–129 BGTL using VS
0.045 ± 0.028 74–129 Archie with resistivity0.015 ± 0.008 74–197 BGT with VP
0.017 ± 0.008 129–197 BGT with VP