22-1. 22-2 Chapter 22 Business Statistics McGraw-Hill/Irwin Copyright © 2006 by The McGraw-Hill...
18
22-1
-
Upload
loraine-henry -
Category
Documents
-
view
214 -
download
1
Transcript of 22-1. 22-2 Chapter 22 Business Statistics McGraw-Hill/Irwin Copyright © 2006 by The McGraw-Hill...

22-1

22-2
Chapter 22Chapter 22
Business StatisticsBusiness Statistics
McGraw-Hill/Irwin Copyright © 2006 by The McGraw-Hill Companies, Inc. All rights reserved.

22-3
• Define and calculate the mean
• Explain and calculate a weighted mean
• Define and calculate the median
• Define and identify the mode
Business Statistics#22#22Learning Unit ObjectivesMean, Median, and ModeLU22.1LU22.1
22-4
• Prepare a frequency distribution
• Prepare bar, line, and circle graphs
• Calculate price relatives and cost comparisons
Business Statistics#22#22Learning Unit ObjectivesFrequency Distributions and GraphsLU22.2LU22.2

22-5
• Explain and calculate the range
• Define and calculate the standard deviation
• Estimate percentage of data by using standard deviations
Business Statistics#22#22Learning Unit ObjectivesMeasures of Dispersion (Optional Section)
LU22.3LU22.3
22-6
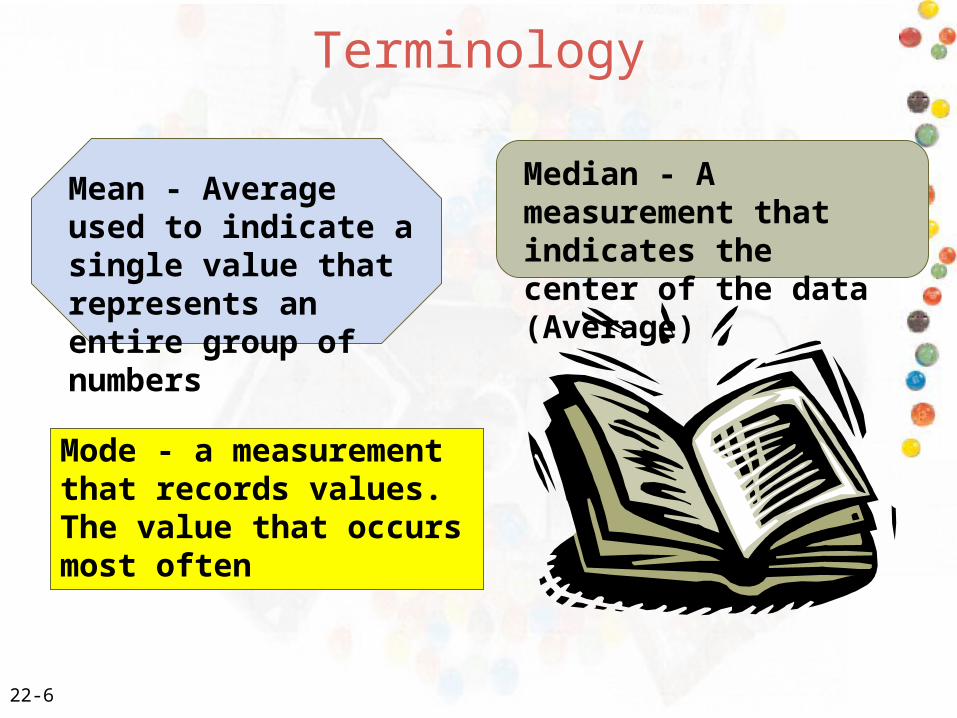
Mean - Average used to indicate a single value that represents an entire group of numbers
Median - A measurement that indicates the center of the data (Average)
Terminology
Mode - a measurement that records values. The value that occurs most often

22-7
Mean
Mean = Sum of all values Number of values
What is the mean of the following daily sales?
Sun. Mon. Tues. Wed. Thur. Fri. Sat.
$400 $100 $68 $115 $120 $68 $180
Mean = $400 + $100 + $68 + $115 + $120 +$68 + $180 = $150.14 7

22-8
Weighted Mean
Weighted Mean = Sum of products Sum of frequencies
What is the weighted mean (GPA) for the student?
Credit Grade Points
Courses attempted received (Credits x Grade)Business Math 3 B 9 (3 x 3)Speech 3 C 6 (3 x 2)Accounting 4 A 16 (4 x 4)English 3 B 9 (3 x 3)
13 40
40 = 3.0813

22-9
Finding the Median of a Group of Values
Step 1. Orderly arrange values from the smallest to the largest
Step 2. Find the middle value
A. Odd number of values: Median is the middle value. Divide the total number of numbers by 2. The next-higher number is the median.
B. Even number of values: Median is the average of the two middle values.
Find the median age 42, 35, 87, 23, 50
23, 35, 42, 50, 87
35, 42, 50, 87
42 + 50 2
46
Find the median age 42, 35, 87, 50

22-10
Mode
6, 8, 0, 3, 4, 23, 57, 31, 22, 47, 31, 2, 6, 9, 31
31 is the mode
since it is listed 3 times
The value that occurs most often
If two or more numbers appear most often, you may have two or more modes.
If all the values are different, there is no mode

22-11
Frequency Distribution
A way of collecting and organizing raw data
The average amount of alcoholic beverages consumed per week
5 7 8 4
3 5 8 3
1 6 10 4
9 11 5 0
Drinks Tally Frequency
0 l 11 l 12 - 03 ll 24 ll 25 lll 36 l 17 l 18 ll 29 l 110 l 111 l 1
Frequency distribution table

22-12
Bar Graph
0
1
2
3
4
0 1 2 3 4 5 6 7 8 9 10 11
Fre
qu
ency
of
con
sum
pti
on
Number of drinks

22-13
Line Graph
$8,000
$9,000
$10,000
$11,000
$12,000
$13,000
$14,000
$15,000
$16,000
$17,000
1999 2000 2001 2002 2003 2004
Ave
rage
cos
t of
Col
lege
tu
itio
n
Year

22-14
Circle Graph
1st Qtr2nd Qtr3rd Qtr4th Qtr
12.9%12.9%
56.9%
17.3%
Revenues
1st Qtr $20,400
2nd Qtr $27,400
3rd Qtr $90,000
4th Qtr $20,400

22-15
Index Numbers
Price relative = Current price x 100 Base year’s price
A computer cost $850 today relative to a cost of $1,300 some 5 years ago. What is the relative price?
$850 x 100 = 65.38 = 65.4$1,300

22-16
Consumer Price Index (in percent)
Expense Atlanta Chicago NY LA
Food 131.9 130.3 139.6 130.9Housing 128.8 131.4 139.3 139.3Clothing 133.8 124.3 121.8 126.4Medical care 177.6 163.0 172.4 163.3

22-17
Step 1. Find the mean of the set of data
Step 2. Subtract the mean from each piece of data to find each deviation
Step 3. Square each deviation (multiply the deviation by itself)
Step 4. Sum all squared deviations
Step 5. Divide the sum of the squared deviations by n - 1, where n equals the number of pieces of data
Step 6. Find the square root ( ) of the number obtained in Step 5. This is the standard deviation
Intended to measure the spread of data around the mean
Standard Deviation

22-18
Step 1 (1 + 2 + 5 + 10 + 12) = 65
Step 2 Step 3
Data Data-Mean (Data-Mean)
1 1- 6 = -5 25
2 2 - 6 = -4 16
5 5 - 6 = -1 1
10 10 - 6 = 4 16
12 12 - 6 = 6 36
Total 0 94 (Step 4)
Step 5: Divide by n-1: 94 = 94 = 23.5 5-1 4
Step 6: The square root of 23.5 is 4.8
Data set
x x x x x0 1 2 3 4 5 6 7 8 9 10 11 12 13
Standard Deviation