21st Century Transformation Challenges and … Century Transformation Challenges and Opportunities 2...
41
The Honorable David M. Walker Comptroller General of the United States The Coast Guard Innovation Expo New Orleans, LA October 30, 2007 21st Century Transformation Challenges and Opportunities
Transcript of 21st Century Transformation Challenges and … Century Transformation Challenges and Opportunities 2...

The Honorable David M. Walker Comptroller General of the United States
The Coast Guard Innovation Expo New Orleans, LA October 30, 2007
21st Century Transformation Challenges and Opportunities

2
The Case for Change
The federal government is on a “burning platform,” and the status quo way of doing business is unacceptable for a variety of reasons, including:
• Past fiscal trends and significant long-range challenges• Selected trends and challenges having no boundaries• Additional resource demands due to Iraq, Afghanistan, incremental
homeland security needs, and recent natural disasters in the United States
• Numerous government performance/accountability and high risk challenges
• Outdated federal organizational structures, policies, and practices• Rising public expectations for demonstrable results and enhanced
responsiveness
3
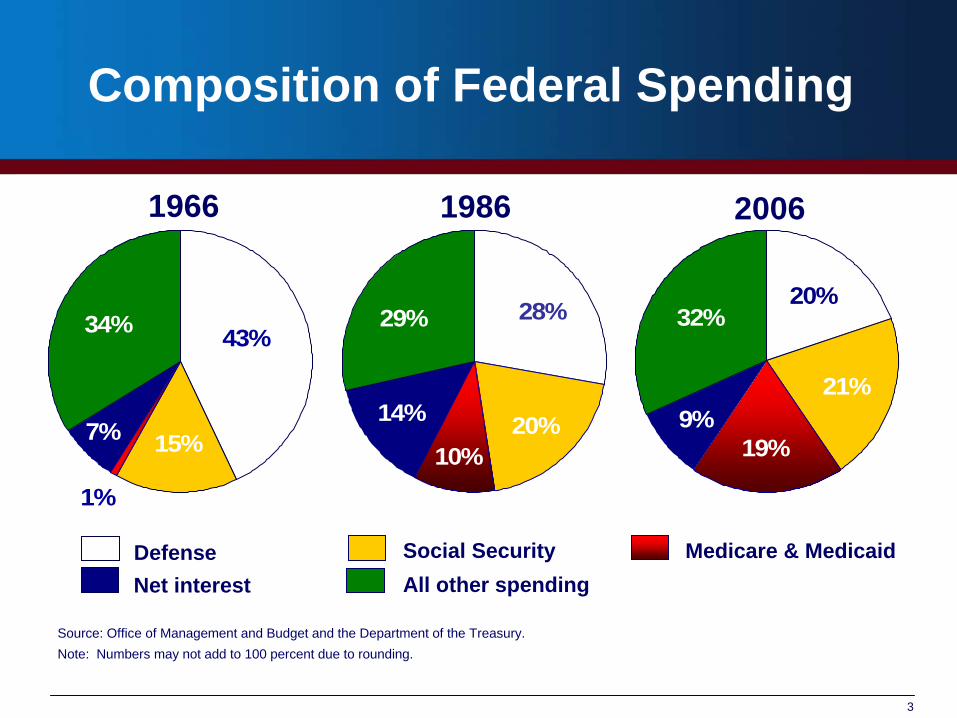
Composition of Federal Spending
20%10%
14%
29% 28%
1%
7% 15%
34% 43%
9%
32%
19%
21%
20%
1966 1986 2006
Defense Social SecurityNet interest
Medicare & MedicaidAll other spending
Source: Office of Management and Budget and the Department of the Treasury.Note: Numbers may not add to 100 percent due to rounding.

4
14%
44%
42%
Federal Spending for Mandatory and Discretionary Programs
Net Interest Discretionary Mandatory
Source: Office of Management and Budget.
9%
38%53%
26%
67%
7%
1966 1986 2006

5
Fiscal Year 2005 and 2006 Deficits and Net Operating Costs
Fiscal Year 2005 Fiscal Year 2006($ Billion)
On-Budget Deficit (494) (434)
Unified Deficita (318) (248)Net Operating Costb (760) (450)
Sources: Office of Management and Budget and Department of the Treasury.aIncludes $173 billion in Social Security surpluses for fiscal year 2005 and $185 billion for fiscal year 2006; $2 billion in Postal Service surpluses for fiscal year 2005 and $1 billion for fiscal year 2006.bFiscal year 2005 and 2006 net operating cost figures reflect significant but opposite changes in certain actuarial costs. For example, changes in interest rates and other assumptions used to estimate future veterans’ compensation benefits increased net operating cost by $228 billion in 2005 and reduced net operating cost by $167 billion in 2006. Therefore, the net operating costs for fiscal years 2005 and 2006, exclusive of the effect of these actuarial cost fluctuations, were ($532) billion and ($617) billion, respectively.

6
Major Fiscal Exposures ($ trillions)
2000 2006 % Increase• Explicit liabilities $6.9 $10.4 52
• Publicly held debt• Military & civilian pensions & retiree
health• Other
• Commitments & contingencies 0.5 1.3 140• E.g., PBGC, undelivered orders
• Implicit exposures 13.0 38.8 197• Future Social Security benefits 3.8 6.4• Future Medicare Part A benefits 2.7 11.3• Future Medicare Part B benefits 6.5 13.1• Future Medicare Part D benefits -- 7.9
Total $20.4 $50.5 147Source: 2000 and 2006 Financial Report of the United States Government.Note: Totals and percent increases may not add due to rounding. Estimates for Social Security and Medicare are at present value as of January 1 of each year and all other data are as of September 30.

7
How Big is Our Growing Fiscal Burden?
Total –major fiscal exposures $50.5 trillion
Total household net worth1 $53.3 trillion
Burden/Net worth ratio 95 percentBurden2
Per person $170,000Per full-time worker $400,000Per household $440,000
IncomeMedian household income3 $46,326Disposable personal income per capita4 $31,519
This fiscal burden can be translated and compared as follows:
Source: GAO analysis.
Notes: (1) Federal Reserve Board, Flow of Funds Accounts, Table B.100, 2006:Q2 (Sept. 19, 2006); (2) Burdens are calculated using estimated total U.S. population as of 9/30/06, from the U.S. Census Bureau; full-time workers reported by the Bureau of Economic Analysis, in NIPA table 6.5D (Aug. 2, 2006); and households reported by the U.S. Census Bureau, in Income, Poverty, and Health Insurance Coverage in the United States: 2005 (Aug. 2006); (3) U.S. Census Bureau, Income, Poverty, and Health Insurance Coverage in the United States: 2005 (Aug. 2006); and (4) Bureau of Economic Analysis, Personal Income and Outlays: October 2006, table 2, (Nov. 30, 2006).

8
Potential Fiscal Outcomes Under Baseline Extended (January 2001)
Revenues and Composition of Spending as a Share of GDP
0
10
20
30
40
50
2005 2015 2030 2040Fiscal year
Net interest Social Security Medicare & Medicaid All other spending
Revenue
Source: GAO’s January 2001 analysis.aAll other spending is net of offsetting interest receipts.
Percent of GDP
a a a

9
0
10
20
30
40
50
2006 2015 2030 2040Fiscal year
Net interest Social Security Medicare & Medicaid All other spending
Potential Fiscal Outcomes Under Alternative Simulation
Revenues and Composition of Spending as a Share of GDP
Revenue
Source: GAO’s August 2007 analysis.
Notes: AMT exemption amount is retained at the 2006 level through 2017 and expiring tax provisions are extended. After 2017, revenue as a share of GDP returns to its historical level of18.3 percent of GDP plus expected revenues from deferred taxes, i.e. taxes on withdrawals from retirement accounts. Medicare spending is based on the Trustees April 2007 projections adjusted for the Centers for Medicare and Medicaid Services alternative assumption that physician payments are not reduced as specified under current law.
Percent of GDP

10
State and Local Governments Face Increasing Fiscal Challenges
-6
-4
-2
0
2
1980 1985 1990 1995 2000 2005 2010 2015 2020 2025 2030 2035 2040 2045 2050
Percent of GDP
Operating Surplus/Deficit Measure
Sources: Historical data from National Income and Product Accounts. Historical data from 1980 – 2006, GAO projections from 2007 – 2050 using many CBO projections and assumptions, particularly for next 10 years.
Net-lending/Net-Borrowing

11
-20
-15
-10
-5
0
5
2000 2005 2010 2015 2020 2025 2030 2035 2040 2045 2050Fiscal year
Percent of GDP
State and Local Fiscal Challenges Add to the Federal Government’s
Fiscal Challenge
Federal Surplus/Deficit
Source: Historical data from National Income and Product Accounts, GAO AnalysisNote: Historical data from 2000 – 2006, projections from 2007 – 2050; state and local balance measure is similar to the federal unified
budget measure. Federal Simulation Assumptions: Discretionary spending grows with GDP after 2007. AMT exemption amount is retained at the 2006 level through 2017 and expiring tax provisions are extended. After 2017, revenue as a share of GDP returns to its historical level of 18.3 percent of GDP plus expected revenues from deferred taxes, i.e. taxes on withdrawals from retirement accounts. Medicare spending is based on the Trustees’ April 2007 projections adjusted for the Centers for Medicare and Medicaid Services’ alternative assumption that physician payments are not reduced as specified under current law.
Combined Surplus/Deficit

12
Current Fiscal Policy Is Unsustainable
• The “Status Quo” is Not an Option• We face large and growing structural deficits largely due to known
demographic trends and rising health care costs.• GAO’s simulations show that balancing the budget in 2040 could
require actions as large as • Cutting total federal spending by 60 percent or• Raising federal taxes to 2 times today's level
• Faster Economic Growth Can Help, but It Cannot Solve the Problem
• Closing the current long-term fiscal gap based on reasonable assumptions would require real average annual economic growth in the double digit range every year for the next 75 years.
• During the 1990s, the economy grew at an average 3.2 percent per year.
• As a result, we cannot simply grow our way out of this problem. Tough choices will be required.

13
The Way Forward: A Three-Pronged Approach
1. Improve Financial Reporting, Public Education, and Performance Metrics
2. Strengthen Budget and Legislative Processes and Controls
3. Fundamentally Reexamine & Transform for the 21st Century (i.e., entitlement programs, other spending, and tax policy)
Solutions Require Active Involvement from both the Executive and Legislative Branches

14
Key National Indicators
• WHAT: A portfolio of economic, social, and environmental outcome- based measures that could be used to help assess the nation’s and other governmental jurisdictions’ position and progress
• WHO: Many countries and several states, regions, and localities have already undertaken related initiatives (e.g., Australia, New Zealand, Canada, United Kingdom, Oregon, Silicon Valley (California) and Boston)
• WHY: Development of such a portfolio of indicators could have a number of possible benefits, including
• Serving as a framework for related strategic planning efforts• Enhancing performance and accountability reporting• Informing public policy decisions, including much needed baseline reviews of existing
government policies, programs, functions, and activities• Facilitating public education and debate as well as an informed electorate
• WAY FORWARD: Consortium of key players housed by the National Academies domestically and related efforts by the OECD and others internationally
15
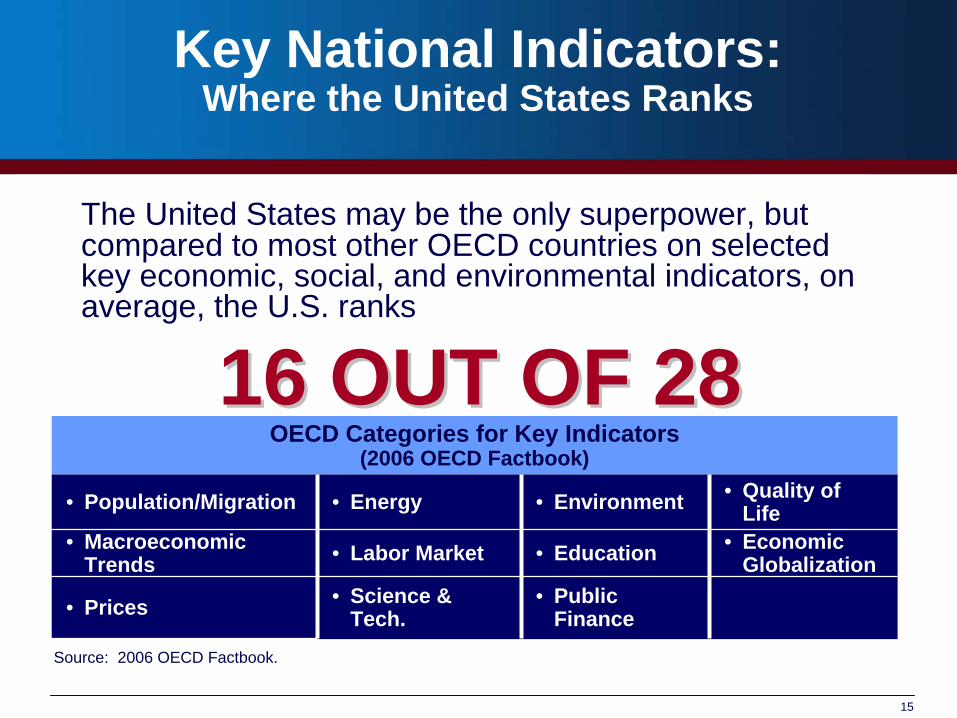
Key National Indicators: Where the United States Ranks
The United States may be the only superpower, but compared to most other OECD countries on selected key economic, social, and environmental indicators, on average, the U.S. ranks
OECD Categories for Key Indicators(2006 OECD Factbook)
• Population/Migration • Energy • Environment • Quality of Life
• Macroeconomic Trends • Labor Market • Education • Economic
Globalization
• Prices • Science & Tech.
• Public Finance
16 OUT OF 2816 OUT OF 28
Source: 2006 OECD Factbook.

16

17
Selected Sustainability Challenges
• Fiscal Deficits and Debt Burdens• Health Care Quality, Access, and Costs• Defense and Homeland Security Strategies• Social Insurance Commitments• Tax Gaps and Policies• Energy, Environment, and Resource
Protection• Immigration Policies• Infrastructure Needs

18
21st Century Challenges Report
• Provides background, framework, and questions to assist in reexamining the base
• Covers entitlements & other mandatory spending, discretionary spending, and tax policies and programs
• Based on GAO’s work for the Congress
• Issued February 16, 2005
19
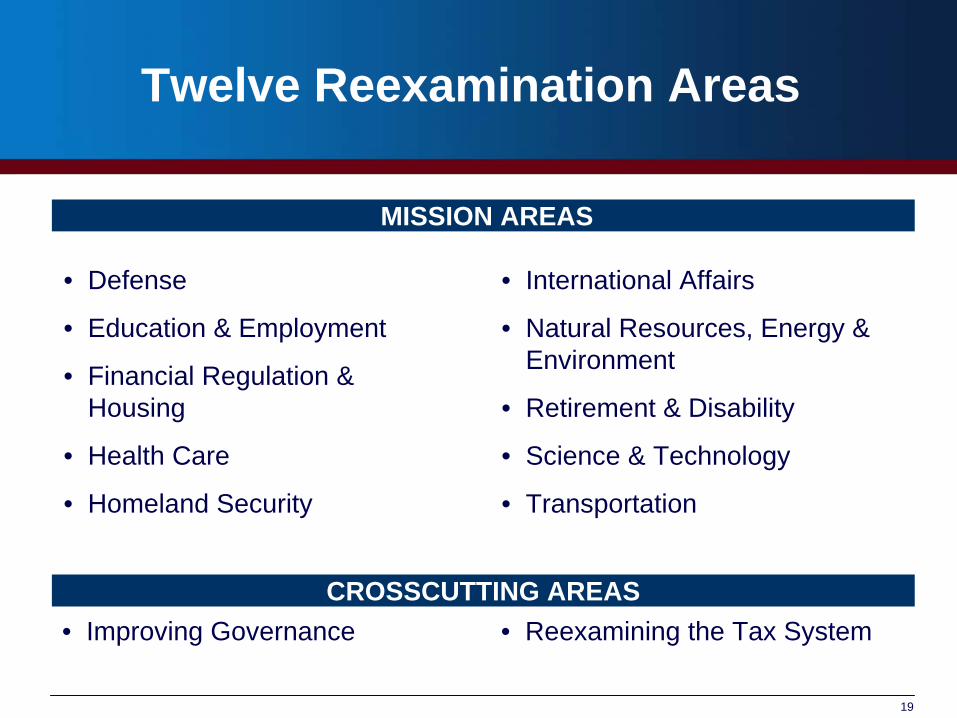
• Defense
• Education & Employment
• Financial Regulation & Housing
• Health Care
• Homeland Security
• International Affairs
• Natural Resources, Energy & Environment
• Retirement & Disability
• Science & Technology
• Transportation
Twelve Reexamination Areas
• Improving Governance • Reexamining the Tax System
MISSION AREAS
CROSSCUTTING AREAS
20
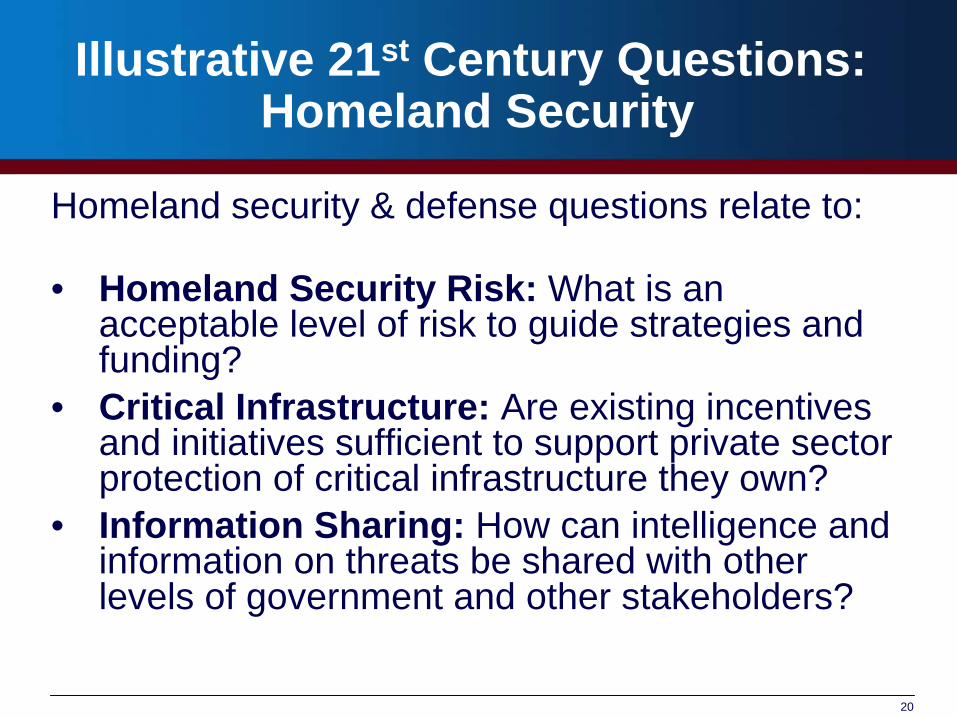
Illustrative 21st Century Questions: Homeland Security
Homeland security & defense questions relate to:
• Homeland Security Risk: What is an acceptable level of risk to guide strategies and funding?
• Critical Infrastructure: Are existing incentives and initiatives sufficient to support private sector protection of critical infrastructure they own?
• Information Sharing: How can intelligence and information on threats be shared with other levels of government and other stakeholders?

21
GAO’s High- Risk List 2007
Addressing Challenges in Broad-based TransformationsYear
Designated • Strategic Human Capital Managementa 2001• Managing Federal Real Propertya 2003• Protecting the Federal Government’s Information Systems and the Nations’ Critical
Infrastructures1997
• Implementing and Transforming the Department of Homeland Security 2003• Establishing Appropriate and Effective Information-Sharing Mechanisms to Improve
Homeland Security• DOD Approach to Business Transformationa
2005
2005• DOD Business Systems Modernization• DOD Personnel Security Clearance Program• DOD Support Infrastructure Management• DOD Financial Management• DOD Supply Chain Management• DOD Weapon Systems Acquisition
199520051997199519901990
• FAA Air Traffic Control Modernization 1995• Financing the Nation’s Transportation Systema (New) 2007• Ensuring the Effective Protection of Technologies Critical to U.S. National Security Interestsa
(New)2007
• Transforming Federal Oversight of Food Safetya (New) 2007Managing Federal Contracting More Effectively
• DOD Contract Management 1992• DOE Contract Management 1990• NASA Contract Management 1990• Management of Interagency Contracting 2005Assessing the Efficiency and Effectiveness of Tax Law Administration
• Enforcement of Tax Lawsa 1990• IRS Business Systems Modernization 1995Modernizing and Safeguarding Insurance and Benefit Programs
• Modernizing Federal Disability Programsa
• Pension Benefit Guaranty Corporation Single-Employer Pension Insurance Program• Medicare Programa
200320031990
• Medicaid Programa 2003• National Flood Insurance Programa 2006
a Legislation is likely to be necessary, as a supplement to actions by the executive branch, in order to effectively address this high-risk area. 21Source: GAO.

22
Definition of Waste
Waste involves the taxpayers as a whole not receiving reasonable value for money in connection with any government funded activities due to an inappropriate act or omission by players with control over or access to government resources (e.g., executive, judicial, or legislative branch employees, contractors, grantees, or other recipients)
Importantly, waste represents a transgression that is less than fraud and abuse and most waste does not involve a violation of law. Rather, waste relates primarily to mismanagement, inappropriate actions, or inadequate oversight

23
Examples of Waste
Illustrative examples of underlying causes of waste in the acquisitions and contracting area could include:
• Unreasonable, unrealistic, inadequate, or frequently changing requirements
• Failure to use competitive bidding in appropriate circumstances
• Failure to engage in selected pre-contracting activities for contingent events (e.g., hurricanes, military conflicts)
• Congressional directions (e.g., earmarks), and agency spending actions where the action would not otherwise be taken based on an objective value and risk assessment and considering available resources

24
Systemic Acquisition Challenges
1. Service budgets are allocated largely according to top line historical percentages rather than comprehensive strategic assessments and current and likely resource limitations
2. Capabilities and requirements are based primarily on individual service wants versus collective national needs (i.e. based on current and expected future threats) that are both affordable and sustainable over time
3. Defense consistently over-promises and under-delivers in connection with major weapons, information, and other systems (i.e. capabilities, costs, quantities, schedule)
4. Defense often employs a “plug and pray approach” when costs escalate (i.e. divide total funding dollars by cost per copy, plug the number that can be purchased, then pray that Congress will provide more funding to buy more quantities)
5. Congress sometimes forces the department to buy items (e.g. weapons systems) and provide services (e.g. additional health care for non-actives) that the department does not want and we cannot afford

25
Systemic Acquisition Challenges (cont’d)
6. DOD tries to develop high risk technologies after programs start instead of setting up funding, organizations, and processes to conduct high risk technology development activities in low cost environments (i.e. technology development is not separated from product development). Program decisions to move into design and production are made without adequate standards or knowledge
7. Program requirements are often set at unrealistic levels, then changed frequently as recognition sets in that they cannot be achieved. As a result, too much time passes, threats may change, and/or members of the user and acquisition communities may simply change their mind. The resulting program instability causes cost escalation, schedule delays, fewer quantities and reduced contractor accountability
8. Contracts, especially service contracts, often do not have definitive or realistic requirements at the outset in order to control costs and facilitate accountability
9. Contracts typically do not accurately reflect the complexity of projects nor appropriately allocate risk between the contractors and the taxpayers (e.g. cost plus, cancellation charges)

26
Systemic Acquisition Challenges (cont’d)
10. Key program staff rotate too frequently thus promoting myopia and reducing accountability (i.e. tours based on time versus key milestones). Additionally, the revolving door between industry and the Department presents potential conflicts of interest
11. The acquisition workforce faces serious challenges (e.g. size, skills, knowledge, succession planning)
12. Incentive and award fees are often paid based on contractor attitudes and efforts versus positive results (i.e. cost, quality, schedule)
13. Inadequate oversight is being conducted by both the Defense Department and the Congress which results in little to no accountability for recurring and systemic problems
14. Some individual program and funding decisions made within the Department and by the Congress serve to undercut sound policies
15. Lack of a professional, term-based CMO at DOD serves to slow progress on defense transformation and reduce the chance of success in the acquisitions/contracting and other key business areas

27
Challenges Faced by the Coast Guard
• Increasing demands upon all resources to conduct more maritime security missions.
• Need to continue legacy missions such a fisheries protection, law enforcement, search and rescue, marine safety, and polar ice breaking.
• Need to maintain aging fleet of ships and aircraft while at the same time move forward with plans to replace them through Deepwater acquisition program.

28
Coast Guard Deepwater Acquisition Challenges
• Coast Guard’s Deepwater modernization program experienced problems in:
• program management, including ineffective management and oversight teams, inadequate staffing, and ill-defined roles and responsibilities
• contractor accountability and linking contractor performance to awards; and
• control of costs through competition

29
Coast Guard Deepwater Acquisition Actions (cont’d)
• Coast Guard has announced and begun to implement actions to address these challenges, including:
• taking over leadership of program management from the contractor
• hiring acquisition staff and developing human capital improvements
• revising award criteria to include incentives for performance; and
• conducting business case analyses to ensure competition for future asset acquisitions

30
DHS Acquisition Management Challenges
DHS has struggled to provide adequate support and oversight of its acquisition function. It remains important that it:
• integrate the acquisition functions of component organizations more effectively across the department
• develop clear and transparent acquisitions policies and procedures, along with an acquisitions workforce trained to implement and monitor them; and
• evaluate and work to mitigate risks associated with contracts for services that support inherently governmental functions

31
DHS Progress Report: Acquisition Management
• DHS reported acquiring $15.6 billion in goods and services in FY 2006,
• DHS has made modest progress in achieving the following acquisition management performance expectations
• Organizing acquisition functions to meet agency needs.• Developing clear and transparent policies and processes. • Developing an acquisition workforce to implement and monitor
acquisitions.
• Improved assessment and oversight needed to manage risks of contractors performing tasks closely supporting governmental functions.

32 32
Webster’sdefinition
An act, process, or instance of change in structure appearance, or character
A conversion, revolution, makeover, alteration, or renovation

33
Four Key Transformation Dimensions
Key Actions Primary Responsibility Secondary Responsibility
1. To make prudent budget & long-term fiscal decisions
The President and the Congress
Agency leadership (both political and career)
2. To enable key transformation efforts while providing protection from abuse of authority
The Congress and the President
Agency leadership (both political and career)
3. To lead key transformation efforts with existing authorities and within existing resource levels
Agency leadership (both political and career)
OMB and other selected government-wide agencies
4. To evaluate reform efforts and conduct continuous improvement initiatives
Agency leadership (both political and career)
Congress, OMB and selected government-wide agencies
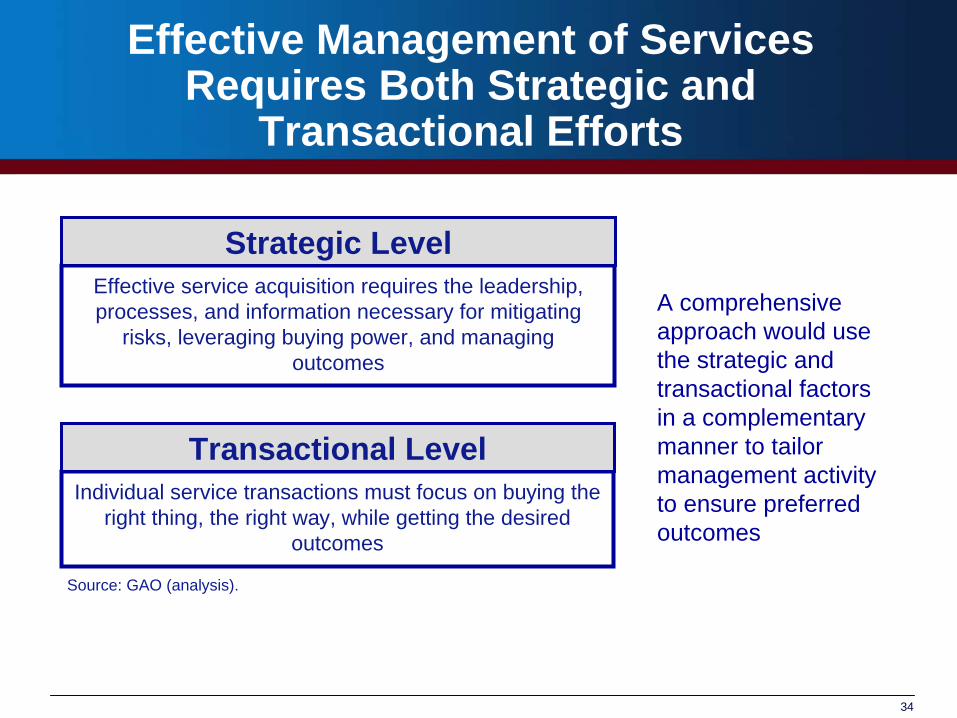
34
Effective Management of Services Requires Both Strategic and
Transactional Efforts
Individual service transactions must focus on buying the right thing, the right way, while getting the desired
outcomes
Effective service acquisition requires the leadership, processes, and information necessary for mitigating
risks, leveraging buying power, and managing outcomes
Strategic Level
Transactional Level
Source: GAO (analysis).
A comprehensive approach would use the strategic and transactional factors in a complementary manner to tailor management activity to ensure preferred outcomes

35
The Objective of Transformation for the Coast Guard
From the Commandant:• Making the force
structure more responsive to mission execution.
• Making support system more responsive to the operators.
• Making Coast Guard more responsive to the nation.

36
Commandant Directed Coast Guard Next Steps
• Take immediate steps to reorganize operational forces
• Improve service and support systems
• Better align with departmental and interagency partners
• Make logistics and financial systems more efficient and accountable

37
Three Key Illnesses
• Myopia• Tunnel Vision• Self-Centeredness
38
Four National Deficits
• Budget• Balance of Payments• Savings• Leadership

39
Five Leadership Attributes Needed for These Challenging and Changing Times
• Courage• Integrity• Creativity• Stewardship• Partnership

The Honorable David M. Walker Comptroller General of the United States
The Coast Guard Innovation Expo New Orleans, LA October 30, 2007
21st Century Transformation Challenges and Opportunities
41
On the WebWeb site: www.gao.gov/cghome.htm
ContactChuck Young, Managing Director, Public Affairs [email protected] (202) 512-4800 U.S. Government Accountability Office 441 G Street NW, Room 7149 Washington, D.C. 20548
CopyrightThis is a work of the U.S. government and is not subject to copyright protection in the United States. The published product may be reproduced and distributed in its entirety without further permission from GAO. However, because this work may contain copyrighted images or other material, permission from the copyright holder may be necessary if you wish to reproduce this material separately.