
21, rue d’Artois, F-75008 PARIS http :
13
[email protected] Return of experience: The CIGRE UHF PD sensitivity verification and on-site detection of critical defects S. M. NEUHOLD, T. BRÜGGER, R. BRÄUNLICH FKH G. BEHRMANN, H. D. SCHLEMPER, U. RIECHERT ABB Switzerland Ltd P. MÜLLER, M. LEHNER ewz E. SCHNEITER BKW P. SIGRIST CKW Switzerland SUMMARY Today, the expected service life of gas insulated switchgear (GIS) is approx. 35 – 50 years; this makes life cycle costs (specifically the failure rate) of great importance. The return of experience of the 3 rd CIGRE enquiry on reliability of high voltage equipment showed that “the ‘dielectric breakdown’ failure mode cause was in about 50 % of cases introduced during a period before putting into service”. Therefore, a higher effectiveness of on-site commissioning tests, diagnostic tests, and monitoring is strongly recommended. Since the introduction of the ultra-high frequency (UHF) partial discharge (PD) measurement method in the late 1980s [1], it has become the widely accepted, de-facto standard for on-site PD measurement due to the high detection sensitivity and signal-to-noise ratio (SNR) which can be achieved. The relevant factor for determining critical size of the defect types ‘protrusion on HV’ and ‘particle on insulation’, - the size for potentially causing a flashover in service - is the reduction of the lightning impulse withstand capability. However, whereas a hopping particle (as used for the CIGRE Sensitivity Verification Step 1 test) produces a relatively strong broadband UHF signal, the examples presented from on-site measurements of these critical defects exhibit signals of signal strength and apparent bandwidths which are comparatively much lower; even the sensitivity of the standard IEC 60270 measurement [2] is pressed to its limits. Although the actual signal strength of PD signals of such defects in the UHF region is very low, numerous measurement examples show that the SNR of the UHF-method is often significantly higher than the SNR reached with IEC 60270 measurements, especially on site. To increase the effectiveness of on-site commissioning tests, application of UHF- PD measurements with very high sensitivity is recommended. The return on experience with the CIGRE sensitivity verification generally shows good results. However, in some special cases, very narrow band, high attenuation PD signal transmission can be observed even for relatively short distances of only a few meters. The combination of this experience shows that a reduction of UHF-PD sensor density, as proposed in the second publication of the CIGRE sensitivity check, is not recommended. On the contrary, more careful positioning of the UHF sensors is recommended, e.g. at locations in the GIS where the enclosure diameter changes. 21, rue d’Artois, F-75008 PARIS D1-304 CIGRE 2018 http : //www.cigre.org
Transcript of 21, rue d’Artois, F-75008 PARIS http :
Return of experience: The CIGRE UHF PD sensitivity verification and on-site detection of critical defects
S. M. NEUHOLD, T. BRÜGGER,
R. BRÄUNLICH FKH
G. BEHRMANN, H. D. SCHLEMPER, U. RIECHERT
ABB Switzerland Ltd
P. MÜLLER, M. LEHNER ewz
E. SCHNEITER BKW
P. SIGRIST CKW
Switzerland
SUMMARY Today, the expected service life of gas insulated switchgear (GIS) is approx. 35 – 50 years; this makes life cycle costs (specifically the failure rate) of great importance. The return of experience of the 3rd CIGRE enquiry on reliability of high voltage equipment showed that “the ‘dielectric breakdown’ failure mode cause was in about 50 % of cases introduced during a period before putting into service”. Therefore, a higher effectiveness of on-site commissioning tests, diagnostic tests, and monitoring is strongly recommended. Since the introduction of the ultra-high frequency (UHF) partial discharge (PD) measurement method in the late 1980s [1], it has become the widely accepted, de-facto standard for on-site PD measurement due to the high detection sensitivity and signal-to-noise ratio (SNR) which can be achieved. The relevant factor for determining critical size of the defect types ‘protrusion on HV’ and ‘particle on insulation’, - the size for potentially causing a flashover in service - is the reduction of the lightning impulse withstand capability. However, whereas a hopping particle (as used for the CIGRE Sensitivity Verification Step 1 test) produces a relatively strong broadband UHF signal, the examples presented from on-site measurements of these critical defects exhibit signals of signal strength and apparent bandwidths which are comparatively much lower; even the sensitivity of the standard IEC 60270 measurement [2] is pressed to its limits. Although the actual signal strength of PD signals of such defects in the UHF region is very low, numerous measurement examples show that the SNR of the UHF-method is often significantly higher than the SNR reached with IEC 60270 measurements, especially on site. To increase the effectiveness of on-site commissioning tests, application of UHF-PD measurements with very high sensitivity is recommended. The return on experience with the CIGRE sensitivity verification generally shows good results. However, in some special cases, very narrow band, high attenuation PD signal transmission can be observed even for relatively short distances of only a few meters. The combination of this experience shows that a reduction of UHF-PD sensor density, as proposed in the second publication of the CIGRE sensitivity check, is not recommended. On the contrary, more careful positioning of the UHF sensors is recommended, e.g. at locations in the GIS where the enclosure diameter changes.
21, rue d’Artois, F-75008 PARIS D1-304 CIGRE 2018 http : //www.cigre.org
1
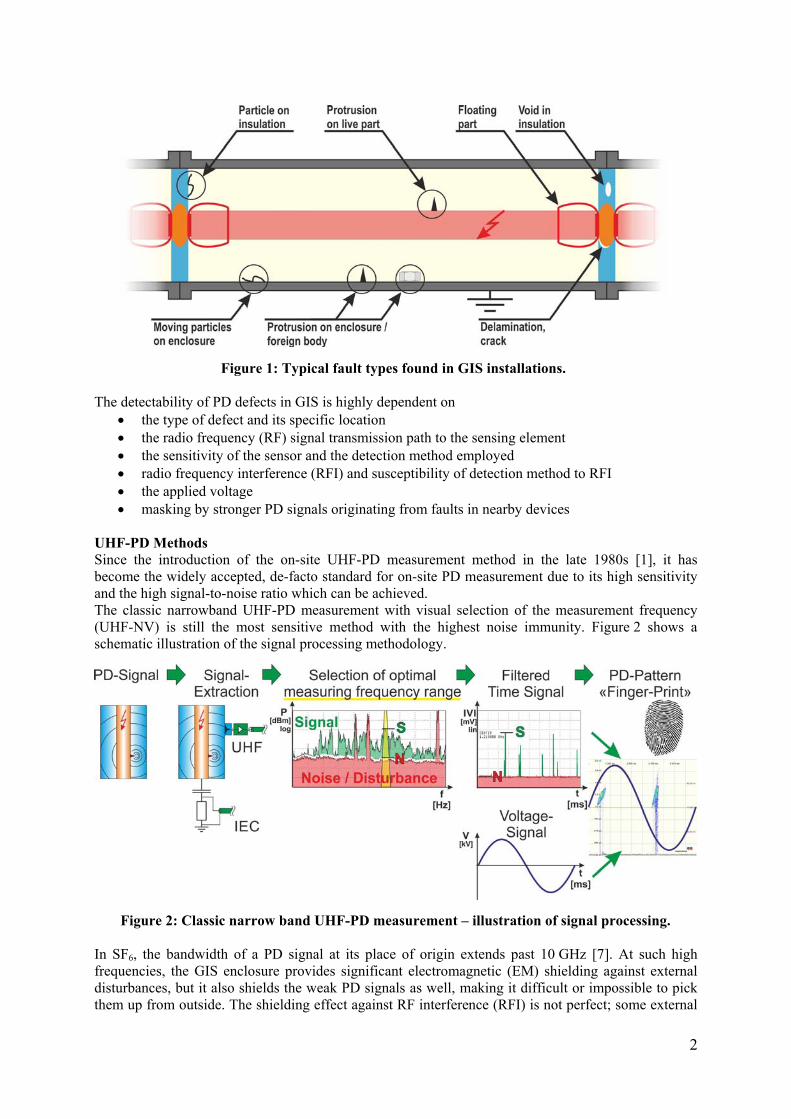
A study of the total life-cycle costs of on-line partial discharge monitoring systems (PDMS) applied to 420-kV GIS combined with statistics from over 70 GIS equipped with on-line PDMS showed that the reduction in costs of unscheduled maintenance and power outage are lower than the investment and operational cost of the systems [3]. The failure rate of GIS installations would need to be significantly higher than that observed to reach a break-even point. The state-of-the-art detection sensitivity and prevention rate together with the nature of PD activity seem to justify PD monitoring systems only for critical installations with extremely high outage cost. Furthermore, the physics governing whether PD signals can be detected before the defect leads to a flashover places limits on the prevention rates which can actually be obtained. KEYWORDS: Gas insulated switchgear, GIS, UHF, partial discharge, PD, monitoring system, CIGRE sensitivity verification, particle on insulation, protrusion on inner conductor 1 MOTIVATION: THE NEED FOR EFFECTIVE ON-SITE TESTING OF GIS Today, the expected service life of a GIS is approx. 35 – 50 years [4]. For installations with such a long service life, the life cycle costs, specifically the failure rate, are of great importance. In the IEC 60071-2 standard, the requested acceptable failure rate of dielectric failures of grid installations dependent on the severity of the impact, and is between 0.1 and 0.4 failures per 100 years [5]. Since the outage of a bus bar has severe consequences and GIS is not repair friendly, the acceptable failure rate of a GIS substation should be closer to 0.1 failures per 100 years or better. The return of experience of the 3rd CIGRE enquiry on reliability of high voltage equipment showed that there is still room for improvement [6]. The major failure frequencies for GIS of voltage rating 60 kV and above are between 0.24 and 1.18 failures per bay and 100 years. These major failures can be subdivided into ‘Failing to perform requested operation or function’ (63%) and ‘Dielectric breakdown’ (23%). Even for a small GIS substation with 5 bays, the corresponding dielectric failures rates would be 0.28 to 1.36 which differs significantly from the 0.1 value recommended by IEC. One finding of the CIGRE enquiry was that “the ‘dielectric breakdown’ failure mode cause was in about 50 % of cases introduced during a period before putting into service”. Therefore, a higher effectiveness of on-site commissioning tests, diagnostic tests, and monitoring is recommended. 2 FAULT TYPES, UHF-PD METHODS, SIGNALS AND CRITICALITY The basic dielectric requirements for a sound GIS insulation system are defined by insulation coordination. The alternating current withstand voltage capability (ACWV) and the lightning impulse withstand voltage capability (LIWV) are the basic design parameters for service frequency respectively transient dielectric stress. To prevent long term degradation of the electric insulation (e.g. for voids in insulation material) further requirements are defined with respect to the maximum allowable partial discharge levels at specific voltage levels. Fault types To verify the dielectric integrity of a GIS insulation system, AC voltage tests, in combination with PD measurements are applied for routine testing and on-site testing. Due to practical reasons, lightning impulse tests are typically applied only for type tests. Figure 1 shows typical fault types found in GIS installations.
2
Figure 1: Typical fault types found in GIS installations. The detectability of PD defects in GIS is highly dependent on
the type of defect and its specific location the radio frequency (RF) signal transmission path to the sensing element the sensitivity of the sensor and the detection method employed radio frequency interference (RFI) and susceptibility of detection method to RFI the applied voltage masking by stronger PD signals originating from faults in nearby devices
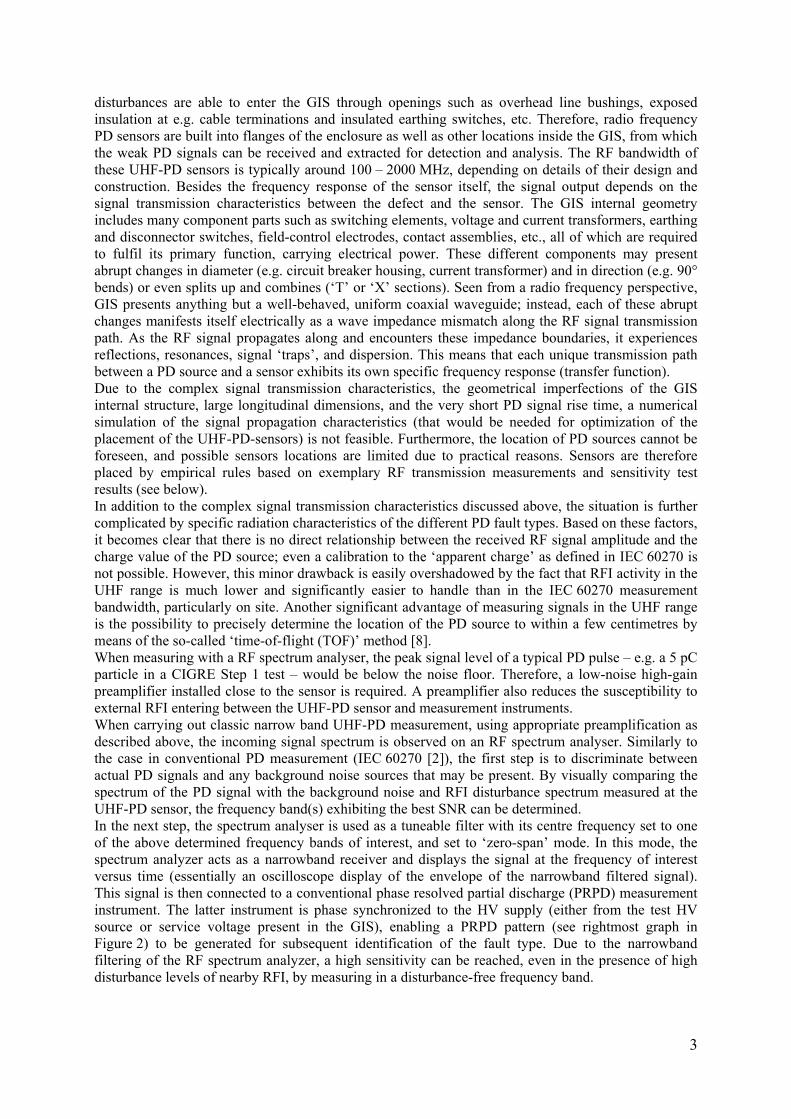
UHF-PD Methods Since the introduction of the on-site UHF-PD measurement method in the late 1980s [1], it has become the widely accepted, de-facto standard for on-site PD measurement due to its high sensitivity and the high signal-to-noise ratio which can be achieved. The classic narrowband UHF-PD measurement with visual selection of the measurement frequency (UHF-NV) is still the most sensitive method with the highest noise immunity. Figure 2 shows a schematic illustration of the signal processing methodology.
Figure 2: Classic narrow band UHF-PD measurement – illustration of signal processing. In SF6, the bandwidth of a PD signal at its place of origin extends past 10 GHz [7]. At such high frequencies, the GIS enclosure provides significant electromagnetic (EM) shielding against external disturbances, but it also shields the weak PD signals as well, making it difficult or impossible to pick them up from outside. The shielding effect against RF interference (RFI) is not perfect; some external
3
disturbances are able to enter the GIS through openings such as overhead line bushings, exposed insulation at e.g. cable terminations and insulated earthing switches, etc. Therefore, radio frequency PD sensors are built into flanges of the enclosure as well as other locations inside the GIS, from which the weak PD signals can be received and extracted for detection and analysis. The RF bandwidth of these UHF-PD sensors is typically around 100 – 2000 MHz, depending on details of their design and construction. Besides the frequency response of the sensor itself, the signal output depends on the signal transmission characteristics between the defect and the sensor. The GIS internal geometry includes many component parts such as switching elements, voltage and current transformers, earthing and disconnector switches, field-control electrodes, contact assemblies, etc., all of which are required to fulfil its primary function, carrying electrical power. These different components may present abrupt changes in diameter (e.g. circuit breaker housing, current transformer) and in direction (e.g. 90° bends) or even splits up and combines (‘T’ or ‘X’ sections). Seen from a radio frequency perspective, GIS presents anything but a well-behaved, uniform coaxial waveguide; instead, each of these abrupt changes manifests itself electrically as a wave impedance mismatch along the RF signal transmission path. As the RF signal propagates along and encounters these impedance boundaries, it experiences reflections, resonances, signal ‘traps’, and dispersion. This means that each unique transmission path between a PD source and a sensor exhibits its own specific frequency response (transfer function). Due to the complex signal transmission characteristics, the geometrical imperfections of the GIS internal structure, large longitudinal dimensions, and the very short PD signal rise time, a numerical simulation of the signal propagation characteristics (that would be needed for optimization of the placement of the UHF-PD-sensors) is not feasible. Furthermore, the location of PD sources cannot be foreseen, and possible sensors locations are limited due to practical reasons. Sensors are therefore placed by empirical rules based on exemplary RF transmission measurements and sensitivity test results (see below). In addition to the complex signal transmission characteristics discussed above, the situation is further complicated by specific radiation characteristics of the different PD fault types. Based on these factors, it becomes clear that there is no direct relationship between the received RF signal amplitude and the charge value of the PD source; even a calibration to the ‘apparent charge’ as defined in IEC 60270 is not possible. However, this minor drawback is easily overshadowed by the fact that RFI activity in the UHF range is much lower and significantly easier to handle than in the IEC 60270 measurement bandwidth, particularly on site. Another significant advantage of measuring signals in the UHF range is the possibility to precisely determine the location of the PD source to within a few centimetres by means of the so-called ‘time-of-flight (TOF)’ method [8]. When measuring with a RF spectrum analyser, the peak signal level of a typical PD pulse – e.g. a 5 pC particle in a CIGRE Step 1 test – would be below the noise floor. Therefore, a low-noise high-gain preamplifier installed close to the sensor is required. A preamplifier also reduces the susceptibility to external RFI entering between the UHF-PD sensor and measurement instruments. When carrying out classic narrow band UHF-PD measurement, using appropriate preamplification as described above, the incoming signal spectrum is observed on an RF spectrum analyser. Similarly to the case in conventional PD measurement (IEC 60270 [2]), the first step is to discriminate between actual PD signals and any background noise sources that may be present. By visually comparing the spectrum of the PD signal with the background noise and RFI disturbance spectrum measured at the UHF-PD sensor, the frequency band(s) exhibiting the best SNR can be determined. In the next step, the spectrum analyser is used as a tuneable filter with its centre frequency set to one of the above determined frequency bands of interest, and set to ‘zero-span’ mode. In this mode, the spectrum analyzer acts as a narrowband receiver and displays the signal at the frequency of interest versus time (essentially an oscilloscope display of the envelope of the narrowband filtered signal). This signal is then connected to a conventional phase resolved partial discharge (PRPD) measurement instrument. The latter instrument is phase synchronized to the HV supply (either from the test HV source or service voltage present in the GIS), enabling a PRPD pattern (see rightmost graph in Figure 2) to be generated for subsequent identification of the fault type. Due to the narrowband filtering of the RF spectrum analyzer, a high sensitivity can be reached, even in the presence of high disturbance levels of nearby RFI, by measuring in a disturbance-free frequency band.
4
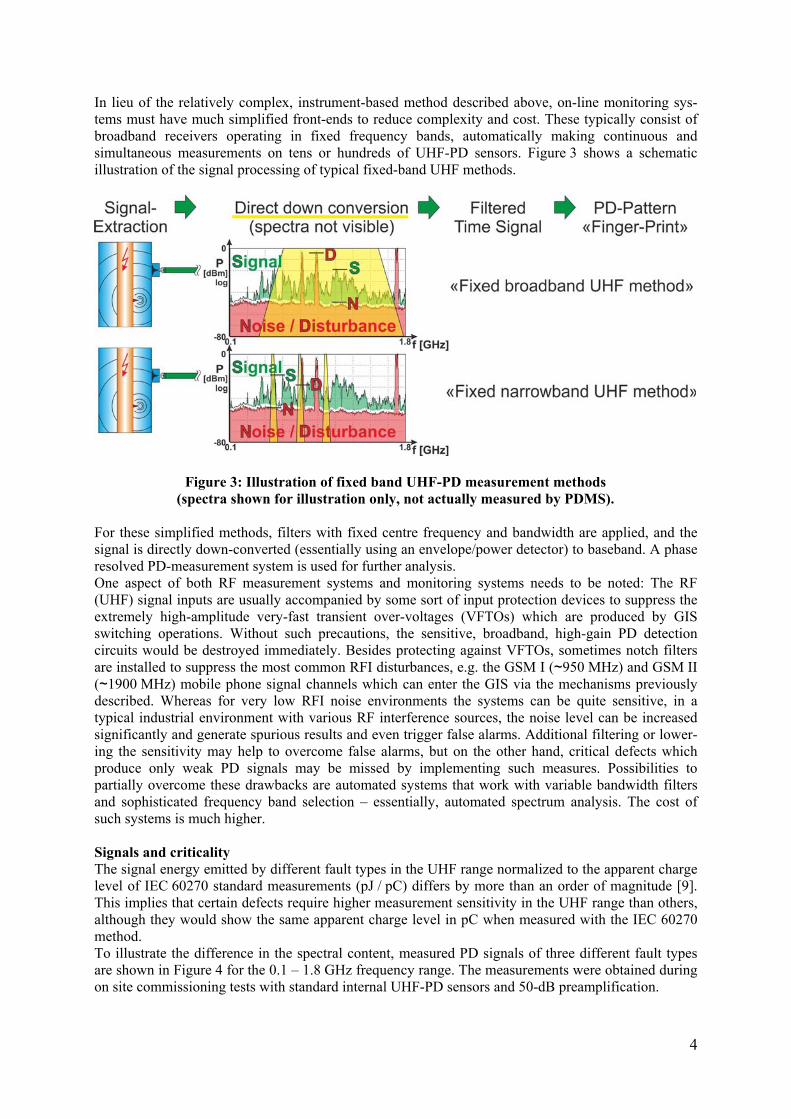
In lieu of the relatively complex, instrument-based method described above, on-line monitoring sys-tems must have much simplified front-ends to reduce complexity and cost. These typically consist of broadband receivers operating in fixed frequency bands, automatically making continuous and simultaneous measurements on tens or hundreds of UHF-PD sensors. Figure 3 shows a schematic illustration of the signal processing of typical fixed-band UHF methods.
Figure 3: Illustration of fixed band UHF-PD measurement methods (spectra shown for illustration only, not actually measured by PDMS).
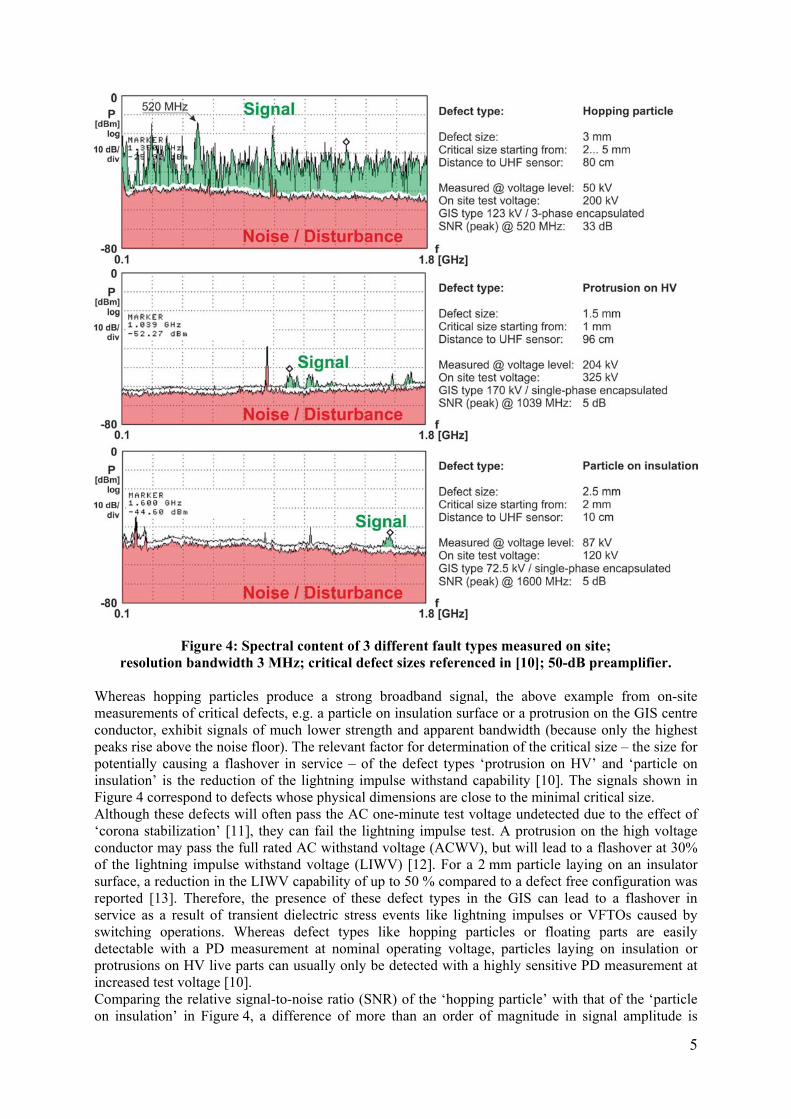
For these simplified methods, filters with fixed centre frequency and bandwidth are applied, and the signal is directly down-converted (essentially using an envelope/power detector) to baseband. A phase resolved PD-measurement system is used for further analysis. One aspect of both RF measurement systems and monitoring systems needs to be noted: The RF (UHF) signal inputs are usually accompanied by some sort of input protection devices to suppress the extremely high-amplitude very-fast transient over-voltages (VFTOs) which are produced by GIS switching operations. Without such precautions, the sensitive, broadband, high-gain PD detection circuits would be destroyed immediately. Besides protecting against VFTOs, sometimes notch filters are installed to suppress the most common RFI disturbances, e.g. the GSM I (~950 MHz) and GSM II (~1900 MHz) mobile phone signal channels which can enter the GIS via the mechanisms previously described. Whereas for very low RFI noise environments the systems can be quite sensitive, in a typical industrial environment with various RF interference sources, the noise level can be increased significantly and generate spurious results and even trigger false alarms. Additional filtering or lower-ing the sensitivity may help to overcome false alarms, but on the other hand, critical defects which produce only weak PD signals may be missed by implementing such measures. Possibilities to partially overcome these drawbacks are automated systems that work with variable bandwidth filters and sophisticated frequency band selection – essentially, automated spectrum analysis. The cost of such systems is much higher. Signals and criticality The signal energy emitted by different fault types in the UHF range normalized to the apparent charge level of IEC 60270 standard measurements (pJ / pC) differs by more than an order of magnitude [9]. This implies that certain defects require higher measurement sensitivity in the UHF range than others, although they would show the same apparent charge level in pC when measured with the IEC 60270 method. To illustrate the difference in the spectral content, measured PD signals of three different fault types are shown in Figure 4 for the 0.1 – 1.8 GHz frequency range. The measurements were obtained during on site commissioning tests with standard internal UHF-PD sensors and 50-dB preamplification.
5
Figure 4: Spectral content of 3 different fault types measured on site; resolution bandwidth 3 MHz; critical defect sizes referenced in [10]; 50-dB preamplifier.
Whereas hopping particles produce a strong broadband signal, the above example from on-site measurements of critical defects, e.g. a particle on insulation surface or a protrusion on the GIS centre conductor, exhibit signals of much lower strength and apparent bandwidth (because only the highest peaks rise above the noise floor). The relevant factor for determination of the critical size – the size for potentially causing a flashover in service – of the defect types ‘protrusion on HV’ and ‘particle on insulation’ is the reduction of the lightning impulse withstand capability [10]. The signals shown in Figure 4 correspond to defects whose physical dimensions are close to the minimal critical size. Although these defects will often pass the AC one-minute test voltage undetected due to the effect of ‘corona stabilization’ [11], they can fail the lightning impulse test. A protrusion on the high voltage conductor may pass the full rated AC withstand voltage (ACWV), but will lead to a flashover at 30% of the lightning impulse withstand voltage (LIWV) [12]. For a 2 mm particle laying on an insulator surface, a reduction in the LIWV capability of up to 50 % compared to a defect free configuration was reported [13]. Therefore, the presence of these defect types in the GIS can lead to a flashover in service as a result of transient dielectric stress events like lightning impulses or VFTOs caused by switching operations. Whereas defect types like hopping particles or floating parts are easily detectable with a PD measurement at nominal operating voltage, particles laying on insulation or protrusions on HV live parts can usually only be detected with a highly sensitive PD measurement at increased test voltage [10]. Comparing the relative signal-to-noise ratio (SNR) of the ‘hopping particle’ with that of the ‘particle on insulation’ in Figure 4, a difference of more than an order of magnitude in signal amplitude is
6
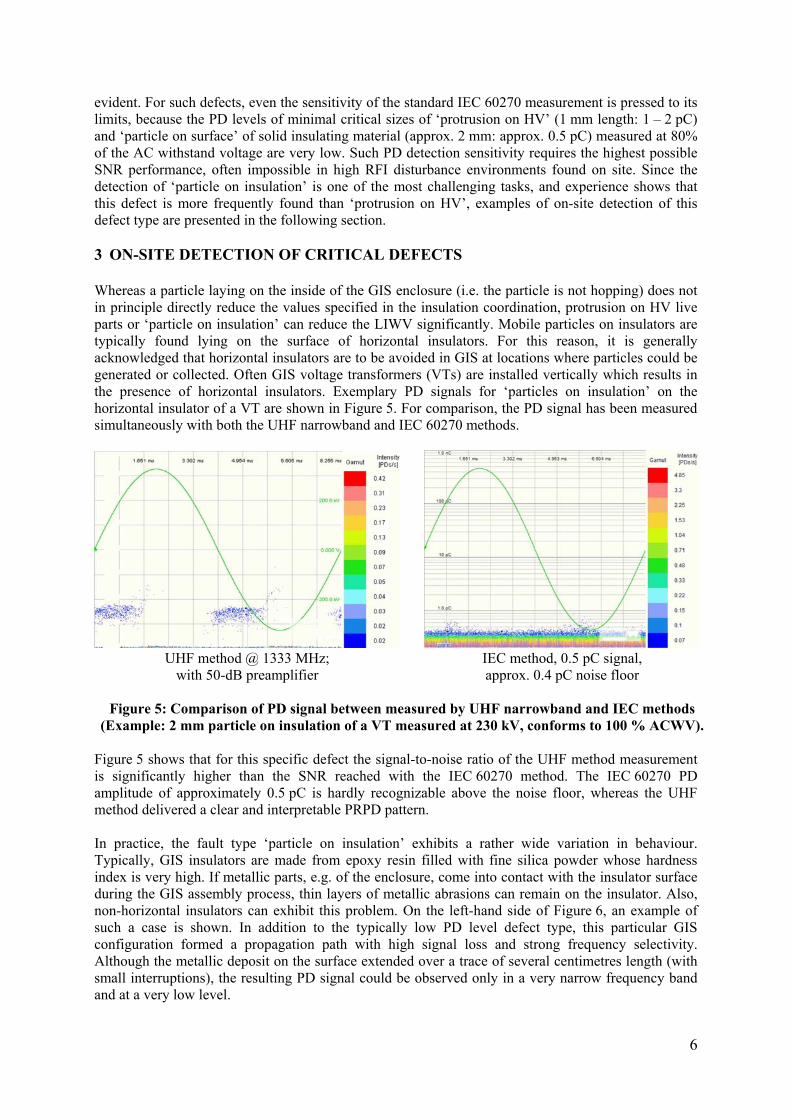
evident. For such defects, even the sensitivity of the standard IEC 60270 measurement is pressed to its limits, because the PD levels of minimal critical sizes of ‘protrusion on HV’ (1 mm length: 1 – 2 pC) and ‘particle on surface’ of solid insulating material (approx. 2 mm: approx. 0.5 pC) measured at 80% of the AC withstand voltage are very low. Such PD detection sensitivity requires the highest possible SNR performance, often impossible in high RFI disturbance environments found on site. Since the detection of ‘particle on insulation’ is one of the most challenging tasks, and experience shows that this defect is more frequently found than ‘protrusion on HV’, examples of on-site detection of this defect type are presented in the following section. 3 ON-SITE DETECTION OF CRITICAL DEFECTS Whereas a particle laying on the inside of the GIS enclosure (i.e. the particle is not hopping) does not in principle directly reduce the values specified in the insulation coordination, protrusion on HV live parts or ‘particle on insulation’ can reduce the LIWV significantly. Mobile particles on insulators are typically found lying on the surface of horizontal insulators. For this reason, it is generally acknowledged that horizontal insulators are to be avoided in GIS at locations where particles could be generated or collected. Often GIS voltage transformers (VTs) are installed vertically which results in the presence of horizontal insulators. Exemplary PD signals for ‘particles on insulation’ on the horizontal insulator of a VT are shown in Figure 5. For comparison, the PD signal has been measured simultaneously with both the UHF narrowband and IEC 60270 methods.
UHF method @ 1333 MHz;
with 50-dB preamplifier IEC method, 0.5 pC signal, approx. 0.4 pC noise floor
Figure 5: Comparison of PD signal between measured by UHF narrowband and IEC methods
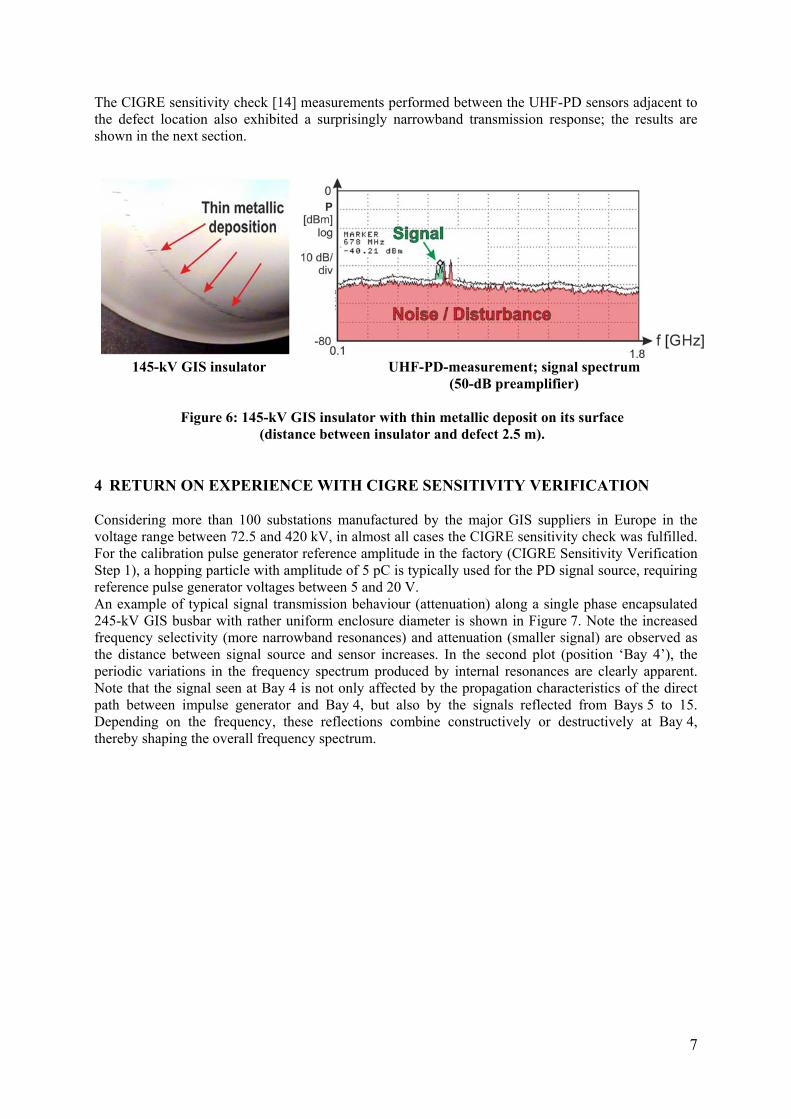
(Example: 2 mm particle on insulation of a VT measured at 230 kV, conforms to 100 % ACWV). Figure 5 shows that for this specific defect the signal-to-noise ratio of the UHF method measurement is significantly higher than the SNR reached with the IEC 60270 method. The IEC 60270 PD amplitude of approximately 0.5 pC is hardly recognizable above the noise floor, whereas the UHF method delivered a clear and interpretable PRPD pattern. In practice, the fault type ‘particle on insulation’ exhibits a rather wide variation in behaviour. Typically, GIS insulators are made from epoxy resin filled with fine silica powder whose hardness index is very high. If metallic parts, e.g. of the enclosure, come into contact with the insulator surface during the GIS assembly process, thin layers of metallic abrasions can remain on the insulator. Also, non-horizontal insulators can exhibit this problem. On the left-hand side of Figure 6, an example of such a case is shown. In addition to the typically low PD level defect type, this particular GIS configuration formed a propagation path with high signal loss and strong frequency selectivity. Although the metallic deposit on the surface extended over a trace of several centimetres length (with small interruptions), the resulting PD signal could be observed only in a very narrow frequency band and at a very low level.
7
The CIGRE sensitivity check [14] measurements performed between the UHF-PD sensors adjacent to the defect location also exhibited a surprisingly narrowband transmission response; the results are shown in the next section.
145-kV GIS insulator
UHF-PD-measurement; signal spectrum
(50-dB preamplifier)
Figure 6: 145-kV GIS insulator with thin metallic deposit on its surface (distance between insulator and defect 2.5 m).
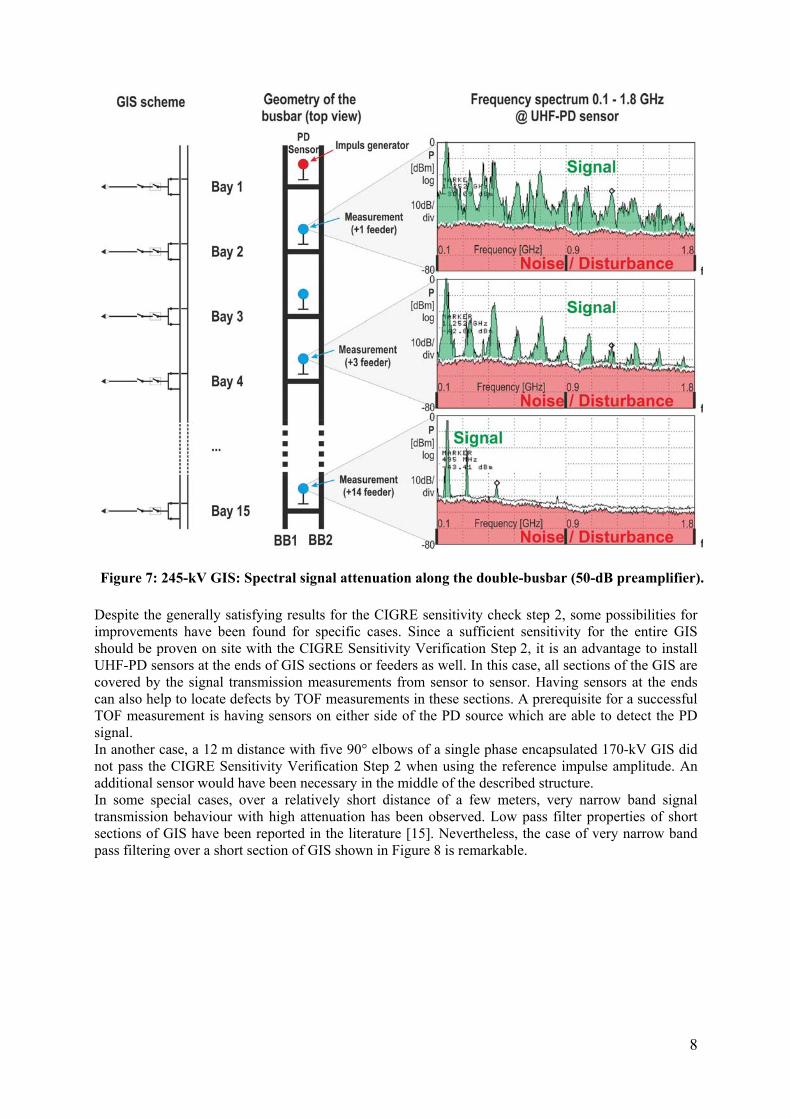
4 RETURN ON EXPERIENCE WITH CIGRE SENSITIVITY VERIFICATION Considering more than 100 substations manufactured by the major GIS suppliers in Europe in the voltage range between 72.5 and 420 kV, in almost all cases the CIGRE sensitivity check was fulfilled. For the calibration pulse generator reference amplitude in the factory (CIGRE Sensitivity Verification Step 1), a hopping particle with amplitude of 5 pC is typically used for the PD signal source, requiring reference pulse generator voltages between 5 and 20 V. An example of typical signal transmission behaviour (attenuation) along a single phase encapsulated 245-kV GIS busbar with rather uniform enclosure diameter is shown in Figure 7. Note the increased frequency selectivity (more narrowband resonances) and attenuation (smaller signal) are observed as the distance between signal source and sensor increases. In the second plot (position ‘Bay 4’), the periodic variations in the frequency spectrum produced by internal resonances are clearly apparent. Note that the signal seen at Bay 4 is not only affected by the propagation characteristics of the direct path between impulse generator and Bay 4, but also by the signals reflected from Bays 5 to 15. Depending on the frequency, these reflections combine constructively or destructively at Bay 4, thereby shaping the overall frequency spectrum.
8
Figure 7: 245-kV GIS: Spectral signal attenuation along the double-busbar (50-dB preamplifier).
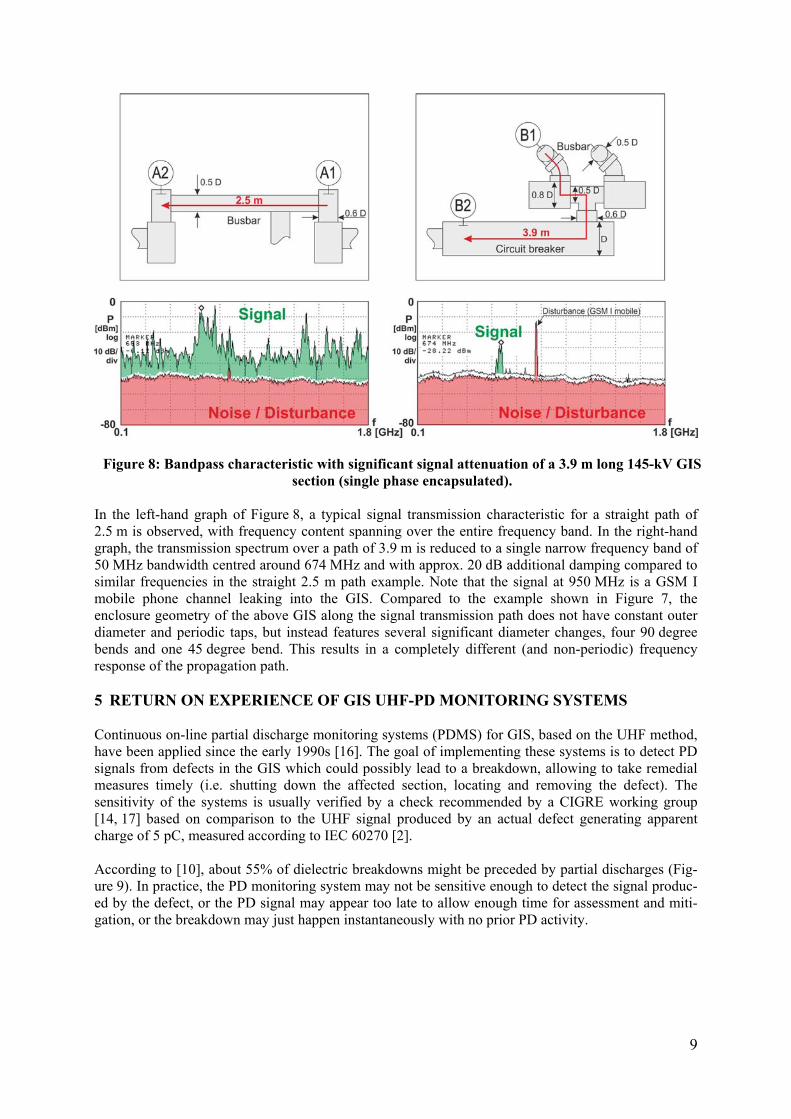
Despite the generally satisfying results for the CIGRE sensitivity check step 2, some possibilities for improvements have been found for specific cases. Since a sufficient sensitivity for the entire GIS should be proven on site with the CIGRE Sensitivity Verification Step 2, it is an advantage to install UHF-PD sensors at the ends of GIS sections or feeders as well. In this case, all sections of the GIS are covered by the signal transmission measurements from sensor to sensor. Having sensors at the ends can also help to locate defects by TOF measurements in these sections. A prerequisite for a successful TOF measurement is having sensors on either side of the PD source which are able to detect the PD signal. In another case, a 12 m distance with five 90° elbows of a single phase encapsulated 170-kV GIS did not pass the CIGRE Sensitivity Verification Step 2 when using the reference impulse amplitude. An additional sensor would have been necessary in the middle of the described structure. In some special cases, over a relatively short distance of a few meters, very narrow band signal transmission behaviour with high attenuation has been observed. Low pass filter properties of short sections of GIS have been reported in the literature [15]. Nevertheless, the case of very narrow band pass filtering over a short section of GIS shown in Figure 8 is remarkable.
9
Figure 8: Bandpass characteristic with significant signal attenuation of a 3.9 m long 145-kV GIS section (single phase encapsulated).
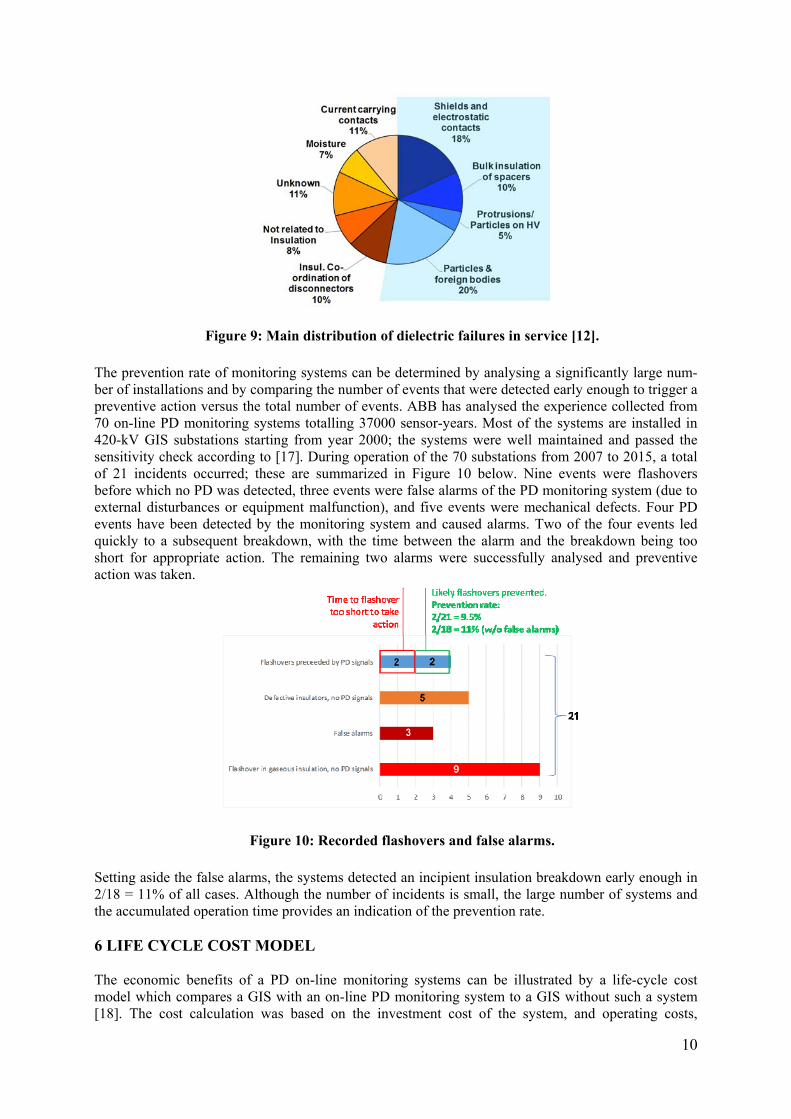
In the left-hand graph of Figure 8, a typical signal transmission characteristic for a straight path of 2.5 m is observed, with frequency content spanning over the entire frequency band. In the right-hand graph, the transmission spectrum over a path of 3.9 m is reduced to a single narrow frequency band of 50 MHz bandwidth centred around 674 MHz and with approx. 20 dB additional damping compared to similar frequencies in the straight 2.5 m path example. Note that the signal at 950 MHz is a GSM I mobile phone channel leaking into the GIS. Compared to the example shown in Figure 7, the enclosure geometry of the above GIS along the signal transmission path does not have constant outer diameter and periodic taps, but instead features several significant diameter changes, four 90 degree bends and one 45 degree bend. This results in a completely different (and non-periodic) frequency response of the propagation path. 5 RETURN ON EXPERIENCE OF GIS UHF-PD MONITORING SYSTEMS Continuous on-line partial discharge monitoring systems (PDMS) for GIS, based on the UHF method, have been applied since the early 1990s [16]. The goal of implementing these systems is to detect PD signals from defects in the GIS which could possibly lead to a breakdown, allowing to take remedial measures timely (i.e. shutting down the affected section, locating and removing the defect). The sensitivity of the systems is usually verified by a check recommended by a CIGRE working group [14, 17] based on comparison to the UHF signal produced by an actual defect generating apparent charge of 5 pC, measured according to IEC 60270 [2]. According to [10], about 55% of dielectric breakdowns might be preceded by partial discharges (Fig-ure 9). In practice, the PD monitoring system may not be sensitive enough to detect the signal produc-ed by the defect, or the PD signal may appear too late to allow enough time for assessment and miti-gation, or the breakdown may just happen instantaneously with no prior PD activity.
10
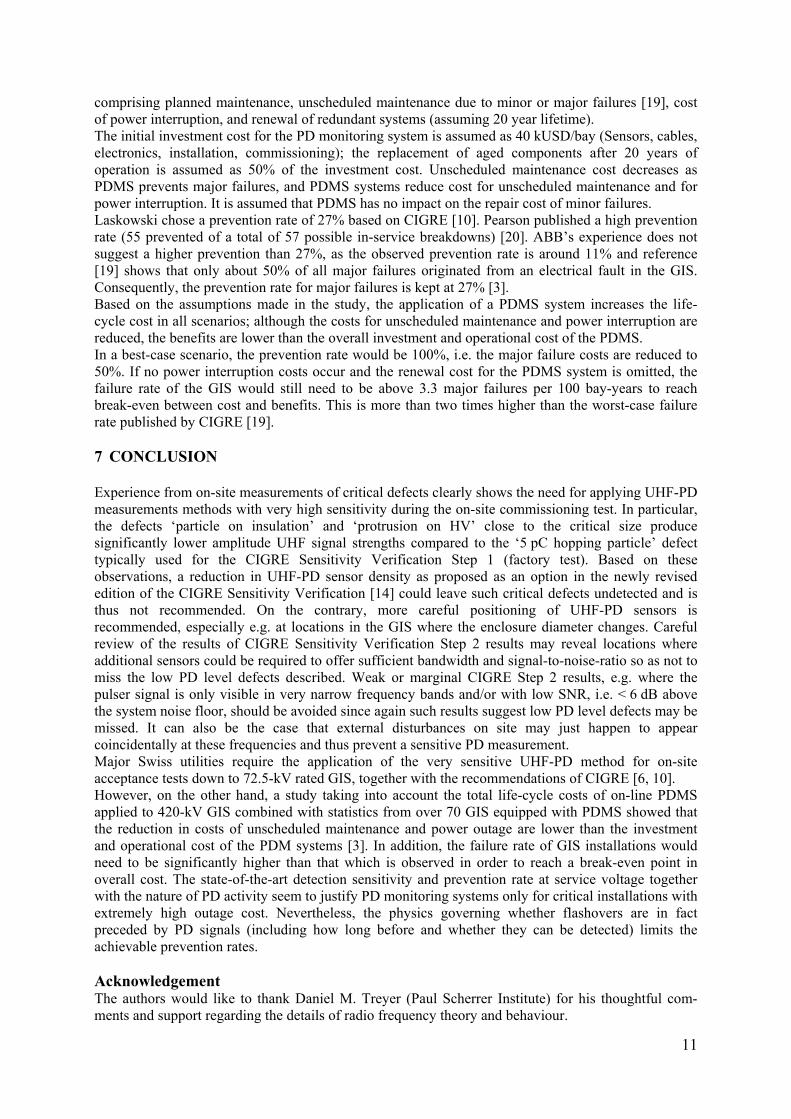
Figure 9: Main distribution of dielectric failures in service [12]. The prevention rate of monitoring systems can be determined by analysing a significantly large num-ber of installations and by comparing the number of events that were detected early enough to trigger a preventive action versus the total number of events. ABB has analysed the experience collected from 70 on-line PD monitoring systems totalling 37000 sensor-years. Most of the systems are installed in 420-kV GIS substations starting from year 2000; the systems were well maintained and passed the sensitivity check according to [17]. During operation of the 70 substations from 2007 to 2015, a total of 21 incidents occurred; these are summarized in Figure 10 below. Nine events were flashovers before which no PD was detected, three events were false alarms of the PD monitoring system (due to external disturbances or equipment malfunction), and five events were mechanical defects. Four PD events have been detected by the monitoring system and caused alarms. Two of the four events led quickly to a subsequent breakdown, with the time between the alarm and the breakdown being too short for appropriate action. The remaining two alarms were successfully analysed and preventive action was taken.
Figure 10: Recorded flashovers and false alarms. Setting aside the false alarms, the systems detected an incipient insulation breakdown early enough in 2/18 = 11% of all cases. Although the number of incidents is small, the large number of systems and the accumulated operation time provides an indication of the prevention rate. 6 LIFE CYCLE COST MODEL The economic benefits of a PD on-line monitoring systems can be illustrated by a life-cycle cost model which compares a GIS with an on-line PD monitoring system to a GIS without such a system [18]. The cost calculation was based on the investment cost of the system, and operating costs,
11
comprising planned maintenance, unscheduled maintenance due to minor or major failures [19], cost of power interruption, and renewal of redundant systems (assuming 20 year lifetime). The initial investment cost for the PD monitoring system is assumed as 40 kUSD/bay (Sensors, cables, electronics, installation, commissioning); the replacement of aged components after 20 years of operation is assumed as 50% of the investment cost. Unscheduled maintenance cost decreases as PDMS prevents major failures, and PDMS systems reduce cost for unscheduled maintenance and for power interruption. It is assumed that PDMS has no impact on the repair cost of minor failures. Laskowski chose a prevention rate of 27% based on CIGRE [10]. Pearson published a high prevention rate (55 prevented of a total of 57 possible in-service breakdowns) [20]. ABB’s experience does not suggest a higher prevention than 27%, as the observed prevention rate is around 11% and reference [19] shows that only about 50% of all major failures originated from an electrical fault in the GIS. Consequently, the prevention rate for major failures is kept at 27% [3]. Based on the assumptions made in the study, the application of a PDMS system increases the life-cycle cost in all scenarios; although the costs for unscheduled maintenance and power interruption are reduced, the benefits are lower than the overall investment and operational cost of the PDMS. In a best-case scenario, the prevention rate would be 100%, i.e. the major failure costs are reduced to 50%. If no power interruption costs occur and the renewal cost for the PDMS system is omitted, the failure rate of the GIS would still need to be above 3.3 major failures per 100 bay-years to reach break-even between cost and benefits. This is more than two times higher than the worst-case failure rate published by CIGRE [19]. 7 CONCLUSION Experience from on-site measurements of critical defects clearly shows the need for applying UHF-PD measurements methods with very high sensitivity during the on-site commissioning test. In particular, the defects ‘particle on insulation’ and ‘protrusion on HV’ close to the critical size produce significantly lower amplitude UHF signal strengths compared to the ‘5 pC hopping particle’ defect typically used for the CIGRE Sensitivity Verification Step 1 (factory test). Based on these observations, a reduction in UHF-PD sensor density as proposed as an option in the newly revised edition of the CIGRE Sensitivity Verification [14] could leave such critical defects undetected and is thus not recommended. On the contrary, more careful positioning of UHF-PD sensors is recommended, especially e.g. at locations in the GIS where the enclosure diameter changes. Careful review of the results of CIGRE Sensitivity Verification Step 2 results may reveal locations where additional sensors could be required to offer sufficient bandwidth and signal-to-noise-ratio so as not to miss the low PD level defects described. Weak or marginal CIGRE Step 2 results, e.g. where the pulser signal is only visible in very narrow frequency bands and/or with low SNR, i.e. < 6 dB above the system noise floor, should be avoided since again such results suggest low PD level defects may be missed. It can also be the case that external disturbances on site may just happen to appear coincidentally at these frequencies and thus prevent a sensitive PD measurement. Major Swiss utilities require the application of the very sensitive UHF-PD method for on-site acceptance tests down to 72.5-kV rated GIS, together with the recommendations of CIGRE [6, 10]. However, on the other hand, a study taking into account the total life-cycle costs of on-line PDMS applied to 420-kV GIS combined with statistics from over 70 GIS equipped with PDMS showed that the reduction in costs of unscheduled maintenance and power outage are lower than the investment and operational cost of the PDM systems [3]. In addition, the failure rate of GIS installations would need to be significantly higher than that which is observed in order to reach a break-even point in overall cost. The state-of-the-art detection sensitivity and prevention rate at service voltage together with the nature of PD activity seem to justify PD monitoring systems only for critical installations with extremely high outage cost. Nevertheless, the physics governing whether flashovers are in fact preceded by PD signals (including how long before and whether they can be detected) limits the achievable prevention rates. Acknowledgement The authors would like to thank Daniel M. Treyer (Paul Scherrer Institute) for his thoughtful com-ments and support regarding the details of radio frequency theory and behaviour.
12
BIBLIOGRAPHY [1] B. F. Hampton; R. J. Meats, ‘Diagnostic measurements at UHF in gas insulated substations’
(IEE Proceedings C – Generation, Transmission and Distribution, Year 1988, Volume 135, Issue: 2, pages 137 – 145)
[2] IEC-Publication 60270, High-voltage test techniques – Partial discharge measurements, Third edition 2000-12
[3] H.D. Schlemper, U. Riechert, G. Behrmann, J. Manz, ‘Application and Benefits of UHF On-Line Partial Discharge Monitoring in GIS’, CIGRE Colloquium Winnipeg, D1-086, Fall 2017
[4] CIGRE Working Group B3.17, GIS state of the Art 2008, Brochure 381, June 2009, p. 89 [5] IEC-Publication 60071-2, Insulation coordination; Part 2; Application Guide, Third edition
1996-12 [6] CIGRE Brochure 509, Final report of the 2004 - 2007 International enquiry on reliability of
high voltage equipment, Part 1 – Summary and general matters, Working Group A3.06, October 2012
[7] A. J. Reid, M. D. Judd, ‘Ultra-wide bandwidth measurement of partial discharge current pulses in SF6’, Journal of Physics. D, Appl. Phys. 45, 2012
[8] G. Behrmann, K. Wyss, J. Weiss, M. Schraudolph, S. Neuhold, J. Smajic, ‘Signal delay effects of solid dielectrics on time-of-flight measurements in GIS’, IEEE transactions on dielectrics and electrical insulation, Vol. 23, No. 3; June 2016
[9] B.G. Stewart, M.D. Judd, A.J. Reid, R.A. Fouracre, ‘Suggestions to augment the IEC 60270 partial discharge standard in relation to radiated electromagnetic energy’, IEEE, 2007, DOI: 10.1109/EEIC.2007.4562614
[10] CIGRE Joint Working Group 33/23.12; Insulation co-ordination of GIS; return of experience on site and diagnostic techniques; Electra No 176; February 1998
[11] T. Hinterholzer, W. Boeck, ‘Breakdown in SF6 influenced by corona-stabilization’, conference on electric insulation and dielectric phenomena, 413 – 416, Victoria, British Columbia, Oct 15-18; 2000
[12] CIGRE Brochure 525, ‘Risk assessment on defects in GIS based on PD diagnostics’, working group D1.03, February 2013
[13] R. Schurer, ‘Der Einfluss von Störstellen auf Stützeroberflächen auf die elektrische Festigkeit von Isolieranordnungen in SF6-isolierten Anlagen’, PHD-thesis, institute for energy transmis-sion and high voltage technology of the University of Stuttgart, 1999
[14] CIGRE Brochure 654, ‘UHF partial discharge detection system for GIS: Application guide for sensitivity verification’, working group D1.25, April 2016
[15] G. J. Behrmann, S. Neuhold, R. Pietsch, ‘Results of UHF measurements in a 220 kV GIS sub-station during on-site commissioning tests’, ISH, Montreal, 1997
[16] Experience and Progress with UHF Diagnostics in GIS, (Hampton, Pearson, Welch, Jones, Irwin, Pryor), CIGRE 15/23.03, 1992
[17] CIGRE TF 15/33.03.05, ‘PD Detection System for GIS: Sensitivity Verification for the UHF Method and the Acoustic Method’, Electra No.183, 1999
[18] K. Laskowski, ‘Life Cycle Cost-Betrachtungen von Hochspannungsschaltanlagen. Vergleich-ende Beurteilung konventioneller Anlagenkonzepte und aktueller Hybridlösungen’, PhD Thesis. Technische Universität Darmstadt, Germany, Elektrotechnik und Informationstechnik. (2006)
[19] M. Runde, C.E. Sölver, ‘Final Report of the 2004 - 2007 International Enquiry on Reliability of High Voltage Equipment. Part 5 - Gas Insulated Switchgear (GIS)’ - 513. WG A3.06, with A. Carvalho, M.L Cormenzana, H. Furuta, W. Grieshaber, A. Hyrczak, D. Kopejkova et al. (CIGRE Brochure, 513, 2012)
[20] J.S. Pearson, ‘From PD Measurement to Risk Assessment’, Workshop of AG D1.03 New Challenges for Material and Diagnostics (2014)


![21, rue d’Artois, F-75008 PARIS International Colloquium ... · images method (SCIM) [10] and the modified images method (MIM) [9] has been used respectively. If these coefficients](https://static.fdocuments.net/doc/165x107/5e735307ca5f9445f463503b/21-rue-daartois-f-75008-paris-international-colloquium-images-method-scim.jpg)


