21, rue d’Artois, F-75008 PARIS C3-208 CIGRE 2012...
14
[email protected] Life Cycle Assessment on a 765 kV AC transmission system W. WANG, A. BEROUAL, T. MEHIRI, G.TREMOUILLE Alstom Grid Ecole Centrale de Lyon Alstom Grid Alstom Grid France France France France SUMMARY The demand to preserve the environment and form a sustainable development is greatly increasing in the recent decades all over the world, and this environmental concern is also merged in electrical power industry, resulting in many eco-design approaches in power Transmission network. As a method of eco-design, Life Cycle Assessment (LCA) is a systematic tool that enables the assessment of the environmental impacts of a product or service throughout its entire life cycle, i.e. raw material production, manufacture, distribution, use and disposal including all intervening transportation steps necessary or caused by the product's existence. In high voltage industries, LCA has been done for a lot of individual products, in order to have a look on individual product’s environmental impacts and to seek for ways of improving its environmental performance. This eco-design analysis for product approach is a rather well-developed trend, however, as only a single electrical product cannot provide the electrical power to users, electrical system consists of a huge number of components, in order to investigate system’s environmental profile, the entire environmental profiles of different composing products has to be integrated systematically, that is to say, a system approach is needed. Under this philosophy, in this paper, an LCA using SimaPro (one kind of LCA software) is conducted on a whole Venezuelan 765 kV AC transmission system, with the aim of investigating potential environmental impacts of power transmission system, and locating major sources of environmental burdens from transmission system. The functional unit of this investigated transmission system is transmitting 8000 MW hydro-electrical power through 760 km to this country’s load centers, under an average power factor of 60%, during a service life of 60 years. Key Words: Eco-design; Life Cycle Assessment (LCA); Transmission System; 765 kV AC 21, rue d’Artois, F-75008 PARIS C3-208 CIGRE 2012 http : //www.cigre.org
Transcript of 21, rue d’Artois, F-75008 PARIS C3-208 CIGRE 2012...

Life Cycle Assessment on a 765 kV AC transmission system W. WANG, A. BEROUAL, T. MEHIRI, G.TREMOUILLE Alstom Grid Ecole Centrale de Lyon Alstom Grid Alstom Grid France France France France SUMMARY The demand to preserve the environment and form a sustainable development is greatly increasing in the recent decades all over the world, and this environmental concern is also merged in electrical power industry, resulting in many eco-design approaches in power Transmission network. As a method of eco-design, Life Cycle Assessment (LCA) is a systematic tool that enables the assessment of the environmental impacts of a product or service throughout its entire life cycle, i.e. raw material production, manufacture, distribution, use and disposal including all intervening transportation steps necessary or caused by the product's existence. In high voltage industries, LCA has been done for a lot of individual products, in order to have a look on individual product’s environmental impacts and to seek for ways of improving its environmental performance. This eco-design analysis for product approach is a rather well-developed trend, however, as only a single electrical product cannot provide the electrical power to users, electrical system consists of a huge number of components, in order to investigate system’s environmental profile, the entire environmental profiles of different composing products has to be integrated systematically, that is to say, a system approach is needed. Under this philosophy, in this paper, an LCA using SimaPro (one kind of LCA software) is conducted on a whole Venezuelan 765 kV AC transmission system, with the aim of investigating potential environmental impacts of power transmission system, and locating major sources of environmental burdens from transmission system. The functional unit of this investigated transmission system is transmitting 8000 MW hydro-electrical power through 760 km to this country’s load centers, under an average power factor of 60%, during a service life of 60 years. Key Words: Eco-design; Life Cycle Assessment (LCA); Transmission System; 765 kV AC
21, rue d’Artois, F-75008 PARIS C3-208 CIGRE 2012 http : //www.cigre.org

1
0 INTRODUCTION
Life Cycle Assessment (LCA) is commonly used tool for assessing potential environmental aspects of a product or service, throughout its entire life cycle [1]. LCA is able to assess a series of environmental impact categories, such as Global Warming (GWP), Air Acidification (AA), Ozone Depletion (ODP), Photochemical Ozone Creation (POC), Water Eutrophication (WE), Air Toxicity (AT), Water Toxicity (WT), Raw Material Depletion (RMD), Energy Depletion (ED), Hazardous Waste Production (HWP), Water Depletion (WD), etc. In this paper, LCA study is conducted on one 765 kV AC transmission system in Venezuela, with the aim of investigate the potential environmental impacts of transmission system, locating the major sources of environmental burdens from one electrical transmission system. The most difficulty of conducting one Life Cycle Assessment is the collection of needed data for different equipments in substations; otherwise it’s impossible to analyze a transmission system’s environmental impacts. Nevertheless, almost all major equipments in this Venezuelan 765 kV AC transmission system were supplied from Alstom Grid, so the data is accessible, which makes this project a typical model of transmission system to be assessed its potential environmental impacts. Fig. 1 shows this Venezuelan 765 kV AC transmission lines, which transmits 8000 MW hydro-electrical power from Guri to this country’s load centers, located in the north of the country. 4 receiving end substations are Yaracuy, La Arenosa, La Horqueta and Sur, and the distance from Guri to the receiving end is around 760 km. 2 intermediate substations, i.e. Malena and San Geronimo are built to make reactive compensation.
Fig. 1 : Illustration of Venezuelan 765 kV AC transmission system
Thus, the functional unit of this LCA investigation of this 765 kV AC transmission system is to transmit 8000 MW hydro-electrical power to 760 km, during its service life of 60 years, under a power factor of 60%. The scope of this LCA only focuses on the transmission system, neither the generation plant nor the set-up transformers (18/765 kV) are included.
Guri
San Geronimo
Yaracuy
La Arenosa
765 kV 400 kV 230 kV
*
*8000 MW
Malena
Sur La
Horqueta

2
1 LIFE CYCLE ASSESSMENT (LCA)
Life Cycle Assessment (LCA) is currently a useful tool enabling to assess the potential environmental impacts of a product (or a service) through its life cycle. The term “life cycle” refers to raw material production, manufacture, distribution, use and disposal including all intervening transportation steps necessary or caused by the product's existence, see Fig. 2.
Fig. 1 : Life Cycle Notion [2]
The common procedures of performing one LCA is well defined in ISO 14040:2006 Environmental Management - Life Cycle Assessment - Principles and Framework, which makes it possible to communicate between different LCA practitioners about their work on environmental impacts. A Life Cycle Assessment comprises four distinct phases (see Fig. 2), i.e. the goal and scope definition, inventory analysis, impact assessment, and interpretation.
In “goal and scope definition” phase, the LCA practitioner specifies the goal and scope of study in relation to the intended application. The object of study is described in terms of a “functional unit”. The “Life Cycle Inventory (LCI)” phase involves data collection and calculation to quantify inputs and outputs of materials and energy associated with a product system under study. Examples of inputs and outputs quantities include inputs of materials, energy, chemicals, etc, and outputs of air emissions, water emissions or solid waste, etc. Usually, LCI is carried out by using a dedicated software package, such as SimaPro [3] or GaBi [4]. The “Life Cycle Impact Assessment (LCIA)” phase is aimed at evaluating the contribution to impact categories such as Global Warming, Acidification, etc. The classification step is assignment of LCI results in to category indicators, and the characterization step is the calculation of category indicator results of potential environmental impacts. The next steps are normalization and weighting, but these are both voluntary according the ISO standard. The normalization and weighting steps are optional in LCIA.

3
Fig. 3 : Four phases of LCA [5]
In the “Interpretation” phase the findings from the inventory analysis and the impact assessment are considered together or, in the case of LCI studies, the findings of the inventory analysis only. It is an analysis of the major contributions, sensitivity analysis and uncertainty analysis. The interpretation phase should deliver results that are consistent with the defined goal and scope and which reach conclusions, explain limitations and provide recommendations.
2 MATERIALS AND ENERGY INVENTORIES OF 765 KV TRANSMISSION SYSTEM
As this transmission system is a huge system, for the clarity in logic and convenience of conducting the LCA, the investigation of materials and energy inventories is split up into 2 parts, i.e. transmission lines and substations.
2.1 TRANSMISSION LINES
In the LCA investigation, transmission lines are composed of conductors, ground wires, towers and insulators. The transmission line conductors are ACAR (Aluminium Conductor Alloy Reinforced) type, which is made of a combination of aluminium and alunimium alloy wires. The ground wire is Alumoweld 7#7 type wire. As for the towers, besides the steel structures, the reinforced concrete for towers has been taken into consideration. Both ceramic and glass insulators are used in this project, but for the simplicity of calculation, the assumption is applied that all insulators are ceramic. After investigation, Table 1 lists all the considered materials in transmission lines.
Table 1 : Materials used in 765 kV AC transmission line during 60 years Components Material Weight
Conductors Al 49714 ton 49714 ton Ground wires Al 227.6 ton 2243.6 ton
steel 2016 ton Towers
steel 86475 ton 109159 ton reinforced concrete 186466 ton
Zn coatings 4218 ton ceramic 5624 ton
4
Insulators cast iron (cap + pin) 8360 ton 13984 ton The use phase of transmission lines is defined as energy losses due to Joule effects in conductors during the service life of 60 years of this transmission system, which is calculated to be 6.66 × 10⁷ MWh, i.e. power loss of 126.8 MW. It’s noticed that only the ohmic loss is considered, no corona loss is taken into account. Transportation phase of total transmission lines is defined as the sum of individual transportation phase of different components of transmission lines. For example, all the conductors, ground wires and towers were manufactured from Venezuelan suppliers, so their transportation phase is simulated as transported by lorry for an average distance of 500 km. Insulators were manufactured in France, the transportation is modeled as 1000 km by truck and 7000 km by ship. In the end-of-life phase, conductors, ground wires are treated as recycling of the Aluminium and steel; as to insulators the ceramic is landfilled, and the caps plus pins are recycled as steel; regarding to towers, steel tower structures is recycled and reinforced concrete is landfilled, with the reinforced steel bars recycled. Hereinabove, the different stages of life cycle for transmission lines are defined, the materials and energy are inventoried. However, it should be emphasized that the considered materials of transmission lines include the major parts of the transmission lines, while the rest materials are not included, say, hardware to fix insulators and conductors, spacers for conductors, etc..
3 SUBSTATIONS
3.1 MATERIALS
In the investigation of substations, considered components include major equipments such as power transformers, circuit breakers, current transformers, voltage transformers, shunt reactors, surge arresters, disconnectors, etc, of course including their supporting frames and foundations; and constructions such as gantries, access roads, gravels in substations, etc. However, in this investigation, only the primary system is included, the so-called “secondary systems” - such as low voltage (lower than 1 kV) cables, lighting system, controlling systems (computers, electronic devices, IT, etc) - are not integrated. Materials and energy inventories are summarized hereinafter. The considered equipments are power transformers, circuit breakers, current transformers, voltage transformers, shunt reactors, surge arresters, disconnectors, insulators, line traps and coupling capacitors, their composing materials are investigated, as it’s a long list of bill of materials, there is of no interest display here. The other components and construction considered in the LCA comprise conductors, busbars and ground wires in substations in all substations, and gantries, access roads and gravels, which are shown in Table 2 to Table 5.
Table 2: Conductors in all substations AAC
4000 MCM ACAR
1300 MCM Total weight (ton) 254.7 119.7
Table 3: Busbars in all substations
Wire type ACAR 1300 MCM
Total weight 70.2 ton
Table 4: Ground wires in all substations Wire type Alumoweld

5
Total weight (kg) 9963.3 Al weight (kg) 579 Steel weight (kg) 933.6
Table 5: Construction structures in all the 7 substations
Structure
Notes Quantity during 60 years of service life
Gantries
Steel 3899 ton Zinc 67 ton
Reinforced concrete foundation 39960 ton Gravel 84075 ton Access road Concrete 23394 ton
Gravel +Stone 23926 ton
Then the total materials inventories of substations are the sum of all the considered components described hereinbefore.
3.2 USE PHASE
Use phase of substations is the sum of all the use phases of different equipments and conductors. These use phases of equipments include power transformers, circuit breakers, voltage transformers, current transformers, surge arresters, shunt reactors, disconnectors, line traps and coupling capacitors. All the use phase of equipments is defined as the electrical energy losses except for circuit breaker, whose use phase includes SF6-emissisons and electrical energy losses as well. For the purpose of comparing different components’ energy losses, their energy losses are listed below, listed in Table 6.
Table 6 : Energy losses of all components in all substations Equipments Power loss (kW) Energy loss during
60 years (kWh)
Total power transformers 8379 4.40×10⁹ Total shunt reactors 4140 2.18×10⁹ Total conductors 300.0 1.58×10⁸ Total disconnectors 56.6 2.97×10⁷ Total coupling capacitors 44.1 2.32×10⁷ Total circuit breakers 17.0 8.9×10⁶ Total surge arresters 13.7 7.19×10⁶ Total current transformers 2.2 1.15 ×10⁶ Total voltage tansformers 0.7 3.38 ×10⁵ Total line traps 0.1 5.05 ×10⁴ Total 12954 6.81×10⁹
Fig. 4 illustrates the energy losses percentage of different components in substations, it clearly shows that the power transformers take up 64.7% of total energy losses in substation, shunt reactors account for 32.0%, conductors for 2.3%, and the rest for only 1.0% (including disconnectors, coupling capacitors, circuit breakers, etc.).

6
32.0%
2.3% 1.0%
64.7%
total powertransformerstotal shunt reactors
total conductors
total disconnectors
total couplingcapacitorstotal circuitbreakerstotal surge arresters
total currenttransformerstotal voltagetransformerstotal line traps
Fig. 4: Energy losses percentage of components in all substations
As to circuit breakers, SF6 leakage is modeled according to the data listed in Table 7. Leakage during manufacture & commissioning and in-service leakage are categorized to use phase of circuit breakers.
Table 7 : Total SF6 leakage in life cycle of circuit breakers Leakage types Rate Leakage during manufacture & commissioning 1% in-service leakage 0.5% per annum Maintenance leakage 1% Dismantling leakage 1%
3.3 TRANSPORTATION PHASE & END-OF-LIFE PHASE
The transportation phase of total substations is simulated as the sum of transportations phases of all the components in substations. For example, most equipments were manufactured in France, and there transportation phase is modeled as 1000 km by truck and 7000 km by ship. The gantries, busbars, conductors and ground wires were manufactured in Venezuela, so their transportation phase is modeled as 500 km by truck. The end-of-life phase of substations is the sum of end-of-life phases of all the components in substations. For instance, transformer oil and SF6 are recycled according to Alstom Grid’s waste treatment sub-contractors; useful metals such as copper, steel and aluminium are recycled; PTFE is sent to dangerous waste landfill, while pressboard, paper, PA6, PE, PET, PP, EPDM and Epoxy are incinerated; porcelains are landfilled, and the rest are incinerated, etc.
4 LIFE CYCLE IMPACT ASSESSMENT (LCIA) OF 765 KV TRANSMISSION SYSTEM
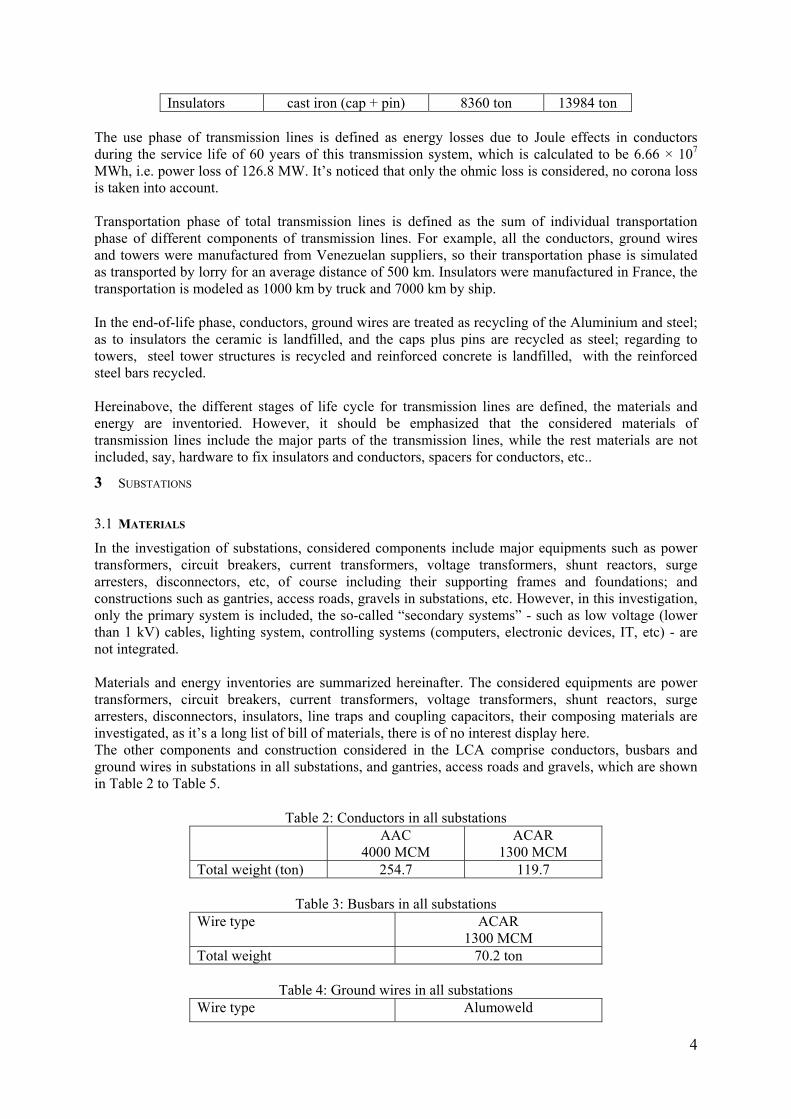
With the inventories results acquired in Section 3, the Life Cycle Impact Assessment (LCIA) of Transmission System can be done. In this paper, the LCIA is carried out by using software package SimaPro 7.1, through the analysis by the impacts assessment method EDIP/UMIP 97 (Environmental Design of Industrial Products, in Danish UMIP) version 2.03 [6], the characterization result of Life Cycle Impact Assessment of this transmission system is shown in Fig. 5. The characterization is the calculation of category indicator results of potential environmental impacts.
7
Fig. 5 : Characterization result of 765 kV transmission system
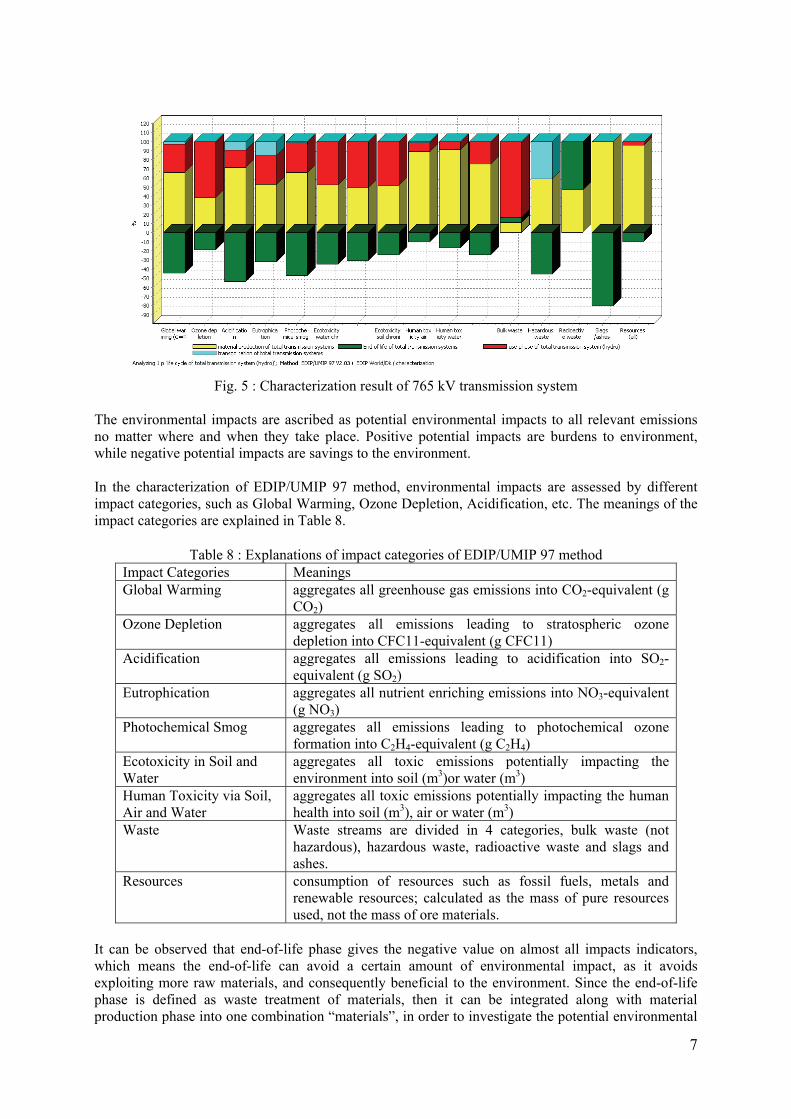
The environmental impacts are ascribed as potential environmental impacts to all relevant emissions no matter where and when they take place. Positive potential impacts are burdens to environment, while negative potential impacts are savings to the environment. In the characterization of EDIP/UMIP 97 method, environmental impacts are assessed by different impact categories, such as Global Warming, Ozone Depletion, Acidification, etc. The meanings of the impact categories are explained in Table 8.
Table 8 : Explanations of impact categories of EDIP/UMIP 97 method Impact Categories Meanings Global Warming aggregates all greenhouse gas emissions into CO2-equivalent (g
CO2) Ozone Depletion aggregates all emissions leading to stratospheric ozone
depletion into CFC11-equivalent (g CFC11) Acidification aggregates all emissions leading to acidification into SO2-
equivalent (g SO2) Eutrophication aggregates all nutrient enriching emissions into NO3-equivalent
(g NO3) Photochemical Smog aggregates all emissions leading to photochemical ozone
formation into C2H4-equivalent (g C2H4) Ecotoxicity in Soil and Water
aggregates all toxic emissions potentially impacting the environment into soil (m3)or water (m3)
Human Toxicity via Soil, Air and Water
aggregates all toxic emissions potentially impacting the human health into soil (m3), air or water (m3)
Waste Waste streams are divided in 4 categories, bulk waste (not hazardous), hazardous waste, radioactive waste and slags and ashes.
Resources consumption of resources such as fossil fuels, metals and renewable resources; calculated as the mass of pure resources used, not the mass of ore materials.
It can be observed that end-of-life phase gives the negative value on almost all impacts indicators, which means the end-of-life can avoid a certain amount of environmental impact, as it avoids exploiting more raw materials, and consequently beneficial to the environment. Since the end-of-life phase is defined as waste treatment of materials, then it can be integrated along with material production phase into one combination “materials”, in order to investigate the potential environmental

8
impacts caused by materials, although these impacts may happen in different places at different time. Thus, Fig. 6 gives the characterization result of transmission system when integrating the materials production phase and end-of-life phase.
Fig. 6 : Characterization result of 765 kV transmission system
(integrating the materials production phase and end-of-life phase into the impacts of materials)
It’s seen that use phase gives the most environmental impacts on most of indicators. As to Global Warming Potential the use phase accounts for 55.9%, materials (production + end-of-life) for 39.3%, transport for 4.8%; regarding to Ozone Depletion Potential, the use phase accounts for 75.8%, materials (production + end-of-life) for 24.2%, transport for 0.06%, etc. It’s also seen from the single score result (Fig. 7) of total transmission system that the use phase has the most environmental impacts.
Fig. 7 : Single score result of 765 kV transmission system
In Life Cycle Impact Assessment, the categories of environmental impact or resource consumption can be normalized to show the relative magnitude of each category. Normalization gives an impression of which impact categories are large or small by comparing them to a common reference for all categories. The normalization references in the EDIP/UMIP 97 method are the annual environmental impact or resource consumption of one person in each of the categories. The potential impact or resource consumption of a given category is divided by the corresponding normalization reference, and the unit of the normalized results is Person Equivalent (Pt). All categories of environmental

9
impact and resource consumption are assigned the same unit and thereby made comparable. Furthermore, people can choose to assign a weight to each category if they are of unequal importance. The weighting method in EDIP/UMIP 97 method is that environmental impacts are weighted by political reduction targets, and resources are weighted based on reserves. Thus, the single score of environment impacts is the sum of the weighted results (unit in Person Equivalent) of different categories. However, the normalization and weighting are optional in Life Cycle Impact Assessment, and the single score is not recommended by the authors of EDIP/UMIP 97 method, as resources may never be included in a single score, due to a different weighting method for resources (based on reserves rather than political targets). Herein the single score result is utilized to show the impact magnitude of different phases of transmission system, thus it could be interpreted that use phase is the major environment impact, as use phase accounts for 60.5% of single score of environmental impacts of the transmission system, materials (production plus end-of-life) takes up for 38.9%, and the transportation phase for only 0.6%. The use phase of total transmission system is composed by SF6 emissions of circuit breakers, energy losses in substations and energy losses in transmission lines, from the investigation of the comparison as shown in Fig. 8. It’s seen that energy losses in transmission lines are the dominating environmental impacts in use phase, energy losses in substations is only around tenth of the transmission lines’, SF6 emissions of circuit breakers’ impact is only on Global Warming, whose CO2-equivalent emissions are 28.9% of energy losses’ in transmission lines.
Fig. 8 : Comparisons of environmental impacts in use phase
of 765 kV transmission system
Fig. 9 shows environmental impacts contribution in use phase of total transmission system, which are measured by single score of environmental impacts.

10
Fig. 9: Environmental impacts contribution flow chart of use phase of
765 kV transmission system (cut-off rule: 0.2%)
It clearly indicates environmental impacts contribution of different components’ use phases in this Venezuelan 765 kV AC transmission system. However, it’s should noticed that the resources consumption indicator is not taken into account in the single score result, due to different weighting method for resources consumption. The cut-off rule is set as 0.2%, this means that the component with impacts less than 0.2% of the total transmission system’s impacts is not displayed in the flow chart. It reveals that the use phase of transmission lines gives 90.3% environmental impacts in the use phase of total transmission system. The energy losses are the most impacting factor (99.6% of total single score), while the SF6 emissions of circuit breakers’ are not the key issue regarding the environmental impacts. Regarding the equipments in substations, use phase power transformers accounts for 5.97% of the total system use phase’s environmental impacts, use phase of shunt reactors for 2.95%, use phase of circuit breakers for 0.43%, and use phase of all conductors in substations for 0.214%. By the way, it’s observed from Fig. 10 that environmental impacts of transmission lines are much bigger than that of substations, for example, Global Warming Potential of transmission lines is 3.2 times of substations’, Ozone Depletion Potential is 7 times, Acidification Potential is 4.1 times, etc.

11
Fig. 10 : Comparison of environmental impacts between
transmission lines and substations
5 CONCLUSIONS
In this paper a Life Cycle Assessment is conducted on a 765 kV AC transmission system, the functional unit of this LCA is to transmit 8000 MW hydro-electrical power to 760 km, during its service life of 60 years, and the average load factor is 60%. In the LCA on transmission lines, the considered components include bundle conductors, ground wires, insulators, towers and foundations. In the LCA on substations, only the primary system is included, the so-called “secondary systems” - such as low voltage (lower than 1 kV) cables, lighting system, controlling systems (computers, electronic devices, IT, etc) - are not integrated. Thus the considered components include the access roads, gravels in substations, and the major equipments such as power transformers, circuit breakers, current transformers, voltage transformers, shunt reactors, etc, and their supporting frames, foundations. Regarding the life cycle, materials production phase is defined as the production of all the necessary raw materials contained in the considered components listed hereinabove, however the manufacturing processes are not included. The use phase is defined as energy losses in conductors for transmission lines, energy losses of major equipments and SF6 emissions for substations, during the service life of 60 years of this transmission system. End-of-life phase contains the relevant waste treatment scenarios, such as recycling of metal materials, mineral oil, SF6, landfill of porcelain and incineration, etc. The LCIA results of the total transmission system indicate that use phase gives the most environmental impacts on most of indicators, e.g. regarding Global Warming Potential the use phase accounts for 55.9%, regarding Ozone Depletion Potential it accounts for 75.8%, regarding Acidification it determines 41.7%, etc. While use phase of total transmission system is composed by SF6 emissions of circuit breakers, energy losses in substations and energy losses in transmission lines, which one is the most source of environmental impact? After investigation it’s revealed that the energy losses in transmission lines is the dominating environmental impacts in use phase, which is roughly 10 times of that of energy losses in substations, and 3.5 times of that of circuit breakers’ SF6
emissions’ Global Warming impact. Results indicate that environmental impacts of transmission lines are much bigger than substations’, e.g. Global Warming Potential of transmission lines is 3.3 times of substations’, Ozone Depletion Potential is 7 times, Acidification Potential is 4.1 times, etc. Amongst the life cycle stages of transmission lines, the energy losses of conductors are largest part of environmental impacts of the transmission lines. As to the environmental impacts of substations, the use phase is also the key
12
impacts, which include SF6 emissions of circuit breakers and energy losses of different equipments. The circuit breakers’ SF6 emissions have most impacts on Global Warming in substations (73.9% of total use phase in substations). Energy losses of power transformers are the most environmental burdens source impacts (61.9% of use phase of substations revealed by single score result), then the energy losses of shunt reactors (30.6% of use phase of substations revealed by single score result). Through the LCA, it’s known that energy losses in transmission lines and power transformers and SF6 emissions of circuit breakers are the major sources of environmental impacts, of course, the materials production can not be ignored. This leads to the points to the eco-design of a transmission system, that is to say, if we are going to think of ways to decrease transmission system’s environmental impacts, focus should be put on the methods of reducing energy losses of conductors of transmission lines and power transformers and decreasing the SF6 emissions of circuit breakers. Besides, ways of minimizing materials used in equipments are also beneficial to the reduction of environment load.
6 REFERENCES
[1] K. Lee, A. P. Park, ECODESIGN: Best Practice of ISO/TR 14062, Eco-product Research Institute (ERI), Korea, Ajou University, 2005. [2] W. Wang, N. Li, A. Béroual, et al., Implementation of an Eco-design Methodology within AREVA T&D, CIGRE International Symposium on Operation and Development of Power Systems in the New Context, Guilin City, Guangxi Province, China, 28-30 Oct, 2009, Paper No. 185, p. 3. [3] SimaPro 7.0 software, PRé Consultants 2006, Netherlands. [4] Gabi 4 software, PE GmbH,Germany. [5] ISO 14040:2006 Environmental Management - Life Cycle Assessment - Principles and Framework. [6] SimaPro 7 Database Manuals, PRé Consultants, Netherlands, 2006, p. 31-32.
7 AUTHORS
Mr. Wenlu WANG was born in 1981 in Xi’an, China. He obtained PhD degree on electrical engineering in doctoral school EEA (Electronic, Electrotechnique, Automation) at “Ecole Centrale de Lyon” in France, in 2011. From 2008 to 2011, he worked as a researching engineer on eco-design (ecological design) of electrical power transmission systems in Alstom Grid.
Abderrahmane Beroual (IEEE fellow 2011) is currently Professor at the Ecole Centrale de Lyon, France. Presently, he is the head of the Dielectric Materials and High Voltage Group at AMPERE Lab - CNRS as well as Responsible of the Master Research Program in electrical engineering. From 1994 to 1998, he chaired the International Study Group on Streamer Propagation in Liquids of the IEEE – DEIS. He is member of many Advisory Committees of International
Conferences (ICDL, ISH, APTADM, Gas Discharge, ICHVE, CMD, INSUCON, NIWE, iREED, Technical Committee of the IEEE CEIDP, UF10 Technical Commission – MT30 of IEC) and responsible of various research projects. His main research interests include high voltage insulation, dielectric materials, long air gaps discharge and lightning, outdoor insulation, modelling of discharges and composite materials. He supervised more than 40

13
PhD. students. He is author/co-author of more than 330 technical papers including more than 130 refereed journal papers, 4 patents and 5 book chapters
Mr. Gilles Trémouille was born in Sens (Bourgogne), France, on August 12, 1968. He graduated from E.S.T. P (Ecole Speciale des Travaux Public du Batiment et de l'industrie ) Paris, in 1992 as Mechanical Engineering & Power Systems.- Since November 1999, this school is associated with another, state-owned, French " Grande Ecole ", Ecole Nationale Supérieure d'Arts et Métiers
(ENSAM). Gilles start is activity EDF DER (research) in the OHL test centre of EDF (Electricité de France). He joint ALSTOM Grid in 1995 (formerly CEGELEC, AREVA T&D). He is a Member of the IEEE. He integrated the Cigre working group C4 (System Technical Performance) & B3 (Substations). .
Mr. Tarek Mehiri was born in Tunis, Tunisia, on December 31, 1977. He is graduated from E.N. I. M. (Ecole Nationale d'Ingénieurs de Metz ) Metz, in 2002 as Electromechanical Engineer- Tarek started his activity at ALSTOM Grid in 2004 (formerly AREVA T&D).