21 October 2014 - ASX · 2014. 10. 20. · September 2014 Quarterly Presentation16 Corporate...
23
ASX Release / 21 October 2014 Investor Relations Mr Rowan Cole Company Secretary +61 3 8660 1900 Media Relations Ms Nerida Mossop Hinton & Associates +61 3 9600 1979 St Barbara Limited Level 10, 432 St Kilda Road, Melbourne VIC 3004 T +61 3 8660 1900 F +61 3 8660 1999 ACN 009 165 066 Locked Bag 9, Collins Street East, Melbourne VIC 8003 W www.stbarbara.com.au Presentation on the September 2014 Quarterly Report and audio webcast Bob Vassie, Managing Director & CEO, will brief analysts and institutional investors on the September 2014 Quarterly Report at 1:00 pm Australian Eastern Standard Time (UTC + 11 hours) today, 21 October 2014. Participation on the conference call is by personal invitation only. A live audio webcast of the briefing will be available on St Barbara’s website at www.stbarbara.com.au/investors/webcast/ or by clicking here. The audio webcast is ‘listen only’ and does not enable questions. The audio webcast will subsequently be made available on the website. For personal use only
Transcript of 21 October 2014 - ASX · 2014. 10. 20. · September 2014 Quarterly Presentation16 Corporate...

ASX Release / 21 October 2014
Investor Relations Mr Rowan Cole Company Secretary +61 3 8660 1900
Media Relations Ms Nerida Mossop Hinton & Associates +61 3 9600 1979
St Barbara Limited Level 10, 432 St Kilda Road, Melbourne VIC 3004 T +61 3 8660 1900 F +61 3 8660 1999 ACN 009 165 066 Locked Bag 9, Collins Street East, Melbourne VIC 8003 W www.stbarbara.com.au
Presentation on the September 2014 Quarterly Report and audio webcast
Bob Vassie, Managing Director & CEO, will brief analysts and institutional investors on the September 2014 Quarterly Report at 1:00 pm Australian Eastern Standard Time (UTC + 11 hours) today, 21 October 2014. Participation on the conference call is by personal invitation only. A live audio webcast of the briefing will be available on St Barbara’s website at www.stbarbara.com.au/investors/webcast/ or by clicking here. The audio webcast is ‘listen only’ and does not enable questions. The audio webcast will subsequently be made available on the website.
For
per
sona
l use
onl
y

September 2014 Quarterly Presentation
BOB VASSIE, MANAGING DIRECTOR & CEO / 21 October 2014
For
per
sona
l use
onl
y

September 2014 Quarterly Presentation 2 /
Disclaimer
This presentation has been prepared by St Barbara Limited (“Company”). The material contained in this presentation is for information purposes only. This presentation is not an offer or invitation for subscription or purchase of, or a recommendation in relation to, securities in the Company and neither this presentation nor anything contained in it shall form the basis of any contract or commitment.
This presentation may contain forward-looking statements that are subject to risk factors associated with exploring for, developing, mining, processing and sale of gold. Forward-looking statements include those containing such words as anticipate, estimates, forecasts, should, will, expects, plans or similar expressions. Such forward-looking statements are not guarantees of future performance and involve known and unknown risks, uncertainties, assumptions and other important factors, many of which are beyond the control of the Company, and which could cause actual results or trends to differ materially from those expressed in this presentation. Actual results may vary from the information in this presentation. The Company does not make, and this presentation should not be relied upon as, any representation or warranty as to the accuracy, or reasonableness, of such statements or assumptions. Investors are cautioned not to place undue reliance on such statements.
This presentation has been prepared by the Company based on information available to it, including information from third parties, and has not been independently verified. No representation or warranty, express or implied, is made as to the fairness, accuracy or completeness of the information or opinions contained in this presentation.
The Company estimates its reserves and resources in accordance with the Australasian Code for Reporting of Identified Mineral Resources and Ore Reserves 2012 Edition (“JORC Code”), which governs such disclosures by companies listed on the Australian Securities Exchange.
Financial figures are in Australian dollars unless otherwise noted. Financial year is 1 July to 30 June.
For
per
sona
l use
onl
y

September 2014 Quarterly Presentation
Contents
˃ Key Points
˃ Safety
˃ Operations Results
˃ Exploration
˃ Finance
˃ Corporate
˃ Conclusion
˃ Appendices
3 /
For
per
sona
l use
onl
y

September 2014 Quarterly Presentation
Key Points Q1 September 2014
˃ Leonora September mill maintenance shutdown successful and production resumed on schedule
˃ Operational performance at Simberi improving
˃ FY15 Guidance maintained for Leonora and provided for Simberi
˃ At 30 September 2014 cash at bank was A$56 million1, total debt was A$367 million
˃ Safety: TRIFR2 of 4.9 at 30 September 2014
4 /
1. Unaudited, inc. $2 million restricted cash 2. Total Recordable Injury Frequency Rate (12 month avg)
For
per
sona
l use
onl
y

September 2014 Quarterly Presentation
Start safe, stay safe
Safety performance
˃ TRIFR1 of 4.9 at 30 Sep 2014
˃ Despite increase is still a strong result for mixed jurisdiction underground / open pit combination
˃ TRIFR includes Pacific Operations from September 2012
Total Recordable Injury Frequency Rate
14.8
11.1
12.5
9.0
6.0
4.1 4.9
FY 09 FY 10 FY 11 FY 12 FY 13 FY14 Q1FY15
5 / 1. Total Recordable Injury Frequency Rate (12 month avg)
For
per
sona
l use
onl
y

September 2014 Quarterly Presentation
˃ September Quarter:
˃ Production at Gwalia and King of the Hills less than previous quarter because of 2 week mill maintenance shutdown
˃ Simberi improved within the quarter
˃ Gold Ridge suspended
˃ Q1 consolidated All-In Sustaining Cost1 A$1,344 per ounce
˃ Q1 realised gold price A$1,388 per ounce
53 53 49 59
45
17 17 17
19
11
12 9 11
13
13
15 15 16
92
FY 14Q1 Sep
FY 14Q2 Dec
FY 14Q3 Mar
FY 14Q4 Jun
FY 15Q1 Sep
Gwalia King of the Hills Simberi Gold Ridge
97 94
koz
93
69
Figures displayed to nearest koz. Reported ounces in Quarterly Report.
6 /
Consolidated Gold Production
1. Non IFRS measure, refer slide 22
For
per
sona
l use
onl
y

September 2014 Quarterly Presentation
Gwalia: St Barbara’s cornerstone mine
˃ Production result impacted by 2 week mill maintenance shutdown
˃ Mined volume consistent with previous quarter, grade 7.9 g/t Au
˃ Estimated 6,500 oz contained in stockpiled ore at end of quarter
˃ All-In Sustaining Cost1 for quarter was A$1,086 per ounce
˃ November – December 2014 near mine resource extension deep drilling planned
˃ FY15 guidance maintained
Gold Production
53.2 52.6 49.1
59.4
45.4
FY 14Q1 Sep
FY 14Q2 Dec
FY 14Q3 Mar
FY 14Q4 Jun
FY 15Q4 Sep
koz
7 / 1. Non IFRS measure, refer slide 22
For
per
sona
l use
onl
y

September 2014 Quarterly Presentation 8 /
Future Gwalia – Drilling Plan (Cross Section View)
2,200mbs
1,800mbs
Target
Surface
Potential shaft location
New parent hole - GWDD16
West East
For
per
sona
l use
onl
y

September 2014 Quarterly Presentation 9 /
Future Gwalia – Drilling Plan (Long Section View)
Potential shaft location
New parent hole - GWDD16
Target (2,000mbs)
2,200mbs
1,800mbs
1,550mbs
Target Zone
For
per
sona
l use
onl
y

September 2014 Quarterly Presentation
King of the Hills: Delivering to plan
˃ Lower production due to 2 week mill maintenance shutdown and higher grade Gwalia ore prioritised
˃ Ore mined consistent with previous quarters
˃ Estimated 5,000 oz contained in stockpiled ore at end of quarter
˃ FY 15 Guidance maintained
Gold Production
17.2 17.2 16.8
19.4
10.8
FY 14Q1 Sep
FY 14Q2 Dec
FY 14Q3 Mar
FY 14Q4 Jun
FY 15Q4 Sep
koz
10 /
For
per
sona
l use
onl
y
September 2014 Quarterly Presentation
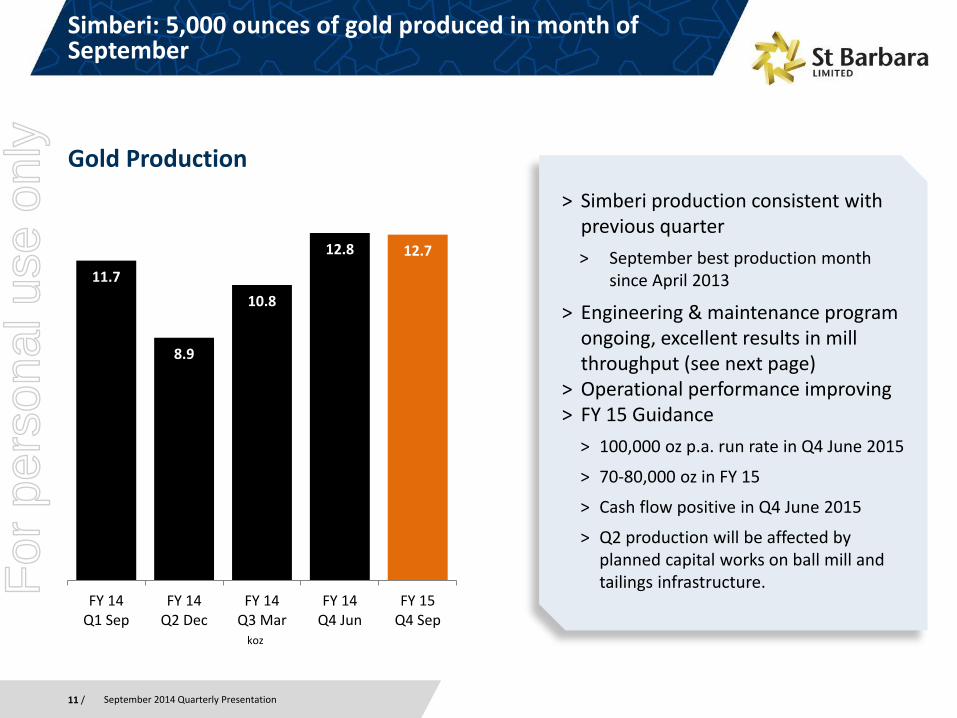
Simberi: 5,000 ounces of gold produced in month of September
˃ Simberi production consistent with previous quarter
˃ September best production month since April 2013
˃ Engineering & maintenance program ongoing, excellent results in mill throughput (see next page)
˃ Operational performance improving ˃ FY 15 Guidance
˃ 100,000 oz p.a. run rate in Q4 June 2015
˃ 70-80,000 oz in FY 15
˃ Cash flow positive in Q4 June 2015
˃ Q2 production will be affected by planned capital works on ball mill and tailings infrastructure.
Gold Production
11.7
8.9
10.8
12.8 12.7
FY 14Q1 Sep
FY 14Q2 Dec
FY 14Q3 Mar
FY 14Q4 Jun
FY 15Q4 Sep
koz
11 /
For
per
sona
l use
onl
y

September 2014 Quarterly Presentation
368
463
536
FY14Q3 Mar
FY14Q4 Jun
FY15Q1 Sep
kt
Gold production in Q1
Simberi: Continued improvement in ore milled
2.7
4.9 5.0
Jul 14 Aug 14 Sep 14
koz
Ore milled last 3 quarters
12 /
For
per
sona
l use
onl
y

September 2014 Quarterly Presentation
Gold Ridge – Operations suspended
˃ Gold Ridge Operations (Solomon Islands) remain suspended while force majeure conditions continue
˃ Workforce and costs have been significantly reduced to suit current scale of activities
˃ Escalating security situation led to a withdrawal from site on 13 August. Significant subsequent theft and vandalism
˃ The Solomon Islands Government has appointed advisors to assist it in negotiations to transfer Gold Ridge to the Government
˃ No significant progress in negotiations
˃ No satisfactory progress in critical short term remedial actions at the tailings storage facility
13 /
For
per
sona
l use
onl
y

September 2014 Quarterly Presentation
Exploration – focus on near mine targets at Simberi
Figure 1.0
14 / 1. For full explanation and results refer to ASX release 21 October 2014
‘Quarterly Report September 2014’
˃ Encouraging trench results obtained from a number of near mine locations on Simberi Island. Including:
˃ Monun Creek:
˃ SIMTR777: 35m @ 1.1 g/t Au
˃ SIMTR780: 20m @ 1.5 g/t Au
˃ Botlu North:
˃ SIMTR787: 20m @ 3.0 g/t Au, including 5m @ 7.9 g/t Au
˃ SIMTR804: 20m @ 2.1 g/t Au, including 5m @ 6.1 g/t Au F
or p
erso
nal u
se o
nly

September 2014 Quarterly Presentation
Finance - At 30 September 2014
˃ A$56 million cash (inc. $2 million restricted cash) 1
Decrease since June quarter primarily due to funding of Pacific Operations, working capital movements2 and the two week mill maintenance shutdown at Leonora
˃ A$367 million interest bearing liabilities1
Increase since June quarter due to AUD vs USD decline
˃ Gold forward contracts:
153,000 ounces to be delivered between October 2014 and June 2015 at A$1,415/oz
15 /
1. Unaudited 2. The negative working capital movement included gold receivables at the end
of September 2014 of A$2 million, payment of Gold Ridge creditors at June 2014 of approximately A$2 million and a net decrease in other creditors.
For
per
sona
l use
onl
y

September 2014 Quarterly Presentation
Corporate
Organisational review is ongoing
During the quarter:
Brisbane office was closed
Staff numbers in Perth and Melbourne Offices further reduced
Reduction in exploration staff in the Pacific
˃ Annual General Meeting
11:00 am (Melbourne time) on 25 November 2014 at the Royce Hotel, 379 St Kilda Rd Melbourne.
A copy of the notice is available at www.stbarbara.com.au/investors/latest-news/
16 /
For
per
sona
l use
onl
y
September 2014 Quarterly Presentation
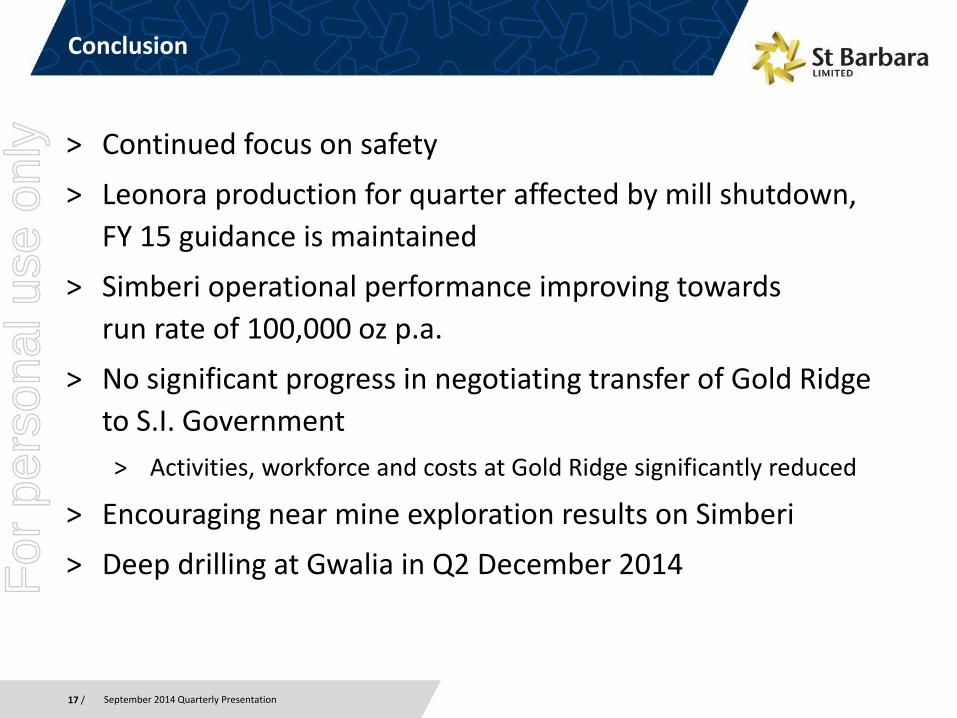
Conclusion
˃ Continued focus on safety
˃ Leonora production for quarter affected by mill shutdown,
FY 15 guidance is maintained
˃ Simberi operational performance improving towards
run rate of 100,000 oz p.a.
˃ No significant progress in negotiating transfer of Gold Ridge
to S.I. Government
˃ Activities, workforce and costs at Gold Ridge significantly reduced
˃ Encouraging near mine exploration results on Simberi
˃ Deep drilling at Gwalia in Q2 December 2014
17 /
For
per
sona
l use
onl
y

September 2014 Quarterly Presentation
Appendices
18 /
For
per
sona
l use
onl
y

September 2014 Quarterly Presentation
Consolidated Production Summary
Q1 Sep FY15
Guidance FY15
Pro
du
ctio
n Gwalia oz 45,391 180 - 200,000
King of the Hills oz 10,793 60 - 70,000
Simberi oz 12,639 70 - 80,000
Consolidated oz 68,823 310 - 350,000
Min
ed
G
rad
e Gwalia g/t 7.9
King of the Hills g/t 4.1
Simberi g/t 1.1
Tota
l Cas
h
Op
era
tin
g C
ost
1
,2
Gwalia A$/oz 767 720 -750
King of the Hills A$/oz 1,085 1,040 -1,090
Simberi A$/oz 2,032 1,200 -1,300
Consolidated A$/oz 1,048 890 - 940
19 /
1. Non IFRS measure, refer slide 22
2. Unaudited
For
per
sona
l use
onl
y

September 2014 Quarterly Presentation
Investor Relations Enquiries
Rowan Cole Company Secretary
Garth Campbell-Cowan Chief Financial Officer
T: +61 3 8660 1900 E: [email protected]
20 /
For
per
sona
l use
onl
y

September 2014 Quarterly Presentation
Competent Persons Statement
Exploration Results The information in this report that relates to Exploration Results is based on information compiled by Dr Roger Mustard, who is a Member of The Australasian Institute of Mining and Metallurgy. Dr Mustard is a full-time employee of St Barbara Ltd and has sufficient experience relevant to the style of mineralisation and type of deposit under consideration and to the activity which he is undertaking to qualify as a Competent Person as defined in the 2012 Edition of the ‘Australasian Code for Reporting of Exploration Results, Mineral Resources and Ore Reserves’. Dr Mustard consents to the inclusion in the report of the matters based on his information in the form and context in which it appears. Mineral Resource and Ore Reserve Estimates The information in this report that relates to Mineral Resources or Ore Reserves is extracted from the report titled ‘Ore Reserves and Mineral Resources Statements 30 June 2014’ released to the Australian Securities Exchange (ASX) on 27 August 2014 and available to view at www.stbarbara.com.au and for which Competent Person’s consents were obtained. The Competent Person’s consents remain in place for subsequent releases by the Company of the same information in the same form and context, until the consent is withdrawn or replaced by a subsequent report and accompanying consent. The Company confirms that it is not aware of any new information or data that materially affects the information included in the original ASX announcement released on 27 August 2014 and, in the case of estimates of Mineral Resources or Ore Reserves, that all material assumptions and technical parameters underpinning the estimates in the original ASX announcement continue to apply and have not materially changed. The Company confirms that the form and context in which the Competent Person's findings are presented have not been materially modified from the original ASX announcement. Competent Persons Dr Mustard and Mr de Vries are entitled to participate in St Barbara’s long term incentive plan, details of which are included in the 2014 Annual Report and Notice of 2014 Annual General Meeting released to the ASX on 17 October 2014. In 2012 and 2013 increase in Ore Reserves was one of the performance measures under that plan. Full details are contained in the ASX release dated 27 August 2014 ‘Ore Reserves and Mineral Resources Statements 30 June 2014’ available at www.stbarbara.com.au.
21 /
For
per
sona
l use
onl
y

September 2014 Quarterly Presentation 22 /
Non-IFRS Measures
We supplement our financial information reporting determined under International Financial Reporting Standards (IFRS) with certain non-IFRS financial measures, including cash operating costs. We believe that these measures provide meaningful information to assist management, investors and analysts in understanding our financial results and assessing our prospects for future performance.
Cash operating costs ˃ Calculated according to common mining industry practice using The Gold Institute (USA) Production Cost Standard (1999 revision).
All-In Sustaining Cost ˃ All-In Sustaining Cost is based on Cash Operating Costs, and adds items relevant to sustaining production. It includes some, but not all, of the components identified in World Gold Council’s Guidance Note on Non-GAAP Metrics - All-In Sustaining Costs and All-In Costs (June 2013).
˃ AISC is calculated on gold production in the quarter.
˃ For underground mines, amortisation of operating development is adjusted from “Total Cash Operating Costs” in order to avoid duplication with cash expended on operating development in the period contained within the “Mine & Operating Development” line item.
˃ Rehabilitation is calculated as the amortisation of the rehabilitation provision on a straight-line basis over the estimated life of mine.
For
per
sona
l use
onl
y