2.1 Forecast Overview - Virginia Update 2016/600... · the VATSP Update may not agree with...
74
Chapter 2 – Aviation Activity Forecasts 2. AVIATION ACTIVITY FORECASTS 2.1 Forecast Overview An essential step to updating Virginia’s Air Transportation System Plan (VATSP) is the development of aviation demand forecasts. These projections are used to assess the airport system’s sufficiency in terms of annual operational capacity, establish future airport facility requirements and provide insight into where changes in the system may be appropriate over the forecast period. It is important to set the context for projections developed as part of the VATSP Update. System plan forecasts are developed from the perspective of the overall system and are not individualized to take into account all of the unique factors that may influence activity levels at each airport. System plan projections attempt to remove double counting of activity that may occur if master plan forecasts for airports in the same or neighboring market areas are aggregated. In addition, the system plan and individual airport master plans occur at varying intervals and points in time. As a result, forecasts developed for Virginia airports as part of the VATSP Update may not agree with forecasts developed in individual airport master plans. For this update to the VATSP, activity forecasts were developed for the 66 study airports, which consist of 57 public-use general aviation airports and nine commercial service airports. Using 2012 as the base year, the following components of aviation demand were forecast for a 25-year planning period: • Based general aviation aircraft and fleet mix • Annual general aviation operations • Annual commercial passenger enplanements • Annual commercial aircraft operations The following sections describe historical trends in aviation activity at Virginia’s airports and present the forecasts of long-term aviation demand. It should be noted that airport sponsors participated in the development of forecasts presented in this chapter. Draft forecasts were distributed to all airport sponsors to provide them with an opportunity to review and comment on both the historical data and the forecasts. Information obtained through this review process was used to refine and finalize the aviation activity forecasts. 2.2 General Aviation Activity General aviation is defined as all aviation other than commercial airline and military aviation. General aviation activity in the Commonwealth consists of a diverse range of activities including pilot training, recreational flying, law enforcement, medical/patient transport, aerial spraying and business aviation. Forecasts of general aviation activity include forecasts of based general aviation aircraft, general aviation fleet mix, and aircraft operations. Virginia Air Transportation System Plan (VATSP) Update 20
Transcript of 2.1 Forecast Overview - Virginia Update 2016/600... · the VATSP Update may not agree with...

Chapter 2 – Aviation Activity Forecasts
2. AVIATION ACTIVITY FORECASTS
2.1 Forecast Overview
An essential step to updating Virginia’s Air Transportation System Plan (VATSP) is the development of aviation demand forecasts. These projections are used to assess the airport system’s sufficiency in terms of annual operational capacity, establish future airport facility requirements and provide insight into where changes in the system may be appropriate over the forecast period.
It is important to set the context for projections developed as part of the VATSP Update. System plan forecasts are developed from the perspective of the overall system and are not individualized to take into account all of the unique factors that may influence activity levels at each airport. System plan projections attempt to remove double counting of activity that may occur if master plan forecasts for airports in the same or neighboring market areas are aggregated. In addition, the system plan and individual airport master plans occur at varying intervals and points in time. As a result, forecasts developed for Virginia airports as part of the VATSP Update may not agree with forecasts developed in individual airport master plans.
For this update to the VATSP, activity forecasts were developed for the 66 study airports, which consist of 57 public-use general aviation airports and nine commercial service airports. Using 2012 as the base year, the following components of aviation demand were forecast for a 25-year planning period:
• Based general aviation aircraft and fleet mix • Annual general aviation operations • Annual commercial passenger enplanements • Annual commercial aircraft operations
The following sections describe historical trends in aviation activity at Virginia’s airports and present the forecasts of long-term aviation demand. It should be noted that airport sponsors participated in the development of forecasts presented in this chapter. Draft forecasts were distributed to all airport sponsors to provide them with an opportunity to review and comment on both the historical data and the forecasts. Information obtained through this review process was used to refine and finalize the aviation activity forecasts.
2.2 General Aviation Activity
General aviation is defined as all aviation other than commercial airline and military aviation. General aviation activity in the Commonwealth consists of a diverse range of activities including pilot training, recreational flying, law enforcement, medical/patient transport, aerial spraying and business aviation. Forecasts of general aviation activity include forecasts of based general aviation aircraft, general aviation fleet mix, and aircraft operations.
Virginia Air Transportation System Plan (VATSP) Update 20
Chapter 2 – Aviation Activity Forecasts
2.2.1 Based General Aviation Aircraft Forecast
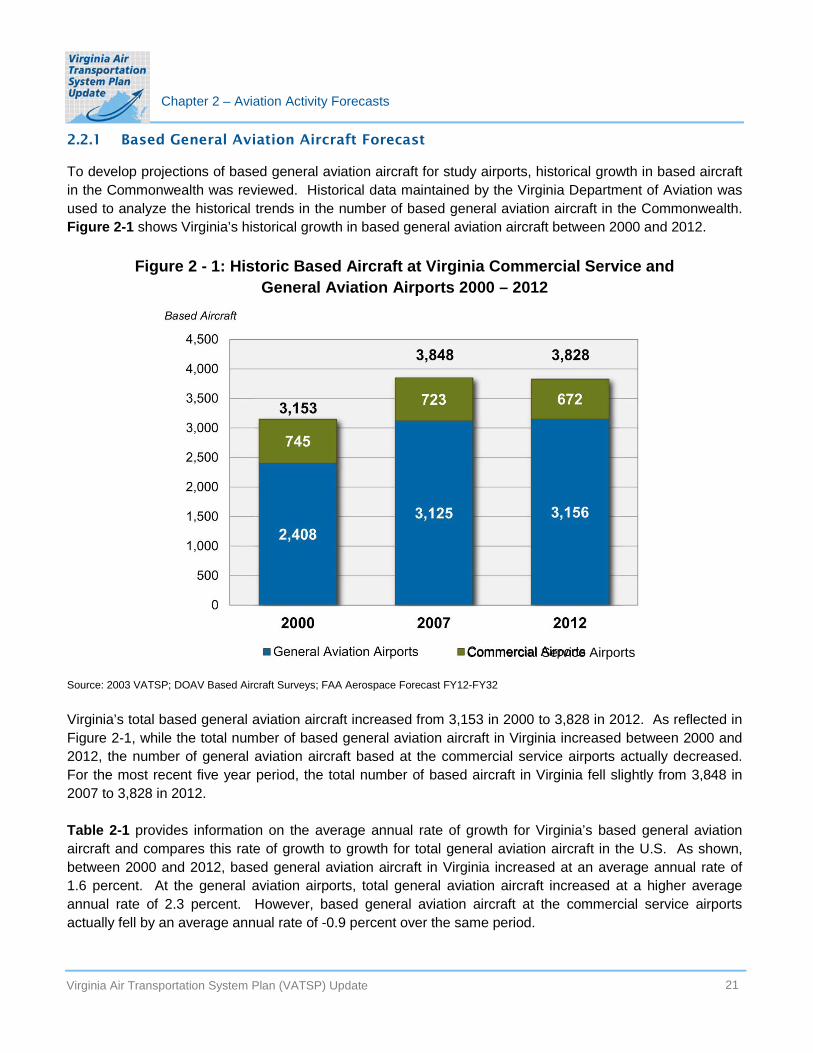
To develop projections of based general aviation aircraft for study airports, historical growth in based aircraft in the Commonwealth was reviewed. Historical data maintained by the Virginia Department of Aviation was used to analyze the historical trends in the number of based general aviation aircraft in the Commonwealth. Figure 2-1 shows Virginia’s historical growth in based general aviation aircraft between 2000 and 2012.
Figure 2 - 1: Historic Based Aircraft at Virginia Commercial Service and General Aviation Airports 2000 – 2012
Commercial Service Airports
Source: 2003 VATSP; DOAV Based Aircraft Surveys; FAA Aerospace Forecast FY12-FY32
Virginia’s total based general aviation aircraft increased from 3,153 in 2000 to 3,828 in 2012. As reflected in Figure 2-1, while the total number of based general aviation aircraft in Virginia increased between 2000 and 2012, the number of general aviation aircraft based at the commercial service airports actually decreased. For the most recent five year period, the total number of based aircraft in Virginia fell slightly from 3,848 in 2007 to 3,828 in 2012.
Table 2-1 provides information on the average annual rate of growth for Virginia’s based general aviation aircraft and compares this rate of growth to growth for total general aviation aircraft in the U.S. As shown, between 2000 and 2012, based general aviation aircraft in Virginia increased at an average annual rate of 1.6 percent. At the general aviation airports, total general aviation aircraft increased at a higher average annual rate of 2.3 percent. However, based general aviation aircraft at the commercial service airports actually fell by an average annual rate of -0.9 percent over the same period.
Virginia Air Transportation System Plan (VATSP) Update 21

Chapter 2 – Aviation Activity Forecasts
Table 2 - 1: Historic Average Annual Growth Rates for Based General Aviation Aircraft in Virginia
Airports Average Annual Growth of Total Based Aircraft 2000-2007 2007-2012 2000-2012
Virginia Commercial Service Airports Virginia General Aviation Airports All Virginia Airports All U.S. Airports
-0.4% -1.5% -0.9% 3.8% 0.2% 2.3% 2.9% -0.1% 1.6% 0.9% -0.8% 0.2%
Table 2-1 also shows that rate of growth for based general aviation aircraft in Virginia outpaced growth for general aviation aircraft in the U.S. Between 2000 and 2012, total general aviation aircraft in the U.S. increased at an average annual rate of 0.2 percent compared to 1.6 percent in Virginia. While Virginia’s based general aviation aircraft grew over the long-term historical period, the more recent trend shows a decline. As presented in Table 2-1, between 2007 and 2012, based aircraft in Virginia decreased at an average annual rate of -0.1 percent, while general aviation aircraft in the U.S. decreased at an annual rate of -0.8 percent. While both the U.S. and Virginia experienced declines in based aircraft between 2007 and 2012, the rate of decrease was slower in Virginia than in the U.S.
Information shown in both Figure 2-1 and Table 2-1 was used to help set a context for the development of future levels of based general aviation aircraft in Virginia.
To develop forecasts of based general aviation aircraft, four different methodologies were tested. Ultimately, a single methodology was used to forecast based aircraft for all study airports. The four methodologies considered are discussed briefly below:
• Linear Trend – This methodology is based on the historical growth in based aircraft in terms of the number of aircraft added per year. This methodology is considered a bottom up approach. The actual growth in based general aviation aircraft at each airport for the long-term growth between 2000-2012 was averaged with the 2007-2012 short-term growth rate. Once this average rate of growth was established for individual airports, based aircraft at each airport were projected to grow at this average rate through 2037. For this methodology, some limits to both increases and decreases in based aircraft at specific study airports were set.
• Average Annual Growth Rate Trend – This methodology considered historic based aircraft growth in terms of actual average annual growth rates. This methodology is considered a bottom up approach. Similar to the linear trend methodology, long term (2000-2012) and short term (20072012) growth rates at each airport were averaged. Using this methodology, based aircraft at individual airports were forecast to grow at the average annual rate through 2037. For this methodology, some limits were also set to both increases and decreases in based aircraft at specific study airports.
Virginia Air Transportation System Plan (VATSP) Update 22

Chapter 2 – Aviation Activity Forecasts
• Market Share–The market share methodology is a top down forecasting approach. This methodology considers Virginia’s market share of total U.S. general aviation aircraft, as well as each study airport’s share of Virginia’s total based general aviation aircraft. In this methodology, the trend in Virginia’s share of total U.S. general aviation aircraft is projected forward. Changes in 2000 and 2007 market shares for individual study airports, as they related to total based aircraft in Virginia, were averaged and projected forward. Manual adjustments to the results were made as needed.
• Group Growth Rate – For this methodology, airports were grouped into five categories. Category assignments were based on each airport’s historical growth in based aircraft, forecast population growth for the airport’s market area, and forecast growth in income for the market area. Once assigned to a category, forecast growth rates for based aircraft were developed for each category. This methodology resulted in a based aircraft forecast for each individual airport, as well as for Virginia as a whole.
The objective in testing these various methodologies was to identify a forecast approach that provides the most viable results for all study airports. After reviewing the results of the various methodologies, the linear trend methodology was selected as the preferred methodology for forecasting based general aviation aircraft. This methodology was selected in part as a result of its conservative approach to projecting future based general aviation aircraft in Virginia.
Figure 2-2 compares the statewide results of the four methodologies. As shown in Figure 2-2, three of the four methodologies produced similar results for future based aircraft in Virginia. Only the group growth rate methodology produced a noticeably higher result. The preferred methodology (linear trend) resulted in an average annual growth rate of 1.2 percent.
After the linear trend methodology was selected to develop based aircraft forecasts for each of the Virginia airports, the individual airport forecasts were reviewed by airport sponsors, the DOAV and the FAA. Based on the review process adjustments were made in cases where historical trends were influenced by singular events and did not represent sustainable long-term growth rates. After the adjustments were made, the preferred methodology results in a total based aircraft forecast growth of 1.0 percent per year.
Figure 2-3 compares the VATSP forecast growth rate for based aircraft to the FAA’s projections of based aircraft for Virginia and the U.S.
Virginia Air Transportation System Plan (VATSP) Update 23

Chapter 2 – Aviation Activity Forecasts
Figure 2 - 2: Comparison of Results for Based Aircraft Forecast Methodologies
Source: ICF SH&E
Figure 2 - 3: Comparison of Forecast Average Annual Growth for Based Aircraft
Source: ICF SH&E; FAA Aerospace Forecast FY12-FY32; FAA TAF FY12-FY40 *Forecast is 2012-2032
Virginia Air Transportation System Plan (VATSP) Update 24

Chapter 2 – Aviation Activity Forecasts
Figure 2-3 compares projected average annual rates of growth for based aircraft projections. As shown in this figure, the VATSP Update selected projection shows based aircraft in Virginia increasing at an average annual rate of 1.0 percent. FAA in its 2013 National Aerospace Forecasts projects total general aviation aircraft in the U.S. to increase at an average annual rate of just over 0.6 percent. Not all study airports in the VATSP are included in FAA’s Terminal Area Forecast (TAF); for those that are, the FAA forecasts an average annual rate of growth slightly below 0.7 percent for general aviation aircraft based at these airports.
As shown in Figure 2-3, the average annual rate of growth for based general aviation aircraft in Virginia historically has outpaced the FAA’s forecast growth for all general aviation aircraft in the U.S. and the FAA’s rate of growth for Virginia airports included in FAA’s TAF. This comparison of historical average annual rates of growth helps to support the somewhat higher rate of average annual growth that has been selected for use in the VATSP Update.
Figure 2-4 reflects Virginia’s statewide projection of general aviation aircraft. As shown in this figure, statewide based aircraft are expected to increase from their current level of 3,828 to 4,946 by 2037. As noted, the implied average annual rate of growth in this projection is 1.0 percent. Figure 2-4 also shows the number of based general aviation aircraft that are expected at commercial and general aviation airports. For the selected based aircraft projection, Table 2-2 compares the average annual rate of growth for general aviation aircraft expected to be based at both commercial and general aviation airports in Virginia. These growth rates are compared to the projected rate of growth for all based aircraft in Virginia and to the projected average annual rate of growth for all general aviation aircraft in the U.S., as obtained from the FAA’s 2013 National Aerospace Forecast.
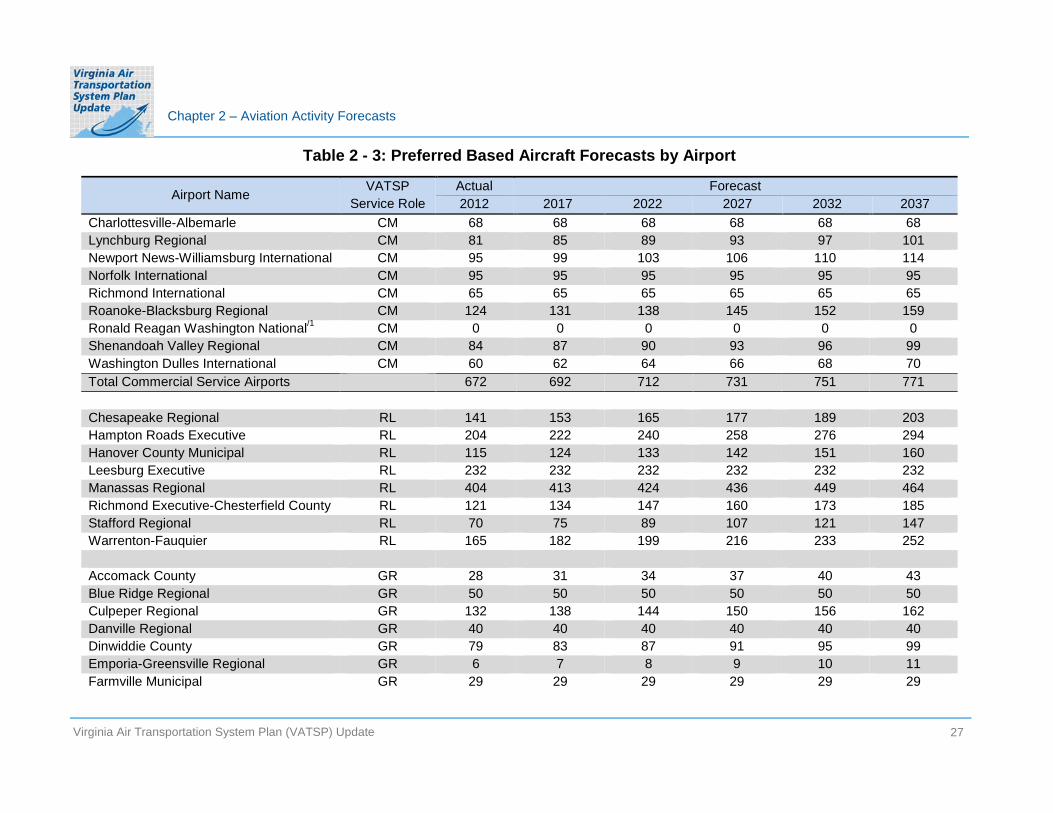
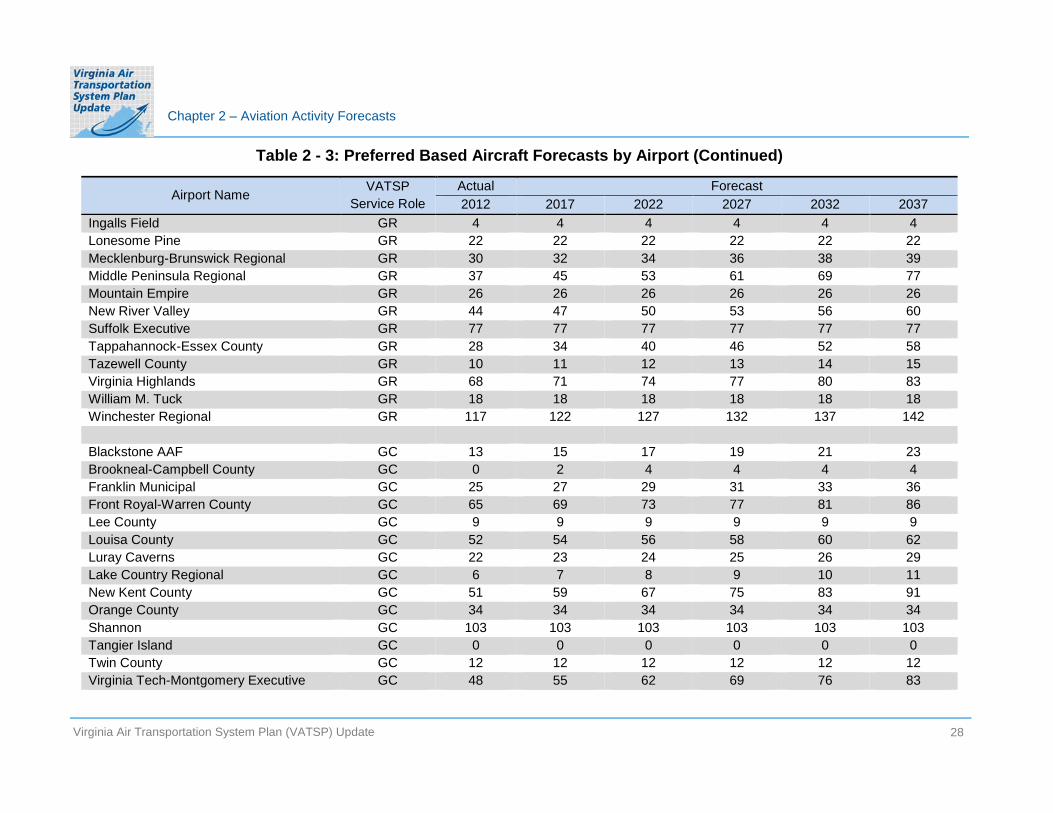
Using the preferred methodology, Table 2-3 presents a projection of based general aviation aircraft for each of the study airports. This table also shows each airport’s historical based aircraft for 2000, 2007 and 2012 which provides a context for each airport’s individual projection of based general aviation aircraft.
Virginia Air Transportation System Plan (VATSP) Update 25

Chapter 2 – Aviation Activity Forecasts
Figure 2 - 4: Forecast of Based Aircraft at Virginia Commercial Service and General Aviation Airports
Source: ICF SH&E; FAA Aerospace Forecast FY12-FY32
Table 2 - 2: Comparison of Forecast Growth for Based Aircraft in Virginia and the U.S.
Airports Forecast Average Annual Growth of
Total Based Aircraft 2012-2022 2022-2037 2012-2037
Virginia Commercial Service Airports Virginia General Aviation Airports All Virginia Airports All U.S. Airports
0.6% 0.5% 0.6% 1.2% 1.1% 1.1% 1.1% 1.0% 1.0% 0.4% 0.9%* 0.6%*
Source: ICF SH&E; FAA Aerospace Forecast FY12-FY32 *Total U.S.: Forecast is only through 2032 (column 3: ’22-’32 / column 4: ‘12-’32)
Virginia Air Transportation System Plan (VATSP) Update 26
Chapter 2 – Aviation Activity Forecasts
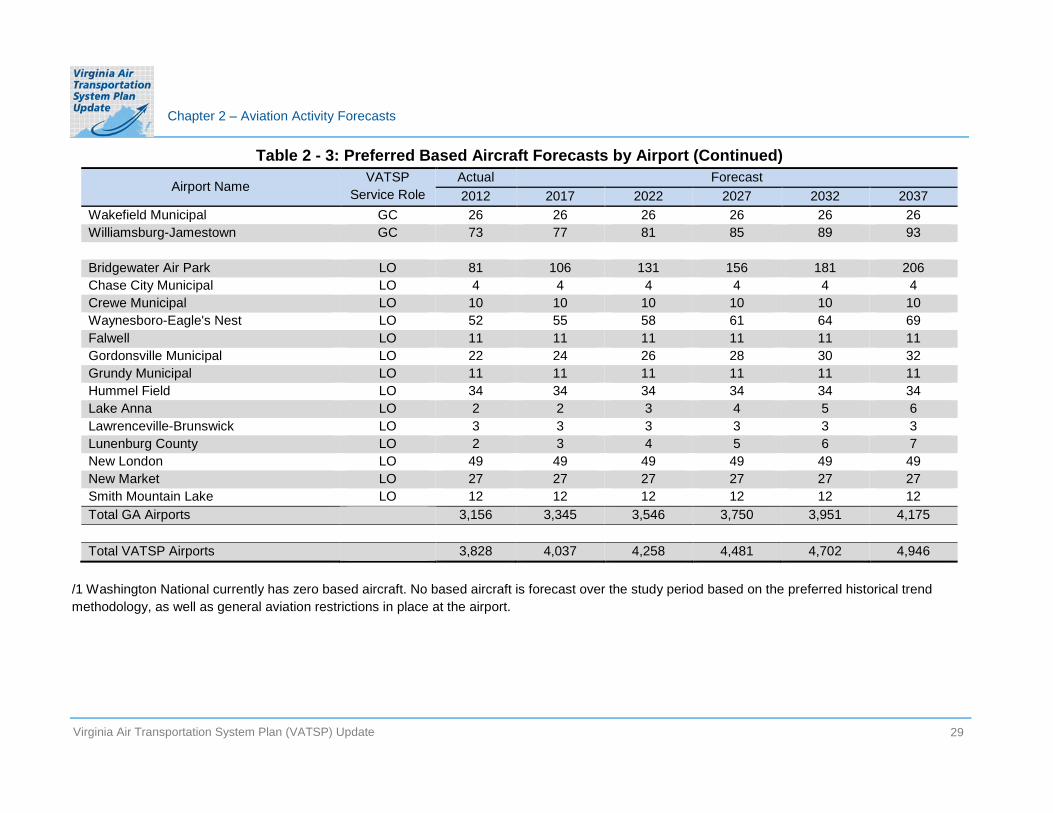
Table 2 - 3: Preferred Based Aircraft Forecasts by Airport
Airport Name VATSP Service Role
Actual 2012 2017 2022
Forecast 2027 2032 2037
Charlottesville-Albemarle CM 68 68 68 68 68 68 Lynchburg Regional CM 81 85 89 93 97 101 Newport News-Williamsburg International CM 95 99 103 106 110 114 Norfolk International CM 95 95 95 95 95 95 Richmond International CM 65 65 65 65 65 65 Roanoke-Blacksburg Regional CM 124 131 138 145 152 159 Ronald Reagan Washington National/1 CM 0 0 0 0 0 0 Shenandoah Valley Regional CM 84 87 90 93 96 99 Washington Dulles International CM 60 62 64 66 68 70 Total Commercial Service Airports 672 692 712 731 751 771
Chesapeake Regional RL 141 153 165 177 189 203 Hampton Roads Executive RL 204 222 240 258 276 294 Hanover County Municipal RL 115 124 133 142 151 160 Leesburg Executive RL 232 232 232 232 232 232 Manassas Regional RL 404 413 424 436 449 464 Richmond Executive-Chesterfield County RL 121 134 147 160 173 185 Stafford Regional RL 70 75 89 107 121 147 Warrenton-Fauquier RL 165 182 199 216 233 252
Accomack County GR 28 31 34 37 40 43 Blue Ridge Regional GR 50 50 50 50 50 50 Culpeper Regional GR 132 138 144 150 156 162 Danville Regional GR 40 40 40 40 40 40 Dinwiddie County GR 79 83 87 91 95 99 Emporia-Greensville Regional GR 6 7 8 9 10 11 Farmville Municipal GR 29 29 29 29 29 29
Virginia Air Transportation System Plan (VATSP) Update 27
Chapter 2 – Aviation Activity Forecasts
Table 2 - 3: Preferred Based Aircraft Forecasts by Airport (Continued)
Airport Name VATSP Service Role
Ingalls Field GR Lonesome Pine GR Mecklenburg-Brunswick Regional GR Middle Peninsula Regional GR Mountain Empire GR New River Valley GR Suffolk Executive GR Tappahannock-Essex County GR Tazewell County GR Virginia Highlands GR William M. Tuck GR Winchester Regional GR
Actual 2012
4 22 30 37 26 44 77 28 10 68 18 117
2017 4 22 32 45 26 47 77 34 11 71 18 122
2022 4
22 34 53 26 50 77 40 12 74 18 127
Forecast 2027
4 22 36 61 26 53 77 46 13 77 18 132
2032 4 22 38 69 26 56 77 52 14 80 18 137
2037 4 22 39 77 26 60 77 58 15 83 18 142
Blackstone AAF GC Brookneal-Campbell County GC Franklin Municipal GC Front Royal-Warren County GC Lee County GC Louisa County GC Luray Caverns GC Lake Country Regional GC New Kent County GC Orange County GC Shannon GC Tangier Island GC Twin County GC Virginia Tech-Montgomery Executive GC
13 0
25 65 9
52 22 6
51 34 103
0 12 48
15 2 27 69 9 54 23 7 59 34 103 0 12 55
17 4
29 73 9
56 24 8
67 34 103
0 12 62
19 4 31 77 9 58 25 9 75 34 103 0 12 69
21 4 33 81 9 60 26 10 83 34 103 0 12 76
23 4 36 86 9 62 29 11 91 34 103 0 12 83
Virginia Air Transportation System Plan (VATSP) Update 28
Chapter 2 – Aviation Activity Forecasts
Table 2 - 3: Preferred Based Aircraft Forecasts by Airport (Continued)
Airport Name VATSP
Service Role Actual 2012 2017 2022
Forecast 2027 2032 2037
Wakefield Municipal GC 26 26 26 26 26 26 Williamsburg-Jamestown GC 73 77 81 85 89 93
Bridgewater Air Park LO 81 106 131 156 181 206 Chase City Municipal LO 4 4 4 4 4 4 Crewe Municipal LO 10 10 10 10 10 10 Waynesboro-Eagle's Nest LO 52 55 58 61 64 69 Falwell LO 11 11 11 11 11 11 Gordonsville Municipal LO 22 24 26 28 30 32 Grundy Municipal LO 11 11 11 11 11 11 Hummel Field LO 34 34 34 34 34 34 Lake Anna LO 2 2 3 4 5 6 Lawrenceville-Brunswick LO 3 3 3 3 3 3 Lunenburg County LO 2 3 4 5 6 7 New London LO 49 49 49 49 49 49 New Market LO 27 27 27 27 27 27 Smith Mountain Lake LO 12 12 12 12 12 12 Total GA Airports 3,156 3,345 3,546 3,750 3,951 4,175
Total VATSP Airports 3,828 4,037 4,258 4,481 4,702 4,946
/1 Washington National currently has zero based aircraft. No based aircraft is forecast over the study period based on the preferred historical trend methodology, as well as general aviation restrictions in place at the airport.
Virginia Air Transportation System Plan (VATSP) Update 29

Chapter 2 – Aviation Activity Forecasts
2.2.2 Fleet Mix Forecast for Based General Aviation Aircraft
In addition to projecting total based general aviation aircraft, the VATSP also includes forecasts of the number of based aircraft by aircraft category or the “fleet mix”. Figure 2-5 summarizes the fleet mix for Virginia’s based general aviation aircraft in 2000 and 2012. As shown in Figure 2-5, the percentage of single and multi-engine piston aircraft in the Virginia fleet declined between 2000 and 2012. While the percentage of turboprop aircraft remained unchanged, and the percentage of jets and helicopter/other increased. Aircraft in the “other” category include experimental aircraft, gliders, ultra-light aircraft, and aircraft included in the sport aviation category.
Figure 2 - 5: Historical Virginia and Comparative U.S. General Aviation Fleet Mix
Source: DOAV Based Aircraft Surveys; FAA Aerospace Forecast FY12-FY32
30Virginia Air Transportation System Plan (VATSP) Update

Chapter 2 – Aviation Activity Forecasts
Figure 2-5 also provides the fleet mix for all general aviation aircraft in the U.S. for 2012. There are notable differences between the general aviation fleet mix for Virginia and the U.S. Single engine piston aircraft account for a much higher percentage of the Virginia fleet than the national fleet. Conversely, helicopters account for a lower share of the Virginia fleet compared to the U.S. fleet.
Figure 2-6 compares changes in the general aviation fleet for Virginia and the U.S. between 2000 and 2012. The general trends by aircraft category have been similar between Virginia and the U.S. but the comparative rates of increase or decrease have differed. One of the most notable differences between changes in the Virginia and the U.S. general aviation fleets is in the single engine piston aircraft category (SEP). For the U.S. as a whole, the number of single engine pistons aircraft declined at an average annual rate of -0.7 percent, while in Virginia single engine pistons aircraft grew by 1.5 percent per year over the same period. In both the Virginia and U.S. fleets, jet (MEJ) and turboprop (MET) aircraft have grown at robust rates between 3.1 and 4.6 percent per year. The rate of growth for helicopters (HEL) in Virginia also outpaced helicopter growth in the U.S. fleet.
Figure 2 - 6: Change in General Aviation Fleet by Aircraft Category for Virginia and the U.S. (2000 to 2012)
Source: 2003 VATSP; DOAV Based Aircraft Surveys; FAA Aerospace Forecast FY12-FY32
Virginia Air Transportation System Plan (VATSP) Update 31
Chapter 2 – Aviation Activity Forecasts
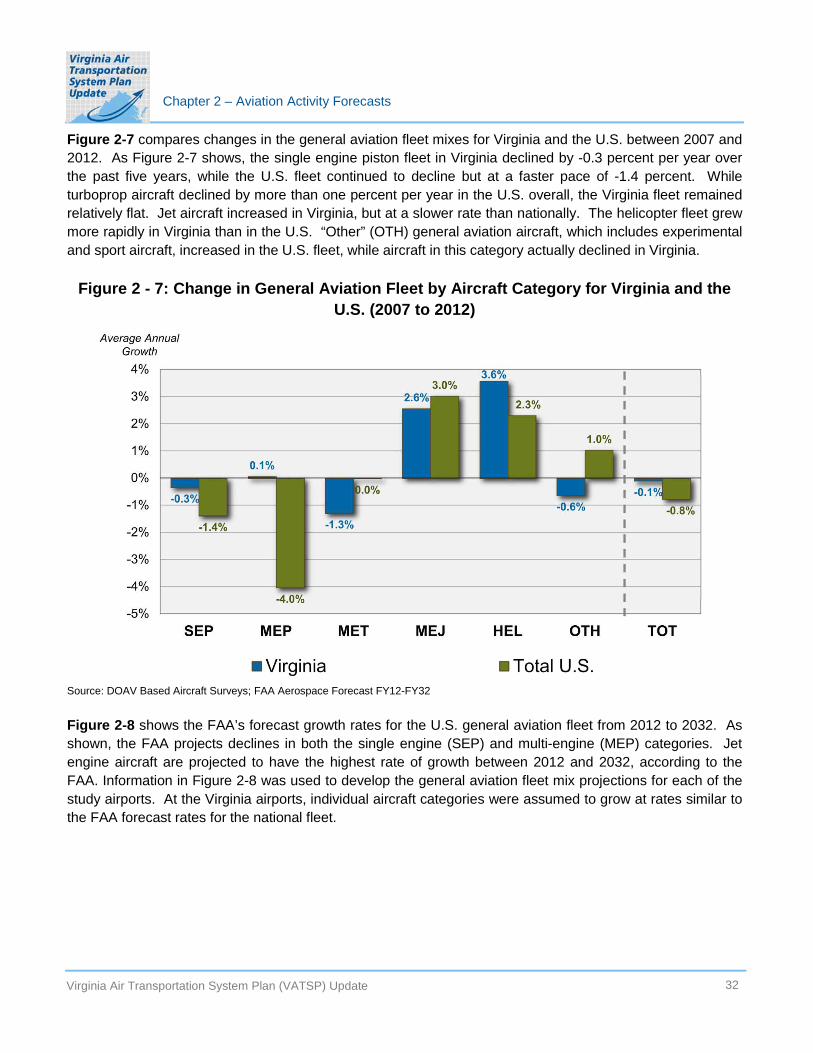
Figure 2-7 compares changes in the general aviation fleet mixes for Virginia and the U.S. between 2007 and 2012. As Figure 2-7 shows, the single engine piston fleet in Virginia declined by -0.3 percent per year over the past five years, while the U.S. fleet continued to decline but at a faster pace of -1.4 percent. While turboprop aircraft declined by more than one percent per year in the U.S. overall, the Virginia fleet remained relatively flat. Jet aircraft increased in Virginia, but at a slower rate than nationally. The helicopter fleet grew more rapidly in Virginia than in the U.S. “Other” (OTH) general aviation aircraft, which includes experimental and sport aircraft, increased in the U.S. fleet, while aircraft in this category actually declined in Virginia.
Figure 2 - 7: Change in General Aviation Fleet by Aircraft Category for Virginia and the U.S. (2007 to 2012)
Source: DOAV Based Aircraft Surveys; FAA Aerospace Forecast FY12-FY32
Figure 2-8 shows the FAA’s forecast growth rates for the U.S. general aviation fleet from 2012 to 2032. As shown, the FAA projects declines in both the single engine (SEP) and multi-engine (MEP) categories. Jet engine aircraft are projected to have the highest rate of growth between 2012 and 2032, according to the FAA. Information in Figure 2-8 was used to develop the general aviation fleet mix projections for each of the study airports. At the Virginia airports, individual aircraft categories were assumed to grow at rates similar to the FAA forecast rates for the national fleet.
Virginia Air Transportation System Plan (VATSP) Update 32

Chapter 2 – Aviation Activity Forecasts
Figure 2 - 8: Forecast Growth Rates for the U.S. and Virginia General Aviation Fleets by Aircraft Category
Source: FAA Aerospace Forecast FY12-FY32
A general aviation fleet mix forecast for Virginia was developed using the preferred forecast of total based aircraft in the state, the base year fleet mix for Virginia airports and the FAA’s national forecast growth rates for general aviation aircraft categories. Figure 2-9 summarizes the VATSP forecast of Virginia’s general aviation fleet between 2012 and 2037. Table 2-4 summarizes the growth rate assumptions for each segment of the general aviation fleet. Mirroring the FAA’s projection for the U.S. fleet, jet and turboprop aircraft, along with helicopter and “other” general aviation aircraft are projected to grow the fastest between 2012 and 2037.
Virginia Air Transportation System Plan (VATSP) Update 33

Chapter 2 – Aviation Activity Forecasts
Figure 2 - 9: Forecast Based General Aviation Aircraft Fleet Mix at Virginia Airports 2012 - 2037
Source: ICF SH&E
Table 2 - 4: Growth Rate Assumptions for Virginia's General Aviation Fleet by Aircraft Category
Aircraft Category
Virginia SEP MEP MET MEJ HEL/OTH Total Virginia
Total U.S.
Forecast Average Annual Growth 2012-2022 2022-2037 2012-2037
0.7% 0.2% 3.2% 3.5% 2.4% 1.1%
0.6% 0.2% 2.2% 3.4% 2.2% 1.0%
0.6% 0.2% 2.6% 3.4% 2.3% 1.0%
0.4% 0.9%* 0.6%* Source: ICF SH&E; FAA Aerospace Forecast FY12-FY32 *Total U.S. Forecast is only through 2032 (column 3: ’22-’32 / column 4: ‘12-’32)
Virginia Air Transportation System Plan (VATSP) Update 34

Chapter 2 – Aviation Activity Forecasts
Table 2-5 summarizes the historical and forecast rates of growth for the general aviation fleets in Virginia and the U.S. Differences in the historical and the forecast rates of growth for various aircraft categories were previously discussed. Between 2012 and 2037, the VATSP Update anticipates that growth in the individual aircraft categories will move toward the U.S. averages.
Table 2 - 5: Comparison of U.S. and Virginia General Aviation Fleet Growth by Aircraft Category
Actual and Forecast Average Annual by Based Aircraft Category
SEP MEP MET MEJ HEL OTH TOT
Virginia Actual (2000-2012) 1.5% -0.5% 3.1% 3.9% 9.0% 1.5% 1.6% Forecast (2012-2037) 0.6% 0.2% 2.6% 3.4% 2.5% 2.0% 1.0% Total U.S. Actual (2000-2012) -0.7% -2.4% 4.3% 4.6% 3.4% 2.6% 0.2% Forecast (2012-2032) -0.1% -0.5% 0.9% 4.1% 2.7% 1.2% 0.6%
Source: ICF SH&E; FAA Aerospace Forecast FY12-FY32
Virginia Air Transportation System Plan (VATSP) Update 35

Chapter 2 – Aviation Activity Forecasts
Figure 2-10 shows how Virginia’s general aviation fleet mix is anticipated to change between 2012 and 2037. It shows the anticipated distribution of Virginia’s 4,946 based aircraft in 2037. Single engine piston aircraft will continue to be the dominant type in Virginia’s general aviation fleet. However, the piston share will decline over time from 76 percent in the base year to 70 percent in 2037. Similarly, the multi-engine piston share is forecast to drop from 9 percent to 7 percent. Jets and turboprops will account for a growing share of the general aviation fleet. The jet share is forecast to climb from 6 percent to 10 percent, while the turboprop share is projected to grow from 4 percent to 6 percent.
Figure 2 - 10: Actual and Forecast Based General Aviation Aircraft Fleet Mix at Virginia Airports
Source: DOAV Based Aircraft Surveys; ICF SH&E
Table 2-6 provides the projected general aviation fleet mix for each of the study airports. This table shows the base year 2012 and forecast year 2037 fleet mixes for each of the study airports and the long-term forecast growth rates.
Virginia Air Transportation System Plan (VATSP) Update 36

Chapter 2 – Aviation Activity Forecasts
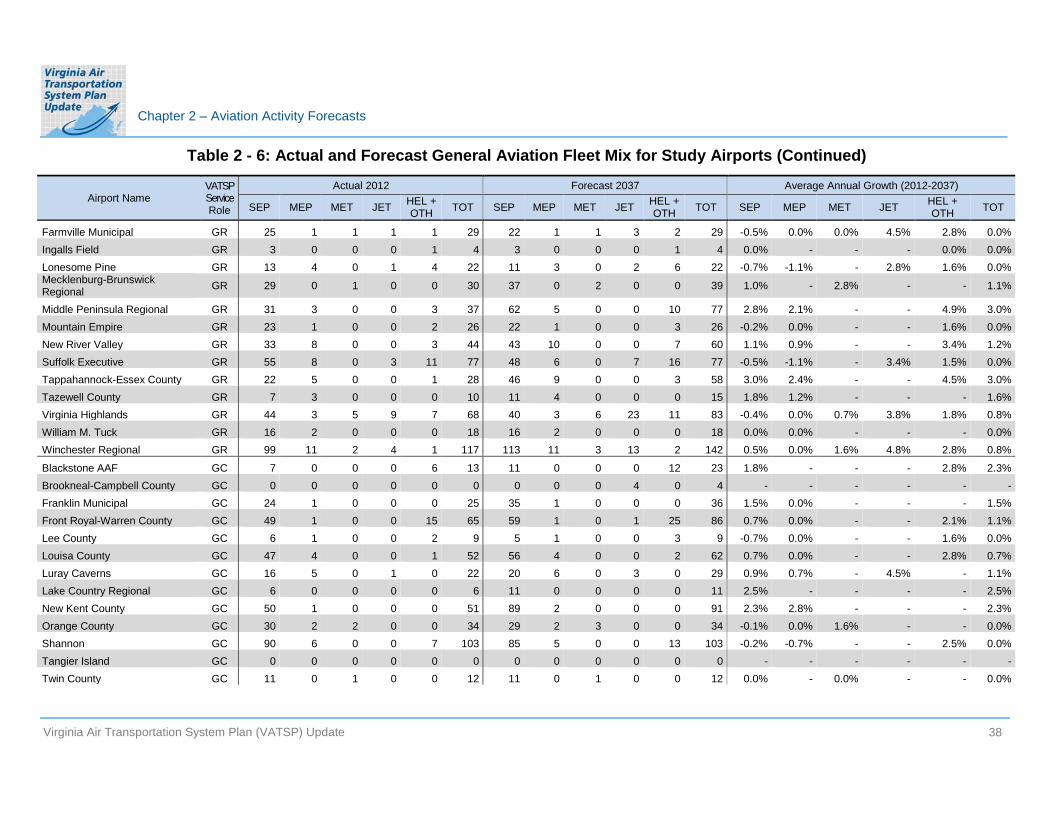
Table 2 - 6: Actual and Forecast General Aviation Fleet Mix for Study Airports
Airport Name VATSP Service Role
Actual 2012 Forecast 2037 Average Annual Growth (2012-2037)
SEP MEP MET JET HEL + OTH TOT SEP MEP MET JET HEL +
OTH TOT SEP MEP MET JET HEL + OTH TOT
Charlottesville-Albemarle CM 49 2 2 11 4 68 37 1 2 23 5 68 -1.1% -2.7% 0.0% 3.0% 0.9% 0.0% Lynchburg Regional CM Newport News-Williamsburg
60 6 2 7 6 81 61 6 3 20 11 101 0.1% 0.0% 1.6% 4.3% 2.5% 0.9%
International CM 67 6 4 18 0 95 60 5 5 44 0 114 -0.4% -0.7% 0.9% 3.6% - 0.7% Norfolk International CM 1 49 14 13 18 95 1 32 13 26 23 95 0.0% -1.7% -0.3% 2.8% 1.0% 0.0% Richmond International CM 16 12 4 29 4 65 9 6 3 43 4 65 -2.3% -2.7% -1.1% 1.6% 0.0% 0.0% Roanoke-Blacksburg Regional CM 97 20 4 3 0 124 120 22 6 10 1 159 0.9% 0.4% 1.6% 4.9% - 1.0% Ronald Reagan Washington National CM 0 0 0 0 0 0 0 0 0 0 0 0 - - - - - -
Shenandoah Valley Regional CM 51 17 8 2 6 84 55 17 11 6 10 99 0.3% 0.0% 1.3% 4.5% 2.1% 0.7% Washington Dulles International CM 5 0 0 54 1 60 2 0 0 67 1 70 -3.6% - - 0.9% 0.0% 0.6%
Total Commercial Airports 346 112 38 137 39 672 345 89 43 239 55 771 0.0% -0.9% 0.5% 2.3% 1.4% 0.6%
Chesapeake Regional RL 126 12 0 2 1 141 177 15 0 8 3 203 1.4% 0.9% - 5.7% 4.5% 1.5% Hampton Roads Executive RL 173 13 2 3 13 204 231 16 3 12 32 294 1.2% 0.8% 1.6% 5.7% 3.7% 1.5% Hanover County Municipal RL 108 4 1 1 1 115 146 5 2 4 3 160 1.2% 0.9% 2.8% 5.7% 4.5% 1.3% Leesburg Executive RL 198 7 14 9 4 232 180 6 16 23 7 232 -0.4% -0.6% 0.5% 3.8% 2.3% 0.0% Manassas Regional RL 314 30 10 27 23 404 314 30 12 68 40 464 0.0% 0.0% 0.7% 3.8% 2.2% 0.6% Richmond Executive-Chesterfield County RL 85 14 2 14 6 121 105 16 3 48 13 185 0.8% 0.5% 1.6% 5.1% 3.1% 1.7%
Stafford Regional RL 52 5 0 0 13 70 69 19 16 22 21 147 1.1% 5.5% - - 1.9% 3.0% Warrenton-Fauquier RL 143 17 2 1 2 165 216 23 4 4 5 252 1.7% 1.2% 2.8% 5.7% 3.7% 1.7%
Accomack County GR 28 0 0 0 0 28 43 0 0 0 0 43 1.7% - - - - 1.7% Blue Ridge Regional GR 39 5 2 2 2 50 36 4 2 5 3 50 -0.3% -0.9% 0.0% 3.7% 1.6% 0.0% Culpeper Regional GR 119 4 0 0 9 132 142 4 0 0 16 162 0.7% 0.0% - - 2.3% 0.8% Danville Regional GR 35 3 1 0 1 40 34 3 1 0 2 40 -0.1% 0.0% 0.0% - 2.8% 0.0% Dinwiddie County GR 56 8 4 0 11 79 66 9 6 0 18 99 0.7% 0.5% 1.6% - 2.0% 0.9% Emporia-Greensville Regional GR 5 1 0 0 0 6 9 2 0 0 0 11 2.4% 2.8% - - - 2.5%
Virginia Air Transportation System Plan (VATSP) Update 37
Chapter 2 – Aviation Activity Forecasts
Table 2 - 6: Actual and Forecast General Aviation Fleet Mix for Study Airports (Continued)
Airport Name VATSP Service Role
Actual 2012 Forecast 2037 Average Annual Growth (2012-2037)
SEP MEP MET JET HEL + OTH TOT SEP MEP MET JET HEL +
OTH TOT SEP MEP MET JET HEL + OTH TOT
Farmville Municipal GR 25 1 1 1 1 29 22 1 1 3 2 29 -0.5% 0.0% 0.0% 4.5% 2.8% 0.0% Ingalls Field GR 3 0 0 0 1 4 3 0 0 0 1 4 0.0% - - - 0.0% 0.0% Lonesome Pine GR 13 4 0 1 4 22 11 3 0 2 6 22 -0.7% -1.1% - 2.8% 1.6% 0.0% Mecklenburg-Brunswick Regional GR 29 0 1 0 0 30 37 0 2 0 0 39 1.0% - 2.8% - - 1.1%
Middle Peninsula Regional GR 31 3 0 0 3 37 62 5 0 0 10 77 2.8% 2.1% - - 4.9% 3.0% Mountain Empire GR 23 1 0 0 2 26 22 1 0 0 3 26 -0.2% 0.0% - - 1.6% 0.0% New River Valley GR 33 8 0 0 3 44 43 10 0 0 7 60 1.1% 0.9% - - 3.4% 1.2% Suffolk Executive GR 55 8 0 3 11 77 48 6 0 7 16 77 -0.5% -1.1% - 3.4% 1.5% 0.0% Tappahannock-Essex County GR 22 5 0 0 1 28 46 9 0 0 3 58 3.0% 2.4% - - 4.5% 3.0% Tazewell County GR 7 3 0 0 0 10 11 4 0 0 0 15 1.8% 1.2% - - - 1.6% Virginia Highlands GR 44 3 5 9 7 68 40 3 6 23 11 83 -0.4% 0.0% 0.7% 3.8% 1.8% 0.8% William M. Tuck GR 16 2 0 0 0 18 16 2 0 0 0 18 0.0% 0.0% - - - 0.0% Winchester Regional GR 99 11 2 4 1 117 113 11 3 13 2 142 0.5% 0.0% 1.6% 4.8% 2.8% 0.8%
Blackstone AAF GC 7 0 0 0 6 13 11 0 0 0 12 23 1.8% - - - 2.8% 2.3% Brookneal-Campbell County GC 0 0 0 0 0 0 0 0 0 4 0 4 - - - - - -Franklin Municipal GC 24 1 0 0 0 25 35 1 0 0 0 36 1.5% 0.0% - - - 1.5% Front Royal-Warren County GC 49 1 0 0 15 65 59 1 0 1 25 86 0.7% 0.0% - - 2.1% 1.1% Lee County GC 6 1 0 0 2 9 5 1 0 0 3 9 -0.7% 0.0% - - 1.6% 0.0% Louisa County GC 47 4 0 0 1 52 56 4 0 0 2 62 0.7% 0.0% - - 2.8% 0.7% Luray Caverns GC 16 5 0 1 0 22 20 6 0 3 0 29 0.9% 0.7% - 4.5% - 1.1% Lake Country Regional GC 6 0 0 0 0 6 11 0 0 0 0 11 2.5% - - - - 2.5% New Kent County GC 50 1 0 0 0 51 89 2 0 0 0 91 2.3% 2.8% - - - 2.3% Orange County GC 30 2 2 0 0 34 29 2 3 0 0 34 -0.1% 0.0% 1.6% - - 0.0% Shannon GC 90 6 0 0 7 103 85 5 0 0 13 103 -0.2% -0.7% - - 2.5% 0.0% Tangier Island GC 0 0 0 0 0 0 0 0 0 0 0 0 - - - - - -Twin County GC 11 0 1 0 0 12 11 0 1 0 0 12 0.0% - 0.0% - - 0.0%
Virginia Air Transportation System Plan (VATSP) Update 38

Chapter 2 – Aviation Activity Forecasts
Table 2 - 6: Actual and Forecast General Aviation Fleet Mix for Study Airports (Continued)
Airport Name VATSP Service Role
Actual 2012 Forecast 2037 Average Annual Growth (2012-2037)
SEP MEP MET JET HEL + OTH TOT SEP MEP MET JET HEL +
OTH TOT SEP MEP MET JET HEL + OTH TOT
Virginia Tech-Montgomery Executive GC 43 1 0 2 2 48 68 1 0 9 5 83 1.9% 0.0% - 6.2% 3.7% 2.2% Wakefield Municipal GC 25 0 0 0 1 26 25 0 0 0 1 26 0.0% - - - 0.0% 0.0% Williamsburg-Jamestown GC 70 2 0 0 1 73 89 2 0 0 2 93 1.0% 0.0% - - 2.8% 1.0%
Bridgewater Air Park LO 2 2 75 2 0 81 4 4 187 11 0 206 2.8% 2.8% 3.7% 7.1% - 3.8% Chase City Municipal LO 4 0 0 0 0 4 4 0 0 0 0 4 0.0% - - - - 0.0% Crewe Municipal LO 9 1 0 0 0 10 9 1 0 0 0 10 0.0% 0.0% - - - 0.0% Waynesboro-Eagle's Nest LO 43 2 0 0 7 52 55 2 0 0 12 69 1.0% 0.0% - - 2.2% 1.1% Falwell LO 11 0 0 0 0 11 11 0 0 0 0 11 0.0% - - - - 0.0% Gordonsville Municipal LO 20 1 0 0 1 22 28 1 0 0 3 32 1.4% 0.0% - - 4.5% 1.5% Grundy Municipal LO 9 2 0 0 0 11 9 2 0 0 0 11 0.0% 0.0% - - - 0.0% Hummel Field LO 34 0 0 0 0 34 34 0 0 0 0 34 0.0% - - - - 0.0% Lake Anna LO 2 0 0 0 0 2 6 0 0 0 0 6 4.5% - - - - 4.5% Lawrenceville-Brunswick LO 3 0 0 0 0 3 3 0 0 0 0 3 0.0% - - - - 0.0% Lunenburg County LO 2 0 0 0 0 2 7 0 0 0 0 7 5.1% - - - - 5.1% New London LO 47 2 0 0 0 49 47 2 0 0 0 49 0.0% 0.0% - - - 0.0% New Market LO 23 2 0 0 2 27 23 2 0 0 2 27 0.0% 0.0% - - 0.0% 0.0% Smith Mountain Lake LO 11 1 0 0 0 12 11 1 0 0 0 12 0.0% 0.0% - - - 0.0%
Total GA Airports 2,575 209 125 82 165 3,156 3,086 247 268 270 304 4,175 0.7% 0.7% 3.1% 4.9% 2.5% 1.1%
Total VATSP Airports 2,921 321 163 219 204 3,828 3,431 336 311 509 359 4,946 0.6% 0.2% 2.6% 3.4% 2.3% 1.0%
Source: DOAV Based Aircraft Surveys and ICF SH&E
Virginia Air Transportation System Plan (VATSP) Update 39

Chapter 2 – Aviation Activity Forecasts
2.2.3 General Aviation Operations
General aviation operations consist of aircraft take-offs and landings conducted by general aviation aircraft. Some airports in the Virginia system, primarily commercial service airports, have air traffic control towers that record aircraft operations by operational category. However, most general aviation airports in Virginia lack an air traffic control tower. As a result, historical and current annual general aviation aircraft operations for these airports are based on an estimate using industry accepted methodologies to arrive at an annualized total.
For the VATSP Update, the following sources for annual general aviation operations were used:
• For airports with air traffic control towers, tower records from the FAA Air Traffic Activity System (ATADS) or data from the FAA Terminal Area Forecasts (TAF) were used as the source for 2012 annual general aviation operations. In the ATADS and TAF operation counts, some on-demand air taxi and fractional aircraft operations are included in the Commuter/Air Taxi category along with commercial operations by small commuter passenger airlines. In reality these air taxi and fractional aircraft operations are performed largely with general aviation aircraft. The base year operations in this study were adjusted so that all air taxi and fractional aircraft operations are treated as general aviation. Commercial airline operations from the US DOT T-100 database were compared to FAA ATADS/TAF data to identify the portion of Commuter/Air Taxi operations that were reclassified as general aviation operations.
• For all NPIAS airports, data from the TAF was used for their general aviation operations.
• If an airport is not included in the TAF, annual operations reported on the airport’s FAA Form 5010 were used as the 2012 base year operations.
Using data from these three sources, as shown in Figure 2-11, total annual general aviation operations declined from 1.57 million in 2000 to 1.46 million in 2012. Similarly, there was a national decline in general aviation activity. The FAA Aerospace Forecast noted total general aviation operations at U.S. towered airports fell from 40 million to 26 million from 2000 to 2011.
Virginia Air Transportation System Plan (VATSP) Update 40

Chapter 2 – Aviation Activity Forecasts
Figure 2 - 11: Actual 2000 and 2012 Statewide General Aviation Operations
Source: 2003 VATSP; FAA ATADS; FAA TAF FY12-FY40; Form 5010; U.S. DOT, T100 (YENov12)
Decreases in general aviation activity are attributed to many factors. These factors include, but are not necessarily limited to, the high costs of private aircraft ownership, high fuel costs, a declining pilot base, production of fewer new general aviation aircraft, and a weak economy. As shown in Figure 2-11, the greatest decrease in general aviation operations in Virginia occurred at the commercial airports, where activity fell from nearly 640,000 operations in 2000 to almost 373,000 operations in 2012. Annual operations at the general aviation airports reportedly increased from 931,000 in 2000 to just under 1.09 million in 2012.
The average annual rate of decrease between 2000 and 2012 for general aviation operations at commercial service airports was -4.4 percent. Over the same time frame, annual general aviation operations at the general aviation airports increased by 1.3 percent. Overall, general aviation operations in Virginia decreased at an average annual rate of -0.6 percent between 2000 and 2012. According to FAA data for towered airports, general aviation operations in the U.S. declined at an average annual rate of -3.7 percent between 2000 and 2012. Although overall general aviation operations decreased in Virginia between 2000 and 2012, the rate of decrease was below that for the U.S. as a whole.
In Virginia, all study airports, both commercial service and general aviation, have some level of annual general aviation aircraft operations. Each airport’s total annual general aviation operations are influenced by several factors, some of which are summarized as follows:
• Airports that have higher levels of based general aviation aircraft also typically have higher estimated total annual general aviation operations.
Virginia Air Transportation System Plan (VATSP) Update 41

Chapter 2 – Aviation Activity Forecasts
• The proximity of neighboring airports which provide a wider array of facilities and services can limit an airport’s annual general aviation activity. In the case of commercial service airports, general aviation activity can be reduced if there are suitable reliever airports to serve general aviation demand.
• Airports that have one or more flight schools tend to have higher annual general aviation operational estimates. Flight training most often involves repetitive operations which are referred to as a touch and go. When training, a pilot approaches the runway, touches down briefly, and without coming to a full stop on the runway, takes off. These repetitive training operations typically increase an airport’s estimated annual general aviation operations without impacting facility requirements.
• Airports that have higher levels of visiting aircraft also tend to have higher estimates of total annual general aviation operations. Visiting or transient aircraft operations are often higher in resort areas or areas with other attractions. Airports that serve business centers also most often have a higher level of transient aircraft activity which boosts their total annual general aviation operations.
As noted, between 2000 and 2012, based on the previously noted sources, total general aviation operations for all airports in Virginia reportedly declined. Since most of Virginia’s commercial airports have air traffic control towers, reports of annual general aviation operations at the commercial airports are more reliable than estimates of annual general aviation operations provided by the non-towered airports. The downward trend in annual general aviation operations, noted for the commercial airports in Virginia, is considered more reliable than the upward trend estimated for the non-towered general aviation airports in Virginia.
Several methodologies were initially considered to project future general aviation operations for all commercial and general aviation airports included in the VATSP Update. Within the context of a state aviation system plan, it is important to select a methodology that works best for the majority of all airports included in the analysis since one consistent methodology is typically used for all airports. The methodologies considered to project annual general aviation operations in the VATSP Update included:
• Trend Analysis – Trend analysis considers past rates of growth and uses historical trends in those rates to project future demand. This methodology is generally most applicable when historical growth has exhibited a consistent trend. In the case of annual general aviation operations at Virginia study airports, trends in annual general aviation operations have been inconsistent, with some airports exhibiting increasing general aviation operations and others showing an overall decline. As a result of the fact that airports have shown such a wide range of trends in terms of their historical annual general aviation operations, this methodology was discarded from further consideration.
• Regression Analysis – Regression analysis considers the historical correlation between aviation demand and various socio-economic or demographic predictors. If a positive relationship can be established, then factors such as population, income or employment can be used as predictors to forecast annual general aviation operations. Analysis of the relationship between Virginia’s population, income, and employment revealed no statically valid correlation with the state’s total annual general aviation operations. With no statistically valid correlation, this methodology was dropped from further review.
Virginia Air Transportation System Plan (VATSP) Update 42

Chapter 2 – Aviation Activity Forecasts
• Application of FAA Growth Rates – Within its National Aerospace Forecast, the FAA has projections for two indicators, as they relate to annual general aviation activity. One of these factors is hours flown by general aviation aircraft and the other is annual general aviation operations at towered airports. Available aviation statistics for Virginia do not include reported hours flown by general aviation aircraft; as a result, there is no way to compare this national indictor to general aviation activity in Virginia. As previously noted, between 2000 and 2012, general aviation operations at towered airports in the U.S. (both commercial and general aviation airports) decreased at an average annual rate of -3.7 percent. With the exception of Manassas Regional, all towered airports in Virginia are commercial airports, and annual general aviation operations at these airports decreased at a rate of -4.4 percent between 2000 and 2012. Overall, annual general aviation at all Virginia airports decreased at an average annual rate of -0.6 percent between 2000 and 2012. Historical changes in general aviation activity at airports in Virginia have not mirrored trends in total U.S. activity; therefore, it was not logical to assume that Virginia’s general aviation operations will mirror U.S. trends in the future. Further consideration of this methodology was also discontinued.
• Operations Per Based Aircraft (OPBA) – An OPBA for an airport is established by dividing total annual general aviation operations by total based aircraft. To use this methodology to project future annual general aviation operations, an OPBA ratio is multiplied times the airport’s selected forecast for total based aircraft. While not all operations at an airport are conducted by aircraft that are based at the airport, an OPBA ratio serves as a proxy to reflect operations by both based and visiting (transient) aircraft. In this update to the VATSP, OPBA ratios were developed for each study airport. An individualized OPBA helps to capture unique characteristics of each airport’s general aviation activity. For instance, general aviation airports in Virginia with flight training programs have an OPBA ratio that is higher than a similar airport without a flight training program. Airports such as Ingalls Field that attract a high volume of visitor related travel have a higher OPBA ratio than an airport that has limited visitor related traffic.
To provide projections of general aviation operations for Virginia airports, the OPBA methodology was selected for the VATSP Update. This methodology was selected because other tested methodologies proved less applicable for the task at hand. Further, using the OPBA methodology allows for each airport’s unique characteristics to be factored into their projection of future general aviation operational demand.
Illustrated in Table 2-7 are the total average OPBA for airports in Virginia. In 2000 an average of 498 OPBA were recorded; and in 2012, this ratio fell to 381. The average OPBA for general aviation operations at the commercial service airports declined from 859 in 2000 to 555 in 2012. For all general aviation airports in Virginia, the average OPBA decreased from 387 in 2000 to 345 in 2012. The OPBA for general aviation aircraft at the commercial service airports in Virginia is higher than the statewide OPBA and the OPBA at the general aviation airports. This higher OPBA is most likely associated with the fact that general aviation aircraft at the commercial service airports are flown largely for business related activities and are flown on a more frequent basis. These airports often also attract a higher number of transient or visiting general aviation operations.
Virginia Air Transportation System Plan (VATSP) Update 43

Chapter 2 – Aviation Activity Forecasts
Table 2 - 7: Actual Operations per Based Aircraft at Virginia Airports 2000 and 2012
Average General Aviation OPBA
CY 2000 CY 2012
At Commercial Service Airports 859 555
At GA Airports 387 345
Weighted Average at Virginia Airports* 498 381
*The OPBA for Virginia airports represents a weighted average of OPBA for Virginia’s commercial service airports and the OPBA for Virginia’s general aviation airports.
Source: 2003 VATSP; FAA ATADS; FAA TAF FY12-FY40; Form 5010; U.S. DOT, T100 (YENov12)
For each of the study airports, historical OPBA were calculated. The historical OPBA for each airport are shown in Table 2-8. In the forecasting process, the historical OPBA for each airport was applied to its forecast of total based general aviation aircraft to develop a forecast of annual general aviation operations. These projections are shown in Table 2-9.
Virginia Air Transportation System Plan (VATSP) Update 44

Chapter 2 – Aviation Activity Forecasts
Table 2 - 8: Actual and Assumed Future Year Operations per Based Aircraft Assumptions for Virginia Airports 2000 to 2037
Assumed OPBA VATSP Actual 2012- 2017- 2022- 2027- 2032Airport Name Service OPBA 2017 2022 2027 2032 2037Role 2012
Charlottesville-Albemarle CM 845 840 832 824 816 808 Lynchburg Regional CM 1,214 1,210 1,198 1,186 1,174 1,162 Newport News-Williamsburg International CM 655 650 644 638 632 626 Norfolk International CM 276 280 277 274 271 268 Richmond International CM 539 540 535 530 525 520 Roanoke-Blacksburg Regional CM 234 230 228 226 224 222 Ronald Reagan Washington National CM 0 0 0 0 0 Shenandoah Valley Regional CM 188 190 188 186 184 182 Washington Dulles International CM 709 710 703 696 689 682 Total Air Carrier Airports 555 545 539 533 528 522
Chesapeake Regional RL 319 320 317 314 311 308 Hampton Roads Executive RL 306 310 307 304 301 298 Hanover County Municipal RL 289 290 287 284 281 278 Leesburg Executive RL 456 460 455 450 446 442 Manassas Regional RL 213 210 208 206 204 202 Richmond Executive-Chesterfield County RL 477 480 475 470 465 460 Stafford Regional RL 337 383 413 447 481 516 Warrenton-Fauquier RL 266 270 267 264 261 258
Accomack County GR 241 240 238 236 234 232 Blue Ridge Regional GR 468 470 465 460 455 450 Culpeper Regional GR 431 430 426 422 418 414 Danville Regional GR 482 480 475 470 465 460 Dinwiddie County GR 386 390 386 382 378 374 Emporia-Greensville Regional GR 193 190 188 186 184 182 Farmville Municipal GR 493 490 485 480 475 470 Ingalls Field GR 2,501 2,500 2,475 2,450 2,426 2,402 Lonesome Pine GR 433 430 426 422 418 414
Virginia Air Transportation System Plan (VATSP) Update 45

Chapter 2 – Aviation Activity Forecasts
Table 2 - 8: Actual and Assumed Future Year Operations per Based Aircraft Assumptions for Virginia Airports 2000 to 2037 (Continued)
Assumed OPBA
Airport Name VATSP Service
Role
Actual OPBA 2012
20122017
20172022
20222027
20272032
20322037
Mecklenburg-Brunswick Regional GR 327 330 327 324 321 318 Middle Peninsula Regional GR 309 310 307 304 301 298 Mountain Empire GR 393 390 386 382 378 374 New River Valley GR 145 140 139 138 137 136 Suffolk Executive GR 527 530 525 520 515 510 Tappahannock-Essex County GR 429 430 426 422 418 414 Tazewell County GR 497 500 495 490 485 480 Virginia Highlands GR 165 160 158 156 154 152 William M. Tuck GR 414 410 406 402 398 394 Winchester Regional GR 335 340 337 334 331 328
Blackstone AAF GC 81 80 79 78 77 76 Brookneal-Campbell County GC 370 369 368 367 366 Franklin Municipal GC 149 150 149 148 147 146 Front Royal-Warren County GC 235 230 228 226 224 222 Lee County GC 389 390 386 382 378 374 Louisa County GC 436 440 436 432 428 424 Luray Caverns GC 151 150 149 148 147 146 Lake Country Regional GC 772 770 762 754 746 739 New Kent County GC 306 310 307 304 301 298 Orange County GC 250 250 248 246 244 242 Shannon GC 292 290 287 284 281 278 Tangier Island GC 0 0 0 0 0 Twin County GC 744 740 733 726 719 712 Virginia Tech-Montgomery Executive GC 365 370 366 362 358 354 Wakefield Municipal GC 629 630 624 618 612 606 Williamsburg-Jamestown GC 376 380 376 372 368 364
Bridgewater Air Park LO 148 150 149 148 147 146
Virginia Air Transportation System Plan (VATSP) Update 46

Chapter 2 – Aviation Activity Forecasts
Table 2 - 8: Actual and Assumed Future Year Operations per Based Aircraft Assumptions for Virginia Airports 2000 to 2037 (Continued)
Assumed OPBA VATSP Actual 2012- 2017- 2022- 2027- 2032Airport Name Service OPBA 2017 2022 2027 2032 2037Role 2012
Chase City Municipal LO 650 650 644 638 632 626 Crewe Municipal LO 420 420 416 412 408 404 Waynesboro-Eagle's Nest LO 246 250 248 246 244 242 Falwell LO 755 750 743 736 729 722 Gordonsville Municipal LO 416 420 416 412 408 404 Grundy Municipal LO 380 380 376 372 368 364 Hummel Field LO 382 380 376 372 368 364 Lake Anna LO 380 380 376 372 368 364 Lawrenceville-Brunswick LO 900 900 891 882 873 864 Lunenburg County LO 196 200 198 196 194 192 New London LO 671 670 663 656 649 643 New Market LO 599 600 594 588 582 576 Smith Mountain Lake LO 427 430 426 422 418 414 Total GA Airports 345 345 342 338 335 332 Total VATSP Airports 381 381 377 372 368 364
Source: FAA ATADS; FAA TAF FY12-FY40; Form 5010; U.S. DOT, T100 (YENov12) and ICF SH&E.
Virginia Air Transportation System Plan (VATSP) Update 47

Chapter 2 – Aviation Activity Forecasts
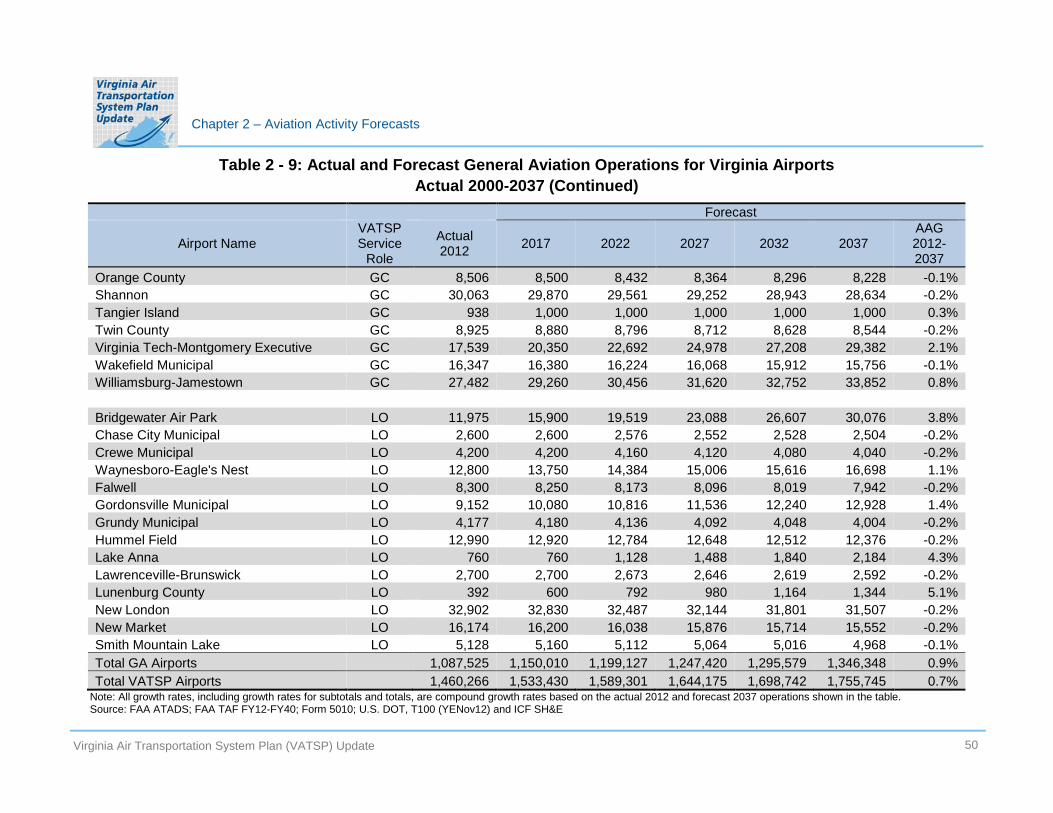
Table 2 - 9: Actual and Forecast General Aviation Operations for Virginia Airports Actual 2000-2037
Forecast
Airport Name VATSP Service
Role
Actual 2012 2017 2022 2027 2032 2037
AAG 20122037
Charlottesville-Albemarle CM 57,454 57,120 56,576 56,032 55,488 54,944 -0.2% Lynchburg Regional CM 98,342 102,850 106,622 110,298 113,878 117,362 0.7% Newport News-Williamsburg International CM 62,182 64,220 66,074 67,883 69,646 71,364 0.6% Norfolk International CM 26,231 26,600 26,315 26,030 25,745 25,460 -0.1% Richmond International CM 35,045 35,100 34,775 34,450 34,125 33,800 -0.1% Roanoke-Blacksburg Regional CM 28,987 30,130 31,464 32,770 34,048 35,298 0.8% Ronald Reagan Washington National CM 6,183 6,200 6,200 6,200 6,200 6,200 0.0% Shenandoah Valley Regional CM 15,777 16,530 16,920 17,298 17,664 18,018 0.5% Washington Dulles International CM 42,540 44,670 45,228 45,794 46,368 46,951 0.4% Total Air Carrier Airports 372,741 383,420 390,174 396,755 403,163 409,397 0.4%
Chesapeake Regional RL 45,000 48,960 52,305 55,578 58,779 62,524 1.3% Hampton Roads Executive RL 62,495 68,820 73,680 78,432 83,076 87,612 1.4% Hanover County Municipal RL 33,189 35,960 38,171 40,328 42,431 44,480 1.2% Leesburg Executive RL 105,819 106,720 105,560 104,400 103,472 102,544 -0.1% Manassas Regional RL 86,048 86,730 88,192 89,816 91,596 93,728 0.3% Richmond Executive-Chesterfield County RL 57,750 64,320 69,825 75,200 80,445 85,100 1.6% Stafford Regional RL 23,609 29,500 34,719 40,704 47,175 55,222 3.5% Warrenton-Fauquier RL 43,950 49,140 53,133 57,024 60,813 65,016 1.6%
Accomack County GR 6,753 7,440 8,092 8,732 9,360 9,976 1.6% Blue Ridge Regional GR 23,400 23,500 23,250 23,000 22,750 22,500 -0.2% Culpeper Regional GR 56,925 59,340 61,344 63,300 65,208 67,068 0.7% Danville Regional GR 19,264 19,200 19,000 18,800 18,600 18,400 -0.2%
Virginia Air Transportation System Plan (VATSP) Update 48

Chapter 2 – Aviation Activity Forecasts
Table 2 - 9: Actual and Forecast General Aviation Operations for Virginia Airports Actual 2000-2037 (Continued)
Forecast VATSP Actual AAG
Airport Name
Dinwiddie County Emporia-Greensville Regional Farmville Municipal Ingalls Field Lonesome Pine Mecklenburg-Brunswick Regional Middle Peninsula Regional Mountain Empire New River Valley Suffolk Executive Tappahannock-Essex County Tazewell County Virginia Highlands William M. Tuck Winchester Regional
Service Role GR GR GR GR GR GR GR GR GR GR GR GR GR GR GR
2012
30,485 1,160
14,300 10,003 9,531 9,800
11,424 10,212 6,373
40,582 12,000 4,968
11,218 7,452
39,250
2017
32,370 1,330
14,210 10,000 9,460
10,560 13,950 10,140 6,580
40,810 14,620 5,500
11,360 7,380
41,480
2022
33,582 1,504
14,065 9,900 9,372
11,118 16,271 10,036 6,950
40,425 17,040 5,940
11,692 7,308
42,799
2027
34,762 1,674
13,920 9,800 9,284
11,664 18,544 9,932 7,314
40,040 19,412 6,370
12,012 7,236
44,088
2032
35,910 1,840
13,775 9,704 9,196
12,198 20,769 9,828 7,672
39,655 21,736 6,790
12,320 7,164
45,347
2037
37,026 2,002
13,630 9,608 9,108
12,402 22,946 9,724 8,160
39,270 24,012 7,200
12,616 7,092
46,576
20122037
0.8% 2.2%
-0.2% -0.2% -0.2% 0.9% 2.8%
-0.2% 1.0%
-0.1% 2.8% 1.5% 0.5%
-0.2% 0.7%
Blackstone AAF Brookneal-Campbell County Franklin Municipal Front Royal-Warren County Lee County Louisa County Luray Caverns Lake Country Regional New Kent County
GC GC GC GC GC GC GC GC GC
1,053 735
3,724 15,270 3,499
22,678 3,315 4,633
15,608
1,200 740
4,050 15,870 3,510
23,760 3,450 5,390
18,290
1,343 1,476 4,321
16,644 3,474
24,416 3,576 6,096
20,569
1,482 1,472 4,588
17,402 3,438
25,056 3,700 6,786
22,800
1,617 1,468 4,851
18,144 3,402
25,680 3,822 7,460
24,983
1,748 1,464 5,256
19,092 3,366
26,288 4,234 8,129
27,118
2.0% 2.8% 1.4% 0.9%
-0.2% 0.6% 1.0% 2.3% 2.2%
Virginia Air Transportation System Plan (VATSP) Update 49
Chapter 2 – Aviation Activity Forecasts
Table 2 - 9: Actual and Forecast General Aviation Operations for Virginia Airports Actual 2000-2037 (Continued)
Forecast
Airport Name VATSP Service
Role
Actual 2012 2017 2022 2027 2032 2037
AAG 20122037
Orange County GC 8,506 8,500 8,432 8,364 8,296 8,228 -0.1% Shannon GC 30,063 29,870 29,561 29,252 28,943 28,634 -0.2% Tangier Island GC 938 1,000 1,000 1,000 1,000 1,000 0.3% Twin County GC 8,925 8,880 8,796 8,712 8,628 8,544 -0.2% Virginia Tech-Montgomery Executive GC 17,539 20,350 22,692 24,978 27,208 29,382 2.1% Wakefield Municipal GC 16,347 16,380 16,224 16,068 15,912 15,756 -0.1% Williamsburg-Jamestown GC 27,482 29,260 30,456 31,620 32,752 33,852 0.8%
Bridgewater Air Park LO 11,975 15,900 19,519 23,088 26,607 30,076 3.8% Chase City Municipal LO 2,600 2,600 2,576 2,552 2,528 2,504 -0.2% Crewe Municipal LO 4,200 4,200 4,160 4,120 4,080 4,040 -0.2% Waynesboro-Eagle's Nest LO 12,800 13,750 14,384 15,006 15,616 16,698 1.1% Falwell LO 8,300 8,250 8,173 8,096 8,019 7,942 -0.2% Gordonsville Municipal LO 9,152 10,080 10,816 11,536 12,240 12,928 1.4% Grundy Municipal LO 4,177 4,180 4,136 4,092 4,048 4,004 -0.2% Hummel Field LO 12,990 12,920 12,784 12,648 12,512 12,376 -0.2% Lake Anna LO 760 760 1,128 1,488 1,840 2,184 4.3% Lawrenceville-Brunswick LO 2,700 2,700 2,673 2,646 2,619 2,592 -0.2% Lunenburg County LO 392 600 792 980 1,164 1,344 5.1% New London LO 32,902 32,830 32,487 32,144 31,801 31,507 -0.2% New Market LO 16,174 16,200 16,038 15,876 15,714 15,552 -0.2% Smith Mountain Lake LO 5,128 5,160 5,112 5,064 5,016 4,968 -0.1% Total GA Airports 1,087,525 1,150,010 1,199,127 1,247,420 1,295,579 1,346,348 0.9% Total VATSP Airports 1,460,266 1,533,430 1,589,301 1,644,175 1,698,742 1,755,745 0.7%
Note: All growth rates, including growth rates for subtotals and totals, are compound growth rates based on the actual 2012 and forecast 2037 operations shown in the table. Source: FAA ATADS; FAA TAF FY12-FY40; Form 5010; U.S. DOT, T100 (YENov12) and ICF SH&E
Virginia Air Transportation System Plan (VATSP) Update 50

Chapter 2 – Aviation Activity Forecasts
In order to validate the OPBA approach used in the VATSP Update, a review was undertaken to compare Virginia’s OBPA at towered and non-towered airports to OPBA ratios in neighboring states. Research was undertaken to compare general aviation activity in Virginia to general aviation activity in Kentucky, Maryland, North Carolina, Tennessee, and West Virginia. This research was completed using available and comparable information for each state as reported by the Federal Aviation Administration (FAA) in their most recent Terminal Area Forecast (TAF).
Two indicators of general aviation activity, total based general aviation aircraft and general aviation operations per based aircraft (OPBA), were reviewed. These two indicators were reviewed for all TAF airports in each state. It is important to note, for the states included in this review, there are some airports included in the state airport system that are not included in the FAA’s TAF. The TAF contains only airports that are in the National Plan of Integrated Airport Systems (NPIAS).
For instance, of the 57 general aviation airports included in the VATSP, 19 are non-NPIAS airports. As a result, based aircraft and annual OPBA ratios for these non-NPIAS airports were not considered in this analysis. For Virginia, 33 percent of the 57 general aviation airports included in the state system are not included in the TAF. While the percentages vary, the same is true for neighboring states; portions of their state airport systems are comprised of non-NPIAS airports. Activity indicators for any non-NPIAS airport are not reflected in this analysis.
Tables 2-10 and 2-11 provide comparative information on total based aircraft and OPBA ratios for all NPIAS airports in Virginia and neighboring states considered as part of this research.
Table 2 - 10: Comparison of Based General Aviation Aircraft at NPIAS Airports in Virginia and Neighboring States
Year Kentucky Maryland North Carolina Tennessee Virginia West
Virginia 2000 1,748 1,819 2,890 3,072 2,515 832 2001 1,859 2,108 3,194 3,206 2,605 823 2002 1,812 2,115 3,278 3,129 2,578 830 2003 1,792 2,146 3,306 3,127 2,599 833 2004 1,860 2,184 3,534 3,225 2,761 799 2005 1,976 2,148 3,712 3,249 2,948 855 2006 1,981 2,189 3,729 3,255 3,136 886 2007 1,911 2,196 3,755 3,325 3,168 883 2008 1,703 1,939 3,538 3,057 3,004 807 2009 1,660 2,009 3,595 2,961 3,018 800 2010 1,567 1,714 3,375 2,724 2,890 706 2011 1,432 1,662 3,409 2,638 2,838 705 2012 1,453 1,679 3,422 2,644 2,859 717
Virginia Air Transportation System Plan (VATSP) Update 51
Chapter 2 – Aviation Activity Forecasts
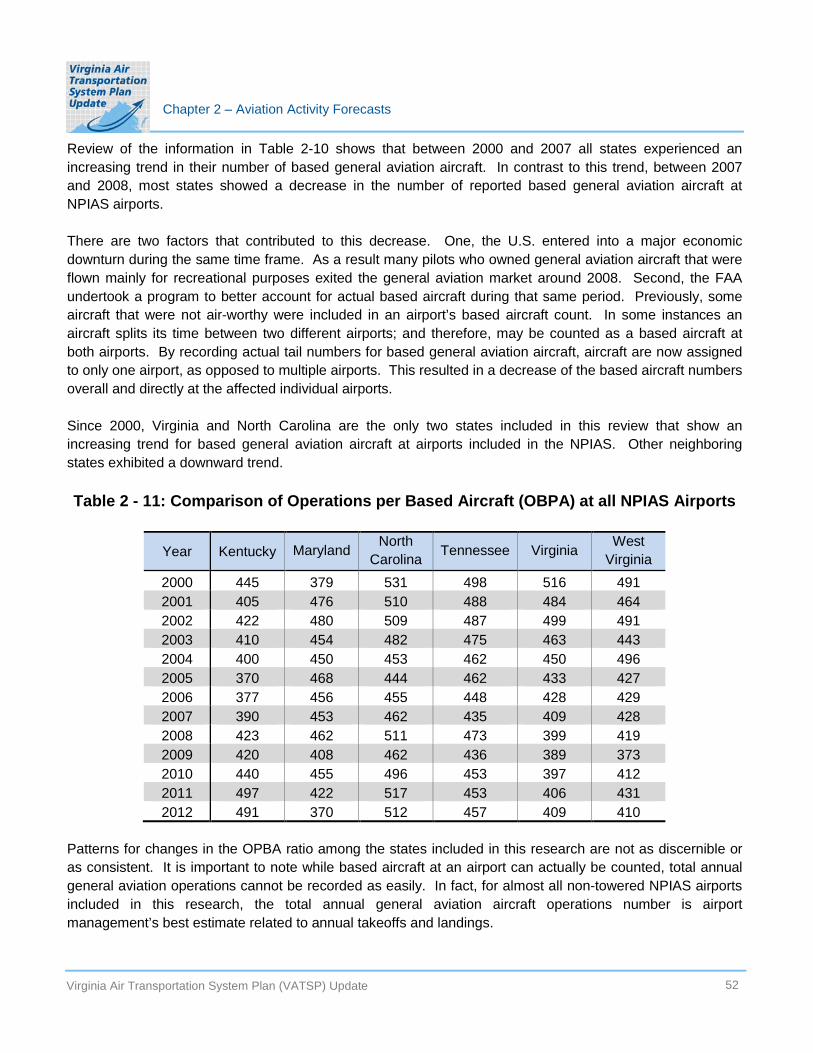
Review of the information in Table 2-10 shows that between 2000 and 2007 all states experienced an increasing trend in their number of based general aviation aircraft. In contrast to this trend, between 2007 and 2008, most states showed a decrease in the number of reported based general aviation aircraft at NPIAS airports.
There are two factors that contributed to this decrease. One, the U.S. entered into a major economic downturn during the same time frame. As a result many pilots who owned general aviation aircraft that were flown mainly for recreational purposes exited the general aviation market around 2008. Second, the FAA undertook a program to better account for actual based aircraft during that same period. Previously, some aircraft that were not air-worthy were included in an airport’s based aircraft count. In some instances an aircraft splits its time between two different airports; and therefore, may be counted as a based aircraft at both airports. By recording actual tail numbers for based general aviation aircraft, aircraft are now assigned to only one airport, as opposed to multiple airports. This resulted in a decrease of the based aircraft numbers overall and directly at the affected individual airports.
Since 2000, Virginia and North Carolina are the only two states included in this review that show an increasing trend for based general aviation aircraft at airports included in the NPIAS. Other neighboring states exhibited a downward trend.
Table 2 - 11: Comparison of Operations per Based Aircraft (OBPA) at all NPIAS Airports
Year Kentucky Maryland North Carolina Tennessee Virginia West
Virginia 2000 445 379 531 498 516 491 2001 405 476 510 488 484 464 2002 422 480 509 487 499 491 2003 410 454 482 475 463 443 2004 400 450 453 462 450 496 2005 370 468 444 462 433 427 2006 377 456 455 448 428 429 2007 390 453 462 435 409 428 2008 423 462 511 473 399 419 2009 420 408 462 436 389 373 2010 440 455 496 453 397 412 2011 497 422 517 453 406 431 2012 491 370 512 457 409 410
Patterns for changes in the OPBA ratio among the states included in this research are not as discernible or as consistent. It is important to note while based aircraft at an airport can actually be counted, total annual general aviation operations cannot be recorded as easily. In fact, for almost all non-towered NPIAS airports included in this research, the total annual general aviation aircraft operations number is airport management’s best estimate related to annual takeoffs and landings.
Virginia Air Transportation System Plan (VATSP) Update 52

Chapter 2 – Aviation Activity Forecasts
An airport’s OPBA ratio is calculated by dividing total annual general aviation operations (both local and itinerant) by total based aircraft. Not all annual general aviation aircraft operations are conducted by aircraft based at the airport. Each airport’s annual general aviation operations are a mix of flights attributed to aircraft which are based at the airport as well as to aircraft that are visiting the airport. Therefore, the OPBA reflects operations by both based and visiting aircraft. OPBA are recognized by the FAA as a valid proxy for estimating total annual general aviation activity.
Since all states included in this research experienced a decrease in their number of based aircraft at NPIAS airports between 2007 and 2008, a commensurate decrease in the reported statewide OPBA ratio could have been expected. However, as Table 2-11 reflects, only Virginia and West Virginia reportedly experienced a decrease in the statewide OPBA ratio between 2007 and 2008, according to available TAF data.
Because there are no hard data for operational activity at non-towered airports, there is a lower level of confidence in trends in general aviation operations, as reflected here by the total statewide OPBA for both towered and non-towered airports. With the contraction of the number of based aircraft in the U.S. between 2007 and 2008 and as result of the economic downturn, there has been a sense in the aviation industry that those aircraft that have remained in the general aviation fleet are more active or they are completing a higher number of takeoffs and landing. Part of this assumption is based on the conclusion that general aviation aircraft that remain active in the fleet are often being flown to support business activities. General aviation aircraft that are flown to support business activities are often flown on a more frequent basis. If general aviation aircraft based at NPIAS airports in the states considered in this research are being flown more often, that could account for the lack of a decrease in the statewide OPBA.
Over the past five years (2008-2012) the statewide average OPBA for airports included in this research is reported in Table 2-12.
Table 2 - 12: Unweighted Statewide 5-Year (2008-2012) Average OPBA for all NPIAS Airports (Virginia and Neighboring States)
State OPBA Kentucky 454 Maryland 423
North Carolina 499 Tennessee 454
Virginia 400 West Virginia 409
Since the number of annual general aviation operations for non-towered airports are estimates, the research was re-focused to consider only general aviation OPBA ratios at airports with an air traffic control tower. Airports with FAA and contract air traffic control towers are listed in the TAF. For this additional review, general aviation operations at both commercial and general aviation airports were considered. However, general aviation activity at Large Hub Commercial Service Airports was excluded from the analysis.
Virginia Air Transportation System Plan (VATSP) Update 53

Chapter 2 – Aviation Activity Forecasts
General aviation, based aircraft and annual general aviation operations from 2008-2012 were considered for the towered airports listed in Table 2-13.
Table 2 - 13: Towered Airports in Virginia and Neighboring States
State Towered Airports
Kentucky
Maryland
North Carolina
Tennessee
Virginia
West Virginia
Blue Grass (LEX),Bowman Field (LOU), Owensboro-Daviess County (OWB), Barkley Regional (PAH), Louisville-International (SDF) Easton/Newnam Field (ESN), Frederick Municipal (FDK), Hagerstown Regional (HGR), Martin State (MTN), Salisbury (SBY) Asheville Regional (AVL), Coastal Carolina Regional(EWN), Fayetteville Regional /Grannis Field (FAY), Piedmont Triad International (GSO), Hickory Regional (HKY), Wilmington International (ILM), Smith Reynolds(INT), Kinston Regional Jetport at Stallings Field (ISO), Concord Regional (JQF), Raleigh-Durham International (RDU) Nashville International (BNA), Lovell Field (CHA), Memphis International (MEM), Mc Kellar-Sipes Regional MKL, Smyrna (MQY), Millington Regional Jetport (NQA), Tri-Cities Regional (TRI), Mc Ghee Tyson (TYS) Charlottesville-Albemarle (CHO), Manassas Regional (HEF), Lynchburg Regional (LYN), Norfolk International (ORF), Newport News/Williamsburg International (PHF), Richmond International (RIC), Roanoke-Blacksburg Regional (ROA) North Central West Virginia (CKB), Yeager (CRW), Wheeling Ohio County (HLG), Tri-State (HTS), Greenbrier Valley (LWB), Morgantown Municipal (MGW), Mid-Ohio Valley Regional (PKB)
Note: Ronald Reagan Washington National was not included in this comparison because it does not have based general aviation aircraft. As a result of the metropolitan setting for Washington Dulles and this airport's very different activity characteristics, it was also excluded from this particular comparative review.
Using information from the TAF for 2008 and 2012 for the airports noted above, averages for operations per based aircraft at towered airports in Virginia and its neighboring states were developed. The average OPBA ratios at towered airports are shown in Table 2-14.
Virginia Air Transportation System Plan (VATSP) Update 54

Chapter 2 – Aviation Activity Forecasts
Table 2 - 14: Towered Airport Operations per Based Aircraft in Virginia and Neighboring States
20122008 2012 (5 Year Average (Towered Airport (Towered Airport OPBA - All NPIAS OPBA) OPBA) Airports) Kentucky 446 426 454 Maryland 478 278 423
North Carolina 378 307 499 Tennessee 336 342 454
Virginia 404 395 400 West Virginia 419 376 409
Several points are noteworthy related to the information shown above; these are as follows:
• For each state included in the research, the five-year average general aviation OPBA ratio for all NPIAS airports is higher than the OPBA average for just the towered airports. This may support the assumption that in many cases annual general aviation operational estimates for non-towered airports are currently overstated.
• With the exception of towered airports in Tennessee, towered airports in all other states included in the research show a lower general aviation OPBA ratio in 2012 than in 2008.
• For several of the states included in the research, there is a notable difference between the OPBA for towered airports and the general aviation OPBA average for all NPIAS airports; in all cases, the statewide OPBA for all NPIAS airports is higher and in some instances by more than 100 operations per aircraft.
• Virginia’s statewide OPBA for all airports included in the NPIAS at 400 is the closest to the average OPBA for only towered airports at 395; Virginia also shows the least change in the OPBA ratio at its towered airports between 2008 and 2012 in comparison to states included in this research. This may indicate that non-towered airports in Virginia are providing reasonable estimates of their annual takeoffs and landings.
Since statewide OPBA, as discussed in this research, are highly influenced by estimated as opposed to actual operational counts, the OPBA for towered airports are considered more accurate. At a ratio of 395, the 2012 general aviation OPBA for towered airports in Virginia is the second highest among all airports included in the research. Only Kentucky, with an OPBA of 426 is higher.
OPBA ratios are important to the VATSP Update because they support the preferred methodology for projecting future general aviation operations at all airports included in the Virginia system. This research shows that OPBA for airports in Virginia are comparable to those in neighboring states and are therefore reasonable proxies for projecting future general aviation operations. The research also shows that non-
Virginia Air Transportation System Plan (VATSP) Update 55

Chapter 2 – Aviation Activity Forecasts
towered airports in Virginia are providing reasonable estimates for total annual takeoffs and landings of general aviation aircraft. These findings are important to support the assumptions used to produce forecasts of general aviation operations for the VATSP Update.
This analysis revealed that the average OPBA for Virginia’s airports is comparable to the OPBA in all neighboring states. This finding helped to confirm that the approach and assumptions used to develop projections of general aviation operations for all study airports is reasonable.
Statewide, total annual general aviation operations are expected to increase from 1,460,000 in 2012 to close to 1,756,000 by 2037. Between 2012 and 2037, annual general aviation operations at the commercial airports in Virginia are projected to increase at an average annual rate of 0.4 percent, while general aviation operations at the general aviation airports are expected to increase at an average annual rate of 0.9 percent. This results in a projected average annual rate of growth for the Commonwealth of 0.7 percent. The FAA’s most current Aerospace Forecast extends to 2032. Between 2012 and 2032, the FAA projects general aviation operations nationally to grow at a rate of 0.4 percent, less than the rate of growth projected for general aviation operations in Virginia.
Within the TAF, the FAA has general aviation operations projections for all airports that are included in this FAA document. The rate of growth provided by the FAA in the TAF for all annual general aviation operations at Virginia airports is also 0.7 percent. The FAA TAF includes forecasts of general aviation operations for 47 study airports. The similarity of these two average annual rates of growth helps to validate the results of the methodology selected for use in the VATSP Update to project general aviation operations.
As noted, general aviation operations at the Virginia airports are forecast by applying an OPBA ratio to the based aircraft forecasts. The FAA national forecast of general aviation activity assumes a very slight decline in OPBA in the U.S. through 2032. The forecasts for Virginia assume that the base year OPBA ratios at the individual airports decline slightly over the forecast period, consistent with the FAA’s national forecast. For each of the study airports, the actual base year and future assumed OPBA are shown in Table 2-8. The future year OPBA ratios were applied to each airport’s forecast of total based general aviation aircraft to develop a forecast of annual general aviation operations. The resulting projections of annual general aviation operations are also shown in Table 2-9.
Figure 2-12 summarizes the statewide forecast of annual general aviation operations. As shown, total annual general aviation operations are expected to increase from 1,460,000 in 2012 to 1,756,000 by 2037. Annual general aviation operations at Virginia’s commercial airports are forecast to increase at an average annual rate of 0.4 percent, while general aviation operations at the general aviation airports are expected to increase at an average annual rate of 0.9 percent. This results in a forecast average annual growth rate of 0.7 percent for the Virginia Airport System. According to the FAA, general aviation operations at the Virginia airports included in the TAF will grow by 0.7 percent between 2012 and 2032.
Virginia Air Transportation System Plan (VATSP) Update 56

Chapter 2 – Aviation Activity Forecasts
Figure 2 - 12: Forecast of Statewide General Aviation Operations
Note: Totals have been rounded. Source: FAA ATADS; FAA TAF FY12-FY40; Form 5010; U.S. DOT, T100 (YENov12); and ICF SH&E
Virginia Air Transportation System Plan (VATSP) Update 57

Chapter 2 – Aviation Activity Forecasts
2.3 Commercial Airline Activity
Commercial activity includes activity by scheduled and charter commercial passenger airlines. The specific types of activity included in the commercial forecasts are enplaned passengers and commercial passenger aircraft operations. Historical trends and forecasts for passenger enplanements and aircraft operations are described it the following sections.
2.3.1 Historical Enplaned Passengers
Figure 2-13 presents historical enplanements for all Virginia commercial airports. For the VATSP Update, it is important to examine and consider the impacts of Ronald Reagan Washington National and Washington Dulles International airports on statewide demand. Figure 2-13 shows historical changes in enplanements for these two large hub airports and the combined change for all other commercial airports in Virginia. Table 2-15 presents historical average annual rates of growth for enplanements at Virginia’s commercial airports and compares these to rates for growth for enplanements in the U.S.
Figure 2 - 13: Virginia Historical Passenger Enplanements 2000, 2007 and 2012
Note: Totals have been rounded. Source: 2003 VATSP; Airport Records; U.S. DOT T100; FAA Aerospace Forecast FY12-FY32
Virginia Air Transportation System Plan (VATSP) Update 58

Chapter 2 – Aviation Activity Forecasts
Table 2 - 15: Historical Enplanement Growth for Virginia Airports and the U.S. Actual 2000, 2007, and 2012
Airports Average Annual Growth
2000-2007 2007-2012 2000-2012
IAD 3.0% -1.9% 1.0%
DCA 3.4% 0.2% 2.0% Other Virginia Airports 3.7% -2.7% 1.0% Total Virginia 3.3% -1.3% 1.3% Total U.S. * 1.1% -1.2% 0.1%
*U.S. commercial carriers only Source: 2003 VATSP; Airport Records; U.S. DOT T100
As shown in Figure 2-13, total enplanements for all commercial airports in Virginia grew between 2000 and 2007, but then declined between 2007 and 2012. From information shown in Table 2-15, this trend was mirrored by total enplanements in the U.S. As information in Table 2-15 shows, enplanement growth at Virginia’s commercial airports has been more robust than enplanement growth for the U.S. as a whole.
From 2000 to 2007 total enplanements for all Virginia commercial airports increased at an average annual rate of 3.3 percent, while U.S. enplanements for the same period increased at a slower rate of 1.1 percent per year. Over the most recent five-year period from 2007 to 2012, enplanements for all Virginia commercial airports decreased at an average annual rate of -1.3 percent, and total U.S. enplanements fell at a similar rate of -1.2 percent. Over the long-term period (2000 to 2012), Virginia’s enplaned passengers increased at an average annual rate of 1.3 percent, while U.S. enplanements increased only slightly by 0.1 percent per year.
Table 2-15 also shows that between 2007 and 2012 enplanements at Washington Dulles International fell by -1.9 percent annually, while enplanements at Ronald Reagan Washington National increased slightly at a rate of 0.2 percent per year. Over the same period, enplanements at all other commercial airports in Virginia fell at an average annual rate of -2.7 percent. Some of the decrease in enplanements over the most recent five year period is attributable to a drop in demand due to the economic recession and global financial collapse in 2008/2009 and a sluggish economic recovery.
Related factors that have led to declining passenger enplanements include rising and sustained high fuel prices and restructuring and consolidation in the airline industry. With high operating costs (fuel) and a renewed emphasis on profitable flying, airlines have retired many of the small turboprop and regional jets (with 50 or fewer seats) because these aircraft are no longer economically viable. This has resulted in service cuts to many commercial airports and a corresponding decrease in enplanements.
Virginia Air Transportation System Plan (VATSP) Update 59

Chapter 2 – Aviation Activity Forecasts
Between 2007 and 2012, there was further consolidation in the airline industry with significant mergers between major carriers such as Delta/Northwest and United/Continental. This has resulted in the closure or significant downsizing of several airline connecting hubs. Carrier consolidation and fewer connecting hubs east of the Mississippi have resulted in service cuts at some Virginia airports, with an adverse impact on enplanements. Further, as low cost carriers (LCCs) continue to expand at larger airports, there is often a tendency for enplanements at smaller commercial airports to decline as passengers choose to drive longer distances for LCC services at larger competing facilities.
Figure 2-14 charts historic enplanements at Virginia’s commercial airports, excluding Ronald Reagan Washington National and Washington Dulles International. As shown, enplanements at these airports increased at an average annual rate of 1.0 percent from 2000 to 2012. For the period, total enplanements in the U.S. increased at a much slower rate of 0.1 percent. Over the long-term historic period, Virginia’s commercial airports experienced higher than average enplanement growth.
Figure 2 - 14: Historical Passenger Enplanements at Virginia Airports Metropolitan Washington Airports Authority (MWAA) Airports are excluded from this analysis
2000 – 2012
Source: 2003 VATSP; Airport Records; U.S. DOT T100
Virginia Air Transportation System Plan (VATSP) Update 60

Chapter 2 – Aviation Activity Forecasts
2.3.2 Forecast of Commercial Passenger Enplanements
Historic trends in enplanements at Virginia’s commercial airports were not considered as a viable approach for projecting future enplanement levels. Actual declines in enplanements from various external “shocks” and structural changes in the airline industry between 2000 and 2012 render trend analysis an unreliable tool for projecting future enplanements. Using trend analysis would result in a continuing decline in passenger enplanements which would not be suitable for system planning purposes.
Several potential methodologies were considered for forecasting future enplanements. One of these methodologies considered the correlation of enplaned passengers at Virginia’s commercial airports to local real personal income. Analysis shows that changes in real personal income are highly correlated to changes in historical passenger enplanements at commercial airports in Virginia. A regression analysis that included all commercial airports, with the exception of Ronald Reagan Washington National and Washington Dulles International, shows a strong correlation between enplanements and real personal income over the 1990 to 2012 period.
Figure 2-15 shows the regression analysis results. Using a log-log formulation, the regression resulted in an estimated income elasticity of 0.82 which is within the range of expected income elasticity for airline passengers. The income elasticity was applied to forecasts of personal income growth in Virginia to forecast passenger enplanements at Virginia’s commercial airports, excluding Ronald Reagan Washington National and Washington Dulles International airports.
Virginia Air Transportation System Plan (VATSP) Update 61

Chapter 2 – Aviation Activity Forecasts
Figure 2 - 15: Econometric Forecast Model for Virginia Commercial Service Airport Enplanements (MWAA Airports are excluded from this analysis)
Source: Woods and Poole 2012 CEDDS; ICF SH&E analysis
Virginia Air Transportation System Plan (VATSP) Update 62

Chapter 2 – Aviation Activity Forecasts
Table 2-16 shows the real personal income growth assumptions for Virginia excluding the Virginia portions of the Washington, DC-Arlington-Alexandria MSA, which encompass portions within the service areas of the MWAA airports. As shown in Table 2-16, real personal income is expected to increase at an average annual rate of 2.6 percent over the forecast period from 2012 to 2037.
Table 2 - 16: Historical and Forecast Virginia Real Personal Income (Excluding Washington, DC – Arlington –Alexandria MSA)
Real Personal Income Year (Millions of 2005 USD) Actual 2000 $144,694 2001 $151,875 2002 $154,688 2003 $159,189 2004 $164,169 2005 $168,453 2006 $175,727 2007 $180,995 2008 $181,509 2009 $179,664 2010 $182,474 2011 $187,854 2012 $190,067 Forecast 2017 $211,653 2022 $241,132 2027 $275,228 2032 $314,828 2037 $360,493 Average Annual Growth 1990-2012 2.5% 2012-2017 2.2% 2017-2037 2.7% 2012-2037 2.6%
Source: Woods & Poole 2012 CEDDS
Virginia Air Transportation System Plan (VATSP) Update 63
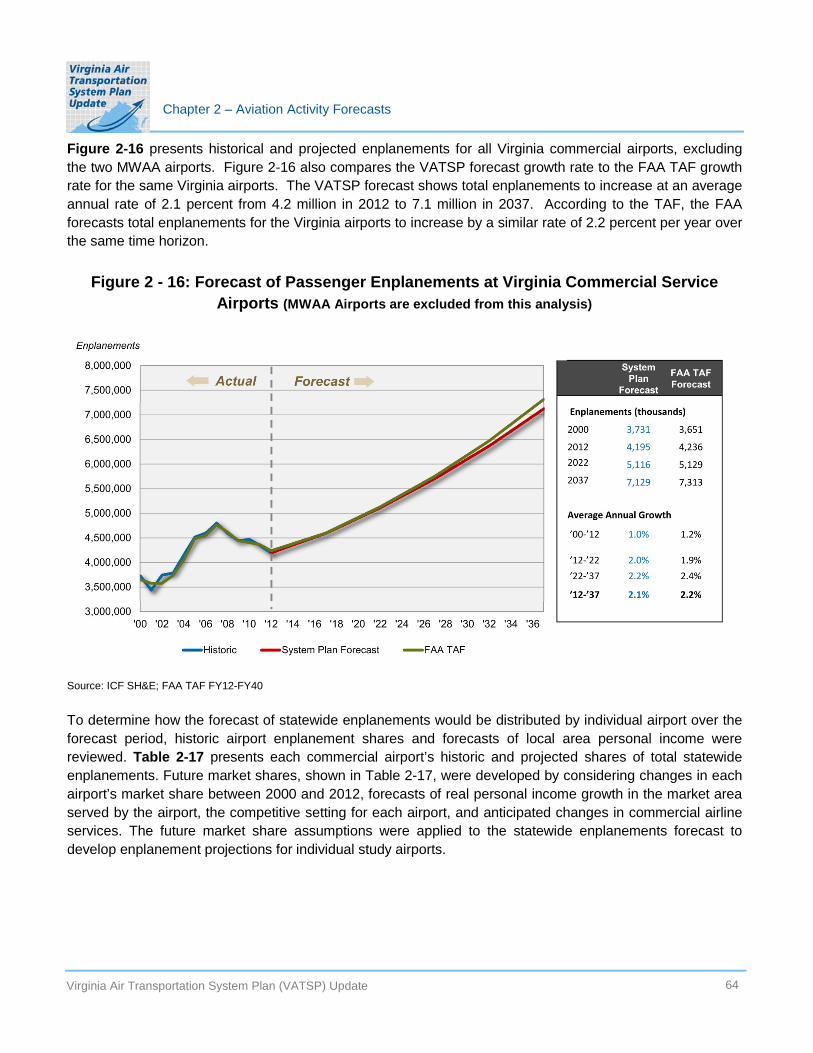
Chapter 2 – Aviation Activity Forecasts
Figure 2-16 presents historical and projected enplanements for all Virginia commercial airports, excluding the two MWAA airports. Figure 2-16 also compares the VATSP forecast growth rate to the FAA TAF growth rate for the same Virginia airports. The VATSP forecast shows total enplanements to increase at an average annual rate of 2.1 percent from 4.2 million in 2012 to 7.1 million in 2037. According to the TAF, the FAA forecasts total enplanements for the Virginia airports to increase by a similar rate of 2.2 percent per year over the same time horizon.
Figure 2 - 16: Forecast of Passenger Enplanements at Virginia Commercial Service Airports (MWAA Airports are excluded from this analysis)
Source: ICF SH&E; FAA TAF FY12-FY40
To determine how the forecast of statewide enplanements would be distributed by individual airport over the forecast period, historic airport enplanement shares and forecasts of local area personal income were reviewed. Table 2-17 presents each commercial airport’s historic and projected shares of total statewide enplanements. Future market shares, shown in Table 2-17, were developed by considering changes in each airport’s market share between 2000 and 2012, forecasts of real personal income growth in the market area served by the airport, the competitive setting for each airport, and anticipated changes in commercial airline services. The future market share assumptions were applied to the statewide enplanements forecast to develop enplanement projections for individual study airports.
Virginia Air Transportation System Plan (VATSP) Update 64
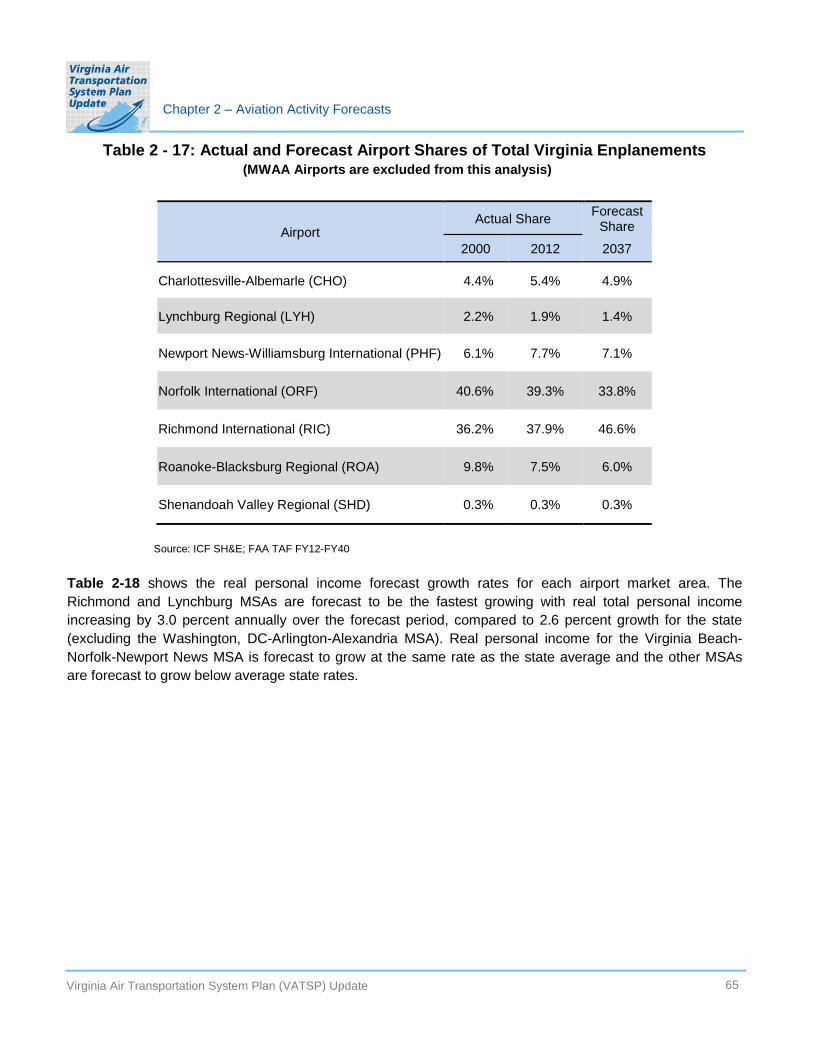
Chapter 2 – Aviation Activity Forecasts
Table 2 - 17: Actual and Forecast Airport Shares of Total Virginia Enplanements (MWAA Airports are excluded from this analysis)
Airport Actual Share Forecast
Share
2000 2012 2037
Charlottesville-Albemarle (CHO) 4.4% 5.4% 4.9%
Lynchburg Regional (LYH) 2.2% 1.9% 1.4%
Newport News-Williamsburg International (PHF) 6.1% 7.7% 7.1%
Norfolk International (ORF) 40.6% 39.3% 33.8%
Richmond International (RIC) 36.2% 37.9% 46.6%
Roanoke-Blacksburg Regional (ROA) 9.8% 7.5% 6.0%
Shenandoah Valley Regional (SHD) 0.3% 0.3% 0.3%
Source: ICF SH&E; FAA TAF FY12-FY40
Table 2-18 shows the real personal income forecast growth rates for each airport market area. The Richmond and Lynchburg MSAs are forecast to be the fastest growing with real total personal income increasing by 3.0 percent annually over the forecast period, compared to 2.6 percent growth for the state (excluding the Washington, DC-Arlington-Alexandria MSA). Real personal income for the Virginia Beach-Norfolk-Newport News MSA is forecast to grow at the same rate as the state average and the other MSAs are forecast to grow below average state rates.
Virginia Air Transportation System Plan (VATSP) Update 65

Chapter 2 – Aviation Activity Forecasts
Table 2 - 18: Actual and Forecast Real Personal Income for Virginia Commercial Service Airport Market Areas
Real Personal Income by MSA (2005 USD, million)
Virginia Beach-Norfolk- Staunton-Richmond, Roanoke, Charlottesville, Lynchburg, MSA: Newport News, Virginia- Waynesboro, Virginia Virginia Virginia Virginia North Carolina Virginia
Year Airport: RIC ORF PHF ROA CHO LYH SHD
Actual 2012 $49,575 $63,345 $63,345 $11,100 $8,113 $8,160 $3,820
Forecast 2017 56,329 70,565 70,565 12,193 8,788 9,257 4,108 2022 65,487 80,247 80,247 13,716 9,773 10,767 4,522 2027 76,190 91,383 91,383 15,460 10,886 12,560 4,994 2032 88,782 104,236 104,236 17,455 12,136 14,712 5,532 2037 $103,500 $118,963 $118,963 $19,717 $13,526 $17,283 $6,139
Average Annual Growth 2012-2017 2.6% 2.2% 2.2% 1.9% 1.6% 2.6% 1.5% 2017-2037 3.1% 2.6% 2.6% 2.4% 2.2% 3.2% 2.0%
2012-2037 3.0% 2.6% 2.6% 2.3% 2.1% 3.0% 1.9%
Source: Woods & Poole 2012 CEDDS
Virginia Air Transportation System Plan (VATSP) Update 66

Chapter 2 – Aviation Activity Forecasts
Figures 2-17 through 2-23 show individual enplanement forecasts for Virginia’s commercial airports with the exception of the MWAA airports. These figures show historic enplanements and forecast enplanements for each airport, and comparisons to FAA forecasts from the TAF. These figures also show implied average annual rates of growth for the VATSP and the TAF forecasts. It should be noted that the TAF forecasts are for federal fiscal years ending September 30th. A brief discussion for each airport’s enplanement forecast follows.
Richmond International Airport – As shown in Figure 2-17, enplanements at Richmond International are forecast to increase from 1,590,000 in 2012 to 3,319,000 by 2037. The 2012-2037 average annual rate of growth implied in the VATSP enplanement forecast is 3.0 percent which is slightly lower than the TAF’s forecast growth rate of 3.3 percent.
Historic enplanement growth at Richmond International has also been strong at 1.4 percent per year from 2000 to 2012. New LCC service by AirTran and JetBlue, starting in 2005 and 2006 respectively, helped to offset substantial cuts by US Airways over the last decade. Enplanements at Richmond International peaked at 1,824,000 in 2007 and have declined slightly in recent years due to the economic recession and airlines’ tighter capacity control. The Richmond MSA is projected to have the fastest personal income growth in the state, and passenger traffic levels at Richmond International are expected to resume strong growth over the forecast period.
Figure 2 - 17: Actual and Forecast of Passenger Enplanements at Richmond Int. Airport
Source: ICF SH&E; FAA TAF FY12-FY40
Virginia Air Transportation System Plan (VATSP) Update 67

Chapter 2 – Aviation Activity Forecasts
Norfolk International Airport – Figure 2-18 shows the enplaned passenger forecast for Norfolk International. Enplanements at Norfolk International are projected to increase at an average annual rate of 1.5 percent from 1,650,000 in 2012 to 2,410,000 by 2037. The forecast rate of growth is higher than the FAA TAF projected growth rate of 0.8 percent.
Norfolk International is the larger of the two commercial airports serving the Virginia Beach-Norfolk-Newport News MSA. Historic enplanements at Norfolk International increased by an average 0.7 percent per year between 2000 and 2012, peaking at 1,942,000 in 2005. While US Airways, American, Delta and United have all implemented service cuts at Norfolk over the past decade, Southwest introduced service at the airport in 2001 and has expanded operations significantly. Southwest is the largest carrier at Norfolk International today, serving seven destinations (ATL, BNA, BWI, JAX, MCO, MDW and TPA) and accounting for close to 30 percent of scheduled seats. Average annual personal income growth for the Virginia Beach-Norfolk-Newport News MSA is forecast at 2.5 percent compared to 3.0 percent for the Richmond MSA. However, the Virginia Beach-Norfolk-Newport News MSA is projected to continue to exceed the Richmond MSA in terms of population and total personal income over the forecast period.
Figure 2 - 18: Actual and Forecast of Passenger Enplanements at Norfolk International Airport
Source: ICF SH&E; FAA TAF FY12-FY40
Virginia Air Transportation System Plan (VATSP) Update 68

Chapter 2 – Aviation Activity Forecasts
Newport News-Williamsburg International Airport – As shown in Figure 2-19, enplanements at Newport News-Williamsburg International are forecast to increase from 321,000 in 2012 to 507,000 by 2037. The average annual growth rate implied in the VATSP enplanement forecast between 2012 and 2037 is 1.8 percent, lower than the FAA TAF growth rate of 2.9 percent.
Historic enplanements growth at Newport News-Williamsburg International has been relatively strong at 2.8 percent per year from 2000 to 2012. Enplanements exceeded 500,000 in 2005 and peaked at 532,000 in 2010. However, the withdrawal of all AirTran services in February 2012 due to the Southwest/AirTran merger and network consolidation has severely impacted passenger levels. AirTran was the largest carrier at Newport News-Williamsburg International, providing over 40 percent of all scheduled seats. Following AirTran’s exit, Newport News-Williamsburg has nonstop service by US Airways Express, Delta Connection, Frontier and Allegiant to 5 destinations. Enplanements at the airport dropped to 321,000 in 2012 and have continued to decline through 2013.
The VATSP enplanements forecast for Newport News-Williamsburg shows a 1.9 percent average annual decline from 2012 to 2017 before a return to historic levels as shown in Table 2-19. The VATSP forecast projects a conservative recovery in enplanements to 507,000 enplanements by 2037, approaching previous peak enplanement levels the airport supported. The forecast assumes that, over the 25 year forecast period, Newport News may attract replacement services by other airlines with business models that involve serving secondary airports in multi-airport markets (for example Frontier and/or Allegiant).
Figure 2 - 19: Actual and Forecast of Passenger Enplanements at Newport News-Williamsburg International Airport
Source: ICF SH&E; FAA TAF FY12-FY40
Virginia Air Transportation System Plan (VATSP) Update 69

Chapter 2 – Aviation Activity Forecasts
Roanoke-Blacksburg Regional Airport – As shown in Figure 2-20, passenger enplanements for Roanoke-Blacksburg Regional Airport are forecast to increase from 314,000 in 2012 to 428,000 in 2037. The VATSP long-term forecast growth rate for the airport is 1.2 percent; the FAA TAF growth rate for the airport over the same time frame is also 1.2 percent.
Historic enplanements at Roanoke-Blacksburg Regional have decreased by an average 1.3 percent per year from 366,000 in 2000 to 314,000 in 2012. The airport is currently served by US Airways Express, Delta Connection, United Express and Allegiant. Forecast personal income average annual growth for the Roanoke MSA is 2.3 percent over the forecast period.
Figure 2 - 20: Actual and Forecast of Passenger Enplanements at Roanoke-Blacksburg Regional Airport
Source: ICF SH&E; FAA TAF FY12-FY40
Virginia Air Transportation System Plan (VATSP) Update 70

Chapter 2 – Aviation Activity Forecasts
Charlottesville-Albemarle Airport – The forecast of passenger enplanements for Charlottesville-Albemarle are shown in Figure 2-21. Enplaned passengers are forecast to grow from 227,000 in 2012 to 350,000 in 2037. In the VATSP forecast, enplanements at Charlottesville-Albemarle increase by 1.7 percent per year over the forecast period compared to the FAA TAF forecast growth rate of 2.7 percent.
Historic enplanements at Charlottesville grew by an average 2.7 percent per year from 2000 to 2012. Enplanements in 2012 represented a new peak, exceeding the previous peak of 195,000 in 2005. This strong historic passenger growth corresponded with strong economic growth in the Charlottesville MSA. The historic personal income average annual growth for the Charlottesville MSA was 3.4 percent from 1990 to 2012, the highest in the state. Forecast personal income growth in the Charlottesville MSA, however, is expected to drop to 2.1 percent per year over the forecast period.
Figure 2 - 21: Actual and Forecast of Passenger Enplanements at Charlottesville-Albemarle Airport
Source: ICF SH&E; FAA TAF FY12-FY40
Virginia Air Transportation System Plan (VATSP) Update 71

Chapter 2 – Aviation Activity Forecasts
Lynchburg Regional Airport – As shown in Figure 2-22, enplanements at Lynchburg Regional are projected to increase from 79,500 in 2012 to 96,300 by 2037. The average annual rate of growth implied in the VATSP enplanement projection between 2012 and 2037 is 0.8 percent, and the FAA TAF forecast growth rate for the same period is 1.5 percent.
Historic enplanements at Lynchburg Regional have decreased by an average 0.2 percent per year falling to 79,500 in 2012. US Airways Express service to Charlotte is the only service at the airport, following the discontinuation of United Express service in 2001 and Delta service in 2011.
Figure 2 - 22: Actual and Forecast of Passenger Enplanements at Lynchburg Regional Airport
Source: ICF SH&E; FAA TAF FY12-FY40
Virginia Air Transportation System Plan (VATSP) Update 72

Chapter 2 – Aviation Activity Forecasts
Shenandoah Valley Regional Airport – At Shenandoah Valley Regional, enplaned passengers (see Figure 2-23) are forecast to increase at an average rate of 1.0 percent per year, growing from 14,200 in 2012 to 18,400 in 2037. This VATSP forecast enplanement growth (at an average annual rate of 1.0 percent) is lower than the FAA TAF growth rate of 1.8 percent.
Historic enplanements at Shenandoah Valley Regional decreased by an average of 3.2 percent per year between 2000 and 2012. Enplanements peaked at 21,000 in 2000, but dropped below the 10,000 level for 2002 through 2009. In 2012 they returned to 1990 comparable levels. The only current service at the airport is an Essential Air Service (EAS) subsidized United Express service to Washington Dulles.
Figure 2 - 23: Actual and Forecast of Passenger Enplanements at Shenandoah Valley Regional Airport
Source: ICF SH&E; FAA TAF FY12-FY40
Virginia Air Transportation System Plan (VATSP) Update 73

Chapter 2 – Aviation Activity Forecasts
Figure 2-24 compares the historic average annual rate of growth in enplanements for each of the commercial airports to the implied average annual rate of growth from the VATSP projections. As shown, from 2000 to 2012 the average annual rate of growth for enplanements at Virginia’s commercial service airports was 1.0 percent. In comparison, the forecast growth rate over the long-term, 2012-2037 planning horizon is 2.1 percent. The historic period reflects several external shocks as well as a prolonged economic slowdown and structural changes in the airline industry. Over the forecast period, growth is projected to be more in line with expected economic growth.
Figure 2 - 24: Actual and Forecast Average Annual Enplanement Growth for Virginia Commercial Service Airports (MWAA Airports are excluded from this analysis)
Source: ICF SH&E
Table 2-19 presents forecast passenger enplanements for each of the Virginia airports, except for the MWAA Airports. Information on actual historic enplanements is also presented.
Virginia Air Transportation System Plan (VATSP) Update 74

Chapter 2 – Aviation Activity Forecasts
Table 2 - 19: Actual and Forecast Passenger Enplanements at Virginia Commercial Service Airports
Passenger Enplanements Year RIC ORF PHF ROA CHO LYH SHD Total
Actual 1990 931,337 1,345,407 149,896 340,388 131,287 90,813 13,902 3,003,030 1991 880,893 1,262,623 163,775 310,461 124,551 94,277 24,110 2,860,690 1992 947,523 1,268,532 162,063 319,625 150,817 87,814 13,421 2,949,795 1993 1,002,039 1,244,484 153,823 320,921 152,348 84,784 12,804 2,971,203 1994 1,101,461 1,682,705 162,006 362,256 155,392 88,926 10,273 3,563,019 1995 1,096,129 1,423,899 169,992 333,639 148,686 86,675 8,952 3,267,972 1996 1,082,375 1,380,789 182,733 321,672 141,898 82,645 10,690 3,202,802 1997 1,164,855 1,430,583 162,419 321,130 158,542 82,402 19,735 3,339,666 1998 1,241,588 1,429,023 161,481 331,131 161,008 87,815 18,338 3,430,384 1999 1,314,927 1,488,519 205,010 345,153 170,535 83,993 17,370 3,625,507 2000 1,351,925 1,516,361 229,381 365,503 165,416 81,010 21,025 3,730,621 2001 1,208,477 1,478,687 209,520 304,328 155,863 65,120 19,092 3,441,087 2002 1,186,841 1,732,123 297,203 299,039 173,543 52,699 6,633 3,748,081 2003 1,200,436 1,718,196 365,924 290,324 162,405 43,378 7,457 3,788,119 2004 1,252,384 1,889,108 458,839 310,689 183,037 57,742 7,703 4,159,502 2005 1,455,330 1,942,211 528,678 327,270 195,306 64,402 5,300 4,518,497 2006 1,647,655 1,851,832 527,121 327,463 183,501 59,271 5,337 4,602,180 2007 1,823,879 1,857,162 527,879 349,428 184,017 55,245 4,893 4,802,502 2008 1,750,875 1,774,602 524,393 314,282 168,969 54,831 7,681 4,595,633 2009 1,658,627 1,704,728 510,253 297,811 177,410 86,232 8,308 4,443,369 2010 1,660,876 1,666,233 531,503 315,516 195,964 93,771 10,267 4,474,130 2011 1,593,900 1,596,694 530,713 321,766 214,781 73,773 12,023 4,343,650 2012 1,589,727 1,649,856 321,165 313,564 227,300 79,502 14,181 4,195,295
Virginia Air Transportation System Plan (VATSP) Update 75

Chapter 2 – Aviation Activity Forecasts
Table 2 - 19: Actual and Forecast Passenger Enplanements at Virginia Commercial Service Airports (Continued)
Passenger Enplanements Year RIC ORF PHF ROA CHO LYH SHD Total
Forecast 2017 1,806,308 1,826,400 291,575 329,262 243,834 82,328 14,732 4,594,440 2022 2,099,987 1,961,368 334,878 351,733 266,449 86,227 15,549 5,116,191 2027 2,443,194 2,104,352 384,612 375,639 291,503 90,229 16,432 5,705,962 2032 2,847,014 2,254,864 441,733 401,099 319,364 93,664 17,375 6,375,114 2037 3,318,979 2,410,011 507,337 427,724 350,045 96,280 18,365 7,128,741 Average Annual Growth 1990-2012 3.1% 0.9% 5.3% -0.2% 2.9% -0.4% 0.3% 2.0% 2000-2012 2.4% 0.7% 6.1% -0.9% 3.3% 0.1% -2.9% 1.8% 2007-2012 -0.2% -2.3% -2.5% -1.2% 5.8% 8.3% 24.7% -0.9% 2012-2017 2.6% 2.1% -1.9% 1.0% 1.4% 0.7% 0.8% 1.8% 2017-2037 3.1% 1.4% 2.8% 1.3% 1.8% 0.8% 1.1% 2.2% 2012-2037 3.0% 1.5% 1.8% 1.2% 1.7% 0.8% 1.0% 2.1%
Source: 2003 VATSP; Airport Records; U.S. DOT T100 and ICF SH&E Note: Data excludes MWAA airports
Virginia Air Transportation System Plan (VATSP) Update 76

Chapter 2 – Aviation Activity Forecasts
2.3.3 Enplanement Forecasts for Ronald Reagan Washington National and Washington Dulles International
For Ronald Reagan Washington National and Washington Dulles International Airports, existing forecasts developed by Metropolitan Washington Airports Authority (MWAA) and the FAA as part of the TAF were adopted for use in the VATSP Update. Figure 2-25 shows the actual and forecast enplanements for Ronald Reagan Washington National based on the TAF. As shown, the FAA anticipates that the airport’s enplanements will increase from their 2012 level of 9,155,000 to 12,359,000 in 2037. The TAF forecast implies an average annual growth rate of 1.2 percent for enplaned passengers at Ronald Reagan Washington National.
Figure 2 - 25: Actual and Forecast Passenger Enplanements at Ronald Reagan Washington National Airport
Note: Historic enplanements as reported in TAF Source: FAA TAF FY12-FY40
For Washington Dulles International Airport the VATSP Update adopted MWAA’s existing short-term forecast through 2017 and forecast growth rates from the FAA TAF for 2018 to 2037. Figure 2-26 presents the actual and forecast enplanements for Washington Dulles International. As shown, enplanements at Washington Dulles are forecast to grow at an average annual rate of 2.6 percent from 11,172,000 in the base year to 21,306,000 in 2037.
Virginia Air Transportation System Plan (VATSP) Update 77

Chapter 2 – Aviation Activity Forecasts
Figure 2 - 26: Actual and Forecast Passenger Enplanements at Washington Dulles International Airport
Source: MWAA Airport Records; Leigh Fisher Dulles Forecast (September 2012); TAF FY2012-FY2040 forecast growth rates for 2017-2037
Table 2-20 shows the actual and forecast enplanements for Ronald Reagan Washington National and Washington Dulles International airports.
Virginia Air Transportation System Plan (VATSP) Update 78
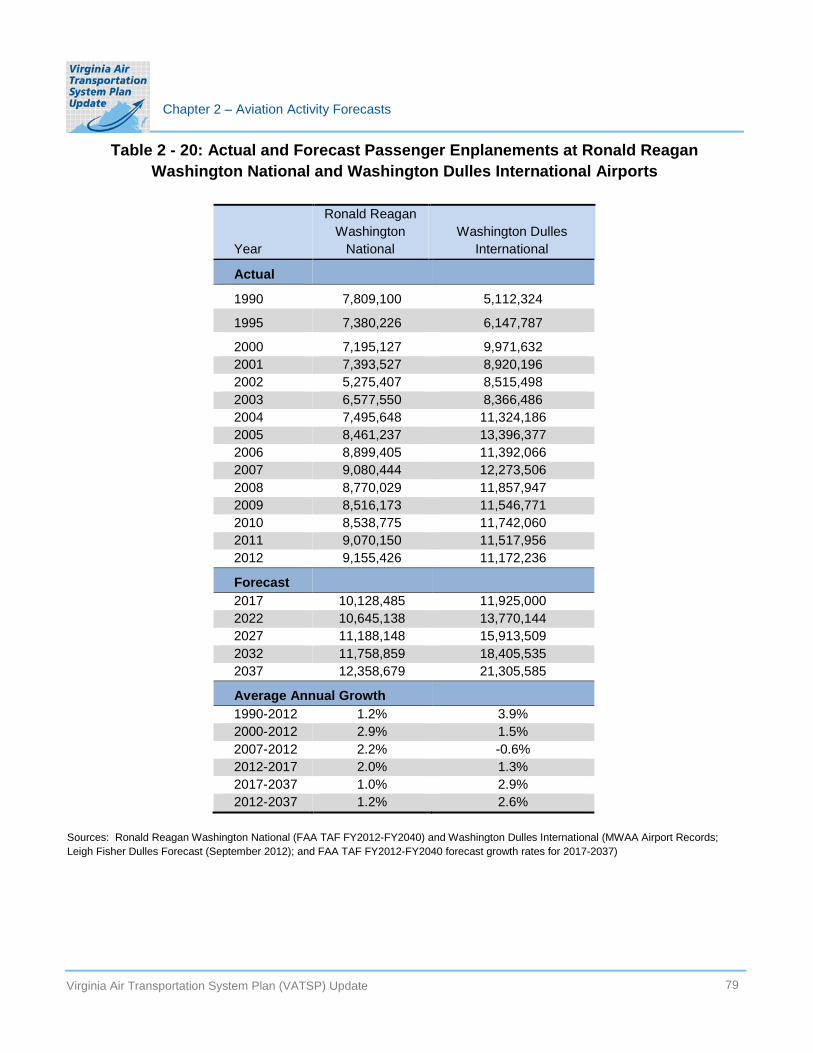
Chapter 2 – Aviation Activity Forecasts
Table 2 - 20: Actual and Forecast Passenger Enplanements at Ronald Reagan Washington National and Washington Dulles International Airports
Ronald Reagan Washington Washington Dulles
Year National International
Actual
1990 7,809,100 5,112,324
1995 7,380,226 6,147,787
2000 7,195,127 9,971,632 2001 7,393,527 8,920,196 2002 5,275,407 8,515,498 2003 6,577,550 8,366,486 2004 7,495,648 11,324,186 2005 8,461,237 13,396,377 2006 8,899,405 11,392,066 2007 9,080,444 12,273,506 2008 8,770,029 11,857,947 2009 8,516,173 11,546,771 2010 8,538,775 11,742,060 2011 9,070,150 11,517,956 2012 9,155,426 11,172,236
Forecast 2017 10,128,485 11,925,000 2022 10,645,138 13,770,144 2027 11,188,148 15,913,509 2032 11,758,859 18,405,535 2037 12,358,679 21,305,585
Average Annual Growth 1990-2012 1.2% 3.9% 2000-2012 2.9% 1.5% 2007-2012 2.2% -0.6% 2012-2017 2.0% 1.3% 2017-2037 1.0% 2.9% 2012-2037 1.2% 2.6%
Sources: Ronald Reagan Washington National (FAA TAF FY2012-FY2040) and Washington Dulles International (MWAA Airport Records; Leigh Fisher Dulles Forecast (September 2012); and FAA TAF FY2012-FY2040 forecast growth rates for 2017-2037)
Virginia Air Transportation System Plan (VATSP) Update 79

Chapter 2 – Aviation Activity Forecasts
When all commercial airports in Virginia are considered, the VATSP Update projects total enplanements to increase from 24,523,000 in 2012 to 40,793,000 in 2037. Figure 2-27 shows actual and forecast statewide enplanements and compares the VATSP forecast to the FAA TAF projection. As shown, the VATSP forecast for 2037 is slightly lower than the FAA TAF forecast of 42,262,000 enplanements. The average annual rate of growth for enplanements is similar; the VATSP forecast 2.1 percent annual growth compared to 2.2 percent in the TAF.
Figure 2 - 27: Actual and Forecast Passenger Enplanements at All Virginia Commercial Service Airports
Sources: DCA - MWAA Airport Records; Leigh Fisher Dulles Forecast (September 2012); TAF FY2012-FY2040 forecast growth rates for 20172037; IAD - FAA TAF FY12-FY40; Other Virginia - ICF SH&E.
2.3.4 Forecast of Commercial Aircraft Operations
As part of the VATSP, forecasts of passenger aircraft operations were developed for each of the system airports (excluding MWAA airports) based on the enplanement forecasts for each airport and assumptions regarding changes in the commercial passenger aircraft fleet mix and passenger load factors (the percentage of seats filled with passengers). Assumptions for each airport were based on the historic types of passenger aircraft serving each of the commercial airports; on historical passenger load factors; and on anticipated trends in airline fleet mixes and load factor performance.
Future passenger airline fleet mix trends include the continued reduction of small turboprop and regional jet aircraft (with 50 or fewer seats) from the operating fleet. The VATSP forecast assumes that these aircraft will continue to be replaced with larger more fuel efficient aircraft with seating capacities between 70 and 90 passengers. Another trend that will influence passenger aircraft operations at the larger airports is a slight increase in the size of narrow-body aircraft in the commercial airline fleet; this trend is expected to continue
Virginia Air Transportation System Plan (VATSP) Update 80
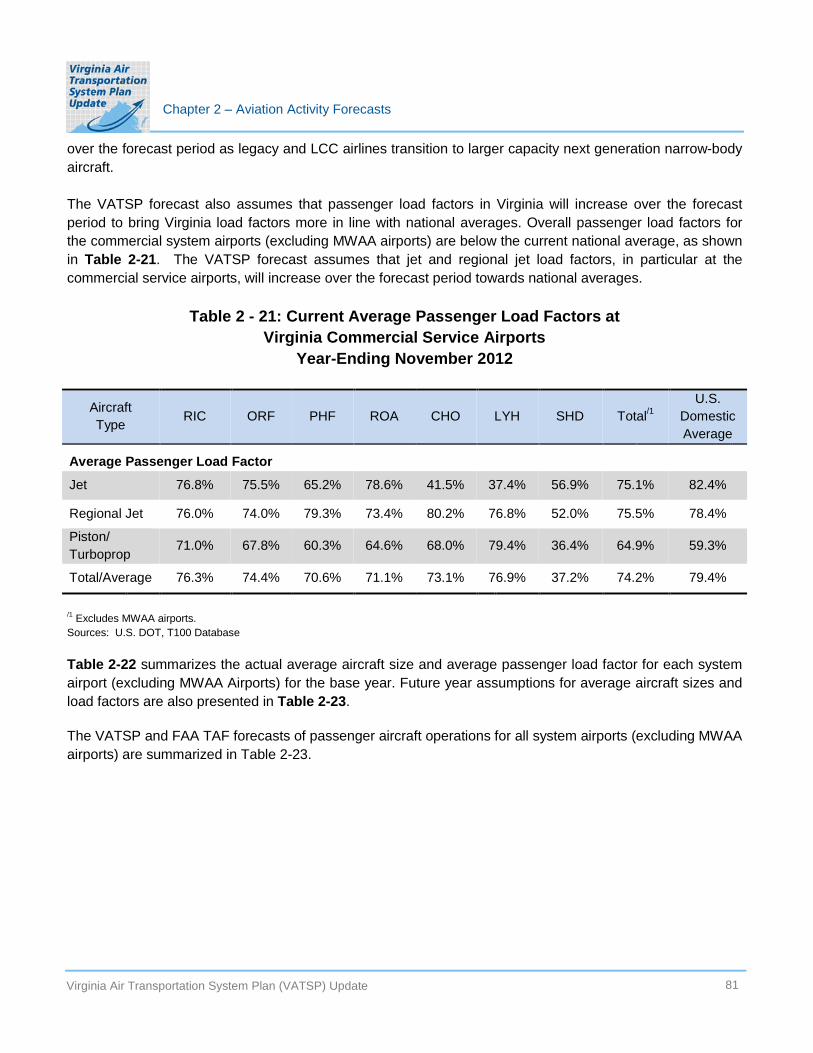
Chapter 2 – Aviation Activity Forecasts
over the forecast period as legacy and LCC airlines transition to larger capacity next generation narrow-body aircraft.
The VATSP forecast also assumes that passenger load factors in Virginia will increase over the forecast period to bring Virginia load factors more in line with national averages. Overall passenger load factors for the commercial system airports (excluding MWAA airports) are below the current national average, as shown in Table 2-21. The VATSP forecast assumes that jet and regional jet load factors, in particular at the commercial service airports, will increase over the forecast period towards national averages.
Table 2 - 21: Current Average Passenger Load Factors at Virginia Commercial Service Airports
Year-Ending November 2012
Aircraft Type RIC ORF PHF ROA CHO LYH SHD
U.S. Domestic Average
Average Passenger Load Factor
Jet 76.8% 75.5% 65.2% 78.6% 41.5% 37.4% 56.9% 75.1% 82.4%
Regional Jet 76.0% 74.0% 79.3% 73.4% 80.2% 76.8% 52.0% 75.5% 78.4%
Piston/ Turboprop
71.0% 67.8% 60.3% 64.6% 68.0% 79.4% 36.4% 64.9% 59.3%
Total/Average 76.3% 74.4% 70.6% 71.1% 73.1% 76.9% 37.2% 74.2% 79.4%
Total/1
/1 Excludes MWAA airports. Sources: U.S. DOT, T100 Database
Table 2-22 summarizes the actual average aircraft size and average passenger load factor for each system airport (excluding MWAA Airports) for the base year. Future year assumptions for average aircraft sizes and load factors are also presented in Table 2-23.
The VATSP and FAA TAF forecasts of passenger aircraft operations for all system airports (excluding MWAA airports) are summarized in Table 2-23.
Virginia Air Transportation System Plan (VATSP) Update 81

Chapter 2 – Aviation Activity Forecasts
Table 2 - 22: Average Aircraft Size and Load Factor Assumptions for Virginia Commercial Service Airports 2012 to 2037
Year RIC ORF PHF ROA CHO LYH SHD Total/1
Average Passenger Aircraft Size Actual: 2012 76.5 83.1 65.6 51.3 43.6 49.7 34.4 70.7 Forecast: 2017 79.5 84.7 69.7 52.3 45.7 50.5 34.4 72.8
2022 82.4 87.8 73.8 53.4 47.9 51.3 34.4 75.7 2027 85.2 90.8 78.1 54.4 50.0 52.1 34.4 78.6 2032 88.0 93.8 82.3 55.5 52.1 52.9 34.4 81.4 2037 90.7 96.7 86.7 56.5 54.2 53.6 34.4 84.2
Average Passenger Load Factor Actual: 2012 76.3% 74.4% 70.6% 71.1% 73.1% 76.9% 37.2% 73.7% Forecast: 2017 76.7% 75.0% 71.0% 71.4% 73.1% 77.1% 37.3% 74.6%
2022 77.1% 75.5% 71.5% 71.7% 73.2% 77.3% 37.2% 75.1% 2027 77.4% 76.0% 72.1% 72.0% 73.2% 77.6% 37.2% 75.6% 2032 77.8% 76.6% 72.8% 72.3% 73.3% 77.8% 37.2% 76.1% 2037 78.2% 77.1% 73.7% 72.7% 73.3% 78.0% 37.2% 76.6%
/1 Excludes MWAA airports
Virginia Air Transportation System Plan (VATSP) Update 82

Chapter 2 – Aviation Activity Forecasts
Table 2 - 23: Actual and Forecast Commercial Passenger Aircraft Operations at Virginia Airports (Metropolitan Washington Airports Authority (MWAA) Airports are excluded from this analysis)
Year RIC ORF PHF ROA CHO LYH SHD Total \1
VATSP Update Actual: 2012 53,994 54,299 14,572 17,631 14,245 4,155 2,636 161,532
Forecast: 2017 59,258 57,541 11,787 17,627 14,578 4,231 2,738 167,760 2022 66,141 59,181 12,687 18,377 15,212 4,350 2,890 178,838 2027 74,033 60,941 13,666 19,163 15,925 4,470 3,054 191,252 2032 83,153 62,796 14,728 19,987 16,727 4,558 3,230 205,179 2037 93,589 64,654 15,879 20,829 17,607 4,603 3,414 220,575
Average Annual Growth 2012-2017 1.9% 1.2% -4.2% 0.0% 0.5% 0.4% 0.8% 0.8% 2017-2037 2.3% 0.6% 1.5% 0.8% 0.9% 0.4% 1.1% 1.4% 2012-2037 2.2% 0.7% 0.3% 0.7% 0.9% 0.4% 1.0% 1.3%
FAA TAF Average Annual Growth
2012-2017 2.1% 0.2% 1.8% 0.6% 1.4% 0.5% 0.0% 1.1% 2017-2037 3.7% 0.5% 1.8% 0.6% 1.4% 0.5% 0.0% 2.0% 2012-2037 3.3% 0.4% 1.8% 0.6% 1.4% 0.5% 0.0% 1.9%
Note: FAA TAF growth rates based on Air Carrier and Commuter/Air Taxi operations. /1 Excludes MWAA airports Source: ICF SH&E; FAA Aerospace Forecast FY12-FY32; U.S. DOT, T100; FAA TAF FY12-FY40
Virginia Air Transportation System Plan (VATSP) Update 83

Chapter 2 – Aviation Activity Forecasts
The following sections describe the forecasts of passenger aircraft operations for each study airport.
Richmond International Airport – In 2012, there were 54,000 commercial passenger aircraft operations reported at Richmond International. The VATSP Update projects the airport’s passenger aircraft operations to increase to 93,600 by 2037. The average annual rate of growth implied in the VATSP forecast is 2.2 percent between 2012 and 2037. For the same time frame, the FAA TAF shows that commercial operations at Richmond will increase at a higher average annual rate of 3.3 percent. The average seating capacity of commercial aircraft serving the airport in 2012 was 77 seats. The VATSP expects that this seating capacity will increase to 91 by 2037, as shown in Table 2-22. In 2012, the average load factor for all passenger aircraft departing the airport was 76.3 percent. By 2037, the average load factor is expected to increase to 78.2 percent.
Norfolk International Airport – There were 54,300 commercial passenger aircraft operations at Norfolk International Airport in 2012. The airport’s passenger aircraft operations are forecast to increase to 64,700 by 2037 at an average annual rate of 0.7 percent. The FAA TAF shows a lower forecast average annual growth of 0.4 percent for commercial operations at Norfolk. As shown in Table 2-22, the average seating capacity of commercial aircraft serving the airport is assumed to increase from 83 seats in 2012 to 97 seats by 2037. Norfolk’s average load factor is assumed to increase from 74.4 percent in 2012 to 77.1 percent by 2037.
Newport News/Williamsburg International Airport – In 2012, there were 14,600 commercial passenger aircraft operations at the Newport News/Williamsburg Airport. The airport’s passenger aircraft operations are forecast to increase to 15,900 by 2037 at an average annual rate of 0.3 percent. For the same time frame, the FAA TAF predicts that commercial operations will increase at a higher average annual rate of 1.8 percent. The VATSP forecast assumes that the average seating capacity of commercial aircraft serving the airport will increase from 66 seats in 2012 to 87 seats by 2037 (see Table 2-22). The average load is assumed to increase from 70.6 percent in 2012 to 73.7 percent in 2037.
Roanoke-Blacksburg Regional Airport – In 2012, Roanoke-Blacksburg Regional’s total commercial passenger aircraft operations were reported at 17,600. In the VATSP Update, the airport’s passenger aircraft operations are forecast to increase to 20,800 by 2037. The average annual rate of growth implied in the VATSP forecast is 0.7 percent between 2012 and 2037. For the same time frame, as part of the TAF, the FAA forecasts Roanoke-Blacksburg Regional’s commercial operations to increase at a similar average annual rate of 0.6 percent. As shown in Table 2-22, the average seating capacity of commercial aircraft serving the airport is assumed to increase from 51 seats in 2012 to 57 seats by 2037. Roanoke’s average load factor for all passenger aircraft departing the airport is expected to increase from 71.1 percent in the base year to 72.7 percent by 2037.
Charlottesville-Albemarle Airport – In 2012, the Charlottesville-Albemarle Airport handled 14,200 commercial passenger aircraft operations. The VATSP Update projects the airport’s passenger aircraft operations to increase to 17,600 by 2037. The average annual rate of growth implied in the VATSP forecast is 0.9 percent between 2012 and 2037. The FAA TAF predicts a higher growth rate of 1.4 percent per year for commercial airline aircraft operations at Charlottesville. As shown in Table 2-22, the VATSP forecast assumes that the average seating capacity of commercial aircraft serving the airport will grow from 44 seats
Virginia Air Transportation System Plan (VATSP) Update 84

Chapter 2 – Aviation Activity Forecasts
in 2012 to 54 seats by 2037. In 2012, the average load factor at Charlottesville was 73.1 percent. By 2037, the average load factor is expected to increase slightly to 73.3 percent.
Lynchburg Regional Airport – There were 4,160 commercial passenger aircraft operations at Lynchburg in the study base year. The VATSP Update forecast shows the airport’s passenger aircraft operations increasing to 4,600 by 2037. The average annual rate of growth implied in the VATSP forecast is 0.4 percent between 2012 and 2037. For the same time frame, the FAA anticipates that commercial operations at Lynchburg will increase at an average annual rate of 0.5 percent. As shown in Table 2-22, the VATSP forecast assumes that the average aircraft size increases from 50 seats in 2012 to 54 by 2037. In 2012, the average load factor for all passenger aircraft departing the airport was 76.9 percent. By 2037, the average load factor is assumed to increase to 78.0 percent.
Shenandoah Valley Regional Airport – The Shenandoah Valley Regional Airport accommodated 2,600 commercial passenger aircraft operations in the base year. The VATSP projects the airport’s passenger aircraft operations to increase to 3,400 by 2037 at an average annual growth rate of 1.0 percent. For the same time frame, the FAA anticipates that commercial operations at Shenandoah Valley will not increase. As shown in Table 2-22, The VATSP forecast assumes that the airport’s average aircraft size of 34 seats remains constant over the forecast period. In 2012, the average load factor for all passenger aircraft departing the airport was 37.2 percent and this percent is expected to remain unchanged through 2037.
Figure 2-28 provides a summary of projected passenger aircraft operations for all commercial service study airports, excluding MWAA airports. In 2012, these commercial airports in Virginia accommodated 161,500 commercial passenger aircraft operations. The VATSP Update forecasts total passenger aircraft operations for the non-Washington airports to increase at an average annual rate of 1.3 percent and reach 220,600 operations by 2037. Over the same time period, the FAA forecasts that the combined commercial airline operations at these airports will increase by 1.9 percent per year. The average seating capacity of all commercial service aircraft serving these study airports in 2012 was 71 seats. The VATSP Update assumes that the average seating capacity will increase to 84 by 2037. The VATSP Update also assumes that the average load factor for all passenger aircraft increases from 73.7 percent in the base year to 76.6 percent by 2037.
Virginia Air Transportation System Plan (VATSP) Update 85

Chapter 2 – Aviation Activity Forecasts
Figure 2 - 28: Actual and Forecast Passenger Aircraft Operations at All Virginia Commercial Service Airports (MWAA Airports are excluded from this analysis)
Source: ICF SH&E; FAA Aerospace Forecast FY12-FY32; U.S. DOT, T100; FAA TAF FY12-FY40
Virginia Air Transportation System Plan (VATSP) Update 86

Chapter 2 – Aviation Activity Forecasts
2.3.5 Commercial Aircraft Operations Forecast for Ronald Reagan Washington National and Washington Dulles International Airports
As with commercial passenger enplanements forecast, the VATSP Update adopted existing commercial aircraft operations (including aircraft operations recorded by the FAA Towers as Air Taxi) forecasts for Ronald Reagan Washington National and Washington Dulles International airports. Figures 2-29 and 2-30 present the forecasts of commercial aircraft operations for these two airports.
Figure 2 - 29: Actual and Forecast Commercial Airline Operations at Ronald Reagan Washington National Airport
Note: Includes Air Carrier and Air Taxi operations (represents passenger aircraft operations only)
Source: FAA TAF FY12-FY40
Virginia Air Transportation System Plan (VATSP) Update 87

Chapter 2 – Aviation Activity Forecasts
Figure 2 - 30: Actual and Forecast Commercial Airline Operations at Washington Dulles International Airport
Source: MWAA Airport Records; Leigh Fisher Dulles Forecast (September 2012); TAF FY2012-FY2040 forecast growth rates for 2017-2037
As shown in Figure 2-29, Ronald Reagan Washington National handled 280,200 commercial operations in the base year. The FAA forecasts commercial operations to increase by 0.1 percent annually over the forecast period and to reach 288,800 annual operations in 2037.
Figure 2-30 summarizes the base year and forecast airline operations at Washington Dulles International. In 2012, there were 269,000 annual commercial aircraft operations at Dulles International. According to the MWAA and FAA TAF projections, passenger aircraft operations are expected to increase at an average annual rate of 1.7 percent and to reach 411,000 annual operations in 2037.
Actual and forecast commercial aircraft operations for the Washington airports are also presented in Table 224.
Virginia Air Transportation System Plan (VATSP) Update 88

Chapter 2 – Aviation Activity Forecasts
Table 2 - 24: Actual and Forecast Commercial Aircraft Operations at Ronald Reagan Washington National and Washington Dulles International Airports
Ronald Reagan Washington Dulles Year Washington International National
1990 255,689 178,635
1995 262,014 251,365
2000 259,317 389,314 2001 263,781 327,609 2002 176,007 289,020 2003 247,302 259,945 2004 264,784 393,332 2005 274,038 434,750 2006 274,433 310,637 2007 274,419 317,578 2008 272,617 304,660 2009 269,369 291,577 2010 263,069 288,053 2011 279,099 280,196 2012 280,223 268,777 2017 291,583 278,300 2022 283,095 304,116 2027 280,752 334,318 2032 283,015 369,604 2037 288,789 410,777
Average Annual Growth 1990-2012 0.4% 1.9% 2000-2012 0.6% -3.0% 2007-2012 0.4% -3.3% 2012-2017 0.8% 0.7% 2017-2037 0.0% 2.0% 2012-2037 0.1% 1.7%
Source: Ronald Reagan Washington National (FAA TAF FY2012-FY2040) and Washington Dulles International (MWAA Airport Records; Leigh Fisher Dulles Forecast (September 2012); TAF FY2012-FY2040 forecast growth)
As shown in Figure 2-31, total commercial airline operations for all of Virginia’s commercial service airports, including the MWAA Airports, are forecast to increase from 710,500 in the base year to 920,100 in 2037. The implied growth in commercial aircraft operations for the commercial airport system is 1.0 percent per year.
Virginia Air Transportation System Plan (VATSP) Update 89

Chapter 2 – Aviation Activity Forecasts
Figure 2 - 31: Actual and Forecast Commercial Airline Operations (All VATSP Commercial Service Airports)
Sources: Washington Dulles International MWAA Airport Records; Leigh Fisher Dulles Forecast (September 2012); TAF FY2012-FY2040 forecast growth rates for 2017-2037); Ronald Reagan Washington National (FAA TAF FY12-FY40; Other Virginia - ICF SH&E)
2.4 Summary
Table 2-25 provides a summary of aviation demand projections prepared for the VATSP. Summaries for several of the demand indicators presented in this table have been discussed in previous sections of this chapter. Table 2-25 provides information that shows the distribution of based aircraft for system airports and the distribution of general aviation annual operations for the state system.
As shown in this table, total annual passenger enplanements are projected to increase from 24.5 million in 2012 to almost 40.8 million by 2037. While the average annual rate of increase for passenger aircraft operations is not expected to be as high, total commercial passenger aircraft operations are projected to increase from their 2012 level of 710,500 to 920,100 by the end of the forecast period in 2037. When general aviation and commercial passenger aircraft operations are combined, Virginia is projected to see a
Virginia Air Transportation System Plan (VATSP) Update 90

Chapter 2 – Aviation Activity Forecasts
growth in annual aircraft takeoffs and landings. Annual operations in both categories are expected to increase from their 2012 level of 2,170,800 to 2,675,900 by 2037.
Projections of demand presented in this chapter of the VATSP will be used to help establish future facility needs for system airports, to measure the system’s ability to adequately process annual operations, to determine the need for airport role changes, and to evaluate the system in terms of its future adequacy to meet Virginia’s transportation and economic needs.
Virginia Air Transportation System Plan (VATSP) Update 91

Chapter 2 – Aviation Activity Forecasts
Table 2 - 25: Summary of Aviation Demand Projections
2012 2017 2022 2027 2032 2037
Based Aircraft IAD/DCA 60 62 64 66 68 70 Other Commercial Service Airports 612 630 648 665 683 701 All General Aviation Airports 3,156 3,402 3,651 3,901 4,152 4,405 Total 3,828 4,094 4,363 4,632 4,903 5,176
Total Annual General Aviation Operations IAD/DCA 48,723 50,870 51,428 51,994 52,568 53,151 Other Commercial Service Airports 324,018 323,850 328,056 329,090 335,952 339,641 All General Aviation Airports 1,087,525 1,157,510 1,211,847 1,264,916 1,316,933 1,367,868 Total 1,460,266 1,532,230 1,591,331 1,646,000 1,705,513 1,760,660
Commercial Enplanements IAD/DCA 20,327,662 22,053,485 24,415,282 27,101,657 30,164,394 33,664,264 Other Commercial Service Airports 4,195,295 4,594,440 5,116,191 5,705,962 6,375,114 7,128,741 Total 24,522,957 26,647,925 29,531,473 32,807,619 36,539,508 40,793,005
Commercial Passenger Aircraft Operations IAD/DCA 549,000 569,883 587,211 615,070 652,619 699,566 Other Commercial Service Airports 161,532 169,315 180,152 192,323 206,011 221,176 Total 710,532 739,198 767,363 807,393 858,630 920,742
Total Annual Operations All Airports 2,170,798 2,271,428 2,358,694 2,456,393 2,564,143 2,681,402
All forecasts are subject to uncertainty. The above forecast is based on information that is available as of the date of publication. Various factors, other than those included in the forecast models, can influence future aviation demand. Unexpected events may occur and some underlying forecast assumptions may not materialize. Therefore actual performance may differ from the forecasts presented in this chapter and these differences could be significant.
Virginia Air Transportation System Plan (VATSP) Update 92