Heat Transfer Enhancement by Using Nanofluids in Forced Convection Flows

24
2.1 ENVIRONMENTAL CONTROL - HEAT FLOWS
Heat, air and moisture flows are inseparable deal with them collectively under the term of
environmental control.
2.1.1 Mechanisms of heat flow
Basic equations for steady state transfer of heat, electricity, water or vapor through the material
are identical (Figure 1). The potential that govern these flows: i.e., absolute temperature, EMF
(voltage), water head, concentration of water vapor, each in relation to the resistance of the flow
gives us the density rate of the flow (the flux). Thus, the energy flux is directly proportional to the
temperature difference and inversely proportional to the thermal resistance of the material layer.
In turn, the resistance is directly proportional to the thickness of the material layer and inversely
proportional to the thermal conductivity (permeability) of material layer.
Figure 1: In the steady state condition, flow density rate is directly proportional to the potential
(here: absolute temperature) and inversely proportional to the resistance (here: thermal
resistance of the material layer).
Figure 2: In transient state condition, the difference in material storage over period of time (t) is
equal to the difference between the incoming and outgoing heat fluxes (Q).
For volumetric element dv (dv = dx.dy.dz) the heat flux is:

25
q = - grad T (1)
where: is the thermal conductivity coefficient, volumetric source or sink is “s”and during time
“dt” the change of the storage term as d(CT)dt = (c)dT/dt. Putting it together one may write that
the change in storage of the element dxdydz over time dt is equal the divergence of heat flux
plus work of heat source or sink “s”, i.e., as equation (2)
(c) dT/dt = div (- grad T) + s (2)
In discussions of heat transfer we use the following terminology:thermal conductivity coefficient,
W/(m K); thermal resistivity (inverse of ), r, (m K)/W; thermal resistance of the material layer,
R, (m2 K)/W, or thermal resistance of the building enclosure that is a sum of resistances of all
material layers; thermal conductance of the layer (inverse of R), , W/(m2 K); or thermal
transmittance of the wall, U-value, that is an inverse of the sum of the film surface resistances
and all material layers, W/(m2K); film surface coefficient, hs W/(m2K); or film surface resistance
(inverse), Rs, (m2K)/W; specific heat, c, (actually cp), J/(kg K), heat capacity of material volume,
C= c, J/(m3 K), surface emittance, (--), thermal diffusivity, D = c) , m2/s; thermal effusivity,
b = ( c) ½, J/(m2s1/2K) and material density, ρ, kg/m3
There are three fundamental mechanisms of heat transfer: conduction (Figure 3), radiation
(Figure 4) and convection
Figure 3: Vibration of molecules transfers heat by conduction in the solid material from the end
with higher temperature to the end with lower temperature
Figure 4: Electromagnetic radiation can transfer heat through air or vacuum.
Mass flux of gas with the density (kg/m3) and the velocity v (m/s) is: qm = v, kg/(m2s) and the
total energy carried by the gas at constant pressure becomes q = cp T v , J/(m2s). Convective
air flow can be either laminar or turbulent or both.
26
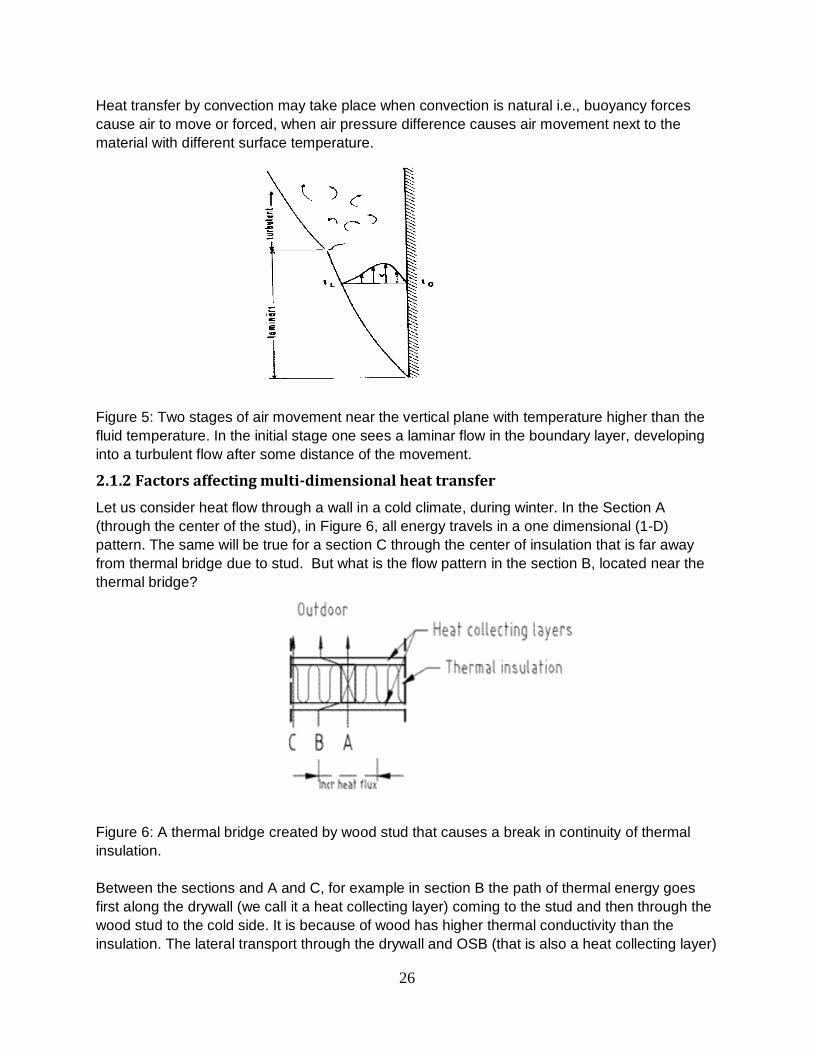
Heat transfer by convection may take place when convection is natural i.e., buoyancy forces
cause air to move or forced, when air pressure difference causes air movement next to the
material with different surface temperature.
Figure 5: Two stages of air movement near the vertical plane with temperature higher than the
fluid temperature. In the initial stage one sees a laminar flow in the boundary layer, developing
into a turbulent flow after some distance of the movement.
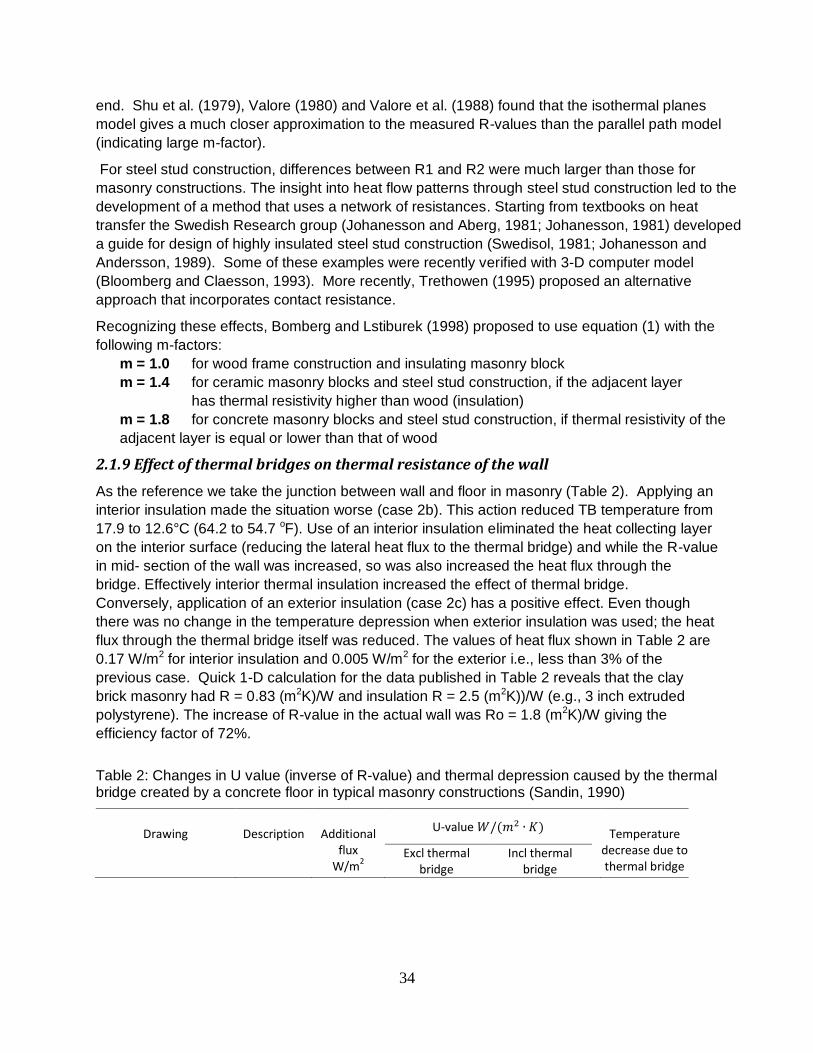
2.1.2 Factors affecting multi-dimensional heat transfer
Let us consider heat flow through a wall in a cold climate, during winter. In the Section A
(through the center of the stud), in Figure 6, all energy travels in a one dimensional (1-D)
pattern. The same will be true for a section C through the center of insulation that is far away
from thermal bridge due to stud. But what is the flow pattern in the section B, located near the
thermal bridge?
Figure 6: A thermal bridge created by wood stud that causes a break in continuity of thermal
insulation.
Between the sections and A and C, for example in section B the path of thermal energy goes
first along the drywall (we call it a heat collecting layer) coming to the stud and then through the
wood stud to the cold side. It is because of wood has higher thermal conductivity than the
insulation. The lateral transport through the drywall and OSB (that is also a heat collecting layer)

27
will take place as long as the thermal resistance of the path B is smaller than that through the
section C. Increased heat flow causes temperature depression on a part of the wall surface that
is denoted as the range of thermal bridge.
2.1.3 Effect of heat collecting layers
Figures 7 and 8 expand our understanding of the role of heat collecting layers. Figure 7 shows
that the range of a thermal bridge becomes wider if a heat collecting/conductive layer is
adjacent to the thermal bridge. Figure 8 shows a precast concrete panel with 50-mm (2 inch)
thick insulation placed 50 mm from the interior and 100 mm (4 inch) from the exterior surfaces
of the panel. The joint between two panels constitutes a 60 mm (2 and 3/8 inch) break in the
thermal insulation layer. To calculate thermal resistance of the wall we would like to use a
simplified method called “parallel flow method”. With input of R-value through the center of the
thermal bridge and through the center of insulation span (sections A and C in Figure 6) this
method calculates area-weighted R-value. With other words, each of these two areas is treated
as if they had 1-D flow and there was no heat exchange between them.
The other model, called “isothermal planes method” assumes that each material layer conducts
laterally as much heat as its property allow and it surface has the same temperature in the cross
section thought thermal bridge as through the insulation field. The parallel flow method gives the
lowest value of the heat flow and therefore overestimates the thermal resistance, while the
isothermal planes method presents the other extreme case and underestimates the result. The
actual result is always between these two cases. Such an approach with “manual calculations”
of resistance of inhomogeneous components was also adopted in European standard EN-ISO
6946.
Looking at Figure 8, we may ask two questions, namely
what is the imaginary width of thermal insulation break should one add to the real case,
so that the parallel heat flow model would give the same result as the multi-dimensional
analysis, and
how would this be affected if the position of insulation within the cross-section of the wall
was changed
Figure 7: A range of the thermal bridge, Zi, without and with heat collecting layer
To answer these two questions, results of several finite difference calculations are shown in
Figure 9 that generalizes the case shown in Figure 8. For x=0, the insulation is placed on the

28
interior side, for x=1 (100% of the thickness) it is placed on the exterior. The middle curve in
Figure 9 represents the combined thickness of both layers being 15 cm (6 inch).
A 60 mm (2 3/8 in) wide gap in insulation on a 3 m (10 ft) span represents only 2% area. Yet,
Figure 9 shows an increase of 90 mm bringing the correction for thermal bridge effect to 5% of
the area that must be replaced by R-value of the thermal bridge. Figure 9 shows also the effect
of insulation placement. The correction is as large as 120 mm (4 ¾ inch) i.e. 6% if the insulation
was placed in the middle of the wall. In such a case, if one wanted to use a simple correction
based on the surface areas to estimate the actual effect of the thermal bridge, one must use
180 mm (7 ¼ inch) insulation break not the 60 mm (2 3/8 inch) that was shown on the design
drawings!
Figure 8: Effect of placement of the insulation within the wall (Bomberg and Pogorzelski, 1962)
Figure 9: Distance X, to expand the width of the thermal bridge for use of the parallel heat flow
model
Figure 9 showed that the same level of insulation has different effects on thermal performance
of wall depending on the location of this insulation. This issue was also studied by Berthier
(1960); who compared placement of thermal insulation on warm side (a) or cold side (b) of the

29
width of the thermal break. The latter research is shown in Figure 10 in the range of 7.5 cm (3
inch) to 45 cm (18 inch) with two intermediate steps between.
2.1.4 Effect of insulation placement
Results with insulation placed on the cold side of the wall (series b) show that reduction of the
wall internal surface temperature is larger when width of the thermal bridge increases.
Temperature depression was 7°C for 75-mm gap but it has increased to 9°C at 150-mm gap
and to 13°C at wider gaps. Corresponding temperature depressions in the series a), with the
insulation on the warm side of the wall, are 10.2°C for the first, 11°C for the second gaps and
13°C for gaps 225 mm or larger. Evidently with gaps of 225-mm (9 inch) or more, the placement
of insulation did not make any difference. Yet, with smaller gaps, which are more likely to occur
in the practice, placement of insulation on the outside is clearly preferred.
While thermal bridges in prefabricated concrete panels are expected to have a large impact on
thermal performance of the wall; results of the similar research performed on wood construction
by Ossowiecki (1964) and shown in Figure 11 are surprising. Temperature on the insulation
surface was 14.6°C and on thermal bridge surfaces varied from 10°C (50mm) to 11°C (20 mm).
Series b), where cement board and drywall were applied, showed only a small change in the
middle of the insulation (0.2°C). Yet the presence of heat collecting layers increased the thermal
bridge temperatures in the range from 0.6 to 1.1°C.
Also the series c) where an insulation material was used instead of gypsum board showed a
significant increase of temperature on the thermal bridge surfaces. Replacing drywall with the
Figure 10: Effect of break in polystyrene insulation on temperatures of the concrete panel; test conditions: indoor 30 to 31oC; outdoor –5 to - 6oC, one case 1.8oC (from Berthier, 1960).

30
same thickness of porous fiberboard increased temperatures from 2 to 2.5°C (see series c).
Using 25-mm thick layer of the same fiberboard increased temperatures on thermal bridge from
3.5 to 4°C (Ossowiecki, 1964).
Figure 11: Temperature profiles measured on wood-frame wall with 40 mm expanded
polystyrene. The heat collecting layers are: (a) none, (b) outside cement board, inside drywall,
(c) outside cement board, inside porous fiberboard (insulating sheet) Test conditions: 18 and –
20°C.
Figure 11 shows that to avoid condensation, either conductive or insulating materials can be
used in design of building enclosures. The conductive layers will draw the thermal energy from
elsewhere and deliver it to the point of thermal depression; the insulating layer will reduce the
lateral transport and increase the thermal resistance of the wall. While the conductive layer may
increase the overall heat losses, it can be efficient in reducing risk for the surface condensation.
This approach is often used in designing curtain walls and window frames. If the use of a
thermal break does not eliminate the risk for condensation one may use a conductive layer on
the warm side. By locating on the warm side a heat collecting layer with a much larger area of

31
that on the cold side, one may increases the temperature on the inner side of the thermal
bridge.
Figure 9, considering an increase in heat transfer showed that placing insulation on the warm
side is preferred. Figures 10 and 11, dealing with temperature depression cause by the thermal
bridge showed that exterior placement of thermal insulation is preferred. Indeed, these two
different aspects of thermal bridge will always need to be reconciled.
2.1.5 Effects of boundary conditions and corners
Consideration must also be given to the interaction of radiation and convection at the surface of
thermal bridge (film resistance on the surface). An example of such interaction is shown in
Figure 13. Despite the fact that the wall is homogenous, conditions of heat transfer in the corner
are different. Firstly, the surface film coefficient is smaller because the view factor for radiation
in the corner is smaller than on a clear wall. Secondly, the convective air currents in the corner
are also smaller. Thirdly, the surface area on the exterior is larger than on the interior of the
wall. The temperature on interior surface measured from the corner to ½ m (1.5 ft) is shown in
Figure 13. These measurements were performed under actual field conditions with outdoor
temperature about – 7°C, and indoor temperature of 20°C.
One may observe that the North wall (right side of the corner) had slightly higher surface
temperature (13.5 °C), than the West wall (12.8 °C). The temperature in the corner dropped
down to 8.5°C i.e. depression of 5 degree comparing to the center of the North wall. (Note: The
difference in thermal performance of walls with different orientation is also affected by
differences in long wave radiation, i.e. radiation between the wall surface and environment.
2.1.6 The better insulation, the higher de-rating effect of the thermal bridge
The effect of increased thermal insulation is seldom recognized. Figure 14 illustrates that the
higher the thermal insulating value of the wall, the larger is the relative impact of the thermal
West side North side
Figure 13: Temperature profiles measured on the interior of a homogeneous wall (Ossowiecki,1964)

32
bridge. Walls with 0.5, 1.0, 1.5 and 2.0 percent of voids were filled with blown mineral fiber
insulation having different thermal properties (McCaa et al, 1987).
Figure 14 shows that for 0.5 percent of voids for wall with R14 the reduction was about 5
percent while for wall R16 the same void fraction resulted in 10% reduction. Similarly the effect
of wood framing on average thermal resistance of the wood frame wall varies from 16 percent
for cavity insulation with low efficiency to about 22 percent for the best available materials. The
authors believe that quoting Figure 14 is necessary because most of architects and civil
engineers trained outside of Europe have little (if any) knowledge of heat and moisture transfer.
2.1.7 A concept of thermal insulation efficiency
A concept of thermal insulation efficiency uses a ratio between the actual and the nominal R-value
i.e. the average calculated or measured thermal resistance of the assembly in relation to the nominal
R-value. Typically the nominal R-value is a sum of thermal resistance of all components in the
assembly and standard film resistances without consideration of multi-dimensional flows. In first
instance, however, we need to focus on the difference in efficiency between interior and exterior
placement of the insulation.
Compare a traditional 2x4 wood frame (OSB and gypsum board sheathings) filled with cellulose
fiber insulation and 2x6 frame wall with the same type of insulation. We use an advanced 2-D
hygrothermal model and present results in Table 1. In 2-D calculations we determine the
average heat flux over the range from the center of the stud to the center between studs and
use it to calculate mean R-value of the assembly. The ratio of mean R-value to the nominal R-
value is the efficiency factor for the insulation in the wall assembly and the difference between
these two R-values in relation to the nominal R-value is the reduction of thermal resistance,
typically presented in percent of the nominal R-value. The reduction of R-value presented in
Table 1 does not account for other thermal bridges in the wall e.g. at corners and windows or
effects of moisture transport.
Figure 14: Thermal resistance of the wall section with voids up to 2.0%

33
Table 1: Percent reduction from nominal R-value caused by studs in the nominal “2x4” and
“2x6” wood frame walls with cellulose fiber insulation, metric values are placed in brackets
Cavity
insulation
thickness,
mm
Resistance
per m of
thermal
insulation
(m K)/W
Thermal
conduct.
coefficient
W/(m K)
Nominal
R-value of
wall, center
of cavity
(m^2K)/W
R-value
from 2-D
calculation.
(m^2K)/W
Reduction
from nominal
R-value,
percent
89
24.6 0.041
2.51 2.17 13.3
140
3.76 3.21 14.5
Effect of thermal bridges for residential construction is documented in the ORNL calculator:
http://www.ornl.gov/sci/roofs+walls/AWT/InteractiveCalculators/rvalueinfo.htm that estimates an
average reduction of R-value caused by all thermal bridges in 2x4 wood-frame wall (corners,
windows and studs) as 18% and for 2x6 wood frame wall as 28%.
2.1.8 Estimating effect of multidimensional heat flow
While hourly real climatic data for both heat and moisture* transfer must be included in hygrothermal
calculations, simplified calculations of thermal resistance (R-value) are sufficient in the conceptual
stage of design.
Serial and parallel flow models
A simplified equation that can be used for most wall assemblies (with exception of steel construction)
is presented below:
R = (R1 + m R2) / (1+m) (1)
where: R1 is the thermal resistance calculated from the parallel path model, and R2 is the thermal
resistance calculated from the isothermal planes model.
These two models are discussed in ASHRAE handbook. The parallel path model gives too high
value of R-value and isothermal plane model, which assumes a perfect equalization of temperature
within each parallel wall section, gives to low R-value. Equation (1) states that a real thermal
resistance of the wall is between these two limits. A 1960s Russian thesis analyzed different
insulated and hollow blocks showing the value of m varying between 0.1 to 80 with the most
probable value of m = 2. Therefore, if the difference between R1 and R2 is small, Polish standards
used m = 2 (Plonski, 1965†). Brown and Schwartz (1987) showed that m = 1 approximated most of
the insulated wood frame walls. Garrett (1979) showed that the relation R2/R1 varied between 1 and
1.7 for slotted lightweight concrete at one end and the dense concrete with foam inserts at the other
* Effect of moisture movement and phase change on temperatures will be discussed in the next chapter.
† Only selected references are given in this handbook, others are given for documentation of historic sources used.
34
end. Shu et al. (1979), Valore (1980) and Valore et al. (1988) found that the isothermal planes
model gives a much closer approximation to the measured R-values than the parallel path model
(indicating large m-factor).
For steel stud construction, differences between R1 and R2 were much larger than those for
masonry constructions. The insight into heat flow patterns through steel stud construction led to the
development of a method that uses a network of resistances. Starting from textbooks on heat
transfer the Swedish Research group (Johanesson and Aberg, 1981; Johanesson, 1981) developed
a guide for design of highly insulated steel stud construction (Swedisol, 1981; Johanesson and
Andersson, 1989). Some of these examples were recently verified with 3-D computer model
(Bloomberg and Claesson, 1993). More recently, Trethowen (1995) proposed an alternative
approach that incorporates contact resistance.
Recognizing these effects, Bomberg and Lstiburek (1998) proposed to use equation (1) with the
following m-factors:
m = 1.0 for wood frame construction and insulating masonry block
m = 1.4 for ceramic masonry blocks and steel stud construction, if the adjacent layer
has thermal resistivity higher than wood (insulation)
m = 1.8 for concrete masonry blocks and steel stud construction, if thermal resistivity of the
adjacent layer is equal or lower than that of wood
2.1.9 Effect of thermal bridges on thermal resistance of the wall
As the reference we take the junction between wall and floor in masonry (Table 2). Applying an
interior insulation made the situation worse (case 2b). This action reduced TB temperature from
17.9 to 12.6°C (64.2 to 54.7 oF). Use of an interior insulation eliminated the heat collecting layer
on the interior surface (reducing the lateral heat flux to the thermal bridge) and while the R-value
in mid- section of the wall was increased, so was also increased the heat flux through the
bridge. Effectively interior thermal insulation increased the effect of thermal bridge.
Conversely, application of an exterior insulation (case 2c) has a positive effect. Even though
there was no change in the temperature depression when exterior insulation was used; the heat
flux through the thermal bridge itself was reduced. The values of heat flux shown in Table 2 are
0.17 W/m2 for interior insulation and 0.005 W/m2 for the exterior i.e., less than 3% of the
previous case. Quick 1-D calculation for the data published in Table 2 reveals that the clay
brick masonry had R = 0.83 (m2K)/W and insulation R = 2.5 (m2K))/W (e.g., 3 inch extruded
polystyrene). The increase of R-value in the actual wall was Ro = 1.8 (m2K)/W giving the
efficiency factor of 72%.
Table 2: Changes in U value (inverse of R-value) and thermal depression caused by the thermal bridge created by a concrete floor in typical masonry constructions (Sandin, 1990)
Drawing
Description
Additional
flux W/m2
U-value 𝑊/(𝑚2 ∙ 𝐾)
Excl thermal bridge
Incl thermal bridge
Temperature
decrease due to thermal bridge

35
a) Floor
joining woof frame wall
0.16 0.28 0.38 17.6 → 15.4
b) Interior thermal insulation of 11/2 brick wall
0.17 0.30 0.38 17.9 → 12.6
c) Exterior
thermal insulation of 11/2 brick wall
0.005 0.30 0.30 17.9 → 17.9
Case 2a) shown in Table 2 relates to wood-frame wall that has slightly higher thermal efficiency
than the insulated masonry wall. The same thermal bridge (concrete floor) carries now extra
heat flow of 0.16 W/m2. Yet the higher efficiency of the wall means that this TB reduces overall
thermal performance more than in previous case i.e., 36% (10/28) as opposed to the previous
27 % (8/30). Temperature reduction is now from 17.6 to 15.4°C (63.7 to 59.7 oF).
To highlight the increased effect of thermal bridges for better insulated walls we present a series
of 2-D calculations for wood frame wall with different classes of cavity thermal insulation with
and without exterior insulation. We use thermal insulation classes to avoid talking about specific
products. It is necessary because many generic types of materials have large differences in
thermal performance (e.g. fiberglass or open cell foams products). Manufacturers of open-cell
spray foam claim thermal resistivity in the range between 4.0 and 3.5 ft2 * h * ˚F/ BTU*in while
data measured on materials collected from the field applications are ranging from 3.12 to 3.56
ft2 * h * ˚F/ BTU*in (Table 3)
Table 3: Results of the thermal conductivity tests for foams coded A1, A2 and A3
Spec.
code
Thickness
(mm)
Thermal
Conductivity
(W / m K)
Thermal
Resistance
(m2K/W)
Thermal
Conductivity
BTU*in /
(h*ft2*˚F)
Thermal
resistivity
(h*ft2*˚F)
/ BTU*in
A1 43.04 0.0430 1.0000 0.298 3.36
A1 42.86 0.0428 1.0010 0.297 3.37
A1 42.70 0.0428 0.9982 0.297 3.37
A1 42.53 0.0429 0.9906 0.298 3.36
A2 37.24 0.0406 0.9182 0.281 3.56
A2 36.89 0.0405 0.9112 0.281 3.56
36
A2 36.91 0.0406 0.9102 0.281 3.56
A2 36.58 0.0408 0.8962 0.283 3.53
A3 48.94 0.0462 1.060 0.320 3.12
A3 48.74 0.0458 1.064 0.318 3.14
A3 48.64 0.0458 1.063 0.317 3.15
A3 48.48 0.0456 1.063 0.316 3.16
While differences between specimens from the same batch were small and all foams were near
90% of their claimed performance (legal limit in the US) the range of 11% differences between
thermal resistivity of foams in this category prevents us from using generic names in Table 4
discussing efficiency factor in wood frame wall without any additional thermal insulation.
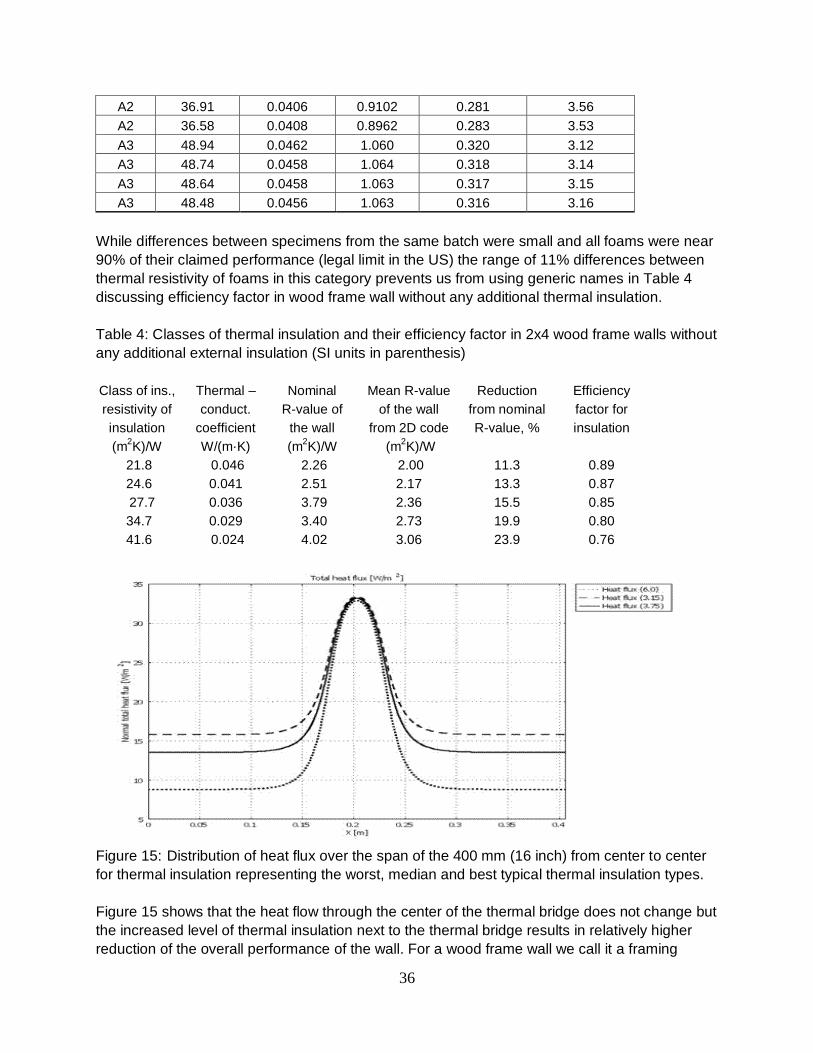
Table 4: Classes of thermal insulation and their efficiency factor in 2x4 wood frame walls without
any additional external insulation (SI units in parenthesis)
Class of ins.,
resistivity of
insulation
Thermal –
conduct.
coefficient
Nominal
R-value of
the wall
Mean R-value
of the wall
from 2D code
Reduction
from nominal
R-value, %
Efficiency
factor for
insulation
(m2K)/W W/(m·K) (m
2K)/W (m
2K)/W
21.8 0.046 2.26 2.00 11.3 0.89
24.6 0.041 2.51 2.17 13.3 0.87
27.7 0.036 3.79 2.36 15.5 0.85
34.7 0.029 3.40 2.73 19.9 0.80
41.6 0.024 4.02 3.06 23.9 0.76
Figure 15: Distribution of heat flux over the span of the 400 mm (16 inch) from center to center
for thermal insulation representing the worst, median and best typical thermal insulation types.
Figure 15 shows that the heat flow through the center of the thermal bridge does not change but
the increased level of thermal insulation next to the thermal bridge results in relatively higher
reduction of the overall performance of the wall. For a wood frame wall we call it a framing
37
correction. Table.4 shows that the framing correction for the low efficiency thermal insulation is
about 12%. It grows to about 14% for typical medium performance insulation and reaches 24%
when the best thermal insulating materials are used.
Integration‡ of curves shown in Figure 15 gives an average heat flux that in relation to one
derived when using nominal R-value for the actual temperature difference produces the
efficiency factor. The same calculations were repeated for the three selected classes of thermal
insulation but using 38 mm thick insulation either standard EPS with R-value 1 (m2K)/W or 5.6
(ft²·°F·h) /Btu or closed cell polyurethane foam with R-value 1.6 (m2K)/W or 9 (ft²·°F·h)/Btu.
Table 5 shows how use of the exterior thermal insulation increased the efficiency factors for the
cavity insulation.
Table 5: Classes of thermal insulation and their efficiency factor in the 2x4 wood frame walls
with external thermal insulation a) R 1 and b) R1.6 (m2K)/W
Class =
resistivity
(m2K)/W
R-value of
ext. insul.
(m2K)/W
Nominal
R-value
(m2K)/W
Mean R-value
from 2D
code(m2K)/W
Reduction
from nominal
percent
Efficiency
of the
insulation
21.8 1.0 3.25 3.01 7.4 0.93
1.6 3.85 3.61 6.2 0.94
26.0 1.0 3.62 3.27 9.7 0.90
1.6 4.22 3.87 8.2 0.92
41.6 1.0 5.00 4.12 17.7 0.82
1.6 5.60 4.74 15.5 0.85
Table 5 shows that that the use of exterior insulation improves the overall efficiency factor of the
insulation. This improvement is significant when R1 is used but does not change much when
higher exterior insulation R-values are used. Of course the total R-value is reduced in proportion
to the R-value of the external insulation.
This observation supports two conclusions:
1) wood frame walls in all climates should use minimum RSI 1 (R5.6) exterior insulation,
2) high performance thermal insulation should not be used in cavities but on the exterior of
the frame wall.
Table 5 showed the improved efficiency factor of thermal insulation when exterior insulation is
used. While external insulation is recommended for wood frame walls, it is absolutely necessary
for the steel frame walls.
2.1.10 Thermal bridging in the steel stud walls
With steel being about 1000 times more conductive than fiberglass, the standard steel frame
walls may be considered as a thermal bridge filled with insulation. Figure 16, based on ORNL
data, shows efficiency of fiberglass in the steel frame wall to be below 50%. Use of exterior
insulation is therefore required by codes and standards. There is not much difference between
‡ The following software was used in the calculations presented in this handbook: WUFI, CHAMPS
(Delphin) and COMSOL (multi-physics). Each of the presented values was checked by using two different software analysis programs.
38
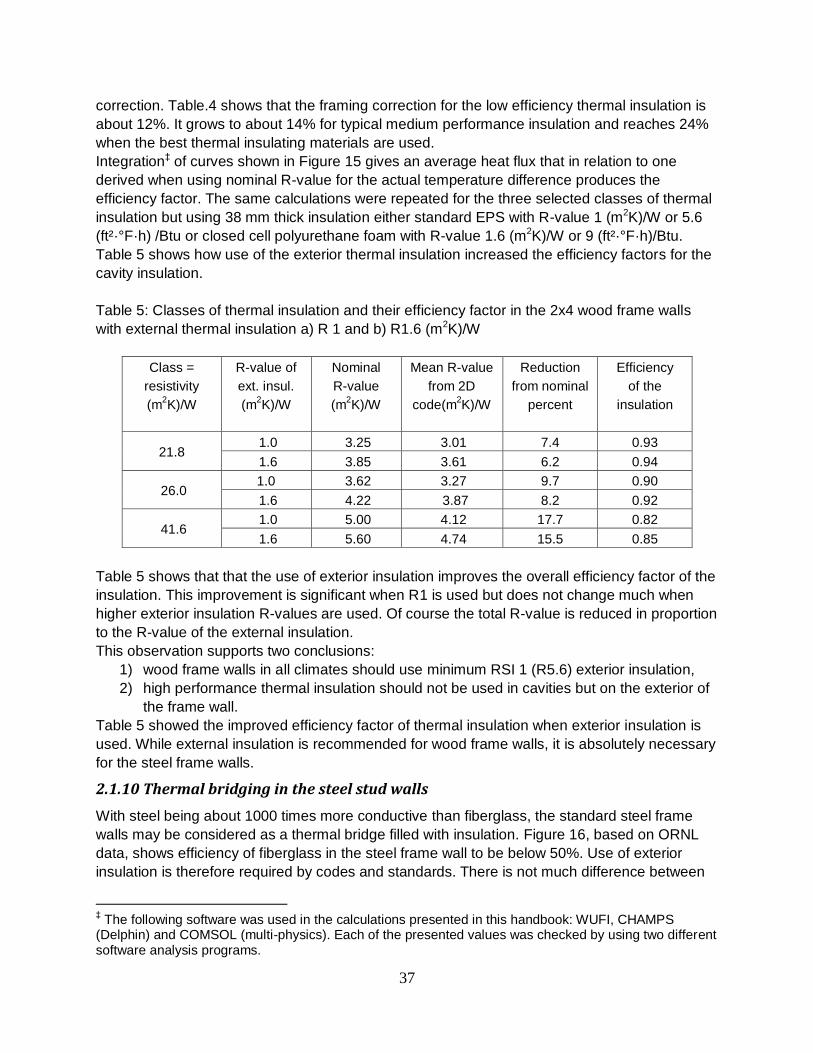
different fiberglass batts located in cavities of 100 or 150 mm nominal walls until R1 (m2K)/W
exterior insulation is added. Yet, with an adequate level of exterior insulation e.g. R2 (m2K)/W
the efficiency of the fiberglass batt improves
Figure 16: Approximate R-values in (ft2 oF hr) /BTU of steel frame walls with exterior insulating sheathing.
With an exterior gypsum sheathing attached to the outside face of the steel frame and an air
barrier system adhered to the gypsum sheathing with a minimum of 50 mm of extruded
polystyrene placed on top of it as the exterior insulation, this wall assembly is likely to perform
well.
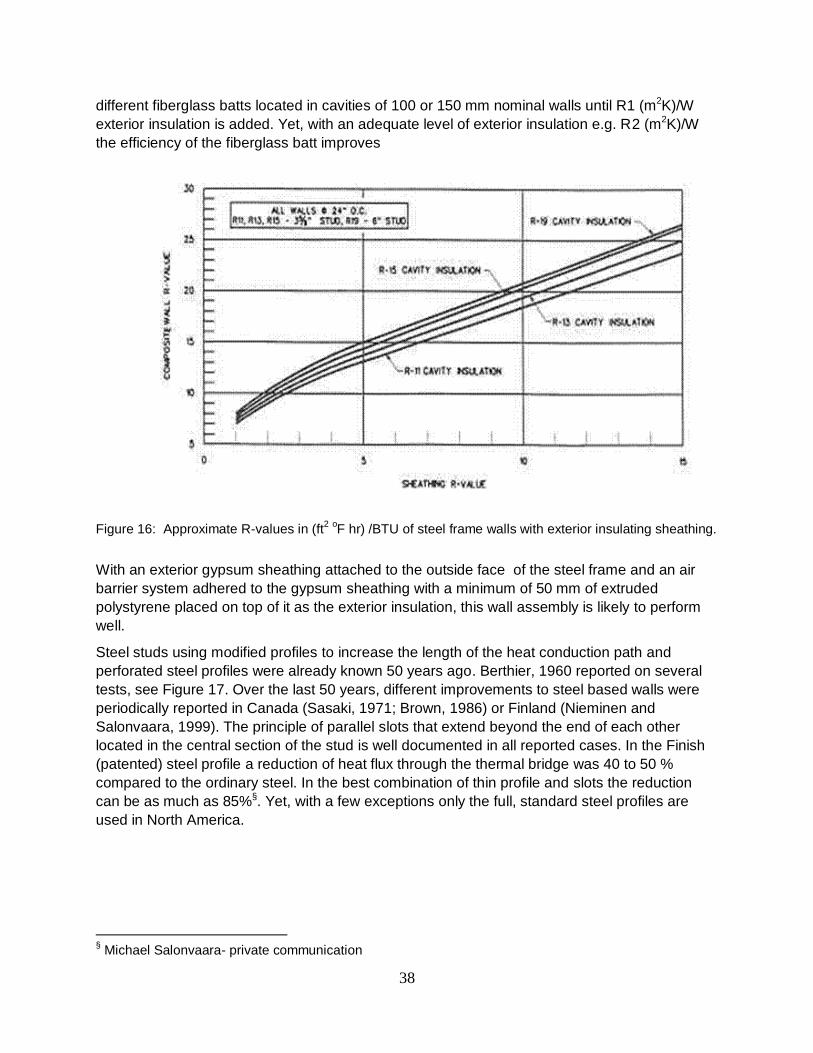
Steel studs using modified profiles to increase the length of the heat conduction path and
perforated steel profiles were already known 50 years ago. Berthier, 1960 reported on several
tests, see Figure 17. Over the last 50 years, different improvements to steel based walls were
periodically reported in Canada (Sasaki, 1971; Brown, 1986) or Finland (Nieminen and
Salonvaara, 1999). The principle of parallel slots that extend beyond the end of each other
located in the central section of the stud is well documented in all reported cases. In the Finish
(patented) steel profile a reduction of heat flux through the thermal bridge was 40 to 50 %
compared to the ordinary steel. In the best combination of thin profile and slots the reduction
can be as much as 85%§. Yet, with a few exceptions only the full, standard steel profiles are
used in North America.
§ Michael Salonvaara- private communication
39
Figure 17: Comparison of thermal efficiency between 4 types of steel profiles (Berthier, 1960). Note: the
picture is coming from the original publication, the correct English term for discontinuity in the metal is
“groove”, while North American is “slot”. 2.1.11 Thermal bridges and surface condensation As previously highlighted, the depression of temperature on the inner surface of a thermal bridge may cause
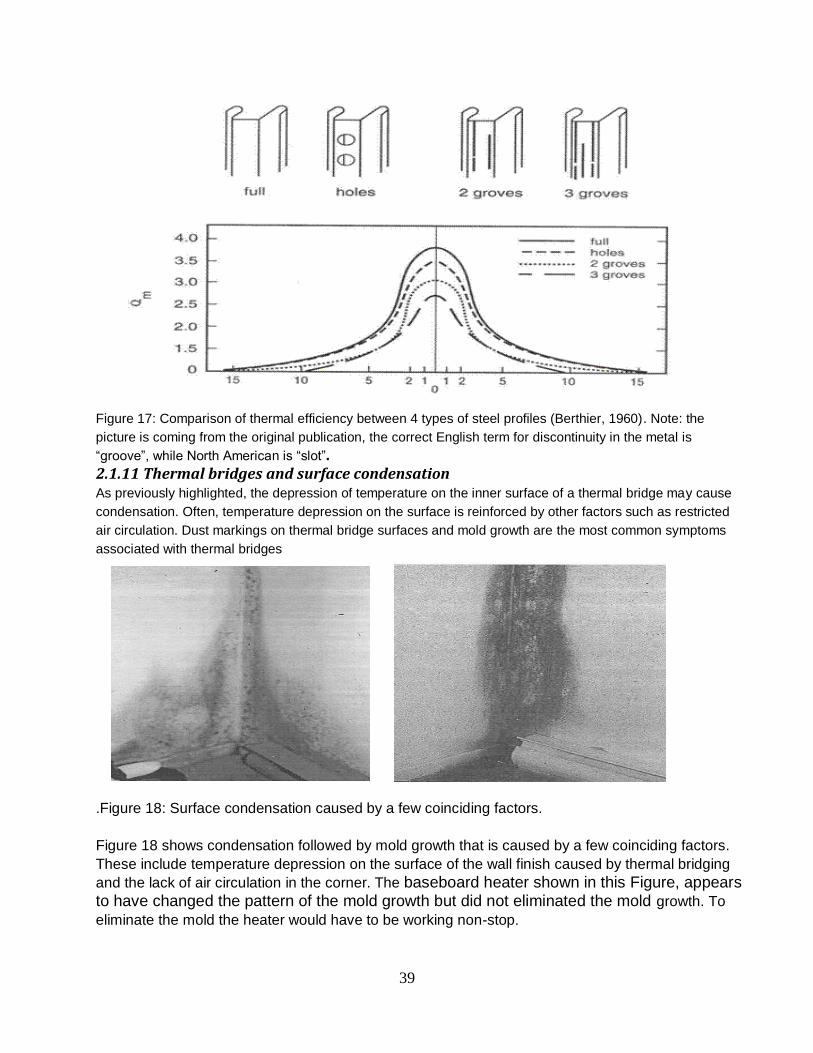
condensation. Often, temperature depression on the surface is reinforced by other factors such as restricted
air circulation. Dust markings on thermal bridge surfaces and mold growth are the most common symptoms
associated with thermal bridges
.Figure 18: Surface condensation caused by a few coinciding factors.
Figure 18 shows condensation followed by mold growth that is caused by a few coinciding factors.
These include temperature depression on the surface of the wall finish caused by thermal bridging
and the lack of air circulation in the corner. The baseboard heater shown in this Figure, appears to have changed the pattern of the mold growth but did not eliminated the mold growth. To
eliminate the mold the heater would have to be working non-stop.

40
So, what solutions could be applied for cases such as one shown in Figure 18. Obviously one needs
to examine the nature of thermal bridge, placement of air barrier (if needed) and placement of
exterior thermal insulation. If these measures were not possible, the solutions on the interior side
are:
1) Placing a heating wire (with a thermostat control) in the very line of the corner
2) Eliminating the corner by making a triangle (filling the corner) to increase the heat
transfer on this corner surface
3) As (2) but wider and using a strongly hygroscopic material that could act as moisture
buffer between night and day conditions
4) As (3) but using a capillary active capability and covering the large part of the wall so
that condensed water could be transported away from the corner**
5) As combination of (1) through (4)
2.1.12 Troubleshooting for thermal bridges
Figure 19 shows a picture taken from the technical literature where the authors show a thermal
bridge going across R30 fiberglass batts (9 inch thick), highlighting the thermal shortcut and air
flow through the thermal insulation. Yet, what they did not mention, is that this construction is
designed to fail because of condensation that may cause steel corrosion. Samuelson in the
1980’s or de Witt (1999) showed that this type of a metal deck does not control air or vapor
flows and that high RH followed by the condensation will take place on the top side of the metal
deck.
Figure 19: What is wrong in this design?
How should we design such a deck? First of all, there should be no thermal insulation under the
deck. The air and vapor barrier should be applied to the substrate boards (exterior gypsum,
OSB, plywood) that are placed the top of the deck. On top of them one builds an actual
insulated roof (inverse, green or standard low slope roof). Temperature in the space between
suspended (acoustic) ceiling and the roof deck should be near that of the conditioned space.
This requirement stems from both reducing the risk of condensation and IAQ requirements. The
** Solution involving moisture transport will be discussed in the next chapter.

41
space between structural beams should be used for carrying HVAC ductwork and piping and
other services.
2.1.13 Concluding remarks
It is clear that high performance building enclosures require good understanding of
hygrothermal performance of materials and assemblies and that such knowledge is often
missing. Driven by a growing concern for air tightness in wall assemblies, air barriers and in
some cases vapor barriers are being placed under exterior insulations in both new and
retrofitted older buildings. When an exterior insulated sheathings and an air barrier are
incorporated in a wall assembly, the unplanned air leakage is minimized and the vapor
permeability requirements can be relaxed. Effectively, use of exterior insulation enhances
hygrothermal design and mitigates effect of both thermal bridging and water vapor control.
Nevertheless, if the air barrier material is impermeable to water vapor diffusion one must
consider wetting and drying on both sides of the wall assembly.
Special care must be taken when designing details such as steel column penetrations, supports
for window washing platforms, floor penetrations (Child, 1988) as well as the floor junctions in
masonry construction or concrete decks connected to balconies because of the significant
depression of the surface temperature and often the presence of standing water in those
junctions. Other thermal bridging considerations include cases when some reduction of
convective air movement may accompany temperature depression (e.g., corner closet or the
staircase leading to a roof terrace). In a nutshell, when dealing with thermal bridges one must
carefully evaluate construction details for heat, air and moisture performance.
References
Bomberg M. and J.W. Lstiburek, 1998, Field applied Spray polyurethane foam envelopes of buildings, Technomic Publ. Co., pp. 1- 339.
Bombino R , 1999, Hygrothermal design issues with steel stud-framed enclosure wall systems, Thesis, Arch. Eng. Pen State U.,
Fricker, J.M., and Yarbrough, D.W, 2011, “Review of reflective insulation estimation methods. Proceedings of Building Simulation”, 12th Conference of International Building Performance Simulation Association, Sydney, 14-16 November 2011, pp. 1989-1996.
Gross, W.P., and Miller, R.G, 1989, “Literature review of measurement and predictions of reflective building insulation system performance”, ASHRAE Transactions, 95 (2), pp. 651-664, 1989.
Glicksman, L. R., “Two-dimensional heat transfer effects on vacuum and reflective insulations”, Journal of Thermal Insulation, vol. 14, pp. 281-294, 1991.
D’Orazio, M., Di Perna, C., Di Giuseppe, E., and Morodo, M., 2012,“Thermal performance of an insulated roof with reflective insulation: Field tests under hot climatic conditions” Journal of Building Physics, 36 (3), pp. 229–246, 2012, doi:10.1177/1744259112448181.
Robinson, H.E., and Powlitch, F.J., “The thermal insulating value of airspaces”, Housing Research Paper No. 32, National Bureau of Standards Project ME-12, U.S. Gov Printing Office, Washington, D.C., 1954
Robinson, H.E., Cosgrove, L.A., and Powell, F.J., 1956, Thermal resistance of airspaces and fibrous insulations bounded by reflective airspace. Building Material and Structures Report 151, United States National Bureau of Standards, 1956.
Saber, H.H., Maref, W., Elmahdy, A.H., Swinton, M.C., and Glazer, R., 2010, “3D thermal model for predicting the thermal resistances of spray polyurethane foam wall assemblies”, Building XI Conference, December 5-9, 2010, Clearwater Beach, Florida, USA.

42
Saber, H.H., Maref, W., Lacasse, M.A., Swinton, M.C., Kumaran, M.K.,2010a, “Benchmarking of hygrothermal model against measurements of drying of full-scale wall assemblies”, 2010 International Conference on Building Envelope Systems and Technologies, ICBEST 2010, Vancouver, British Colombia, Canada, June 27-30, 2010, pp. 369-377.
Saber, H.H., Maref, W., and Swinton, M.C.,2011, “Numerical investigation of thermal response of basement wall systems with low emissivity material and furred – airspace”, 13th Canadian Conference on Building Science and Technology (13th CCBST) Conference, held in May 10 – 13, 2011 in Winnipeg, MB, Canada.
Saber, H.H., Maref, W., Sherrer, G., and Swinton, M.C., 2012, “Numerical modeling and experimental investigations of thermal performance of reflective insulations”, Journal of Building Physics, 36(2): 163-177, 2012, http://dx.doi.org/10.1177/1744259112444021.
Saber, H.H., Maref, W., and Swinton, M.C., 2012a, “Thermal response of basement wall systems with low-emissivity material and furred airspace”, Journal of Building Physics, 35(4): pp. 353-371, 2012, DOI: 10.1177/1744259111411652.
Saber, H.H., 2013a,“Practical correlations for the thermal resistance of vertical enclosed airspaces for building applications”, Journal of Building and Environment, vol. 59, pp. 379-396, 2013, http://dx.doi.org/10.1016/j.buildenv.2012.09.003.
Saber, H.H.,2013b “Practical correlation for thermal resistance of horizontal enclosed airspaces with upward heat flow for building applications”, Journal of Building and Environment, vol. 61, pp. 169-187, 2013, http://dx.doi.org/10.1016/j.buildenv.2012.12.016.
Saber, H.H., 2013c, “Practical correlation for thermal resistance of 45o sloped enclosed airspaces with
downward heat flow for building applications”, Journal of Building and Environment, vol. 65, pp. 154-169, 2013, http://dx.doi.org/10.1016/j.buildenv.2013.04.009.
Saber, H.H., 2013d, “Thermal performance of wall assemblies with low emissivity”, Journal of Building Physics, 36 (3): 308-329, 2013, DOI: 10.1177/1744259112450419.
Saber, H.H., 2014a.“Practical correlation for thermal resistance of horizontal enclosed airspaces with downward heat flow for building applications”, Journal of Building Physics, vol. 37 (4), pp. 403-435, 2014,
http://jen.sagepub.com/content/early/2013/08/19/1744259113498473.
Saber, H.H., 2014b, “Practical correlation for thermal resistance of low-sloped enclosed airspaces with downward heat flow for building applications”, HVAC&R Research Journal, 20 (1), pp. 92-112, 2014, http://dx.doi.org/10.1080/10789669.2013.834779.
Tenpierik, M.J. , and Hasselaar, E.,2013, “Reflective multi-foil insulations for buildings: A review”, Journal of Energy and Buildings, vol. 56, pp. 233–243, 2013.
Yarbrough, D., 1983, Assessment of reflective insulations for residential and commercial applications. ORNL/TM-8891, Oak Ridge National Laboratory, Oak Ridge, TN. p. 1-63, 1983.
Historic sources of information
Berthier, J., 1960, Les points faibles thermiques ou ponts themiques, Report from Centre Scientifique et Technique du Batiment, Number 42 pp.36
Bombino R and Burnett, EFP, 1999, Design issues with steel stud-framed wall systems, PHRC, Res. 58, p44
Brown W.C., 1986, Heat transmission test on sheet steel walls,
Child, K.W.,1988, Analysis of seven thermal bridges identified in a commercial building, DOE rep K/CSD/TM-78
de Witt, M., 1999, Building physical aspects of the innovative system of building – steel house project, Eindhoven U, the Netherlands

43
Enermodal Engineering, 1995, Building Insulation System Thermal Anomalies, AHRAE Res. Project 785-TRP
Johanesson G., 1981, Thermal bridges in sheet metal constructions, Swedisol, 1981;
McCaa D.J., E.D. Pentz, J. Curre and L.J. Infante, 1987, Experience in identification of thermal bridging and elimination of thermal short, ASTM STP 922, pp310-317
Ossowiecki, 1964, Curtain walls (in Polish), Arkady
Roaf S and M. Hanck (eds), 1992, Energy Efficient Building, a design guide, John Willey and sons, Inc
Sasaki J, 1971, Thermal performance of steel-stud exterior walls, Building research note 71, Nat. Res. Council of Canada
Threthowen H., 1988, see also ASHRAE Transactions, vol 94, part 2
Winter Ass., 1989, Catalog of thermal bridges in commercial and multifamily residential construction, ORNL/Sub/88-SA407/1, pp145