207988Orig1s000 - Food and Drug Administration · because hyperuricemia is the principal pathway...
114
CENTER FOR DRUG EVALUATION AND RESEARCH APPLICATION NUMBER: 207988Orig1s000 STATISTICAL REVIEW(S)
-
Upload
hoangkhanh -
Category
Documents
-
view
214 -
download
0
Transcript of 207988Orig1s000 - Food and Drug Administration · because hyperuricemia is the principal pathway...

CENTER FOR DRUG EVALUATION AND RESEARCH
APPLICATION NUMBER:
207988Orig1s000
STATISTICAL REVIEW(S)

U.S. Department of Health and Human ServicesFood and Drug Administration Center for Drug Evaluation and ResearchOffice of Translational SciencesOffice of Biostatistics
S T A T I S T I C A L R E V I E W A N D E V A L U A T I O N
CLINICAL STUDIES
NDA/BLA #: 207988
Drug Name: Zurampic (lesinurad)
Indication: Treatment of hyperuricemia associated with gout in combination with a xanthine oxidase inhibitor
Applicant: Ardea Biosciences, Inc.
Dates: Stamp date: December 29, 2014
Review Priority: Standard
Biometrics Division: Division of Biometrics II
Statistical Reviewer: Gregory Levin, PhD
Concurring Reviewers: Thomas Permutt, PhDRuthanna Davi, PhD
Medical Division: Division of Pulmonary, Allergy, and Rheumatology Products
Clinical Team: Rosemarie Neuner, MD, Medical ReviewerSarah Yim, MD, Medical Team Leader, Supervisory Associate Director
Project Managers: Michelle Jordan Garner, Jessica Lee
Keywords: NDA review, clinical studies, missing data, surrogate outcomes, safety, benefit-risk
Reference ID: 3852355

Table of Contents1 INTRODUCTION ................................................................................................................................3
2 BENEFIT...............................................................................................................................................3
3 RISK ......................................................................................................................................................4
4 BENEFIT-RISK....................................................................................................................................6
5 CONCLUSIONS AND RECOMMENDATIONS .............................................................................7
6 APPENDIX............................................................................................................................................8
2
Reference ID: 3852355

1 INTRODUCTION
Gout is a chronic disease typically characterized by reduced clearance or overproduction of uric acid, with the hyperuricemia leading to acute arthritis flares associated with substantial pain. It is estimated that approximately eight million adults in the United States suffer from gout. Treatment typically consists of medications such as colchicine, nonsteroidal anti-inflammatory drugs (NSAIDs), or corticosteroids for the symptoms of acute attacks, short-term (e.g., 3–6 month) medications such as colchicine or an NSAID to prevent flares, and chronic medications to lower the serum uric acid level and improve long-term outcomes. The commonly used xanthine oxidase inhibitors (XOIs) allopurinol and febuxostat lower serum uric acid levels by lowering uric acid production. In contrast, uricosurics such as the approved drug probenecid lower uric acid levels by increasing urinary uric acid excretion.
The applicant is seeking approval of the uricosuric lesinurad 200 mg once daily (QD) in combination with a xanthine oxidase inhibitor for the chronic treatment of hyperuricemia associated with gout in patients who have not achieved target serum uric acid levels with a xanthine oxidase inhibitor alone. The safety and effectiveness of lesinurad were discussed at an FDA Arthritis Advisory Committee Meeting on October 23, 2015. The Committee voted 14–0 in favor of substantial evidence of benefit, 7–6 in favor of the safety profile being adequate to support approval, and 10–4 in favor of approval of lesinurad. Nearly all of the committee members who voted to approve lesinurad expressed a desire for additional postmarketing studies to more reliably evaluate benefit and/or risk (see excerpts from transcript in Appendix).
The goal of this review is to integrate the efficacy and safety findings in order to carry out a quantitative benefit-risk evaluation of lesinurad.
2 BENEFIT
The efficacy of lesinurad was evaluated in detail in the primary statistical review by Dr. Yu Wang, and I agree with the key conclusion of Dr. Wang’s review: there is convincing statistical evidence that lesinurad lowers serum uric acid levels in patients with gout when used in combination with a xanthine oxidase inhibitor. For example, in the two phase 3, randomized, double-blind, placebo-controlled trials in patients receiving background allopurinol, treatment with lesinurad 200 mg resulted in statistically significant, absolute increases of 26% (95% confidence interval: 17%, 36%) and 32% (23%, 41%) over placebo in the probability of achieving a target serum uric acid level less than 6 mg/dL at Month 6.
Dr. Wang’s review also notes that there was no statistical evidence of benefit for any of the key secondary endpoints. Secondary endpoints such as gout flare rate between Month 6 and Month 12, tophi resolution at Month 12, and improvement (by at least 0.25 units) in the Health Assessment Questionnaire – Disability Index (HAQ-DI) at Month 12 provide important supportive information in trials of chronic gout treatments, as these endpoints might be considered direct measures of patient benefit. Therefore, it is notable that there was no evidence of benefit, nor any consistent trends toward benefit, for these endpoints, and in fact, there were slight but relatively consistent trends toward worse outcomes on lesinurad 200 mg than placebo for patient-reported outcomes such as HAQ-DI, patient pain score, SF-36 physical component summary (PCS), and patient global assessment of disease activity score (Table 1, Appendix). Additional details on the design and results of the key phase 3 studies can be found in Dr. Wang’s review.
3
Reference ID: 3852355

The primary efficacy endpoint in the phase 3 clinical trials was the proportion of patients achieving a target serum uric acid level, either <6 or <5 mg/dL, at Month 6. For chronic gout treatments, reduction in serum uric acid is a surrogate endpoint, i.e., it is a replacement endpoint for direct measures of how patients function, feel, or survive. The achievement of target urate levels might be considered a surrogate for direct measures of patient benefit such as long-term reduction in flare rate, resolution of symptoms from tophi, and improvement in pain, physical functioning, and quality of life. Both the FDA clinical review team and members of the FDA Arthritis Advisory Committee expressed high confidence that because hyperuricemia is the principal pathway through which gout affects how patients function and feel, reduction in serum uric acid level with an intervention will lead to long-term improvements in direct measures of patient benefit. In addition, despite some disappointment expressed with the lack of evidence or trends toward benefit for important secondary endpoints, there was general agreement that one-year studies are likely not long enough to capture improvements in direct measures of patient benefit that are expected to be mediated through persistent lowering of serum urate. However, even if one believes strongly in the validity of serum uric acid as a surrogate endpoint, reliable evaluation of the benefit-risk profile of lesinurad requires additional considerations regarding: (1) the expected magnitude of direct patient benefit achieved through treatment with lesinurad; and (2) the unintended off-target effects (safety) of lesinurad. I discuss the magnitude of benefit next and the off-target effects in the following section on risk.
Given the use of a biomarker as the primary endpoint in the phase 3 trials and the absence of long-term randomized clinical trial data for chronic gout treatments estimating the magnitude of direct patient benefit (e.g., number of flares prevented per year or extent of improvement in quality of life) that would be expected based on the magnitude of effect on serum uric acid level, there is considerable uncertainty in the magnitude of benefit expected with lesinurad. However, I can use results from the phase 3 trials of lesinurad to help estimate a rough upper bound on the magnitude of benefit. In particular, I consider the potential long-term effect of lesinurad on the frequency of gout flares requiring treatment, an important direct measure of patient benefit that is expected to improve due to reduction in serum urate. Three placebo-controlled phase 3 trials were carried out in the intended-use population consisting of patients with hyperuricemia despite treatment with an XOI. In the placebo arms of these three trials, the estimated rates of gout flares requiring treatment between Month 6 and Month 12 were 0.6, 0.8, and 1.3 events per 6 months, or approximately 1–2 flares per year. Suppose I assume that the flare rate beyond one year would plateau in patients receiving only background XOI treatment. With the best-case assumption that the additional serum urate reduction achieved with lesinurad would reduce the flare rate to zero, the addition of lesinurad to an XOI might reduce the flare rate beyond one year by approximately 1–2 flares per year on average. This should be considered an estimated upper bound for the magnitude of benefit since: (1) the first assumption is questionable because the frequency of gout flares in the phase 3 trials was slightly declining over the final study months (Table 2, Appendix) and may have continued to decline in the absence of lesinurad treatment; and (2) the second assumption that lesinurad would completely eliminate gout flares is likely implausible given that nearly half of the patients in the lesinurad arms failed to achieve target serum urate levels in the phase 3 studies.
3 RISK
The safety of lesinurad was reviewed in detail by the clinical reviewer Dr. Rosemarie Neuner and I refer the reader to Dr. Neuner’s review for a comprehensive summary of the safety results. Here, I briefly highlight a few of the major safety findings, focusing on results for renal-related adverse events (AEs), major adverse cardiovascular events (MACE), and death, and also discuss the potential effect of missing data on the reliability of the safety analyses. I exclude the phase 3 monotherapy study and focus on
4
Reference ID: 3852355

results from the three phase 3 XOI add-on studies, as FDA and the applicant agree that the risk profile of lesinurad as a monotherapy is likely worse because of greater uric acid available for excretion.
Renal safety was a pre-specified topic of special interest because of both the high-risk gout population and the mechanism of action of lesinurad. In the integrated phase 3 XOI add-on studies, there was a dose-dependent trend toward greater risk of renal-related on-treatment adverse events, with 23 (4.5%), 29 (5.7%), and 60 (11.8%) patients having events on placebo, lesinurad 200 mg, and lesinurad 400 mg, respectively. This was primarily due to a dose-dependent trend in serum creatinine increases. For example, 12 (2.3%), 29 (5.7%), and 73 (14.3%) patients had elevations at least 1.5 times baseline, and 0 (0%), 9 (1.8%), and 34 (6.7%) patients had elevations at least 2.0 times baseline on placebo, lesinurad 200 mg, and lesinurad 400 mg, respectively. The majority of these creatinine elevations resolved, although some did not: for example, 0, 2, and 2 patients still had serum creatinine levels at least 2.0 times baseline at least 84 days after the first detected elevation on the placebo, lesinurad 200 mg, and lesinurad 400 mg arms. There were few renal-related serious AEs and no clear trend, with only 2 (0.5%), 0 (0%), and 5 (1.3%) patients having events on placebo, lesinurad 200 mg, and lesinurad 400 mg, respectively.
The applicant suggests that the dose-dependent increases in serum creatinine and renal AEs are due to acute precipitation of uric acid in renal tubules, and that these elevations are temporary and can be identified and monitored. However, many Advisory Committee members expressed concerns with the potential renal toxicity. In particular, members expressed concerns with the uncertainty in the true magnitude of risk due to the small numbers of events, the unknown but potentially worse safety profile in patients with renal impairment, and the effectiveness of the proposed risk management plan, as the applicant is proposing less frequent monitoring of serum creatinine in clinical practice than was carried out in the phase 3 trials.
Cardiovascular (CV) safety was also a pre-specified topic of special interest because of the high level of CV risk in the gout population, and all deaths and potential CV AEs were adjudicated by an independent, blinded committee. In the integrated phase 3 XOI add-on studies, the number of MACE was very low, although there was a slight signal toward an increased number of events in patients receiving lesinurad. The number (incidence rate per 100 person-years) of patients with events were 3 (0.7), 4 (1.0), and 8 (1.9) on placebo, lesinurad 200 mg, and lesinurad 400 mg, respectively. This yielded an estimated incidence rate ratio (95% confidence interval) of 1.4 (0.2, 9.3) and 2.7 (0.7, 16.0) for lesinurad 200 and 400 mg, respectively, as compared to placebo. Discussions with the clinical review team did not identify any understood mechanisms through which lesinurad might increase CV risk, and the wide confidence intervals indicate that the numerical imbalances may have been due to chance alone. Nevertheless, the slight signal is concerning, and the upper bounds of those same confidence intervals indicate that even large (10+ fold) increases in CV risk with lesinurad cannot be ruled out based on the data collected to date.
In the integrated phase 3 XOI add-on studies, there were 0 (0 deaths per 100 person-years), 2 (0.5), and 4 (0.9) deaths among patients on placebo, lesinurad 200 mg, and lesinurad 400 mg, respectively. As with the MACE results, the slight signal for increased mortality on lesinurad is concerning, but the small number of events makes it difficult to determine whether the imbalance was due to chance or to a true off-target effect of lesinurad.
There was considerable missing data in the phase 3 studies, as approximately 15–25% of patients dropped out of the study early, with exact rates depending on the study, treatment arm, and time point of assessment. The lesinurad arms tended to have slightly higher overall dropout rates than the placebo arm. In particular, there was greater discontinuation due to adverse events on the lesinurad arms in the integrated phase 3 XOI add-on studies, with rates of 5% and 6% on the 200 and 400 mg arms, as
5
Reference ID: 3852355

compared to 3% on placebo. Sensitivity analyses demonstrated that the efficacy of lesinurad with respect to serum uric acid reduction was convincing notwithstanding the missing data. However, the potential effect of missing data might be more problematic with respect to the evaluation of safety. The slightly greater overall dropout rates and greater dropout rates due to adverse events on the lesinurad arms suggests that those patients remaining on treatment on lesinurad may have represented a healthier subset of patients than the subset of patients remaining on treatment on the placebo arm. This potential lack of comparability between patients remaining on treatment on the two arms could induce bias in favor of lesinurad in key safety analyses.
Finally, I note that the applicant is seeking marketing of only the 200 mg dose, as there is general agreement between FDA and the applicant that the benefit-risk profile for lesinurad 400 mg is not favorable. That being said, for the serious and potentially irreversible adverse events discussed here, although there was some dose-dependent trends indicating worse toxicity with the higher 400 mg dose, numerical imbalances were generally present for the 200 mg dose as well. In addition, there is some overlap in the exposure distributions of the 200 and 400 mg doses, and it is possible that a greater subset of patients receiving the 200 mg dose in real clinical practice than in the phase 3 clinical trials will have internal or external factors (e.g., renal impairment or use of interacting concomitant medications) that increase exposure and potentially toxicity, as well. More details on the clinical pharmacologic profile of lesinurad are available in Dr. Jianmeng Chen’s review. Furthermore, it is a strong assumption (and one that cannot be verified with the sparse safety data) that the 200 mg dose lies below the steep part of the dose-toxicity curves for these serious AEs. The bottom line is that if there are true increases in the risks of off-target irreversible morbidity and mortality on lesinurad 400 mg, there would likely also be true increases in risk (albeit potentially smaller in magnitude) on the 200 mg dose.
4 BENEFIT-RISK
In this section, I summarize and integrate the major conclusions regarding benefit and risk. The major findings regarding the effectiveness of lesinurad for treatment of hyperuricemia associated with gout were the following:
There was convincing statistical evidence that lesinurad lowers serum uric acid levels in patients with gout when used in combination with a xanthine oxidase inhibitor. Despite the lack of any supportive evidence of benefit for secondary endpoints in the phase 3 clinical trials, both the FDA clinical review team and the Advisory Committee are confident based on their understanding of the disease process that reduction in serum urate will lead to direct patient benefit (e.g., reduction in flare rate and improvement in quality of life) over a longer period of time than the 6–12 month trials.
Given the short-term nature of the phase 3 clinical trials and the lack of historical trial data to help predict effects on clinical outcomes based on effects on the surrogate endpoint serum uric acid, there is considerable uncertainty in the magnitude of long-term direct patient benefit provided by lesinurad.
Using short-term phase 3 clinical trial data and extrapolating into the future with best-case scenario assumptions in favor of lesinurad, I estimated a rough upper bound for the magnitude of direct patient benefit: the addition of lesinurad to an XOI might reduce the flare rate by up to approximately 1–2 flares per year on average.
The major findings regarding the safety of lesinurad were the following:
There were dose-dependent trends toward greater renal adverse events, primarily due to greater increases in serum creatinine, on lesinurad, and renal toxicity is plausible based on the drug’s
6
Reference ID: 3852355

mechanism of action. The applicant claims that the renal toxicity is acute and monitorable, but there are some concerns about the uncertainty around the true magnitude of risk, whether the toxicity is truly reversible, and about the sufficiency of the proposed monitoring plan in real clinical practice.
There were slight signals toward greater numbers of MACE and deaths on lesinurad than placebo. No mechanistic explanations have been expressed. Due to the small numbers of events, I cannot rule out that the numerical imbalances were due to chance alone or that there are truly large (several-fold) increases in risk of these events with lesinurad.
Considerable missing data in the phase 3 trials could induce bias in favor of lesinurad in key safety analyses.
Because of the considerable uncertainty in both the magnitude of benefit and the potential risks, a quantitative benefit-risk evaluation is challenging. If the renal AEs are truly acute and monitorable and there are no increases in the risks of chronic or end-stage renal disease, MACE, or mortality, then the expected benefits (e.g., a reduction on average in up to 1–2 flares per year) of lesinurad treatment likely outweigh the risks. However, it is difficult to rule out the possibility of moderate to large increases in the risk of irreversible morbidity and mortality with the available data, and even small increases in risk might be unacceptable from a benefit-risk perspective. For example, suppose that treatment with lesinurad increases the risk of MACE by 50%. In its Cardiovascular Safety Report, the applicant cited two estimates of baseline CV risk in patients with gout: an incidence rate of 1.4 MACE per 100 person-years in an open-label allopurinol study and a rate of 2.3 CV deaths per 100 person-years based on the National Health and Nutrition Examination Survey (NHANES). If I assume a baseline MACE rate of 2 events per 100 person-years, a 50% increase in risk would result in 1 extra major adverse cardiovascular event for every 100 patients treated with lesinurad for 1 year. It is questionable whether the symptomatic benefit of at-best preventing 100–200 flares in these 100 patients would be worth this risk. If there was an additional increase in the long-term risk of end-stage renal disease and/or if the benefit was less, e.g., only 25–50 flares prevented, it would be even more difficult to conclude that the benefits outweigh the risks. Furthermore and perhaps more importantly, such an informed benefit-risk evaluation by an individual patient and prescriber is not possible based on the current data due to the considerable uncertainty in the expected magnitudes of both benefit and risk.
5 CONCLUSIONS AND RECOMMENDATIONS
Based on the benefit-risk considerations discussed above, I have the following conclusions and recommendations:
Moderate to large increases in the risks of renal and cardiovascular toxicities of lesinurad have not been ruled out, and even small increases in these risks might outweigh the expected symptomatic benefit of lesinurad. Furthermore, an informed benefit-risk evaluation and treatment decision by an individual patient and prescriber is not possible because of the considerable uncertainty in both the magnitude of benefit and magnitude of risk of lesinurad. Because “there is insufficient information about the drug to determine whether the product is safe for use under the conditions prescribed” (21 C.F.R. 314.125), FDA should refuse to approve the NDA.
If the NDA is approved, FDA should require a postmarketing clinical trial to more reliably “assess signals of serious risk related to the use of the drug” (U.S.C. 505(o)(3)). The observational study proposed by the applicant at the Advisory Committee meeting is not adequate, as such non-randomized studies are subject to confounding and therefore likely capable of reliably ruling out only large increases in risks. As discussed above, ruling out only large (e.g, two-to-three fold) increases in
7
Reference ID: 3852355

risk likely will not give patients a sufficiently informed choice. Instead, FDA should require a randomized, double-blind, placebo-controlled clinical trial in patients receiving a xanthine oxidase inhibitor designed to rule out moderate increases in the risks of serious renal adverse events (e.g., incidence or progression of chronic kidney disease, or incidence of end-stage renal disease) in a real-world setting. Consideration should be given to additionally ruling out moderate increases in the risk of MACE with the same trial. To reliably assess the safety of lesinurad, and in particular, whether the risks may be outweighed by the benefits, better quantification of the magnitude of benefit is also important. Therefore, the postmarketing clinical trial should evaluate important direct measures of patient benefit (e.g., long-term flare rate and quality-of-life measures) as secondary endpoints. Similar recommendations for postmarketing studies to more reliably evaluate benefit and/or risk were made by many of the Advisory Committee members who voted in favor of approval of lesinurad (see excerpts from transcript in Appendix).
Given the lack of historical trial data to help predict the magnitudes of effects of a urate-lowering therapy on direct measures of patient benefit based on the magnitude of effect on serum uric acid, drug development programs that rely on phase 3 clinical trials of only 6–12 months in duration will be unable to quantify effectiveness with reasonable precision. When unexpected safety signals appear, considerable uncertainty in the magnitude of benefit makes benefit-risk evaluations and regulatory decisions challenging. Therefore, phase 3 development programs should include at least one randomized clinical trial that is longer in duration, e.g., two to three years, with the goal of reliably evaluating the effect of the drug on direct measures of patient benefit expected to be mediating through persistent lowering of serum uric acid.
6 APPENDIX
Excerpts from Transcript for October 23, 2015 Arthritis Advisory Committee Meeting
Dr. Berney: “I voted yes. I would like to see three additional trials. One would be a split dosing, say 1 at 7 and at 2, to look at the efficacy and safety of 100 milligrams twice a day, but the second dose would be earlier in the afternoon. I would like to see whether it truly over several years decreases flares. And three, I'd like a long-term side effect profile or adverse event profile to see if it's really safe or not.”
Dr. Oliver: “I voted yes. I'd like to see studies looking at longer extension times than 24 months that include a placebo, as well as looking at adverse events, specifically cardiovascular and renal.”
Ms. Chauhan: “I voted a conflicted yes. I think more studies need to be done around safety...”
Dr. Becker: “I voted yes. I switched my vote a few times, and I ended up yes. I think I'm happy with that. I agree with a lot of what has already been said for me... And I'd really be interested in the long-term safety data as it comes out and as these long-term extension trials are ongoing…”
Dr. Reimold: “I voted yes. I think I can agree with a lot of the sentiments that we need a good phase 4 study to look at comorbidities, to look at real-world adverse events…”
Dr. Jonas: “I voted yes… I think that real-world data is going to be really important here because we really don't know what's going to happen in large population of patients with multiple comorbidities. So I
8
Reference ID: 3852355

would urge the FDA to think about lots of post-approval, real-world studies in this population. I also would like to see control data out to 24 months.”
Dr. Caplan: “I voted yes. And as many of my colleagues have mentioned, I think there needs to be a specific study looking at patients with lower renal function to see more clearly the benefit versus harm in this medication...”
Dr. Neogi: “I voted yes... I think a post-approval study that I'd like to see is specifically in the subset with renal insufficiency.”
Dr. Miller: I voted yes. I think the drug does meet an unmet need. I'm not sure I'd recommend any more randomized studies…”
Dr. Delost: “I voted yes. I'd like to see the continuation of the studies on the resolution of tophi and flares. That was my big concern to start with. So I'd like to have that retrospective study in that, as well as looking at the levels for creatinine clearance, you can put in there as well, reevaluated.”
Table 1. Estimated Effects of Lesinurad on Selected Secondary Endpoints in the Three Phase 3 Studies in Patients with Gout Receiving a Background Xanthine Oxidase Inhibitor
Study 301 Study 302 Study 304Endpoint 200 mg vs
placebo400 mg vs placebo
200 mg vs placebo
400 mg vs placebo
200 mg vs placebo
400 mg vs placebo
Gout Flare Rate Ratio from Month 7-12 (<1 favors lesinurad)
0.99 (0.61, 1.61)
0.88 (0.54, 1.43)
0.88 (0.57, 1.37)
0.93 (0.60, 1.45)
1.2 (0.7, 2.1)
0.5 (0.3, 1.0)
Tophi Resolution Difference by Month 12 (>0 favors lesinurad)
-0.29 (-0.51, -0.08)
-0.08 (-0.37, 0.20)
-0.02 (-0.24, 0.20)
-0.06 (-0.29, 0.17)
0.04 (-0.07, 0.16)
0.09 (-0.02, 0.21)
HAQ-DI Improvement Difference at Month 12 (>0 favors lesinurad)
-0.05 (-0.16, 0.06)
-0.06 (-0.17, 0.04)
-0.10 (-0.20, 0.01)
-0.01 (-0.12, 0.10)
-0.08(-0.24, 0.07)
-0.19 (-0.34, -0.04)
Pain VAS Mean Difference at Month 12 (<0 favors lesinurad)
1.5 (-3.4, 6.5)
3.0 (-1.9, 8.0)
6.2 (1.4, 11.0)
5.3 (0.5, 10.1)
-3.7 (-10.1, 2.7)
-5.6 (-12.0, 0.8)
SF-36 PCS Mean Difference at Month 12 (>0 favors lesinurad)
-0.8 (-2.5, 1.0)
-1.3(-3.0, 0.4)
-0.5 (-2.2, 1.2)
-0.2 (-1.8, 1.5)
-0.6 (-3.1, 1.9)
0.8 (-1.7, 3.4)
Patient Global Mean Difference at Month 12 (<0 favors lesinurad)
-1.6(-6.0, 2.8)
2.2 (-2.1, 6.6)
5.8 (1.3, 10.2)
2.4 (-2.1, 6.9)
0.2 (-6.2, 6.6)
-6.9 (-13.3, -0.6)
Source of results: applicant’s study reports
Cell contents are estimated difference in means (95% confidence interval) for pain VAS, SF-36 PCS, and patient global scores, difference in proportions (95% confidence interval) for tophi resolution and HAQ-DI improvement, and incidence rate ratio (95% confidence interval) for gout flare requiring treatment
9
Reference ID: 3852355

Table 2. Proportion of Subjects Requiring Treatment for a Gout Flare in the Placebo Arm by Month over the Final Six Months of the Three Phase 3 Studies in Patients with Gout Receiving a Background Xanthine Oxidase Inhibitor
Study 301(N=201)
Study 302(N=206)
Study 304(N=109)
Month 7 19/172 (11%) 30/177 (17%) 23/95 (24%)Month 8 10/164 (6%) 21/173 (12%) 15/94 (16%)Month 9 16/161 (10%) 22/170 (13%) 11/91 (12%)Month 10 13/157 (8%) 16/165 (10%) 9/89 (10%)Month 11 13/156 (8%) 13/161 (8%) 9/88 (10%)Month 12 9/152 (6%) 11/158 (7%) 8/87 (9%)
Source of results: applicant’s study reports
Note: Some of the decline in the frequency of gout flares over time may be attributable to missing data, i.e.., the possibility that the group of subjects remaining in the study tended to represent a healthier and healthier subset of the randomized population as the study progressed
10
Reference ID: 3852355
---------------------------------------------------------------------------------------------------------This is a representation of an electronic record that was signedelectronically and this page is the manifestation of the electronicsignature.---------------------------------------------------------------------------------------------------------/s/----------------------------------------------------
GREGORY P LEVIN11/25/2015
RUTHANNA C DAVI12/01/2015
THOMAS J PERMUTT12/15/2015I concur.
Reference ID: 3852355

U.S. Department of Health and Human Services Food and Drug Administration Center for Drug Evaluation and Research Office of Translational Sciences Office of Biostatistics
S TAT I S T I C A L R E V I E W A N D E VA L U AT I O N CARCINOGENICITY STUDY
NDA: 207988
Drug Name: Zurampic (lesinurad)
Indication: Treatment of hyperuricemia.
Sponsor: Ardea Biosciences San Diego, California
Date: Data Submitted: 3 March 2015
Assigned to Reviewer: 8 January 2015
Review Priority: Standard
Biometrics Division: Division 6
Statistical Reviewer: Steve Thomson
Concurring Reviewer: Team Leader: Karl Lin, Ph. D.
Medical Division: Division of Pulmonary, Allergy, and Rheumatology Products
Toxicologist: Reviewer: Matthew Whittaker, Ph.D. Team Leader: Marcie Wood, Ph.D.
Project Manager: Michelle Jordan Garner, , MS, OTR/L CDR, U.S. Public Health Service
Keywords: Carcinogenicity, Cox regression, Kaplan-Meier product limit, survival analysis, Trend test
Reference ID: 3847900

NDA 207988 Zurampic (lesinurad) Ardea Biosciences, Inc.
2
Contents
1. EXECUTIVE SUMMARY .................................................................................................................................... 3
1.1. CONCLUSIONS AND RECOMMENDATIONS ............................................................................................................ 3 1.2. BRIEF OVERVIEW OF THE STUDIES ...................................................................................................................... 7 1.3. STATISTICAL ISSUES AND FINDINGS .................................................................................................................... 8
1.3.1. Statistical Issues........................................................................................................................................... 8 1.3.2. Statistical Findings .................................................................................................................................... 15
2. INTRODUCTION ................................................................................................................................................. 15
2.1. OVERVIEW ......................................................................................................................................................... 15 2.2. DATA SOURCES ................................................................................................................................................. 15
3. STATISTICAL EVALUATION .......................................................................................................................... 15
3.1. EVALUATION OF EFFICACY ................................................................................................................................ 15 3.2. EVALUATION OF SAFETY ................................................................................................................................... 15 3.2.1. STUDY NO. 09-2168, SPONSOR STUDY NO. SR09-070 RDEA594: AN ORAL GAVAGE 24-MONTH CARCINOGENICITY STUDY IN SPRAGUE-DAWLEY RATS. ............................................................................ 16 3.2.2 STUDY NO. 8226466: RDEA594: 26-WEEK ORAL GAVAGE CARCINOGENICITY AND
TOXICOKINETIC STUDY IN CBYB6F1-TG(HRAS)2JIC MICE. .................................................................................. 20
4. FINDINGS IN SPECIAL/SUBGROUP POPULATIONS ................................................................................ 24
5. SUMMARY AND CONCLUSIONS ................................................................................................................... 25
5.1. STATISTICAL ISSUES AND COLLECTIVE EVIDENCE ............................................................................................ 25 5.2. CONCLUSIONS AND RECOMMENDATIONS .......................................................................................................... 25
APPENDICES: .......................................................................................................................................................... 26
APPENDIX 1. SURVIVAL ANALYSES .......................................................................................................................... 26 APPENDIX 2. FDA POLY-K TUMORIGENICITY ANALYSIS ......................................................................................... 31 APPENDIX 3. REFERENCES ........................................................................................................................................ 43
Reference ID: 3847900
(b) (4)
(b) (4)

NDA 207988 Zurampic (lesinurad) Ardea Biosciences, Inc.
3
1. EXECUTIVE SUMMARY
According to the report provided by Sponsor for the rat study: “The purpose of this study was to assess the carcinogenic potential of RDEA594 when administered orally to rats for up to 104 weeks. However, due to reduced survival, dosing was shortened to 100 weeks and selected groups were removed from the study between Weeks 90 and 97.” (page 16 of report) The rat study was conducted by .
For the mice study: “This study evaluated the carcinogenic potential and determined the
toxicokinetics of the test article, RDEA594, when administered daily via oral gavage to CByB6F1-Tg(HRAS)2Jic mice for at least 26 weeks.” This study was conducted by
1.1. Conclusions and Recommendations The rat study summarizes presents results with daily oral gavage dosing. The Sponsor’s
report states that: “Based on mortality, dosing was terminated and animals were necropsied earlier than 104 weeks. All decisions to terminate dosing or remove a treatment group from the study were done following consultation and agreement by the FDA. There was no test article related increase in mortality as compared to control animals. For males at all dose levels, dosing was stopped and terminal necropsy was initiated in Week 97. For males at 0, 25, 75 and 200 mg/kg/day, the number (percentage) of males surviving to terminal necropsy was 20 (33%), 18 (30%), 20 (33%) and 27 (45%), respectively. For females at 0, 25, 75, and 200 mg/kg/day, dosing was stopped in Weeks 100, 97, 91 and 90, respectively. Terminal necropsy was conducted on 20 (33%), 15 (25%), 15 (25%) and 15 (25%) survivors in Weeks 100, 100, 91 and 97, respectively.” (page 10 of rat report)!
Gross aspects of the study design for the rat study is summarized in Table 1 be1ow:
Reference ID: 3847900
(b) (4)
(b) (4)
NDA 207988 Zurampic (lesinurad) Ardea Biosciences, Inc.
4
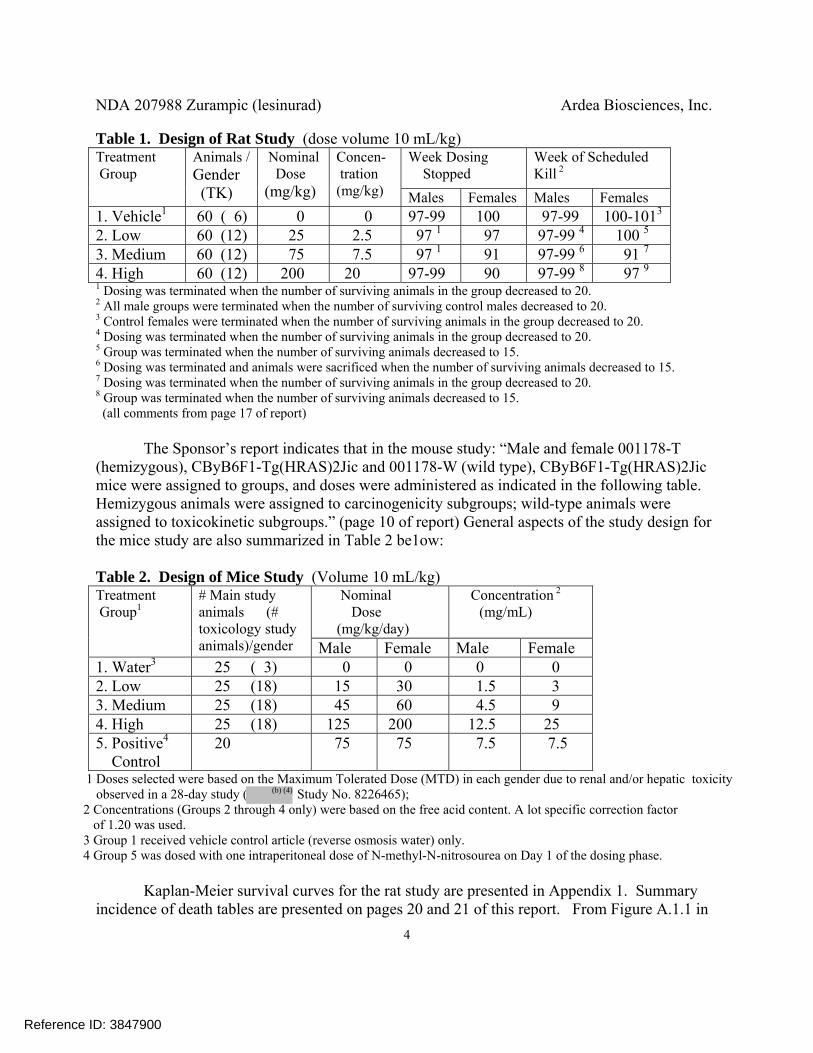
Table 1. Design of Rat Study (dose volume 10 mL/kg) Treatment Group
Animals / Gender (TK)
Nominal Dose (mg/kg)
Concen- tration (mg/kg)
Week Dosing Stopped
Week of Scheduled Kill 2
Males Females Males Females 1. Vehicle1 60 ( 6) 0 0 97-99 100 97-99 100-1013
2. Low 60 (12) 25 2.5 97 1 97 97-99 4 100 5 3. Medium 60 (12) 75 7.5 97 1 91 97-99 6 91 7 4. High 60 (12) 200 20 97-99 90 97-99 8 97 9 1 Dosing was terminated when the number of surviving animals in the group decreased to 20. 2 All male groups were terminated when the number of surviving control males decreased to 20. 3 Control females were terminated when the number of surviving animals in the group decreased to 20. 4 Dosing was terminated when the number of surviving animals in the group decreased to 20. 5 Group was terminated when the number of surviving animals decreased to 15. 6 Dosing was terminated and animals were sacrificed when the number of surviving animals decreased to 15. 7 Dosing was terminated when the number of surviving animals in the group decreased to 20. 8 Group was terminated when the number of surviving animals decreased to 15. (all comments from page 17 of report)
The Sponsor’s report indicates that in the mouse study: “Male and female 001178-T (hemizygous), CByB6F1-Tg(HRAS)2Jic and 001178-W (wild type), CByB6F1-Tg(HRAS)2Jic mice were assigned to groups, and doses were administered as indicated in the following table. Hemizygous animals were assigned to carcinogenicity subgroups; wild-type animals were assigned to toxicokinetic subgroups.” (page 10 of report) General aspects of the study design for the mice study are also summarized in Table 2 be1ow:
Table 2. Design of Mice Study (Volume 10 mL/kg) Treatment Group1
# Main study animals (# toxicology study
animals)/gender
Nominal Dose (mg/kg/day)
Concentration 2
(mg/mL)
Male Female Male Female 1. Water3 25 ( 3) 0 0 0 0 2. Low 25 (18) 15 30 1.5 3 3. Medium 25 (18) 45 60 4.5 9 4. High 25 (18) 125 200 12.5 25 5. Positive4 Control
20 75 75 7.5 7.5
1 Doses selected were based on the Maximum Tolerated Dose (MTD) in each gender due to renal and/or hepatic toxicity observed in a 28-day study ( Study No. 8226465);
2 Concentrations (Groups 2 through 4 only) were based on the free acid content. A lot specific correction factor of 1.20 was used. 3 Group 1 received vehicle control article (reverse osmosis water) only. 4 Group 5 was dosed with one intraperitoneal dose of N-methyl-N-nitrosourea on Day 1 of the dosing phase.
Kaplan-Meier survival curves for the rat study are presented in Appendix 1. Summary
incidence of death tables are presented on pages 20 and 21 of this report. From Figure A.1.1 in
Reference ID: 3847900
(b) (4)

NDA 207988 Zurampic (lesinurad) Ardea Biosciences, Inc.
5
the appendix, in male rats the Kaplan-Meier estimated survival curves are largely intertwined, consistent with no tests of differences in survival being close to statistical significance. From Figure A.1.2 survival in female, the vehicle and low dose groups track each other closely with the higher survival than the high and medium dose groups. These differences were statistically significant (Logrank p= 0.0204, Wicoxon p= 0.0225). The high and medium dose groups track each other somewhat closely, but with some tendency for higher survival in the high dose group. No other tests or comparisons quite reached the usual 0.05 level of statistical significance. The results of statistical tests of differences in survival are given below: ! Table 3. Statistical Significances of Tests of Homogeneity and Trend in Survival in Rats Hypotheses Males Females
Logrank Wilcoxon Logrank WilcoxonHomogeneity over all four groups 0.4664 0.5764 0.0204 0.0225
No Trend over all four groups 0.1874 0.2968 0.0903 0.0655
No difference between high dose and vehicle 0.3168 0.4734 0.0941 0.0851
Tables 4 and 5, below, display the days of death among the Tg.rasH2 animals. These
times are to be read as incidence over the approximate time line of the study. Multiple deaths, say for k deaths, at that numeric week are indicated by “k*week”. Although this reviewer considers the plots/tables below to be more informative, traditional Kaplan-Meier survival plots are presented as plots in Appendix 1, along with the results of tests of dose related trend in survival and differences between the vehicle and various dose groups. Table 4. Survival Times in Male Tg.rasH2 Mice Dose Group Dosage Survival Time in Days 1.Vehicle 0 25*27
2. Low 15 24, 24*27
3. Medium 45 25*27 4. High 125 11 24*27 5. Positive Control
75 11,12, 15,16,17, 19,20,21,22, 3*24,2*25, 6*27
Table 5. Survival Times in Female Tg.rasH2 Mice Dose Group Dosage Survival Time in Days 1.Vehicle 0 26,24*27
2. Low 30 25*27
3. Medium 90 15 24*27 4. High 250 7,8, 12, 19 21*27 5. Positive Control
75 12,13, 15, 2*18, 4*20,21, 2*23,2*24, 6*27
Reference ID: 3847900

NDA 207988 Zurampic (lesinurad) Ardea Biosciences, Inc.
6
In female mice there is some evidence of decreasing survival over dose. Although arguably of less use than Tables 4 and 5 above, appendix 1 includes both exact logrank tests comparing survival across groups and asymptotic tests of trend in survival over dose comparing survival across groups. Except for comparisons involving the positive control, tests on survival in male mice were uniformaly not statistically significant, while the corresponding tests in female mice were generally at or close to statistical significance (please see Table A.1.4 in that appendix).
Note that a large number of tumors are typically identified in the analysis of neoplasms,
implying a large number of statistical tests. Following the frequentist paradigm, when interpreting significance levels (i.e., p-values), one can use the Haseman-Lin-Rahman (HLR) rules to adjust for the multiplicity of tests. Two approaches have been investigated, one for testing dose related trend and pairwise comparison between the high dose and control seperately and the other these hypotheses jointly (please see Section 1.3.1.5, below, for details). Usual statistical practice would be to test these hypotheses separately, but some scientists want to control Type I error only when simultaneously testing both the trend and pairwise hypotheses. That is, in the two year study, when testing for trend over dose and, separately, the difference between the highest dose group with a control group, to control the overall Type I error rate for the joint tests in a two species submission to roughly 10%, one compares the unadjusted significance level of the trend test to 0.005 for common tumors and 0.025 for rare tumors, and the pairwise test to 0.01 for common tumors and 0.05 for rare tumors. For the testing these hypothese jointly for common tumors one compares the unadjusted significance level of the trend test to 0.005 and the pairwise test to 0.05, and for rare tumors 0.025 for tests of trend and 0.10 the pairwise comparison. Using these adjustments for other tests, like testing the comparisons between the Low and Medium dose groups versus vehicle can be expected to increase the overall type I error rate to some value above the nominal rough 10% level, possibly considerably higher than the nominal 10% rate. For the alternative short term study simulations suggest a 0.05 level for both the test of trend and pairwise comparisons.
Table 6 shows the tumors in rats that had at least one non-multiplicity adjusted test that
was statistically significant at or close, to a 0.10 level (or contributed to a significant test). For each tumor-organ combination the tumor incidence over the four dose groups is listed first, followed by the significance levels of the overall test of trend over all four dose groups, and finally the comparison of the high, medium and low dose groups with vehicle.
Reference ID: 3847900

NDA 207988 Zurampic (lesinurad) Ardea Biosciences, Inc.
7
Table 6. Potentially Statistically Significant Results for Organ-Tumor Combinations in Rats Overall Results Tumor Incidence Significance Levels Gender Veh Low Med High ptrend phigh pmed plow Organ/Tumor vsVeh vsVeh vsVeh Male Rats SKIN # Evaluated 60 60 60 60 Adj. # at Risk 39.7 37.8 37.8 42.1 MYXOSARCOMA 0 0 0 2 .0721 .2657 . . THYROID # Evaluated 59 60 60 60 Adj. # at Risk 39.7 38.0 39.0 41.8 C-CELL ADENOMA 0 2 2 4 .0482 .0640 .2403 .2337 Female Rats PANCREAS # Evaluated 60 60 60 60 Adj. # at Risk 41.0 40.4 29.2 33.9 ISLET CELL ADENOMA 0 0 0 2 .0527 .2009 . . PITUITARY # Evaluated 60 60 60 60 Adj. # at Risk 54.0 56.2 49.8 54.7 PARS DISTALIS ADENOMA 43 41 41 49 .0158 .0872 .3933 .8452 Adj. # at Risk 41.0 41.3 31.2 33.8 PARS DISTALIS: CARCINOMA 0 3 4 1 .4539 .4521 .0324 .1249 Adj. # at Risk 54.0 57.1 51.7 54.7 Pars Dist. Adenoma/Carcinoma 43 44 45 50 .0092 .0463 .1761 .7056 Using the tumor incidence in the vehicle to determine whether a tumor should be classified as rare or common, only pars distalis adenoma and pooled adenoma and carcinoma would be classified as common tumors, the rest rare. However, after adjusting for multiplicity using the Haseman-Lin-Rahman rules, in both genders in rats when testing hypotheses of trend or pairwise differences, strictly speaking no tests were statistically significant. Complete tables of tumor incidence are given in Tables A.2.2 and A.2.3, in Appendix 2, below.
With the exception of the comparisons between the vehicle and the positive control, in
mice no tests achieved even the nominal 0.10 level, let alone any multiplicity adjusted level of statistical significance. Since it was felt that the tests between the vehicle and positive control were only of use to assess the appropriateness of the mouse model, they are not addressed further. Complete tables of tumor incidence are given in Tables A.2.4 and A.2.5, in Appendix 2, below. 1.2. Brief Overview of the Studies
Two studies were submitted, the first from :
Reference ID: 3847900
(b) (4)

NDA 207988 Zurampic (lesinurad) Ardea Biosciences, Inc.
8
Study No. 09-2168, Sponsor Study No. SR09-070 RDEA594: An Oral Gavage 24-Month Carcinogenicity Study in Sprague-Dawley Rats. and the second, conducted by
Study No. 8226466: RDEA594: 26-Week Oral Gavage Carcinogenicity and Toxicokinetic Study in CByB6F1-Tg(HRAS)2Jic Mice. These studies were designed to assess the carcinogenic potential of Zurampic. In the rat study, the actual dose groups were labeled in this report as the Low, Medium, and High dose groups, respectively, plus the Vehicle control group. In the mouse study, the dose groups were labeled Vehicle, Low, Medium, High, and a Positive Control.
Due to high mortality, dosing in the rat study stopped early and were usually terminated
sone thereafter (dosing stopped after 90 weeks in high dose females, and weeks 97-99 in high dose males with termination in weeks 97-99). The Sponsor reports that the termination of dosing thereafter was staggered based on the number of survivors for each group. This early termination may complicate interpretation of results. However, the Sponsor concludes that “In conclusion, RDEA594 administered orally to rats at doses of 25, 75 or 200 mg/kg/day for up to 97 weeks did not affect survival and did not induce an increase in neoplasms in either males or females.” (page 11 of rat report)
The Sponsor summarizes results in the Tg.rasH2 mouse report as follows: “In
conclusion, daily administration of RDEA594 by oral gavage to 001178-T (hemizygous), CByB6F1-Tg(HRAS)2Jic mice for 26 weeks at a dose level of 15, 45, or 125 mg/kg/day to males or 30, 90, or 250 mg/kg/day to females resulted in no effect on survival and no microscopic evidence of increased oncogenicity.” (page 11 of mice report)
1.3. Statistical Issues and Findings
1.3.1. Statistical Issues In this section, several issues, typical of statistical analyses of these studies, are
considered. These issues include comments on the details of the survival analyses, tests on tumorigenicity, multiplicity of tests on neoplasms, and the validity of the designs. 1.3.1.1 Design
In any experiment, when assessing the effects of different levels of dosing, it is important that, except for the actual dose, dose groups should be treated as similarly as possible. In female rats mice the very early sacrifice in the medium dose group and the early cessation of dosing in the high dose group may violate this principle. Note, however, that the poly-k test used does automatically adjust for such reductions in the risk set. Whether that adjustment is adequate or not is not clear
Reference ID: 3847900
(b) (4)
(b) (4)
NDA 207988 Zurampic (lesinurad) Ardea Biosciences, Inc.
9
1.3.1.2. Survival Analysis: In rats, the survival analyses presented here are based on both the log rank test and the
Wilcoxon test comparing survival curves. The Wilcoxon statistic provided by SAS® (technically the Gehan-Wilcoxon statistic) can be cast as a log rank test weighted by the number of subjects at risk, and thus is more sensitive to earlier differences (when more subjects are at risk). The logrank test is most powerful when the survival curves track each other, and thus the hazards, i.e., the conditional probability of the event in the next infinitesimal interval, would be roughly proportional. Note the logrank test seems to be the test usually recommended by statisticians, and is one of the tests used by the Sponsor (in rats in addition to Tarone’s test). Both the logrank and the Wilcoxon tests are used in the FDA analysis of mortality.
For Tg.rasH2 mice, simple tables that are essentially histograms are used as the primary
display to show differences in survival. It is this reviewer’s contention that they display the needed information to demonstrate differences. The relatively small number of animals and the relatively low event rate suggest that the asymptotic results jstifying the usual tests of survival differences, particularly the pairwise comparisons, may have problems. For that reason only the tests of trend in survival, using all animals and displayed in Appendix 1, depend upon the usual asymptotic results. The pairwise tests used for mice are exact versions of the logrank test.
Appendix 1 reviews the specific FDA animal survival analyses in more detail. The
results of the Sponsor’s analysis are summarized in Sections 3.2.1.1 and 3.2.2.1.
1.3.1.3. Multiplicity of Tests on Survival: Using both the logrank and Wilcoxon tests, for each gender in rats and, ignoring the
positive control, mice there are six tests of survival differences in each gender in each species. Assuming tests were performed at the usual 0.05 level, and the tests were stochastically independent, but there were actually absolutely no differences in survival across groups (so one would hope no tests would be statistically significant), the probability of at least one statistically significant result in each gender in each species was about 0.2649 in rats and 0.708 in both genders in both species. These bounds assume the tests are stochastically independent, which they clearly are not, but these values can give some idea of the possible price paid for the multiplicity of hypothesis tests in the statistical frequentist paradigm. 1.3.1.4. Tests on Neoplasms: Sponsors are requested to provide data in either SEND (Standard for the Exchange of Nonclinical Data) format, part of the CDISC consortium, or in the older FDA Biometrics format. Data from both studies fit the latter format. The FDA Biometrics format data sets requested for the analysis of rodent carcinogenicity studies are supposed to include a record for each animal organ combination that was not evaluated. If a number of the animals are not examined, but the proportions of animals showing the tumor under study in each treatment group is roughly the same as in the subset of animals actually reported the calculated p-values will generally be too large, i.e., results will be less statistically significant than they should be, possibly much less. If we can assume the process that determines whether or not a tumor is analyzed in each specific
Reference ID: 3847900
NDA 207988 Zurampic (lesinurad) Ardea Biosciences, Inc.
10
tumor is random, it is perhaps appropriate to consider such endpoints to be both analyzed and have the tumor.
Ignoring these possible problems, the Sponsor’s analyses of tumorigenicity in rats are
Peto tests, with incidental and fatal plus mortality independent tumors. Note that Peto methods require accurate determination of whether a tumor is fatal or incidental. In mice, except for the positive control, survival was consistent across study dose groups. The the Cochran-Armitage tests for carcinogenicity used by the Sponsor’s CRO in the mice study should be appropriate, as were the pairwise comparisons were made using Fisher exact tests.
The FDA analysis in both species is based on a modification of the Cochran-Armitage
test of trend (please see Bailer & Portier, 1988, Bieler & Williams, 1993), adjusted for differential mortality. Inspecting a large number of studies, Bailer and Portier noted that survival time seemed to fit a Weibull distribution, generally with a shape parameter of between 1 and 5, with 3 a typical value. With tmax denoting the maximal time to terminal sacrifice and tobs the time to detection of the tumor in the animal, they proposed weighting the animal by (tobs/tmax)
k, so that an animal that survives for say 52 weeks in 104 week study without the tumor being analyzed is counted as (1/2)k of an animal in the risk set for that tumor. For k = 3, that means that particular animal would count as 1/8 of an animal. Further, the k = 3 specification seems to represent tumor incidence where some animals are perhaps more sensitive and respond earlier to the insult than the remining animals. Under this structure time to incidence would tend to follow a cubic expression. Thus an animal with the specific tumor being studied or who survives to terminal sacrifice without the tumor will be given a weight of 1 when counting the number of animals at risk. However, animals that die early without the tumor are down weighted when counting the number of animals in the risk set for that specific tumor. With differential mortality, as in male mice, this can mean a substantial reduction in the size of that risk set. Note this seems to be an appropriate adjustment for dose groups that are terminated early. The report of the Society of Toxicological Pathology “town hall” meeting in June 2001 recommeded the use of this poly-k modification of the so-called Cochran-Armitage tests of trend over the corresponding Peto tests used by the Sponsor.
The computed significance levels are based on small sample exact permutation tests of
tumor incidence. In the tumor incidence tables the effective size of the risk set for each tumor is listed in the row labeled “Adjusted # at risk ”, and seems to be a more appropriate denominator when comparing incidence rates than the simple unadjusted number evaluated. 1.3.1.5. Multiplicity of Tests on Neoplasms:
Testing dose related treatment differences for each species by gender by organ by tumor combination involves a large number of comparisons. Current FDA practice is based on the Haseman-Lin-Rahman multiplicity adjustments.
The Haseman-Lin-Rahman rules are based on the original multiplicity adjustment of Haseman (1983) and extended by Lin and Rahman on the basis of various simulations. Based on
Reference ID: 3847900

NDA 207988 Zurampic (lesinurad) Ardea Biosciences, Inc.
11
his extensive experience with such analyses, for pairwise tests in a two species study comparing control to the High dose group, Haseman (1983) claimed that for a roughly 0.10 (10%) overall false positive error rate, rare tumors should be tested at a 0.05 (5%) level, and common tumors (with a historical control incidence greater than 1%) at a 0.01 level. Lin & Rahman (1998) proposed a further p-value adjustment for tests of trend. That is, for a roughly 0.10 (10%) overall false positive error rate in tests of trend, rare tumors should be tested at a 0.025 (2.5%) level and common tumors at a 0.005 (0.5%) level. The general specifications are presented in the Table 4 below. This approach is intended to balance both Type I error and Type II error (i.e., the error of concluding there is no evidence of a relation to tumorgenicity when there actually is such a relation).
The proposed Haseman-Lin-Rahman bounds are taken from Guidance for Industry
Statistical Aspects of the Design, Analysis, and Interpretation of Chronic Rodent Carcinogenicity Studies of Pharmaceuticals, (HHS, 2013). The bounds on the right in table 7, below, are grouped so that the last four columns correspond to testing both trend and the pairwise comparison between the high dose and control jointly. The previous four columns ( columns 2-5), correspond to testing both overall trend and pairwise tests between the high dose and control seperately. Within each group there is a column giving the corresponding bounds for a two year, one species study, and another column for the alternate 6-month study. In this analysis we follow the usual practice of testing parameters separately, so the bounds in the leftmost columns are used. The observed tumor incidence in the vehicle group is used to decide if a tumor is classified rare or common. Table 7. Recommended Multiplicity Adjusted Bounds on Significance Levels Testing trend or pairwise difference Joint testing of trend and pairwise
Two Year Alternative Two Year Alternative Trend Pairwise Trend Pairwise Trend Pairwise Trend Pairwise
Common Tumor 0.005 0.01 0.05 0.05 0.005 0.05 0.05 0.05 Rare Tumor 0.025 0.05 0.05 0.05 0.025 0.10 0.05 0.05
In words, as noted in the FDA Guidance (2013) “For tests for positive trend alone, it is recommended that common and rare tumors are tested at 0.005 and 0.025 significance levels, respectively, in the two-year study; and at 0.05 and 0.05 significance levels, respectively in the alternative study. “For [the] control-high pairwise comparison alone, it is recommended that common and rare tumors are tested at 0.01 and 0.05 significance levels, respectively, in the two-year study; and at 0.05 and 0.05 significance levels, respectively, in the alternative study. “For tests for positive trend and control-high pairwise comparison jointly, it is recommended that common and rare tumors are tested at 0.005 and 0.025 significance levels, respectively in trend test, and at 0.05 and 0.10 significance levels, respectively, in control-high pairwise comparison
Reference ID: 3847900
NDA 207988 Zurampic (lesinurad) Ardea Biosciences, Inc.
12
in the two-year study; and at 0.05 and 0.05 significance levels, respectively, in both trend test and control-high pairwise comparison in the alternative study.” (page 32 of 2013 Guidance)
The significance levels of the pairwise tests between the vehicle control with the Low and
Medium dose groups are also provided in the tumor analysis tables below. Following the HLR rules, adding these comparisons can be expected to increase the overall type I error rate to some level above the usual rough 10% level, possibly considerably larger. Again, because of the possibility of genetic drift and for convenience, incidence in the vehicle group is used to determine if the tumor is classified as rare or common. 1.3.1.6. Validity of the Designs:
When determining the validity of designs there are two key points: 1) adequate drug exposure 2) tumor challenge to the tested animals.
1) is related to whether or not sufficient animals survived long enough to be at risk of forming late-developing tumors and 2) is related to the Maximum Tolerated Dose (MTD), designed to achieve the greatest likelihood of tumorigenicity.
Lin and Ali (2006), quoting work by Haseman, have suggested that in standard laboratory
rodent species, a survival rate of about 25 animals, out of 50 or more animals (i.e. 50%), between weeks 80-90 of a two-year study may be considered a sufficient number of survivors as well as one measure of adequate exposure. From tables 14 and 15 in Section 3.2.1.2 below, as a percentage of the High dose group animals that survived to week 91, this criterion is considerably exceded in both genders (Male rats high dose: 31.7% and Female rats: 56.7% ). This may be evidence that the MTD was somewhat exceded in male mice, but such a determination requires the expertise of the toxicologist.
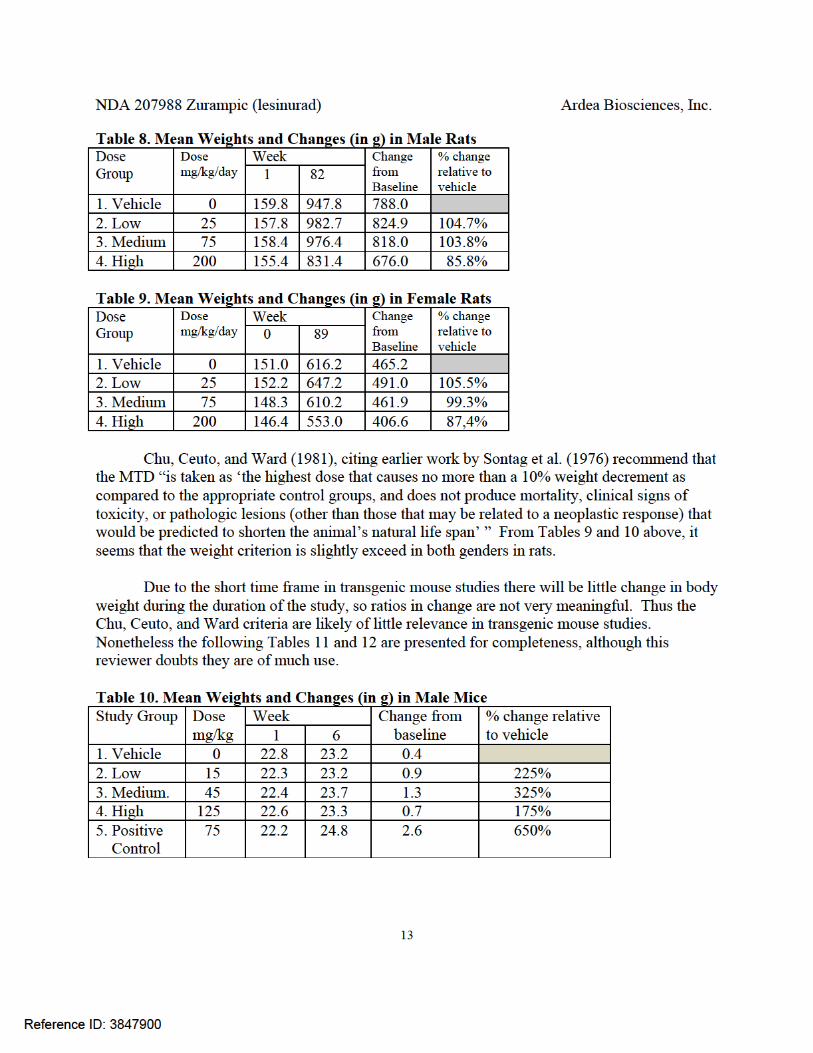
Chu, Ceuto, and Ward (1981), citing earlier work by Sontag et al. (1976) recommend that
the MTD “is taken as ‘the highest dose that causes no more than a 10% weight decrement as compared to the appropriate control groups, and does not produce mortality, clinical signs of toxicity, or pathologic lesions (other than those that may be related to a neoplastic response) that would be predicted to shorten the animal’s natural life span’ ” From Tables 9 and 10 below, it seems that the weight criterion is slightly exceed in both genders in rats. trongly exceded in female rats and to a somewhat lesser strength in male rats. Although its applicability to Tg.rash2 studies is not clear, from Tables 11 and 12 above, it seems that the weight criterion is strongly exceded in both mouse genders in the high-medium and high dose groups.
The mean weight values used to derive differences and ratios in the following tables were
taken directly from the Sponsor’s reports ( Rat Table 5, pages 425-434, and Mice Table 4, pages 50-68). The change from baseline in the table below is the simple difference between the means at the specified dates, and thus animals that die early are only counted at the study initiation, not at the end of the study.
Reference ID: 3847900


NDA 207988 Zurampic (lesinurad) Ardea Biosciences, Inc.
15
The apparent lack of heterogeneity in natural death without tumor is confirmed the results of Fisher exact tests of homogeneity ( Males p =0.2180 and Females p = 0.5267). However, the general applicability of this criterion in Tg.rasH2 mice studies is not as clear, but in the Tg.rasH2 mice study there were no early deaths without tumor. Whether or not these observations are appropriate requires the expertice of the toxicologist.
1.3.2. Statistical Findings Please see Section 1.1 above.
2. INTRODUCTION
2.1. Overview The Sponsor’s reports summarize results from one two-year study, in Sprague-Dawley rats, and the other a 26-week study, in hemizygous Tg.rasH2 mice, both with daily gavage, to assess the carcinogenic potential of Zurampic in the Sponsor’s reports.
2.2. Data Sources SAS data sets for both species, largely following the requested FDA format, both labeled tumor.sas7bdat, plus were translated from SAS transport files both labeled tumor.xpt. It should be noted that in the rat study the SAS variable DTHSACTM (i.e. death or sacrifice time) was renamed to DTHSACTW. In the mouse study a variable SUBGRP was used to discriminate between the Tg.rasH2 mouse carcinogenic study (SUBGRP=1) and the toxicological study in wild type mice (SUBGRP=2). Only the former sub group was analyzed in this report. 3. STATISTICAL EVALUATION 3.1. Evaluation of Efficacy NA 3.2. Evaluation of Safety More detailed results on the study are presented below.
Study No. 09-2168, Sponsor Study No. SR09-070 RDEA594: An Oral Gavage 24-Month Carcinogenicity Study in Sprague-Dawley Rats. and the second, conducted by ,
Study No. 8226466: RDEA594: 26-Week Oral Gavage Carcinogenicity and Toxicokinetic Study in CByB6F1-Tg(HRAS)2Jic Mice.
Reference ID: 3847900
(b) (4)
(b) (4)
(b) (4)

NDA 207988 Zurampic (lesinurad) Ardea Biosciences, Inc.
16
3.2.1. Study No. 09-2168, Sponsor Study No. SR09-070 RDEA594: An Oral Gavage 24-Month Carcinogenicity Study in Sprague-Dawley Rats. CRO: STUDY DURATION: Weeks 90-101 DOSING STARTING DATE: 4 February 2010 STUDY COMPLETED: 28 July 2014 (Date Final Report Signed) RAT STRAIN: Sprague-Dawley CD® Rats ROUTE: Daily Oral gavage
Animals were dosed once daily by oral gavage. The Sponsor’s report states that: “Based
on mortality, dosing was terminated and animals were necropsied earlier than 104 weeks. All decisions to terminate dosing or remove a treatment group from the study were done following consultation and agreement by the FDA. There was no test article related increase in mortality as compared to control animals. For males at all dose levels, dosing was stopped and terminal necropsy was initiated in Week 97. For males at 0, 25, 75 and 200 mg/kg/day, the number (percentage) of males surviving to terminal necropsy was 20 (33%), 18 (30%), 20 (33%) and 27 (45%), respectively. For females at 0, 25, 75, and 200 mg/kg/day, dosing was stopped in Weeks 100, 97, 91 and 90, respectively. Terminal necropsy was conducted on 20 (33%), 15 (25%), 15 (25%) and 15 (25%) survivors in Weeks 100, 100, 91 and 97, respectively.” (page 10 of rat report)
Gross aspects of the study designs for the main study animals are summarized in Table
13 be1ow (a repeat of Table 1 above): Table 13. Design of Rat Study (dose volume 10 mL/kg) Treatment Group
Animals / Gender
Nominal Dose (mg/kg)
Concen- tration (mg/kg)
Week Dosing Stopped
Week of Scheduled Kill 2
Males Females Males Females 1. Vehicle1 60 ( 6) 0 0 97-99 100 97-99 100-1013
2. Low 60 (16) 25 2.5 97 1 97 97 4 100 5 3. Medium 60 (16) 75 7.5 97 1 91 94 6 91 7 4. High 60 (16) 200 20 97-99 90 92 8 97 9 1 Dosing was terminated when the number of surviving animals in the group decreased to 20. 2 All male groups were terminated when the number of surviving control males decreased to 20. 3 Control females were terminated when the number of surviving animals in the group decreased to 20. 4 Dosing was terminated when the number of surviving animals in the group decreased to 20. 5 Group was terminated when the number of surviving animals decreased to 15. 6 Dosing was terminated and animals were sacrificed when the number of surviving animals decreased to 15. 7 Dosing was terminated when the number of surviving animals in the group decreased to 20. 8 Group was terminated when the number of surviving animals decreased to 15. (all comments from page 17 of report)
Reference ID: 3847900
(b) (4)
(b) (4)

NDA 207988 Zurampic (lesinurad) Ardea Biosciences, Inc.
17
According to the Sponsor’s report the “dose levels were selected by the Sponsor based on results from a 13-week interim sacrifice as part of a 6-month study with RDEA594, … in Sprague-Dawley rats. In the 6-month study at a dose of 600 mg/kg/day there was significant toxicity beginning at Study Day 5 consisting of a severe reduction in food consumption and weight loss. This was followed by moribundity leading to death and unscheduled euthanasia. The entire 600-mg/kg/day group was terminated on Study Day 23. At a dose of 300 mg/kg/day, there were no treatment-related deaths during the 6 months of dosing. During the first two weeks of dosing at 300 mg/kg/day there was a transient decrease in food consumption and corresponding decrease in body weight gain. Over the length of the study, food consumption normalized and body weights compensated for the initial decrease. There were no treatment-related observations at this dose by the end of 6 months. Based on the information from the 13-week interim study the FDA recommended a high dose of 200 mg/kg/day for the 2-year study based on maximum tolerated dose (MTD) criteria. Low and mid doses of 25 and 75 mg/kg/day were selected to provide information on the dose relationship of findings.” (page 19-20 of rat report) The oral route of administration was selected for this study as this route has been defined by the Sponsor as the intended route of clinical administration.
The suggested mechanism of action is “RDEA594 is an inhibitor of the uric acid transporter 1 (URAT-1) in the proximal tubule of the kidney. RDEA594 blocks the reabsorption of uric acid in the kidney leading to a reduction in serum uric acid levels.” (page 20 of rat report)
Animals were housed individually with food and water available ad libitum. The
Sponsor states that detailed clinical examinations were made at least weekly.
3.2.1.1 Sponsor’s Results and Conclusions
This section will present a summary of the Sponsor’s analysis on survivability and tumorigencity in rats.
Survival analysis:
The CRO’s report summarizes survival results as follows: “Based on mortality, (unscheduled, including accidental deaths), dosing was terminated and males and females in all dose groups were necropsied prior to the scheduled intervals. However, mortality was not considered to be test article related.” (page 51 of report)!!
!Tumorigenicity analysis: The Statistical CRO describes a typical Peto style analysis of carcinogenicity. The results are summarized as follows: “ Males “There were no statistically significant differences between the treated groups and the control group.”
Reference ID: 3847900

NDA 207988 Zurampic (lesinurad) Ardea Biosciences, Inc.
18
“Females “Pituitary (pars distalis) … “For benign adenoma and malignant carcinoma combined, the trend test was not statistically significant when all groups were included in the analysis (p=0.011). The pairwise comparison of the control group with the 75 mg/kg treated group was statistically significant (p=0.006).” (page 8 of statistical report, 3423 of rat report) 3.2.1.2 FDA Reviewer's Results
This section will present the current Agency findings on survival and tumorigenicity in male and female rats.
Survival analysis:
Kaplan-Meier plots comparing treatment groups in both studies are given in Appendix 1, along with more details of the analyis. The following tables (Table 14 for male rats, Table 15 for female rats) summarize the mortality results for the dose groups. The data were grouped for the specified time period, and present the number of deaths during the time interval over the number at risk at the beginning of the interval. The percentage cited is the percent survived at the end of the interval. Table 14. Summary of Male Rats Mortality (dose/kg/day) Period 1.Vehicle 2.Low 3.Medium 4.High 0-52 4/60
93.3% 2/60 96.7%
6/60 90.0%
6/60 90.0%
53-70 7/56 81.7%
9/58 81.7%
11/54 71.7%
10/54 73.3%
71-91 19/49 50.0%
20/49 48.3%
27/43 26.7%
25/44 31.7%
92-100 10/30 33.3%
14/29 25.0%
1/16 25.0%
4/19 25.0%
terminal 20 15 15 15 1 number deaths / number at risk 2 per cent survival to end of period.
Reference ID: 3847900

NDA 207988 Zurampic (lesinurad) Ardea Biosciences, Inc.
19
Table 15. Summary of Female Rats Mortality (dose/kg/day) Period 1.Vehicle 2.Low 3.Medium 4.High 0-52 4/60
93.3% 6/60 90.0%
5/60 91.7%
5/60 91.7%
53-78 7/56 81.7%
8/54 76.7%
11/55 73.3%
7/55 80.0%
79-91 19/49 50.0%
19/46 45.0%
16/44 46.7%
14/48 56.7%
92-104 10/30 33.3%
9/27 30.0%
8/28 33.3%
7/34 45.0%
terminal 20 18 20 27 1 number deaths / number at risk 2 per cent survival to end of period.
!Kaplan-Meier survival curves for the rat study are presented in Appendix 1. The results
of statistical tests of differences in survival are given below (a repeat of Table 3): Table 16. Statistical Significances of Tests of Homogeneity and Trend in Survival in Rats Hypotheses Males Females
Logrank Wilcoxon Logrank WilcoxonHomogeneity over all four groups 0.4664 0.5764 0.0204 0.0225
No Trend over all four groups 0.1874 0.2968 0.0903 0.0655
No difference between high dose and vehicle 0.3168 0.4734 0.0941 0.0851
From Figure A.1.1 in the appendix, in male rats the Kaplan-Meier estimated survival
curves are largely intertwined, consistent with no tests of differences in survival being close to statistical significance. From Figure A.1.2 survival in female, the vehicle and low dose groups track each other closely with the higher survival than the high and medium dose groups. These differences were statistically significant (Logrank p= 0.0204, Wicoxon p= 0.0225). The high and medium dose groups track each other somewhat closely, but with some tendency for higher survival in the high dose group. No other tests or comparisons quite reached the usual 0.05 level of statistical significance.
Tumorigenicity analysis:
Table 17 below, a repeat of Table 6 above and Table A.2.1 below, shows the tumors in rats that had at least one non-multiplicity adjusted test that was statistically significant at a 0.10 or lesser level . For each tumor-organ combination the tumor incidence over the four dose groups is listed first, followed by the significance levels of the overall test of trend over all four dose groups, and finally the comparison of the high, medium and low dose groups with vehicle. .
Reference ID: 3847900

NDA 207988 Zurampic (lesinurad) Ardea Biosciences, Inc.
20
Table 17. Potentially Statistically Significant Results for Organ-Tumor Combinations in Rats Overall Results Tumor Incidence Significance Levels Gender Veh Low Med High ptrend phigh pmed plow Organ/Tumor vsVeh vsVeh vsVeh Male Rats SKIN # Evaluated 60 60 60 60 Adj. # at Risk 39.7 37.8 37.8 42.1 MYXOSARCOMA 0 0 0 2 .0721 .2657 . . THYROID # Evaluated 59 60 60 60 Adj. # at Risk 39.7 38.0 39.0 41.8 C-CELL ADENOMA 0 2 2 4 .0482 .0640 .2403 .2337 Female Rats PANCREAS # Evaluated 60 60 60 60 Adj. # at Risk 41.0 40.4 29.2 33.9 ISLET CELL ADENOMA 0 0 0 2 .0527 .2009 . . PITUITARY # Evaluated 60 60 60 60 Adj. # at Risk 54.0 56.2 49.8 54.7 PARS DISTALIS ADENOMA 43 41 41 49 .0158 .0872 .3933 .8452 Adj. # at Risk 41.0 41.3 31.2 33.8 PARS DISTALIS: CARCINOMA 0 3 4 1 .4539 .4521 .0324 .1249 Adj. # at Risk 54.0 57.1 51.7 54.7 Pars Dist. Adenoma/Carcinoma 43 44 45 50 .0092 .0463 .1761 .7056 Using the tumor incidence in the vehicle to determine whether a tumor should be classified as rare or common, only pars distalis adenoma and pooled adenoma and carcinoma would be classified as common tumors, the rest rare. However, after adjusting for multiplicity using the Haseman-Lin-Rahman rules, in both genders in rats when testing hypotheses of trend or pairwise differences, strictly speaking no tests were statistically significant. Complete tables of tumor incidence are given in Tables A.2.2 and A.2.3, below.
Complete results of statistical poly-k tests of tumor trend and differences between dose groups in male rats and female rats are given in Tables A.2.3 and A.2.4 in appendix 2.
3.2.2. Study No. 8226466: RDEA594: 26-Week Oral Gavage Carcinogenicity and Toxicokinetic Study in CByB6F1-Tg(HRAS)2Jic Mice. CRO: STUDY DURATION: Weeks 90-101 DOSING STARTING DATE: 4 February 2010 STUDY COMPLETED: 28 July 2014 (Date Final Report Signed) RAT STRAIN: Sprague-Dawley CD® Rats ROUTE: Daily Oral gavage
Reference ID: 3847900
(b) (4)
(b) (4)

NDA 207988 Zurampic (lesinurad) Ardea Biosciences, Inc.
21
The Sponsor’s report indicates that in the mouse study: “Male and female 001178-T
(hemizygous), CByB6F1-Tg(HRAS)2Jic and 001178-W (wild type), CByB6F1-Tg(HRAS)2Jic mice were assigned to groups, and doses were administered as indicated in the following table. Hemizygous animals were assigned to carcinogenicity subgroups; wild-type animals were assigned to toxicokinetic subgroups.” (page 10 of report) General aspects of the study design for the mice study are also summarized in Table 18 be1ow (a repeat of Table 2 above): Table 18. Design of Mice Study (Volume 10 mL/kg) Treatment Group1
# Main study animals (# toxicology study
animals)/gender
Nominal Dose (mg/kg/day)
Concentration 2
(mg/mL)
Male Female Male Female 1. Water3 25 ( 3) 0 0 0 0 2. Low 25 (18) 15 30 1.5 3 3. Medium 25 (18) 45 60 4.5 9 4. High 25 (18) 125 200 12.5 25 5. Positive4 Control
20 75 75 7.5 7.5
1 Doses selected were based on the Maximum Tolerated Dose (MTD) in each gender due to renal and/or hepatic toxicity observed in a 28-day study ( Study No. 8226465);
2 Concentrations (Groups 2 through 4 only) were based on the free acid content. A lot specific correction factor of 1.20 was used. 3 Group 1 received vehicle control article (reverse osmosis water) only. 4 Group 5 was dosed with one intraperitoneal dose of N-methyl-N-nitrosourea on Day 1 of the dosing phase.
Animals were approximately six to seven weeks old at first dosing. After randomization
animals were housed individually. The Sponsor states that animals were checked twice daily, with detailed physical examinations at least weekly. .
3.2.2.1 Sponsor’s Results and Conclusions
This section will present a summary of the Sponsor’s analysis on survivability and tumorigencity in mice.
Survival analysis:
The CRO report summarizes results in survival as follows: “For males, the positive control group (Group 5) had a significant increase in mortality (p = 0.0000 by the Cox-Tarone and Gehan-Breslow tests). None of the groups given test article had any significance in mortality compared with the vehicle control group (Group 1). “For females, the positive control group (Group 5) had a significant increase in mortality (p = 0.0000 by the Cox-Tarone and Gehan-Breslow tests). Females given the test article had a borderline positive trend in mortality (p = 0.0275 by the Cox-Tarone test and p = 0.0257 by the Gehan-Breslow test). None of the aforementioned groups had a
Reference ID: 3847900
(b) (4)

NDA 207988 Zurampic (lesinurad) Ardea Biosciences, Inc.
22
significant increase in mortality over the vehicle control group.” (page 1364 of report, page 4 of statistical report) Tumorigenicity analysis: The Sponsor’s analysis of carcinogenicity is based on Cochran-Armitage tests of trend. Considering that, except for the positive control, there are only small differences in mortality across dose groups so the standards Cochran-Armitage test of trend and the Fisher exact test for pairwise differences should be appropriate. The CRO report summarizes results as follows: “Males had no statistically significant positive trend or increase in neoplastic lesions in any of the groups given the test article. The male positive control group (Group 5) had increases in skin/subcutis squamous cell papilloma, nonglandular stomach squamous cell papilloma, and nonglandular stomach squamous cell papilloma and/or carcinoma and a statistically significant increase in body, whole/cavity lymphosarcoma (p = 0.0000). “Females had no statistically significant positive trend or increase in neoplastic lesions in any of the groups given the test article. The female positive control group (Group 5) had increases in several cases with incomplete observations and a statistically significant increase in body, whole/cavity lymphosarcoma (p = 0.0000).” (page 1364 of report, page 4 of statistical report).e
Note the FDA analysis is base on the poly-k tests, which adjust the Cochran-Armitage
test for any differential mortality. 3.2.1.2 FDA Reviewer's Results
This section will present the current Agency findings on survival and tumorigenicity in male and female mice.
Survival analysis:
The following tables (Table 19 for male mice, Table 20 for female mice, repeats of tables 4 and 5 above) summarize the mortality results for the dose groups. These times are to be read as incidence over the approximate time line of the study. Multiple deaths, say for k deaths, at that numeric week are indicated by “k*week”. Although this reviewer considers the plots/tables below to be more informative, traditional Kaplan-Meier survival plots are presented as plots in Appendix 1, along with the results of tests of dose related trend in survival and differences between the vehicle and various dose groups. Table 19. Survival Times in Male Tg.rasH2 Mice Dose Group Dosage Survival Time in Days 1.Vehicle 0 25*27
2. Low 15 24, 24*27
3. Medium 45 25*27 4. High 125 11 24*27 5. Positive Control
75 11,12, 15,16,17, 19,20,21,22, 3*24,2*25, 6*27
Reference ID: 3847900

NDA 207988 Zurampic (lesinurad) Ardea Biosciences, Inc.
23
Table 20. Survival Times in Female Tg.rasH2 Mice Dose Group Dosage Survival Time in Days 1.Vehicle 0 26,24*27
2. Low 30 25*27
3. Medium 90 15 24*27 4. High 250 7,8, 12, 19 21*27 5. Positive Control
75 12,13, 15, 2*18, 4*20,21, 2*23,2*24, 6*27
Kaplan-Meier plots comparing treatment groups in both studies are given in Appendix 1,
along with more details of the analysis.
Tumorigenicity analysis:
Table 21 below, a repeat of Table 7 above and Table A.2.2 below, shows the organ-tumor combinations associated with at least one non-multiplicity adjusted test that was statistically significant at a 0.10 level. To adjust for the multiplicity of tests the so-called Haseman-Lin-Rahman (HLR) rules discussed in Section 1.3.1.6 are often applied. In this particular case we have a two-year study in rats and an alternative short term study in mice. An adjustment that seems to work is that in the rat study for a roughly 10% overall error rate tests of trend would be considered significant it the tests for positive trend alone would be tested at 0.005 and 0.025 significance levels, for common and rare tumors respectively. Control-high pairwise would be tested 0.01 and 0.05 significance levels, respectively. In the alternative mouse study all levels comparisons would be tested at a 0.05 level. If we require both the tests of trend and the pairwise comparison to be significant, the only change would be that the pairwise test in the two year study be tested at a 0.10 level for rare tumors. Using these adjustments for other tests, like testing the comparisons between the low and medium dose groups versus vehicle can be expected to increase the overall type I error rate to some value above the nominal rough 10% level, possibly considerably higher than the nominal 10% rate.
Table 21, below, shows those rows with at least one tumor with at least one non-
multiplicity adjusted test that was statistically significant or close, to a 0.10 level.
Reference ID: 3847900

NDA 207988 Zurampic (lesinurad) Ardea Biosciences, Inc.
24
Table 21. Potentially Statistically Significant Results for Organ-Tumor Combinations in Rats Overall Results Tumor Incidence Significance Levels Gender Veh Low Med High ptrend phigh pmed plow Organ/Tumor vsVeh vsVeh vsVeh Male Rats SKIN # Evaluated 60 60 60 60 Adj. # at Risk 39.7 37.8 37.8 42.1 MYXOSARCOMA 0 0 0 2 .0721 .2657 . . THYROID # Evaluated 59 60 60 60 Adj. # at Risk 39.7 38.0 39.0 41.8 C-CELL ADENOMA 0 2 2 4 .0482 .0640 .2403 .2337 Female Rats PANCREAS # Evaluated 60 60 60 60 Adj. # at Risk 41.0 40.4 29.2 33.9 ISLET CELL ADENOMA 0 0 0 2 .0527 .2009 . . PITUITARY # Evaluated 60 60 60 60 Adj. # at Risk 54.0 56.2 49.8 54.7 PARS DISTALIS ADENOMA 43 41 41 49 .0158 .0872 .3933 .8452 Adj. # at Risk 41.0 41.3 31.2 33.8 PARS DISTALIS: CARCINOMA 0 3 4 1 .4539 .4521 .0324 .1249 Adj. # at Risk 54.0 57.1 51.7 54.7 Pars Dist. Adenoma/Carcinoma 43 44 45 50 .0092 .0463 .1761 .7056 Using the tumor incidence in the vehicle to determine whether a tumor should be cllassified as rare or common, only pars distalis adenoma and pooled adenoma and carcinoma would be classified as common tumors, the rest rare. However, after adjusting for multiplicity using the Haseman-Lin-Rahman rules, in both genders in rats when testing hypotheses of trend or pairwise differences, strictly speaking no tests were statistically significant. Complete tables of tumor incidence are given in Tables A.2.2 and A.2.3, below.
Complete results of statistical poly-k tests of tumor trend and differences between dose
groups in male and female mice are given in Table A.2.5 and Table A.2.6 in Appendix 2.
4. FINDINGS IN SPECIAL/SUBGROUP POPULATIONS NA
Reference ID: 3847900

NDA 207988 Zurampic (lesinurad) Ardea Biosciences, Inc.
25
5. SUMMARY AND CONCLUSIONS
5.1. Statistical Issues and Collective Evidence
Please see Section 1.3 above.
5.2. Conclusions and Recommendations Please see section 1.1 above.
Reference ID: 3847900
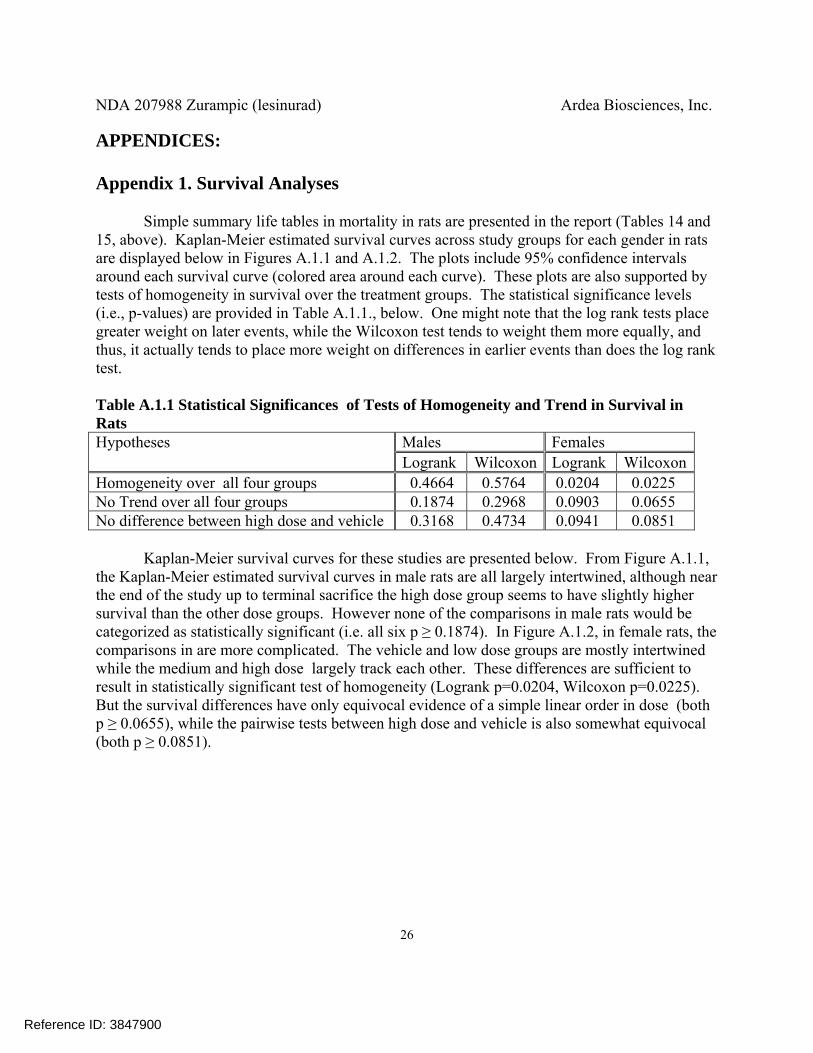
NDA 207988 Zurampic (lesinurad) Ardea Biosciences, Inc.
26
APPENDICES: Appendix 1. Survival Analyses
Simple summary life tables in mortality in rats are presented in the report (Tables 14 and
15, above). Kaplan-Meier estimated survival curves across study groups for each gender in rats are displayed below in Figures A.1.1 and A.1.2. The plots include 95% confidence intervals around each survival curve (colored area around each curve). These plots are also supported by tests of homogeneity in survival over the treatment groups. The statistical significance levels (i.e., p-values) are provided in Table A.1.1., below. One might note that the log rank tests place greater weight on later events, while the Wilcoxon test tends to weight them more equally, and thus, it actually tends to place more weight on differences in earlier events than does the log rank test. Table A.1.1 Statistical Significances of Tests of Homogeneity and Trend in Survival in Rats Hypotheses Males Females
Logrank Wilcoxon Logrank WilcoxonHomogeneity over all four groups 0.4664 0.5764 0.0204 0.0225
No Trend over all four groups 0.1874 0.2968 0.0903 0.0655
No difference between high dose and vehicle 0.3168 0.4734 0.0941 0.0851
Kaplan-Meier survival curves for these studies are presented below. From Figure A.1.1,
the Kaplan-Meier estimated survival curves in male rats are all largely intertwined, although near the end of the study up to terminal sacrifice the high dose group seems to have slightly higher survival than the other dose groups. However none of the comparisons in male rats would be categorized as statistically significant (i.e. all six p ≥ 0.1874). In Figure A.1.2, in female rats, the comparisons in are more complicated. The vehicle and low dose groups are mostly intertwined while the medium and high dose largely track each other. These differences are sufficient to result in statistically significant test of homogeneity (Logrank p=0.0204, Wilcoxon p=0.0225). But the survival differences have only equivocal evidence of a simple linear order in dose (both p ≥ 0.0655), while the pairwise tests between high dose and vehicle is also somewhat equivocal (both p ≥ 0.0851).
Reference ID: 3847900

NDA 207988 Zurampic (lesinurad) Ardea Biosciences, Inc.
27
Figure A.1.1 Kaplan-Meier Survival Curves for Male Rats
Figure A.1.2 Kaplan-Meier Survival Curves for Female Rats
Tables A.1.2 and A.1.3, below, display the weeks of death among the Tg.rasH2 animals. If there are multiple deaths in any week, the number of replicates precedes the week is places
Reference ID: 3847900
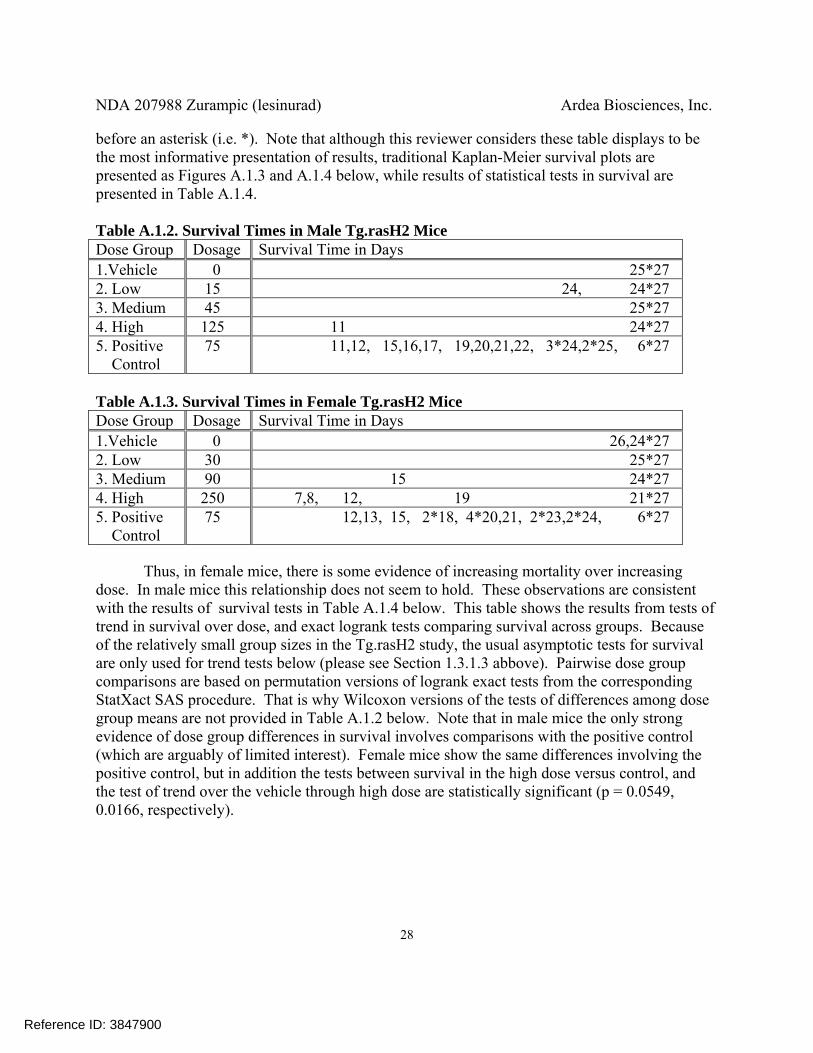
NDA 207988 Zurampic (lesinurad) Ardea Biosciences, Inc.
28
before an asterisk (i.e. *). Note that although this reviewer considers these table displays to be the most informative presentation of results, traditional Kaplan-Meier survival plots are presented as Figures A.1.3 and A.1.4 below, while results of statistical tests in survival are presented in Table A.1.4. Table A.1.2. Survival Times in Male Tg.rasH2 Mice Dose Group Dosage Survival Time in Days 1.Vehicle 0 25*27
2. Low 15 24, 24*27
3. Medium 45 25*27 4. High 125 11 24*27 5. Positive Control
75 11,12, 15,16,17, 19,20,21,22, 3*24,2*25, 6*27
Table A.1.3. Survival Times in Female Tg.rasH2 Mice Dose Group Dosage Survival Time in Days 1.Vehicle 0 26,24*27
2. Low 30 25*27
3. Medium 90 15 24*27 4. High 250 7,8, 12, 19 21*27 5. Positive Control
75 12,13, 15, 2*18, 4*20,21, 2*23,2*24, 6*27
Thus, in female mice, there is some evidence of increasing mortality over increasing
dose. In male mice this relationship does not seem to hold. These observations are consistent with the results of survival tests in Table A.1.4 below. This table shows the results from tests of trend in survival over dose, and exact logrank tests comparing survival across groups. Because of the relatively small group sizes in the Tg.rasH2 study, the usual asymptotic tests for survival are only used for trend tests below (please see Section 1.3.1.3 abbove). Pairwise dose group comparisons are based on permutation versions of logrank exact tests from the corresponding StatXact SAS procedure. That is why Wilcoxon versions of the tests of differences among dose group means are not provided in Table A.1.2 below. Note that in male mice the only strong evidence of dose group differences in survival involves comparisons with the positive control (which are arguably of limited interest). Female mice show the same differences involving the positive control, but in addition the tests between survival in the high dose versus control, and the test of trend over the vehicle through high dose are statistically significant (p = 0.0549, 0.0166, respectively).
Reference ID: 3847900


NDA 207988 Zurampic (lesinurad) Ardea Biosciences, Inc.
30
Figure A.1.4 Kaplan-Meier Survival Curves for Female Mice
Again, although this reviewer questions the value of the Kaplan-Meier plots in mice, it is
clear that they are chonsistent with the results of statistical tests of survival discussed above. That is, the primary differences in survival are beween group 5, the positive control, and the remaning dose groups.
Reference ID: 3847900

NDA 207988 Zurampic (lesinurad) Ardea Biosciences, Inc.
31
Appendix 2. FDA Poly-k Tumorigenicity Analysis
The poly-k test, here with k = 3, modifies the original Cochran-Armitage test to adjust for differences in mortality (please see Bailer & Portier, 1988, Bieler & Williams, 1993). The tests used here are small sample exact permutation tests of tumor incidence. When there were no tumors of the specific type being analyzed in either column of the 2x2 table corresponding to a pairwise comparison an argument could be made that the p-value for this test should be 1.0. However, largely for readability, in the tables below these p-values are considered as missing (i.e., corresponding to a null test), denoted by a period “.”. Note that the StatXact program used for these analyses adjusts for the variance, which would be 0. Then the significance levels of the test statistics are based on the result of a division by 0, i.e., undefined, and hence StatXact codes these p-values as missing.
For each gender by organ combination the number of animals microscopically analyzed
is presented first. Note that indicating an organ was not examined requires a specification in the data (please see section 2.2 above). It is possible that this specification could be missing in some of this data. Then the number of animals at risk could be inflated, and the proportion of animals with tumor would be artificially decreased. Thus, as discussed in Section 1.3.1.5 above, for some of these organs it is possibly more appropriate to define the actual endpoint used in the statistical analysis be the condition of being microscopically analyzed and show the tumor. This does have problems unless treatment groups are not treated equally except for actual treatment.
The entry for each tumor is preceded by the adjusted number of animals at risk for that
endpoint. It seems clear that an animal that dies early without having displaying that endpoint reduces the size of the risk set for that getting that particular endpoint. The poly-k test down weights such animals, and as also discussed in Section 1.3.1.5, above, the sum of these poly-k weights seems to be a better estimate of the number of animals at risk of getting that tumor than the simple number of animals analyzed. This sum is given in the row labeled “Adjusted # at risk”. In rats the tumor incidence is presented in the the next row, with the significance levels of the tests of trend, and the results of pairwise tests between the high, medium, and low dose groups versus vehicle. In mice the row indicating the tumor incidence also includes the incidence in the positive control, and continues with the results of the test of trend and pairwise tests between the high and medium dose groups. In mice there is a further row with the p-values of the pairwise tests between the low and positive control versus vehicle. For these analyses, incidence in the vehicle, water only, group is used to assess background tumor incidence, and thus whether a tumor is considered to be rare (background incidence < 1%) or common. Note that for this analysis a tumor is only classified as rare if the vehicle control group shows none of that particular tumor.
To adjust for the multiplicity of tests the so-called Haseman-Lin-Rahman (HLR) rules
discussed in Section 1.3.1.6 are often applied. In this particular case we have a two-year study in rats and an alternative short term study in mice. An adjustment that seems to work is that in the rat study for a roughly 10% overall error rate tests of trend would be considered significant it the
Reference ID: 3847900
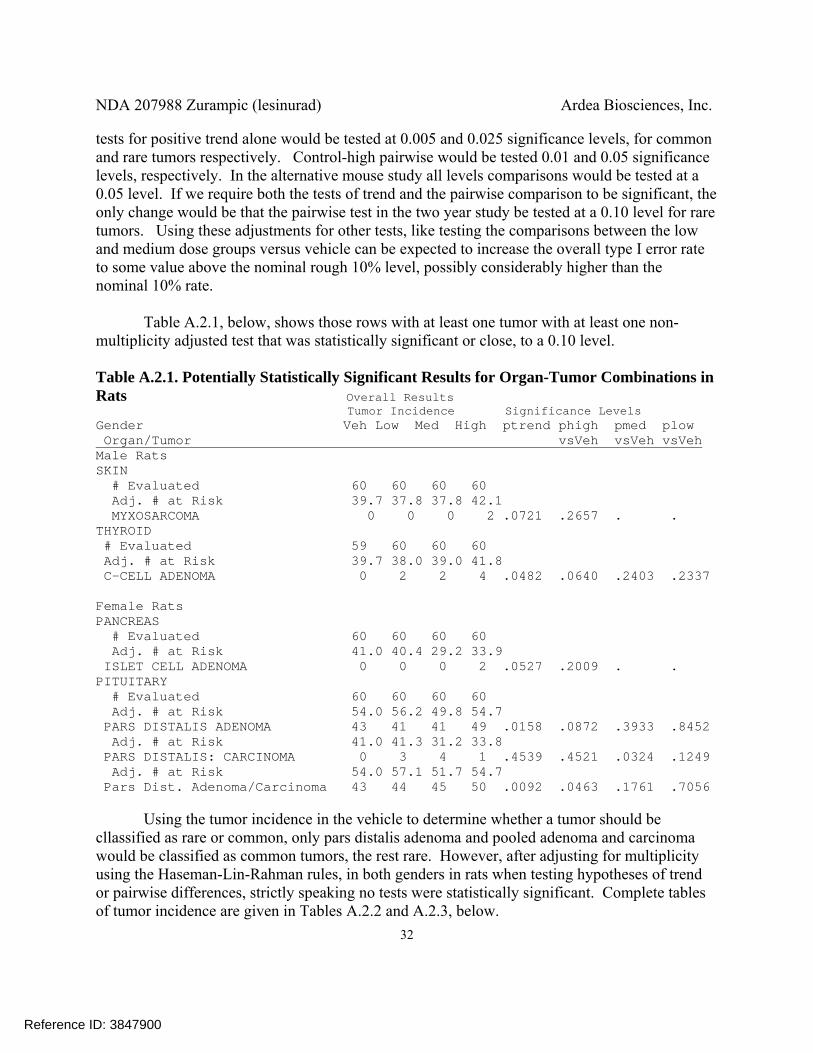
NDA 207988 Zurampic (lesinurad) Ardea Biosciences, Inc.
32
tests for positive trend alone would be tested at 0.005 and 0.025 significance levels, for common and rare tumors respectively. Control-high pairwise would be tested 0.01 and 0.05 significance levels, respectively. In the alternative mouse study all levels comparisons would be tested at a 0.05 level. If we require both the tests of trend and the pairwise comparison to be significant, the only change would be that the pairwise test in the two year study be tested at a 0.10 level for rare tumors. Using these adjustments for other tests, like testing the comparisons between the low and medium dose groups versus vehicle can be expected to increase the overall type I error rate to some value above the nominal rough 10% level, possibly considerably higher than the nominal 10% rate.
Table A.2.1, below, shows those rows with at least one tumor with at least one non-
multiplicity adjusted test that was statistically significant or close, to a 0.10 level.
Table A.2.1. Potentially Statistically Significant Results for Organ-Tumor Combinations in Rats Overall Results Tumor Incidence Significance Levels Gender Veh Low Med High ptrend phigh pmed plow Organ/Tumor vsVeh vsVeh vsVeh Male Rats SKIN # Evaluated 60 60 60 60 Adj. # at Risk 39.7 37.8 37.8 42.1 MYXOSARCOMA 0 0 0 2 .0721 .2657 . . THYROID # Evaluated 59 60 60 60 Adj. # at Risk 39.7 38.0 39.0 41.8 C-CELL ADENOMA 0 2 2 4 .0482 .0640 .2403 .2337 Female Rats PANCREAS # Evaluated 60 60 60 60 Adj. # at Risk 41.0 40.4 29.2 33.9 ISLET CELL ADENOMA 0 0 0 2 .0527 .2009 . . PITUITARY # Evaluated 60 60 60 60 Adj. # at Risk 54.0 56.2 49.8 54.7 PARS DISTALIS ADENOMA 43 41 41 49 .0158 .0872 .3933 .8452 Adj. # at Risk 41.0 41.3 31.2 33.8 PARS DISTALIS: CARCINOMA 0 3 4 1 .4539 .4521 .0324 .1249 Adj. # at Risk 54.0 57.1 51.7 54.7 Pars Dist. Adenoma/Carcinoma 43 44 45 50 .0092 .0463 .1761 .7056 Using the tumor incidence in the vehicle to determine whether a tumor should be cllassified as rare or common, only pars distalis adenoma and pooled adenoma and carcinoma would be classified as common tumors, the rest rare. However, after adjusting for multiplicity using the Haseman-Lin-Rahman rules, in both genders in rats when testing hypotheses of trend or pairwise differences, strictly speaking no tests were statistically significant. Complete tables of tumor incidence are given in Tables A.2.2 and A.2.3, below.
Reference ID: 3847900

NDA 207988 Zurampic (lesinurad) Ardea Biosciences, Inc.
33
In mice, with the exception of the comparisons between the vehicle and the positive
control, in mice, no tests achieved even the nominal 0.10 level, let alone any multiplicity adjusted level of statistical significance. Since it was felt that the tests between the vehicle and positive control seemed to be primarily used to assess the appropriateness of the mouse model, they are not addressed further. Complete tables of tumor incidence are given in Tables A.2.4 and A.2.5, below.
Table A.2.2. Incidence and Results for Organ-Tumor Combinations in Male Rats Overall Results Tumor Incidcence Significance Levels Organ/Tumor Veh Low Med High ptrend phigh pmed plow vsVeh vsVeh vsVeh ADRENAL GLANDS # Evaluated 60 60 60 60 Adj. # at Risk 40.2 37.8 37.8 41.4 COMPLEX PHEOCHROMOCYTOMA 1 0 0 0 1 1 1 1 Adj. # at Risk 40.3 37.8 37.9 41.4 CORTEX: ADENOMA 2 0 2 0 .8369 1 .6623 1 Adj. # at Risk 40.5 38.3 38.1 41.5 MEDULLA BENIGN PHEOCHROMOCYTOMA 4 4 1 2 .8655 .9050 .9688 .6147 Adj. # at Risk 40.2 37.9 38.2 41.4 MEDULLA: MALIGNANT PHEOCHROMO. 1 1 1 0 .8344 1 .7403 .7334 Adj. # at Risk 41.4 38.3 38.5 41.5 Pheocromocytoma Any 6 4 2 2 .9403 .9715 .9636 .8117 BODY (ENTIRE) # Evaluated 0 1 0 0 Adj. # at Risk 0.0 1.0 0.0 0.0 SARCOMA, NOS 0 1 0 0 1 . . . BRAIN # Evaluated 60 60 60 60 Adj. # at Risk 39.8 38.2 37.8 41.4 ASTROCYTOMA 1 1 0 0 .9379 1 1 .7468 Adj. # at Risk 39.7 37.8 38.4 41.4 OLIGODENDROGLIOMA 0 0 1 0 .5097 . .4935 . EAR(S) # Evaluated 0 0 0 2 Adj. # at Risk 0.0 0.0 0.0 1.1 AMELANOTIC MELANOMA 0 0 0 1 1 . . . EXTREMITY # Evaluated 46 39 40 37 Adj. # at Risk 32.0 29.0 29.7 29.9 SQUAMOUS PAPILLOMA 0 0 0 1 .2458 .4754 . . EYES # Evaluated 60 60 60 60 Adj. # at Risk 39.7 37.9 37.8 41.4 MELANOMA 0 1 0 0 .7468 . . .4868 JEJUNUM # Evaluated 59 54 52 52 Adj. # at Risk 39.3 35.6 35.3 38.5 ADENOCARCINOMA 2 0 0 0 1 1 1 1
Reference ID: 3847900

NDA 207988 Zurampic (lesinurad) Ardea Biosciences, Inc.
34
Table A.2.2.(cont.) Incidence and Results for Organ-Tumor Combinations in Male Rats Overall Results Tumor Incidcence Significance Levels Organ/Tumor Veh Low Med High ptrend phigh pmed plow vsVeh vsVeh vsVeh KIDNEYS # Evaluated 60 60 60 60 Adj. # at Risk 40.2 37.8 37.8 41.4 LIPOSARCOMA 1 0 0 0 1 1 1 1 Adj. # at Risk 39.7 37.8 37.8 41.4 TUBULAR ADENOMA 0 0 1 0 .5065 . .4868 . LYMPH/RETIC SYS # Evaluated 60 60 60 60 Adj. # at Risk 39.7 37.8 37.8 41.9 GRANULOCYTIC LEUKEMIA 0 0 0 1 .2662 .5125 . . Adj. # at Risk 41.0 38.3 37.8 41.4 HISTIOCYTIC SARCOMA 2 1 0 0 .9841 1 1 .8701 Adj. # at Risk 39.7 38.0 37.8 41.4 LARGE GRANULAR LYMPHOCYTE (LGL) 0 1 0 0 .7468 . . .4868 MAMMARY AREAS # Evaluated 60 60 60 60 Adj. # at Risk 39.7 37.8 38.4 41.4 ADENOCARCINOMA 0 0 1 0 .5097 . .4935 . MESENTERIC LN # Evaluated 60 60 60 60 Adj. # at Risk 39.7 37.8 37.8 41.4 HEMANGIOSARCOMA 0 0 1 0 .5065 . .4868 . Adj. # at Risk 39.8 37.8 37.8 41.4 SARCOMA, NOS 1 0 0 0 1 1 1 1 MESENTERY/PERITO # Evaluated 1 2 0 0 Adj. # at Risk 0.8 1.5 0.0 0.0 SARCOMA, NOS 0 1 0 0 1 . . . PANCREAS # Evaluated 60 60 60 60 Adj. # at Risk 40.3 38.8 38.1 41.8 ISLET CELL ADENOMA 2 5 4 2 .7399 .7016 .3131 .1948 Adj. # at Risk 40.2 37.9 38.0 41.5 ISLET CELL CARCINOMA 1 1 3 1 .5334 .7593 .2785 .7334 Adj. # at Risk 40.7 38.9 38.3 42.0 Islet Cell Adenoma/Carcinoma 3 6 7 3 .7309 .6854 .1350 .2152 PITUITARY # Evaluated 60 60 60 60 Adj. # at Risk 47.8 44.6 47.7 49.5 PARS DISTALIS ADENOMA 31 23 30 28 .6681 .8637 .6670 .9386 PREPUT/CLIT GL # Evaluated 0 0 0 1 Adj. # at Risk 0.0 0.0 0.0 1.0 ADENOMA 0 0 0 1 1 . . . PROSTATE # Evaluated 60 60 60 60 Adj. # at Risk 39.7 37.8 37.8 41.4 ADENOMA 0 0 0 1 .2662 .5125 . . RETROPERITONEAL # Evaluated 0 0 0 1 Adj. # at Risk 0.0 0.0 0.0 1.0 SARCOMA, NOS 0 0 0 1 1 . . .
Reference ID: 3847900

NDA 207988 Zurampic (lesinurad) Ardea Biosciences, Inc.
35
Table A.2.2. (cont.) Incidence and Results for Organ-Tumor Combinations in Male Rats Overall Results Tumor Incidcence Significance Levels Organ/Tumor Veh Low Med High ptrend phigh pmed plow vsVeh vsVeh vsVeh SKIN # Evaluated 60 60 60 60 Adj. # at Risk 40.3 37.9 37.8 41.4 FIBROMA 1 1 0 0 .9346 1 1 .7334 Adj. # at Risk 39.7 37.8 37.8 41.5 FIBROSARCOMA 0 0 0 1 .2662 .5125 . . Adj. # at Risk 40.6 37.8 37.8 41.4 HEMANGIOSARCOMA 1 0 0 0 1 1 1 1 Adj. # at Risk 40.6 37.9 39.3 42.2 KERATOACANTHOMA 4 1 5 1 .8522 .9759 .4836 .9667 Adj. # at Risk 39.8 37.8 37.8 41.4 MALIGNANT BASAL CELL TUMOR 1 0 0 1 .4629 .7655 1 1 Adj. # at Risk 39.7 37.8 37.8 42.1 MYXOSARCOMA 0 0 0 2 .0721 .2657 . . Adj. # at Risk 39.7 37.8 38.6 41.4 SARCOMA, NOS 0 0 1 0 .5097 . .4935 . Adj. # at Risk 39.7 38.8 37.8 41.4 SCHWANNOMA 0 2 0 0 .8137 . . .2403 Adj. # at Risk 39.7 37.8 37.8 41.4 SEBACEOUS CELL ADENOMA 0 0 0 1 .2662 .5125 . . Adj. # at Risk 39.7 37.9 37.8 41.4 SQUAMOUS CELL PAPILLOMA 0 1 0 0 .7468 . . .4868 SPLEEN # Evaluated 60 60 60 60 Adj. # at Risk 39.7 37.8 38.3 41.4 HEMANGIOMA 0 0 1 0 .5097 . .4935 . Adj. # at Risk 39.7 37.8 37.8 41.4 HEMANGIOSARCOMA 0 0 1 0 .5065 . .4868 . Adj. # at Risk 39.7 37.8 37.8 41.4 SARCOMA, NOS 0 1 0 0 .7468 . . .4868 Systemic # Evaluated 60 60 60 60 Adj. # at Risk 39.7 37.8 38.3 41.4 Hemangioma/Hemangiosarcoma 0 0 1 0 .5097 . .4935 . Adj. # at Risk 39.7 37.8 38.3 41.4 Hemangioma 0 0 1 0 .5097 . .4935 . TAIL # Evaluated 11 8 13 15 Adj. # at Risk 7.5 6.3 10.9 10.5 KERATOACANTHOMA 0 1 0 0 .7879 . . .4615 Adj. # at Risk 7.6 6.2 10.9 10.5 SCHWANNOMA 1 0 0 0 1 1 1 1 TESTES # Evaluated 60 60 60 60 Adj. # at Risk 39.7 37.8 38.1 41.4 BENIGN INTERSTITIAL CELL TUMOR 0 0 2 1 .2184 .5125 .2403 . Adj. # at Risk 40.4 37.8 37.8 41.4 SEMINOMA 1 0 0 0 1 1 1 1
Reference ID: 3847900

NDA 207988 Zurampic (lesinurad) Ardea Biosciences, Inc.
36
Table A.2.2. (cont.) Incidence and Results for Organ-Tumor Combinations in Male Rats Overall Results Tumor Incidcence Significance Levels Organ/Tumor Veh Low Med High ptrend phigh pmed plow vsVeh vsVeh vsVeh THYROID # Evaluated 59 60 60 60 Adj. # at Risk 39.7 38.0 39.0 41.8 C-CELL ADENOMA 0 2 2 4 .0482 .0640 .2403 .2337 Adj. # at Risk 39.8 37.9 37.8 41.4 C-CELL CARCINOMA 1 1 0 0 .9371 1 1 .7400 Adj. # at Risk 39.8 38.1 39.0 41.8 C-Cell Adenoma/Carcinoma 1 3 2 4 .1571 .1955 .4901 .2977 Adj. # at Risk 40.3 38.9 38.4 42.2 FOLLICULAR CELL ADENOMA 3 2 3 4 .2974 .5277 .6376 .8043 VASCULAR TISSUE # Evaluated 60 60 60 60 Adj. # at Risk 39.7 37.8 38.3 41.4 HEMANGIOMA 0 0 1 0 .5097 . .4935 . Adj. # at Risk 40.6 37.8 37.9 41.4 HEMANGIOSARCOMA 1 0 2 0 .7020 1 .4704 1 ZYMBAL'S GLAND # Evaluated 1 0 0 1 Adj. # at Risk 0.9 0.0 0.0 1.0 ADENOMA 0 0 0 1 1 . . . Adj. # at Risk 1.0 0.0 0.0 0.1 CARCINOMA 1 0 0 0 1 . . .
Table A.2.3. Tumor Incidence and Test Results for Organ-Tumor Combinations in Female Rats Overall Results Tumor Incidence Significance levels Organ/Tumor Veh Low Med High ptrend phigh pmed plow vsVeh vsVeh vsVeh ADRENAL GLANDS # Evaluated 60 60 60 60 Adj. # at Risk 41.0 40.4 29.2 33.7 COMPLEX PHEOCHROMOCYTOMA 1 0 0 0 1 1 1 1 Adj. # at Risk 41.0 40.4 29.5 33.7 CORTEX: ADENOMA 1 0 1 0 .6843 1 .6675 1 Adj. # at Risk 41.0 40.4 29.2 33.8 CORTEX: CARCINOMA 0 0 0 1 .2324 .4521 . . Adj. # at Risk 41.0 40.4 29.5 33.8 Cortex Adenoma/Carcinoma 1 0 1 1 .3274 .7032 .6675 1 Adj. # at Risk 41.4 40.4 29.8 34.0 MEDULLA BENIGN PHEOCHROMOCYTOMA 1 1 1 2 .2037 .4181 .6605 .7469 Adj. # at Risk 41.0 40.4 29.2 34.1 MEDULLA: MALIGNANT PHEOCHROM. 1 0 0 1 .4203 .7112 1 1 Adj. # at Risk 41.4 40.4 29.8 34.4 Pheocromocytoma Any 3 1 1 3 .2641 .5690 .8896 .9391 EAR(S) # Evaluated 0 0 2 0 Adj. # at Risk 0.0 0.0 1.8 0.0 AMELANOTIC MELANOMA 0 0 1 0 1 . . . Adj. # at Risk 0.0 0.0 1.8 0.0 LIPOMA 0 0 1 0 1 . . .
Reference ID: 3847900
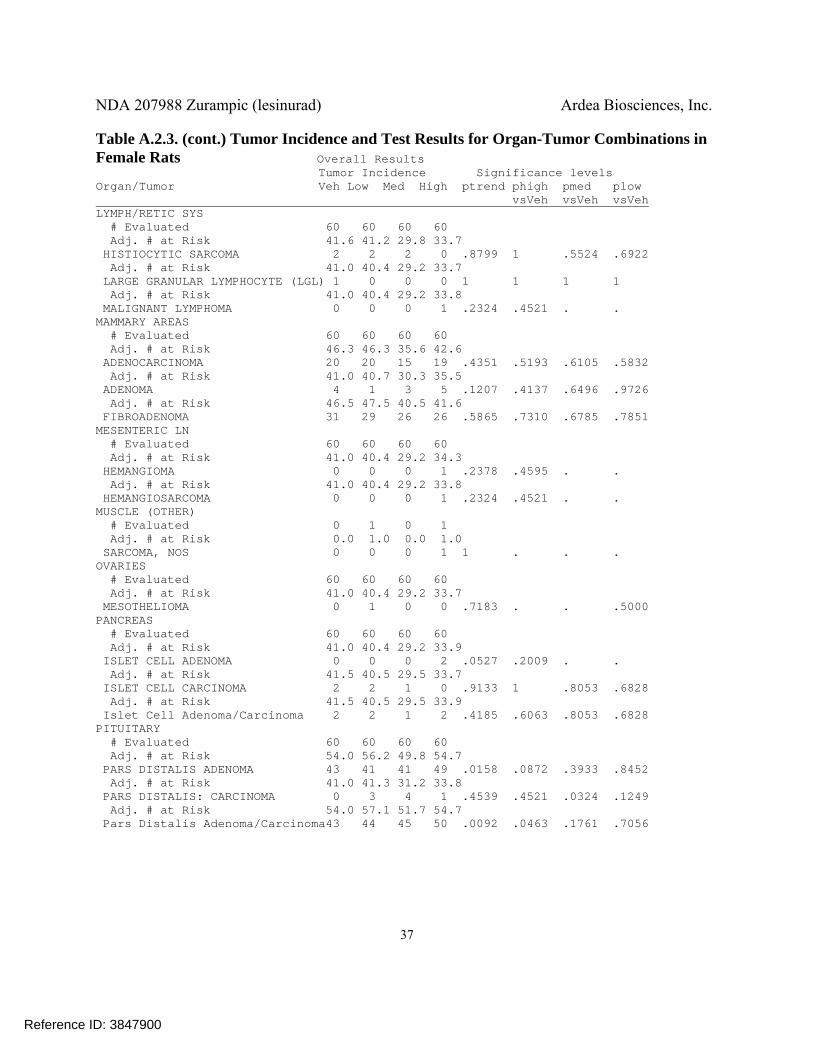
NDA 207988 Zurampic (lesinurad) Ardea Biosciences, Inc.
37
Table A.2.3. (cont.) Tumor Incidence and Test Results for Organ-Tumor Combinations in Female Rats Overall Results Tumor Incidence Significance levels Organ/Tumor Veh Low Med High ptrend phigh pmed plow vsVeh vsVeh vsVeh LYMPH/RETIC SYS # Evaluated 60 60 60 60 Adj. # at Risk 41.6 41.2 29.8 33.7 HISTIOCYTIC SARCOMA 2 2 2 0 .8799 1 .5524 .6922 Adj. # at Risk 41.0 40.4 29.2 33.7 LARGE GRANULAR LYMPHOCYTE (LGL) 1 0 0 0 1 1 1 1 Adj. # at Risk 41.0 40.4 29.2 33.8 MALIGNANT LYMPHOMA 0 0 0 1 .2324 .4521 . . MAMMARY AREAS # Evaluated 60 60 60 60 Adj. # at Risk 46.3 46.3 35.6 42.6 ADENOCARCINOMA 20 20 15 19 .4351 .5193 .6105 .5832 Adj. # at Risk 41.0 40.7 30.3 35.5 ADENOMA 4 1 3 5 .1207 .4137 .6496 .9726 Adj. # at Risk 46.5 47.5 40.5 41.6 FIBROADENOMA 31 29 26 26 .5865 .7310 .6785 .7851 MESENTERIC LN # Evaluated 60 60 60 60 Adj. # at Risk 41.0 40.4 29.2 34.3 HEMANGIOMA 0 0 0 1 .2378 .4595 . . Adj. # at Risk 41.0 40.4 29.2 33.8 HEMANGIOSARCOMA 0 0 0 1 .2324 .4521 . . MUSCLE (OTHER) # Evaluated 0 1 0 1 Adj. # at Risk 0.0 1.0 0.0 1.0 SARCOMA, NOS 0 0 0 1 1 . . . OVARIES # Evaluated 60 60 60 60 Adj. # at Risk 41.0 40.4 29.2 33.7 MESOTHELIOMA 0 1 0 0 .7183 . . .5000 PANCREAS # Evaluated 60 60 60 60 Adj. # at Risk 41.0 40.4 29.2 33.9 ISLET CELL ADENOMA 0 0 0 2 .0527 .2009 . . Adj. # at Risk 41.5 40.5 29.5 33.7 ISLET CELL CARCINOMA 2 2 1 0 .9133 1 .8053 .6828 Adj. # at Risk 41.5 40.5 29.5 33.9 Islet Cell Adenoma/Carcinoma 2 2 1 2 .4185 .6063 .8053 .6828 PITUITARY # Evaluated 60 60 60 60 Adj. # at Risk 54.0 56.2 49.8 54.7 PARS DISTALIS ADENOMA 43 41 41 49 .0158 .0872 .3933 .8452 Adj. # at Risk 41.0 41.3 31.2 33.8 PARS DISTALIS: CARCINOMA 0 3 4 1 .4539 .4521 .0324 .1249 Adj. # at Risk 54.0 57.1 51.7 54.7 Pars Distalis Adenoma/Carcinoma43 44 45 50 .0092 .0463 .1761 .7056
Reference ID: 3847900
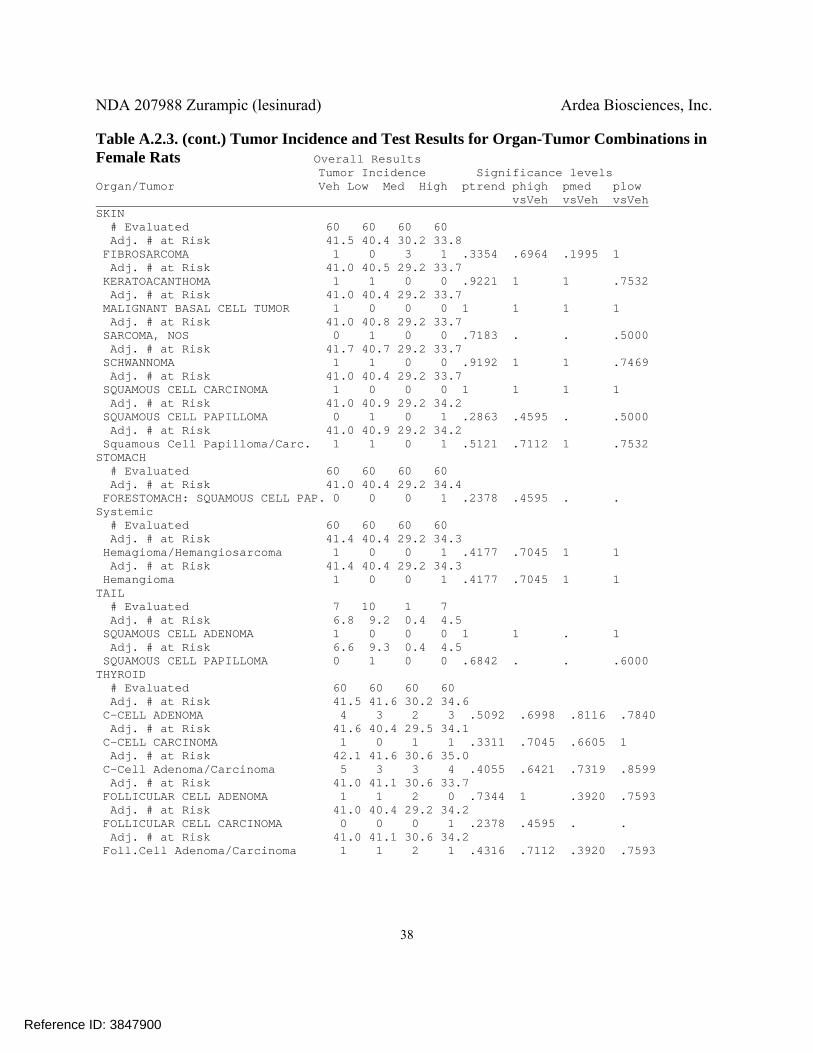
NDA 207988 Zurampic (lesinurad) Ardea Biosciences, Inc.
38
Table A.2.3. (cont.) Tumor Incidence and Test Results for Organ-Tumor Combinations in Female Rats Overall Results Tumor Incidence Significance levels Organ/Tumor Veh Low Med High ptrend phigh pmed plow vsVeh vsVeh vsVeh SKIN # Evaluated 60 60 60 60 Adj. # at Risk 41.5 40.4 30.2 33.8 FIBROSARCOMA 1 0 3 1 .3354 .6964 .1995 1 Adj. # at Risk 41.0 40.5 29.2 33.7 KERATOACANTHOMA 1 1 0 0 .9221 1 1 .7532 Adj. # at Risk 41.0 40.4 29.2 33.7 MALIGNANT BASAL CELL TUMOR 1 0 0 0 1 1 1 1 Adj. # at Risk 41.0 40.8 29.2 33.7 SARCOMA, NOS 0 1 0 0 .7183 . . .5000 Adj. # at Risk 41.7 40.7 29.2 33.7 SCHWANNOMA 1 1 0 0 .9192 1 1 .7469 Adj. # at Risk 41.0 40.4 29.2 33.7 SQUAMOUS CELL CARCINOMA 1 0 0 0 1 1 1 1 Adj. # at Risk 41.0 40.9 29.2 34.2 SQUAMOUS CELL PAPILLOMA 0 1 0 1 .2863 .4595 . .5000 Adj. # at Risk 41.0 40.9 29.2 34.2 Squamous Cell Papilloma/Carc. 1 1 0 1 .5121 .7112 1 .7532 STOMACH # Evaluated 60 60 60 60 Adj. # at Risk 41.0 40.4 29.2 34.4 FORESTOMACH: SQUAMOUS CELL PAP. 0 0 0 1 .2378 .4595 . . Systemic # Evaluated 60 60 60 60 Adj. # at Risk 41.4 40.4 29.2 34.3 Hemagioma/Hemangiosarcoma 1 0 0 1 .4177 .7045 1 1 Adj. # at Risk 41.4 40.4 29.2 34.3 Hemangioma 1 0 0 1 .4177 .7045 1 1 TAIL # Evaluated 7 10 1 7 Adj. # at Risk 6.8 9.2 0.4 4.5 SQUAMOUS CELL ADENOMA 1 0 0 0 1 1 . 1 Adj. # at Risk 6.6 9.3 0.4 4.5 SQUAMOUS CELL PAPILLOMA 0 1 0 0 .6842 . . .6000 THYROID # Evaluated 60 60 60 60 Adj. # at Risk 41.5 41.6 30.2 34.6 C-CELL ADENOMA 4 3 2 3 .5092 .6998 .8116 .7840 Adj. # at Risk 41.6 40.4 29.5 34.1 C-CELL CARCINOMA 1 0 1 1 .3311 .7045 .6605 1 Adj. # at Risk 42.1 41.6 30.6 35.0 C-Cell Adenoma/Carcinoma 5 3 3 4 .4055 .6421 .7319 .8599 Adj. # at Risk 41.0 41.1 30.6 33.7 FOLLICULAR CELL ADENOMA 1 1 2 0 .7344 1 .3920 .7593 Adj. # at Risk 41.0 40.4 29.2 34.2 FOLLICULAR CELL CARCINOMA 0 0 0 1 .2378 .4595 . . Adj. # at Risk 41.0 41.1 30.6 34.2 Foll.Cell Adenoma/Carcinoma 1 1 2 1 .4316 .7112 .3920 .7593
Reference ID: 3847900
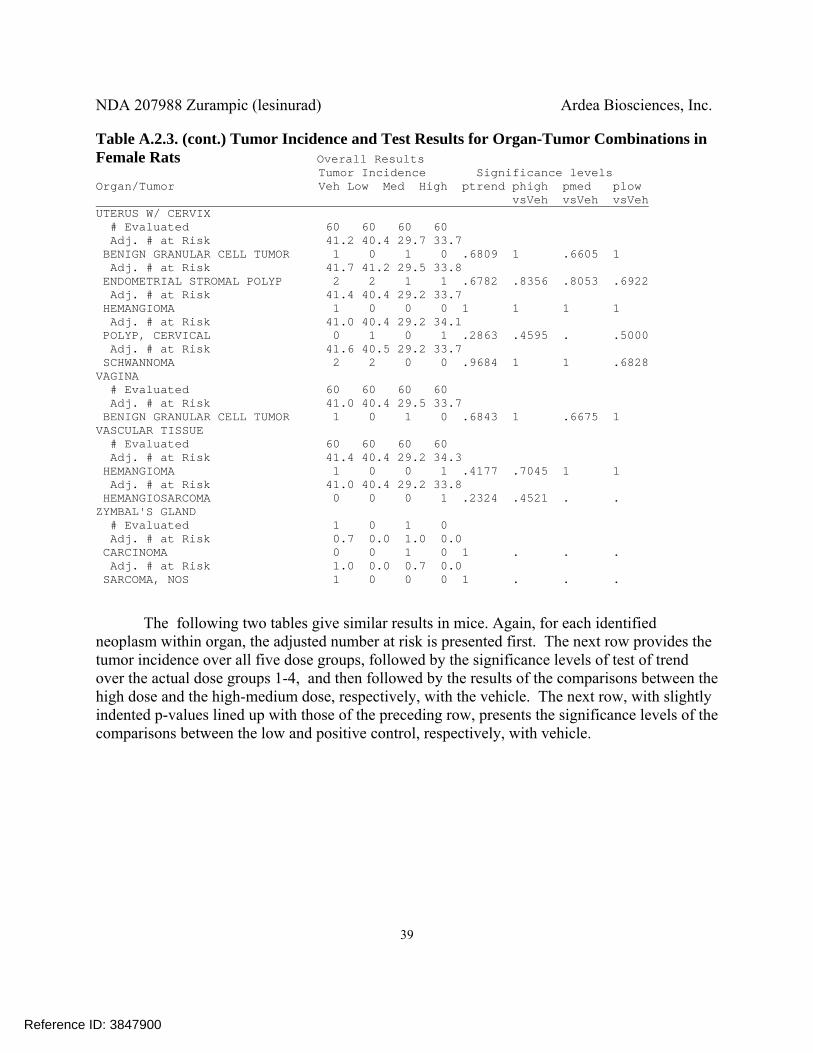
NDA 207988 Zurampic (lesinurad) Ardea Biosciences, Inc.
39
Table A.2.3. (cont.) Tumor Incidence and Test Results for Organ-Tumor Combinations in Female Rats Overall Results Tumor Incidence Significance levels Organ/Tumor Veh Low Med High ptrend phigh pmed plow vsVeh vsVeh vsVeh UTERUS W/ CERVIX # Evaluated 60 60 60 60 Adj. # at Risk 41.2 40.4 29.7 33.7 BENIGN GRANULAR CELL TUMOR 1 0 1 0 .6809 1 .6605 1 Adj. # at Risk 41.7 41.2 29.5 33.8 ENDOMETRIAL STROMAL POLYP 2 2 1 1 .6782 .8356 .8053 .6922 Adj. # at Risk 41.4 40.4 29.2 33.7 HEMANGIOMA 1 0 0 0 1 1 1 1 Adj. # at Risk 41.0 40.4 29.2 34.1 POLYP, CERVICAL 0 1 0 1 .2863 .4595 . .5000 Adj. # at Risk 41.6 40.5 29.2 33.7 SCHWANNOMA 2 2 0 0 .9684 1 1 .6828 VAGINA # Evaluated 60 60 60 60 Adj. # at Risk 41.0 40.4 29.5 33.7 BENIGN GRANULAR CELL TUMOR 1 0 1 0 .6843 1 .6675 1 VASCULAR TISSUE # Evaluated 60 60 60 60 Adj. # at Risk 41.4 40.4 29.2 34.3 HEMANGIOMA 1 0 0 1 .4177 .7045 1 1 Adj. # at Risk 41.0 40.4 29.2 33.8 HEMANGIOSARCOMA 0 0 0 1 .2324 .4521 . . ZYMBAL'S GLAND # Evaluated 1 0 1 0 Adj. # at Risk 0.7 0.0 1.0 0.0 CARCINOMA 0 0 1 0 1 . . . Adj. # at Risk 1.0 0.0 0.7 0.0 SARCOMA, NOS 1 0 0 0 1 . . .
The following two tables give similar results in mice. Again, for each identified neoplasm within organ, the adjusted number at risk is presented first. The next row provides the tumor incidence over all five dose groups, followed by the significance levels of test of trend over the actual dose groups 1-4, and then followed by the results of the comparisons between the high dose and the high-medium dose, respectively, with the vehicle. The next row, with slightly indented p-values lined up with those of the preceding row, presents the significance levels of the comparisons between the low and positive control, respectively, with vehicle.
Reference ID: 3847900

NDA 207988 Zurampic (lesinurad) Ardea Biosciences, Inc.
40
Table A.2.4. Tumor Incidence and Test Results for Organ-Tumor Combinations in Male Tg.rash2 Mice Overall Results Tumor Incidence Significance Levels Organ/Tumor Veh Low Med High +Ctrl ptrend phigh pmed vsVeh vsVeh plow p+cntrl ________________________________________________________________vsVeh vsVeh Body, Whole/Cavity # Evaluated 25 25 25 25 20 Adj. # at Risk 25.0 24.7 25.0 24.1 12.2 M-Hemangiosarcoma 1 1 0 2 0 .2279 .7449 1 .4844 1 Adj. # at Risk 25.0 24.7 25.0 24.1 17.1 M-Lymphosarcoma 0 0 0 0 11 . . . . <0.0001 Liver # Evaluated 25 25 25 25 20 Adj. # at Risk 25.0 24.7 25.0 24.1 12.2 B-Adenoma, hepatocellular 0 0 1 0 0 .5000 . .5000 . . Lung # Evaluated 25 25 25 25 20 Adj. # at Risk 25.0 24.7 25.0 24.1 12.8 Adenoma/Carc.bronch.alveolar 4 0 2 2 1 .5768 1 .9053 .8961 .8781 Adj. # at Risk 25.0 24.7 25.0 24.1 12.8 B-Adenoma, bronchiolo-alveolar 4 0 2 2 1 .5768 1 .9053 .8961 .8781 Adj. # at Risk 25.0 24.7 25.0 24.1 12.2 M-Carcinoma, bronchiolo-alv. 0 0 0 1 0 .2449 . . .4898 . Skin/Subcutis # Evaluated 25 25 25 25 20 Adj. # at Risk 25.0 24.7 25.0 24.1 14.4 B-Papilloma, squamous cell 0 0 0 0 7 . . . . .0002 Stomach, Nonglandular # Evaluated 25 25 25 25 20 Adj. # at Risk 25.0 24.7 25.0 24.1 14.7 B-Papilloma, squamous cell 1 0 0 1 9 .4317 1 1 .7449 .0001 Adj. # at Risk 25.0 24.7 25.0 24.1 14.4 M-Carcinoma, squamous cell 0 0 0 0 3 . . . . .0398 Thymus # Evaluated 24 25 23 25 19 Adj. # at Risk 24.0 24.7 23.0 24.1 11.7 B-Thymoma 0 0 0 0 1 . . . . .3143 Thyroid # Evaluated 25 25 25 25 20 Adj. # at Risk 25.0 24.7 25.0 24.1 12.5 M-Carcinoma, squamous cell 0 0 0 0 1 . . . . .3243
Reference ID: 3847900

NDA 207988 Zurampic (lesinurad) Ardea Biosciences, Inc.
41
Table A.2.5. Tumor Incidence and Test Results for Organ-Tumor Combinations in Female Tg.rash2 Mice Overall Results Tumor Incidence Significance Levels Organ/Tumor Veh Low Med High +Ctrl ptrend phigh pmed vsVeh vsVeh plow p+cntrl ________________________________________________________________vsVeh vsVeh Body, Whole/Cavity # Evaluated 25 25 25 25 20 Adj. # at Risk 24.9 25.0 24.2 21.5 11.7 B-Hemangioma 0 0 1 0 0 .4787 . .5000 . . Adj. # at Risk 24.9 25.0 25.0 21.5 13.2 Hemangioma/Hemangiosarcoma 1 2 2 2 3 .2976 .5156 .5156 .4489 .1148 Adj. # at Risk 24.9 25.0 25.0 21.5 13.2 M-Hemangiosarcoma 1 2 1 2 3 .2938 .5156 .7653 .4489 .1148 Adj. # at Risk 24.9 25.0 24.2 21.5 17.9 M-Lymphosarcoma 0 0 0 0 14 . . . . <0.0001 Harderian Gland # Evaluated 25 25 25 25 20 Adj. # at Risk 24.9 25.0 24.2 21.5 11.7 B-Adenoma 1 1 0 0 0 .9369 .7653 1 1 1 Lung # Evaluated 25 25 25 25 20 Adj. # at Risk 24.9 25.0 24.2 21.5 11.7 B-Adenoma, bronchiolo-alveolar 2 2 0 0 0 .9799 .7110 1 1 1 Adj. # at Risk 24.9 25.0 24.2 21.5 11.7 M-Carcinoma, bronchiolo-alv. 0 1 0 0 0 .7447 .5102 . . . Skin/Subcutis # Evaluated 25 25 25 25 20 Adj. # at Risk 24.9 25.0 24.2 21.5 14.8 B-Papilloma, squamous cell 0 2 0 0 9 .7996 .2551 . . <0.0001 Adj. # at Risk 24.9 25.0 24.2 21.5 12.0 M-Carcinoma, Zymbal's gland 0 0 0 0 2 . . . . .0924 Stomach, Nonglandular # Evaluated 25 25 25 25 20 Adj. # at Risk 24.9 25.0 24.2 21.5 15.0 B-Papilloma, squamous cell 0 0 0 0 13 . . . . <0.0001 Adj. # at Risk 24.9 25.0 24.2 21.5 12.5 M-Carcinoma, squamous cell 0 0 0 0 1 . . . . .3333 Thymus # Evaluated 25 24 24 24 20 Adj. # at Risk 24.9 24.0 24.0 20.5 11.7 B-Thymoma 1 0 0 0 0 1 1 1 1 1
Reference ID: 3847900

NDA 207988 Zurampic (lesinurad) Ardea Biosciences, Inc.
42
Table A.2.5. (cont.) Tumor Incidence and Test Results for Organ-Tumor Combinations in Male Tg.rash2 Mice Overall Results Tumor Incidence Significance Levels Organ/Tumor Veh Low Med High +Ctrl ptrend phigh pmed vsVeh vsVeh plow p+cntrl ________________________________________________________________vsVeh vsVeh Uterus # Evaluated 25 25 25 25 20 Adj. # at Risk 24.9 25.0 24.2 21.5 12.6 B-Polyp, endometrial stromal 0 0 0 0 6 . . . . .0005 Vagina # Evaluated 25 25 25 25 20 Adj. # at Risk 24.9 25.0 24.2 21.5 12.0 B-Papilloma, squamous cell 0 0 0 0 2 . . . . .0924 Adj. # at Risk 24.9 25.0 24.2 21.5 11.7 M-Carcinoma, squamous cell 0 0 0 0 1 . . . . .3143
Reference ID: 3847900

NDA 207988 Zurampic (lesinurad) Ardea Biosciences, Inc.
43
Appendix 3. References Bailer, A. and Portier, C. (1988), “Effects of Treatment-Induced Mortality on Tests for Carcinogenicity in Small Samples”, Biometrics, 44, 4, 417-431. Bieler, G.S., and Williams, R.L. (1993), “Ratio Estimates, the Delta Method, and Quantal Response Tests for Increased Carcinogenicity”, Biometrics, 49, 4, 793-801. Chu, K.C., Ceuto, C., and Ward, J.M. (1981), “Factors in the Evaluation of 200 National Cancer Institute Carcinogen Bioassays”, Journal of Toxicology and Environmental Health, 8, 251-280. Greaves, P. (2007), “Neoplasia of Adrenal Medulla,” In: Histopathology of Preclinical Toxicity Studies. 3rd edition, pp 819. Oxford, UK: Academic Press, Elsevier Inc. Haseman, J. K. (1983), “A Reexamination of False-positive Rates for Carcinogenicity Studies”, Fundamental and Applied Toxicology, 3, 334-339. Jara, A. (2007), “Applied Bayesian Non- and Semi-parametric Inference using DPpackage”, Rnews, 7, 3, 17-26. Lin, K. K. and Ali, M.W. (2006), “Statistical Review and Evaluation of Animal Tumorigenicity Studies”, Statistics in the Pharmaceutical Industry, Third Edition, edited by C.R. Buncher and J.Y. Tsay, Marcel Dekker, Inc. New York. Lin, K. K. and Rahman, M.A. (1998), “Overall False Positive Rates in Tests for Linear Trend in Tumor Incidence in Animal Carcinogenicity Studies of New Drugs”, Journal of Biopharmaceutical Statistics. 8, 1, 1-15. McConnell, E.E., Solleveld, H.A., Swenberg, J.A., and Boorman, G.A. (1986), “Guidelines for Combining Neoplasms for Evaluation of Rodent Carcinogenesis Studies”, Journal of the National Cancer Institute. 76, 283-289. Parola, A, and Jacobs, A. (2010). “Combining Tumors for Statistical Analysis”, online FDA handout. b Peto, R., Pike, M.C., Day, N.E., Gray, R.G., Lee, P.N., Parrish, S., Peto, J., Richards, S., and Wahrendorf, J. (1980). “Guidelines for sample sensitive significance tests for carcinogenic effects in long-term animal experiments”, IARC Monographs on the Evaluation of Carcinogenic Risk of Chemicals to Humans, supplement 2: Long term and Short term Screening Assays for Carcinogens: A Critical Appraisal, International Agency for Research Against Cancer, 311-426.
Reference ID: 3847900
NDA 207988 Zurampic (lesinurad) Ardea Biosciences, Inc.
44
R Development Core Team (2009). R: A language and environment for statistical computing. R Foundation for Statistical Computing, Vienna, Austria. ISBN 3-900051-07-0, URL http://www.R-project.org. Rahman, M.A. and Lin, K.K. (2008), “A Comparison of False Positive Rates of Peto and Poly-3 Methods for Long Term Carcinogenicity Data Analysis Using Multiple Comparison Adjustment Method Suggested by Lin and Rahman”, Journal of Biopharmaceutical Statistics. 18, 949-958. STP Peto Working Group (2002), “Statistical Methods for Carcinogenicity Studies”, Toxicologic Pathology. 30 (3), 403-414. U.S. Department of Health and Human Services (2013), Guidance for Industry Statistical Aspects of the Design, Analysis, and Interpretation of Chronic Rodent Carcinogenicity Studies of Pharmaceuticals (DRAFT GUIDANCE), Center for Drug Evaluation and Research, Food and Drug Administration
Reference ID: 3847900

---------------------------------------------------------------------------------------------------------This is a representation of an electronic record that was signedelectronically and this page is the manifestation of the electronicsignature.---------------------------------------------------------------------------------------------------------/s/----------------------------------------------------
STEVEN F THOMSON11/17/2015Statistical Carcinogenicity Review(Late, was informed panorama would be archive)
KARL K LIN11/17/2015Concur with review
Reference ID: 3847900

U.S. Department of Health and Human Services Food and Drug Administration Center for Drug Evaluation and Research Office of Translational Sciences Office of Biostatistics
S T A T I S T I C A L R E V I E W CLINICAL STUDIES
NDA/BLA #: NDA 207-988
Drug Name: Zurampic (Lesinurad) 200 mg QD
Indication(s): Use in combination with xanthine oxidase inhibitor for the chronic treatment of hyperuricemia associated with gout
Applicant: Ardea Biosciences, Inc.
Date(s): Stamp date: December 29, 2014
Review Priority: Standard
Biometrics Division: Division of Biometrics II
Statistical Reviewer: Yu (Jade) Wang
Concurring Reviewers: Ruthanna C. Davi, Division of Biometrics II Deputy Director
Tom Permutt, Division of Biometrics II Director
Medical Division: Division of Pulmonary, Allergy and Rheumatology Products.
Clinical Team: Rosemarie Neuner, Medical Reviewer
Sarah Yim, Medical Team Leader
Project Manager: Michelle Jordan Garner
Keywords:
Link to keywords:
http://intranetapps.fda.gov/scripts/ob apps/ob/eWork/uploads/eWork/2009/Keywords-in-DFS.htm
Reference ID: 3831173

2
Table of Contents
1 EXECUTIVE SUMMARY ................................................................................................................................. 5
2 INTRODUCTION ............................................................................................................................................... 6 2.1 OVERVIEW ...................................................................................................................................................... 6
2.1.1 Class and Indication .............................................................................................................................. 6 2.1.2 History of Drug Development ................................................................................................................ 7 2.1.3 Specific Studies Reviewed ...................................................................................................................... 8 2.1.4 Statistical Issues ..................................................................................................................................... 9
2.2 DATA SOURCES .............................................................................................................................................. 9
3 STATISTICAL EVALUATION ........................................................................................................................ 9 3.1 DATA AND ANALYSIS QUALITY ..................................................................................................................... 9 3.2 EVALUATION OF EFFICACY .......................................................................................................................... 10
3.2.1 Study Design ........................................................................................................................................ 10 3.2.2 Study endpoints .................................................................................................................................... 12 3.2.3 Statistical Methodologies ..................................................................................................................... 13 3.2.4 Patient Disposition, Demographic and Baseline Characteristics........................................................ 15 3.2.5 Results and Conclusions ...................................................................................................................... 21
3.3 EVALUATION OF SAFETY .............................................................................................................................. 25
4 FINDINGS IN SPECIAL/SUBGROUP POPULATIONS ............................................................................. 26 4.1 SEX, RACE, AGE, AND GEOGRAPHIC REGION ............................................................................................... 26 4.2 BASELINE DISEASE CHARACTERISTICS ......................................................................................................... 34
5 SUMMARY AND CONCLUSIONS ................................................................................................................ 35 5.1 STATISTICAL ISSUES ..................................................................................................................................... 35
5.1.1 Missing Data and Sensitivity Analysis ................................................................................................. 35 5.1.2 Subgroup Analysis ............................................................................................................................... 40
5.2 COLLECTIVE EVIDENCE ................................................................................................................................ 40 5.3 CONCLUSIONS AND RECOMMENDATIONS ..................................................................................................... 41
6 APPENDICES .................................................................................................................................................... 42
7 BIBLIOGRAPHY .............................................................................................................................................. 52
Reference ID: 3831173

3
LIST OF TABLES Table 1: Summary of Efficacy of the XOI Approved by the FDA ................................................................................ 7 Table 2: List of Meeting Minutes, Protocol/SAP Reviews and Correspondence to the Applicant ................................ 8 Table 3: List of Key Phase 3 Studies in the Clinical Development Program ................................................................ 9 Table 4: Summary Table of GCP Non-Compliance .................................................................................................... 10 Table 5: Primary and secondary endpoints of the three Phase 3 studies...................................................................... 13 Table 6: Results Summary of Sensitivity Analyses Performed by the Applicant ........................................................ 14 Table 7: Subject Disposition - Study 301 .................................................................................................................... 16 Table 8: Subject Disposition - Study 302 .................................................................................................................... 17 Table 9: Subject Disposition – Study 304 ................................................................................................................... 18 Table 10: Patient Demographics - Study 301 .............................................................................................................. 19 Table 11: Patient Demographics - Study 302 .............................................................................................................. 20 Table 12: Patient Demographics - Study 304 .............................................................................................................. 21 Table 13: Primary Efficacy Analysis (Study 301 and Study 302): Proportion of Subjects with an sUA Level < 6.0 mg/dL by Month 6 – Non-Responder Imputation1 (ITT Population) .......................................................................... 22 Table 14: Primary Efficacy Analysis (Study 304): Proportion of Subjects with an sUA Level < 5.0 mg/dL by Month 6 – Non-Responder Imputation1 (ITT Population) ...................................................................................................... 22 Table 15: Key Secondary Efficacy Endpoints (Study 301 and 302): Mean Rate of Gout Flares Requiring Treatment1 per Subject for the 6-Month Period from the End of Month 6 to the End of Month 12 (ITT Population) .................. 23 Table 16: Proportion of ITT Subjects for Stratification Factors (Supporting Table for Table 15) .............................. 24 Table 17: Key Secondary Endpoint (Study 301 and Study 302): Proportion of Subjects with at Least One Target Tophus at Baseline Who Experience Complete Resolution of at Least One Target Tophus by Month 12 – Non-Responder Imputation (ITT Population, Subjects with at Least One Target Tophus at Baseline) .............................. 24 Table 18: Key Secondary Endpoint (Study 304): Proportion of Subjects Who Experience Complete Resolution of at Least One Target Tophus by Month 12 (ITT Population) ........................................................................................... 25 Table 19: Key Secondary Endpoint (Study 304): Proportion of Subjects Who Experience Complete or Partial Resolution of at Least One Target Tophus by Month 12 (ITT Population) ................................................................. 25 Table 20: Key Secondary Endpoint (Study 304): Proportion of Subjects Achieving Health Assessment Questionnaire – Disability Index Improvement of >= 0.25 at Month 12 – Observed Cases (ITT Population) .................................. 25 Table 21: Study 301, Cross-Classification of Treatment Arm and sUA Responder by Sex ........................................ 27 Table 22: Study 304, Cross-Classification of Treatment Arm and sUA Responder by Sex ........................................ 27 Table 23: Study 304, Cross-Classification of Treatment Arm and sUA Responder by Baseline Renal Function ....... 27 Table 24: Study 301, Differences of Proportion of Subjects with Month 6 sUA Levels < 6.0 mg/dL (NRI, ITT), and Difference of Least Square Means (LOCF, ITT) by Subgroup Factors....................................................................... 28 Table 25: Study 302, Differences of Proportion of Subjects with Month 6 sUA Levels < 6.0 mg/dL (NRI, ITT), and Difference of Least Square Means (LOCF, ITT) by Subgroup Factors....................................................................... 29 Table 26: Study 304, Differences of Proportion of Subjects with Month 6 sUA Levels < 5.0 mg/dL (NRI, ITT), and Difference of Least Square Means (LOCF, ITT) by Subgroup Factors....................................................................... 30 Table 27: Pooled Studies 301 and 302, Differences of Proportion of Subjects with Month 6 sUA Levels < 6.0 mg/dL (NRI, ITT), and Difference of Least Square Means (LOCF, ITT) by Subgroup Factors ............................................ 32 Table 28: Tipping Point Analysis Output – Study 301 ................................................................................................ 37 Table 29: Tipping Point Analysis Output – Study 302 ................................................................................................ 38 Table 30: Summary of the Key Efficacy Test Results ................................................................................................. 41 Table 31: Study 301, Differences of Proportion of Subjects with Month 6 sUA Levels < 6.0 mg/dL (NRI, ITT), and Difference of Least Square Means (LOCF, ITT) by Subgroup Factors....................................................................... 42 Table 32: Study 302, Differences of Proportion of Subjects with Month 6 sUA Levels < 6.0 mg/dL (NRI, ITT), and Difference of Least Square Means (LOCF, ITT) by Subgroup Factors....................................................................... 43 Table 33: Study 304, Differences of Proportion of Subjects with Month 6 sUA Levels < 5.0 mg/dL (NRI, ITT), and Difference of Least Square Means (LOCF, ITT) by Subgroup Factors....................................................................... 44 Table 34: Pooled Studies 301 and 302, Differences of Proportion of Subjects with Month 6 sUA Levels < 6.0 mg/dL (NRI, ITT), and Difference of Least Square Means (LOCF, ITT) by Subgroup Factors ............................................ 45
Reference ID: 3831173

4
LIST OF FIGURES Figure 1: Targets for Intervention in the Treatment and Prophylaxis of Gout .............................................................. 7 Figure 2: Design Scheme for Studies 301 and 302 ...................................................................................................... 11 Figure 3: Study 301, Differences of Proportion, LESU 200 + ALLO vs. ALLO for Subjects with Month 6 sUA Levels < 6.0 mg/dL, by Subgroup Factors (None Responder Imputation, ITT) .......................................................... 29 Figure 4: Study 302, Differences of Proportion, LESU 200 + ALLO vs. ALLO for Subjects with Month 6 sUA Levels < 6.0 mg/dL, by Subgroup Factors (None Responder Imputation, ITT) .......................................................... 30 Figure 5: Study 304, Differences of Proportion, LESU 200 + FBX vs. FBX for Subjects with Month 6 sUA Levels < 5.0 mg/dL, by Subgroup Factors (None Responder Imputation, ITT) ......................................................................... 31 Figure 6: Study 304, Differences of Proportion, LESU 400 + FBX vs. FBX for Subjects with Month 6 sUA Levels < 5.0 mg/dL, by Subgroup Factors (None Responder Imputation, ITT) ......................................................................... 32 Figure 7: Pooled Studies 301 and 302, Differences of Proportion, LESU 200 + FBX vs. FBX for Subjects with Month 6 sUA Levels < 6.0 mg/dL, by Subgroup Factors (None Responder Imputation, ITT) ................................... 33 Figure 8: Cumulative Responder Plot for Month 6 sUA Level (Study 301) ............................................................... 39 Figure 9: Cumulative Responder Plot for Month 6 sUA Level (Study 302) ............................................................... 40 Figure 10: Study 301, Differences of Proportion, LESU 400 + ALLO vs. ALLO for Subjects with Month 6 sUA Levels < 6.0 mg/dL, by Subgroup Factors (None Responder Imputation, ITT) .......................................................... 46 Figure 11: Study 302, Differences of Proportion, LESU 400 + ALLO vs. ALLO for Subjects with Month 6 sUA Levels < 6.0 mg/dL, by Subgroup Factors (None Responder Imputation, ITT) .......................................................... 46 Figure 12: Study 304, Differences of Proportion, LESU 400 + ALLO vs. ALLO for Subjects with Month 6 sUA Levels < 5.0 mg/dL, by Subgroup Factors (None Responder Imputation, ITT) .......................................................... 47 Figure 13: Studies 301 and 302, Differences of Proportion, LESU 400 + ALLO vs. ALLO for Subjects with Month 6 sUA Levels < 5.0 mg/dL, by Subgroup Factors (None Responder Imputation, ITT) ............................................... 47 Figure 14: Study 301, Estimated Mean Differences, LESU 200 + ALLO vs. ALLO, of Change from Baseline Month 6 sUA Levels, by Subgroup Factors (LOCF, ITT) ...................................................................................................... 48 Figure 15: Study 301, Estimated Mean Differences, LESU 400 + ALLO vs. ALLO, of Change from Baseline Month 6 sUA Levels, by Subgroup Factors (LOCF, ITT) ...................................................................................................... 48 Figure 16: Study 302, Estimated Mean Differences, LESU 200 + ALLO vs. ALLO, of Change from Baseline Month 6 sUA Levels, by Subgroup Factors (LOCF, ITT) ...................................................................................................... 49 Figure 17: Study 302, Estimated Mean Differences, LESU 400 + ALLO vs. ALLO, of Change from Baseline Month 6 sUA Levels, by Subgroup Factors (LOCF, ITT) ...................................................................................................... 49 Figure 18: Study 304, Estimated Mean Differences, LESU 200 + ALLO vs. ALLO, of Change from Baseline Month 6 sUA Levels, by Subgroup Factors (LOCF, ITT) ...................................................................................................... 50 Figure 19: Study 304, Estimated Mean Differences, LESU 400 + ALLO vs. ALLO, of Change from Baseline Month 6 sUA Levels, by Subgroup Factors (LOCF, ITT) ...................................................................................................... 50 Figure 20: Pooled Studies 301 and 302, Estimated Mean Differences, LESU 200 + ALLO vs. ALLO, of Change from Baseline Month 6 sUA Levels, by Subgroup Factors (LOCF, ITT) ................................................................... 51 Figure 21: Pooled Studies 301 and 302, Estimated Mean Differences, LESU 400 + ALLO vs. ALLO, of Change from Baseline Month 6 sUA Levels, by Subgroup Factors (LOCF, ITT) ................................................................... 51
Reference ID: 3831173
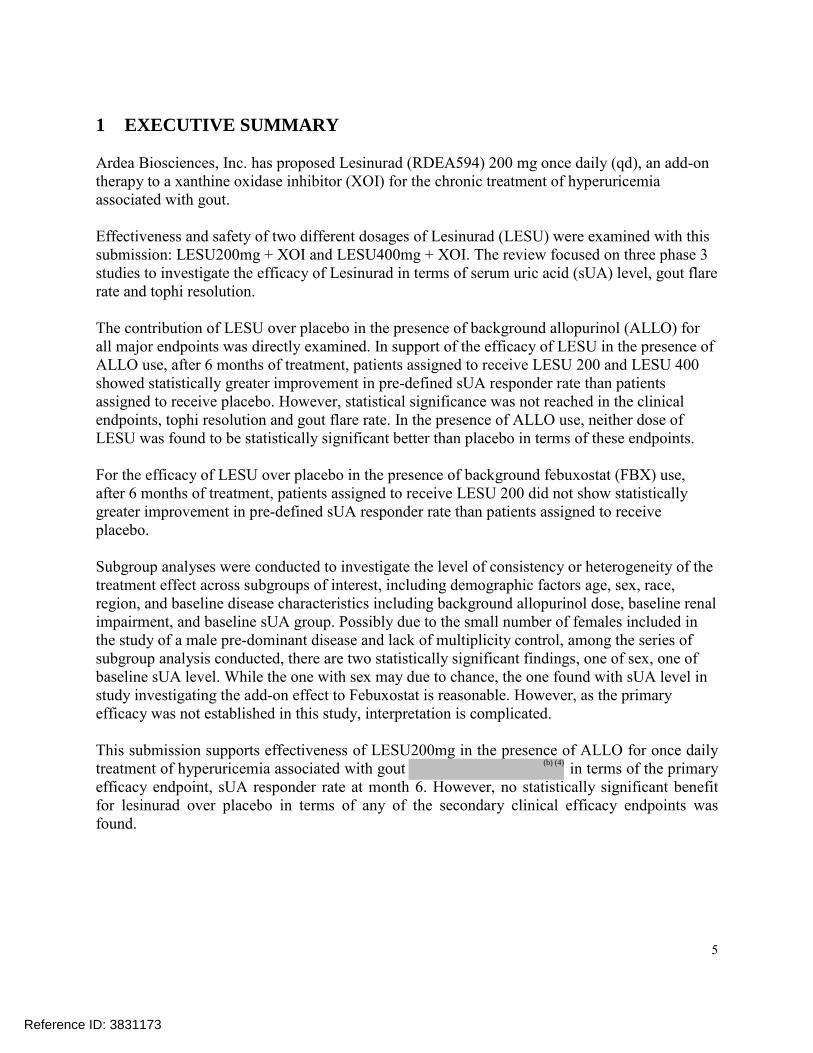
5
1 EXECUTIVE SUMMARY Ardea Biosciences, Inc. has proposed Lesinurad (RDEA594) 200 mg once daily (qd), an add-on therapy to a xanthine oxidase inhibitor (XOI) for the chronic treatment of hyperuricemia associated with gout. Effectiveness and safety of two different dosages of Lesinurad (LESU) were examined with this submission: LESU200mg + XOI and LESU400mg + XOI. The review focused on three phase 3 studies to investigate the efficacy of Lesinurad in terms of serum uric acid (sUA) level, gout flare rate and tophi resolution. The contribution of LESU over placebo in the presence of background allopurinol (ALLO) for all major endpoints was directly examined. In support of the efficacy of LESU in the presence of ALLO use, after 6 months of treatment, patients assigned to receive LESU 200 and LESU 400 showed statistically greater improvement in pre-defined sUA responder rate than patients assigned to receive placebo. However, statistical significance was not reached in the clinical endpoints, tophi resolution and gout flare rate. In the presence of ALLO use, neither dose of LESU was found to be statistically significant better than placebo in terms of these endpoints. For the efficacy of LESU over placebo in the presence of background febuxostat (FBX) use, after 6 months of treatment, patients assigned to receive LESU 200 did not show statistically greater improvement in pre-defined sUA responder rate than patients assigned to receive placebo.
Subgroup analyses were conducted to investigate the level of consistency or heterogeneity of the treatment effect across subgroups of interest, including demographic factors age, sex, race, region, and baseline disease characteristics including background allopurinol dose, baseline renal impairment, and baseline sUA group. Possibly due to the small number of females included in the study of a male pre-dominant disease and lack of multiplicity control, among the series of subgroup analysis conducted, there are two statistically significant findings, one of sex, one of baseline sUA level. While the one with sex may due to chance, the one found with sUA level in study investigating the add-on effect to Febuxostat is reasonable. However, as the primary efficacy was not established in this study, interpretation is complicated. This submission supports effectiveness of LESU200mg in the presence of ALLO for once daily treatment of hyperuricemia associated with gout in terms of the primary efficacy endpoint, sUA responder rate at month 6. However, no statistically significant benefit for lesinurad over placebo in terms of any of the secondary clinical efficacy endpoints was found.
Reference ID: 3831173
(b) (4)
6
2 INTRODUCTION 2.1 Overview
2.1.1 Class and Indication The Applicant, Ardea Biosciences, Inc. seeks to market lesinurad (RDEA594) 200 mg once daily (qd) in combination with a xanthine oxidase inhibitor (XOI) for the chronic treatment of hyperuricemia associated with gout. Hyperuricemia is a metabolic disorder with an abnormally high level of uric acid in the blood. In the pH conditions of body fluid, uric acid exists largely as urate, the ion form. In humans, the upper end of the normal range is 6 mg/dL for women and 6.8 mg/dL for men. Causes of hyperuricemia can be classified into three functional types: increased production of uric acid, decreased excretion of uric acid, and mixed type (Wikipedia). Gout results from hyperuricemia. It is a type of inflammatory arthritis induced by the deposition of monosodium urate crystals in synovial fluid and other tissues (Neogi, 2011). In most gout patients, inadequate uric acid excretion leads to hyperuicemia (Vazquez-Mellado, 2007) and subsequent deposition of urate crystals. These crystals can form in and around joints causing recurrent attacks of inflammatory arthritis. Eventually chronic, progressive arthropathy and tophus formation can occur (Schlesinger, 2011). Accordingly, the course of classic gout passes through three distinct stages: asymptomatic hyperuricemia, acute intermittent gout, and chronic tophaceous gout or advanced gout (Klippel, 2007). Figure 1(Burns & Wortmann, 2011) illustrates the pathogenic steps of gouts together with gout treatments and prophylaxis drugs targeting these steps. These drugs have either inhibitory or stimulatory effects on the targeted steps. They were classified by the steps: xanthine oxidase inhibitors, uricosurics, uricases and inflammation inhibitors. Among the classes, the use of XOI is recommended by treatment guidelines as the first line treatment of gout. Allopurinol (ALLO) and Febuxostat (FBX) are oral XOIs approved by the FDA. Table 1 describes the main efficacy and safety summary of these two XOI. The current XOI drugs at the prescribed doses have an efficacy range from 42% to 67% in terms of response rate. Further information and description of the typical disease characteristics of gout and hyperuricemia and possible treatment options may be found in the FDA clinical review of this application. According to the sponsor, the proposed drug, lesinurad is a selective uric acid reabsorption inhibitor that inhibits uric acid transporter 1 (URAT1). The sponsor contends that lesinurad increases uric acid excretion and thereby lower sUA. The sponsor indicates that Lesinurad is being developed to be used with an XOI, allopurinol or febuxostat, in patients with gout who have uncontrolled disease. In the Applicant’s regulatory submission, lesinurad is not
Reference ID: 3831173


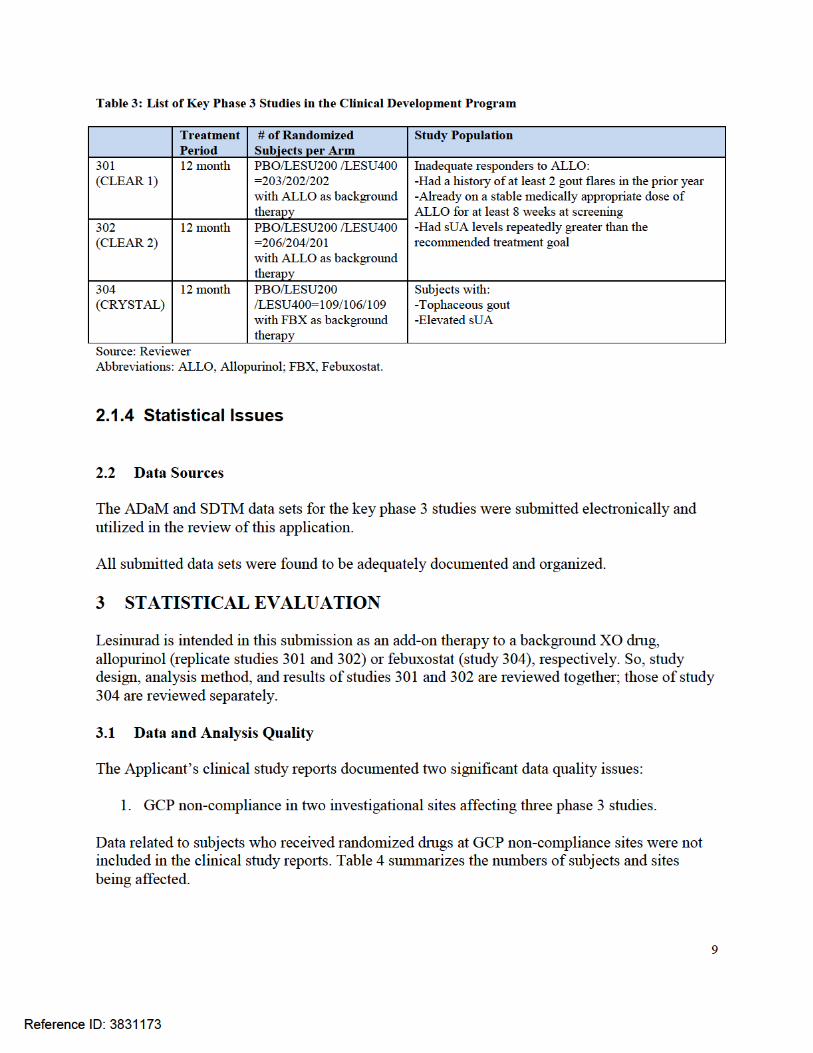


11
Figure 2: Design Scheme for Studies 301 and 302
Source: Figure 1 in Applicant’s Study 301 and 302 SAP. Study 301 and 302 were replicate phase 3, randomized, double-blind, multicenter, placebo-controlled studies to compare the efficacy and safety of lesinurad in combination with allopurinol versus allopurinol alone in gout patients who have had an inadequate hypouricemic response to allopurinol. The target patient population was defined as patients with gout who had sUA≥6.5 mg/dL, reported at least 2 gout flares in the prior year and had been on a stable, medically appropriate dose of allopurinol (at least 200 mg/day for moderate renal impairment, at least 300 mg/day for others) for at least 8 weeks. Subjects who qualified for the studies were randomized in a double-blind manner in a 1:1:1 ratio to the three treatment arms for up to 12 months:
- LESU 200: LESU 200mg + ALLO - LESU 400: LESU 400mg + ALLO - PBO: PBO + ALLO
From now on, when referred to in this review, the short forms of the arms LESU 200, LESU 400 and PBO will be used instead of the full name. Randomization was stratified in these two studies by two baseline disease characteristics:
- Renal function at Day -7 (eCrCl>=60 mL/min versus <60 mL/min) - Tophus status during Screening (presence of >=1 tophus versus absence of tophi)
Reference ID: 3831173

12
Sponsor-supplied allopurinol and gout flare prophylaxis drug were initiated on Day -14. All subjects were prescribed gout flare prophylaxis with colchicine 0.5 or 0.6 QD as available. Subjects continued gout flare prophylaxis through Month 5 unless they became intolerant of the prophylaxis. Double blinded study treatment started on Day 1 and subjects were seen monthly with an extra visit on Week 2. Efficacy was assessed through measurement of sUA, tophus resolution using digital caliper measurements; flare rates using a subject eDiary, and quality of life using various questionnaires. Study 304 was conducted similarly, with ALLO replaced by a FBX 80mg as background therapy. The same renal function stratification factor was used in randomization. As the study targeted tophaceous patients, sUA level at day -7 was used as the second stratification factor. The enrollment criteria in study 304 are different from studies 301 and 304 too. Both disease condition and sUA control before and during the screening period of tophaceous patients are generally different from the less severe patient population in studies 301 and 302.
3.2.2 Study endpoints There are two types of endpoints in measuring treatment effect on gout: clinically meaningful endpoints that directly measure incidence and severity of clinical gout such as frequency of acute gout flare and size and number of palpable tophi; and surrogate markers that reflect clinical benefit on gout such as sUA level. Benefit of persistent sUA lowering in the reduction of the above mentioned clinical endpoints were established by multiple published studies and recommended by multiple international guidelines (FDA AC June 2004, EULAR 2014, BSR 2007, and ACR 2012). SUA level is often viewed as a valid surrogate endpoint in measuring clinical benefit in gout. Limited by the duration of clinical trials, in gout trials, the sUA level is usually used as the primary efficacy endpoint as it takes longer time to observe significant clinical benefit. Due to the differences in population disease severity, the allopurinol add-on studies and the febuxostat add-on study are similar but different in both primary and secondary endpoints selection. Table 5 ummarizes the key endpoints used in the 3 studies.
Reference ID: 3831173


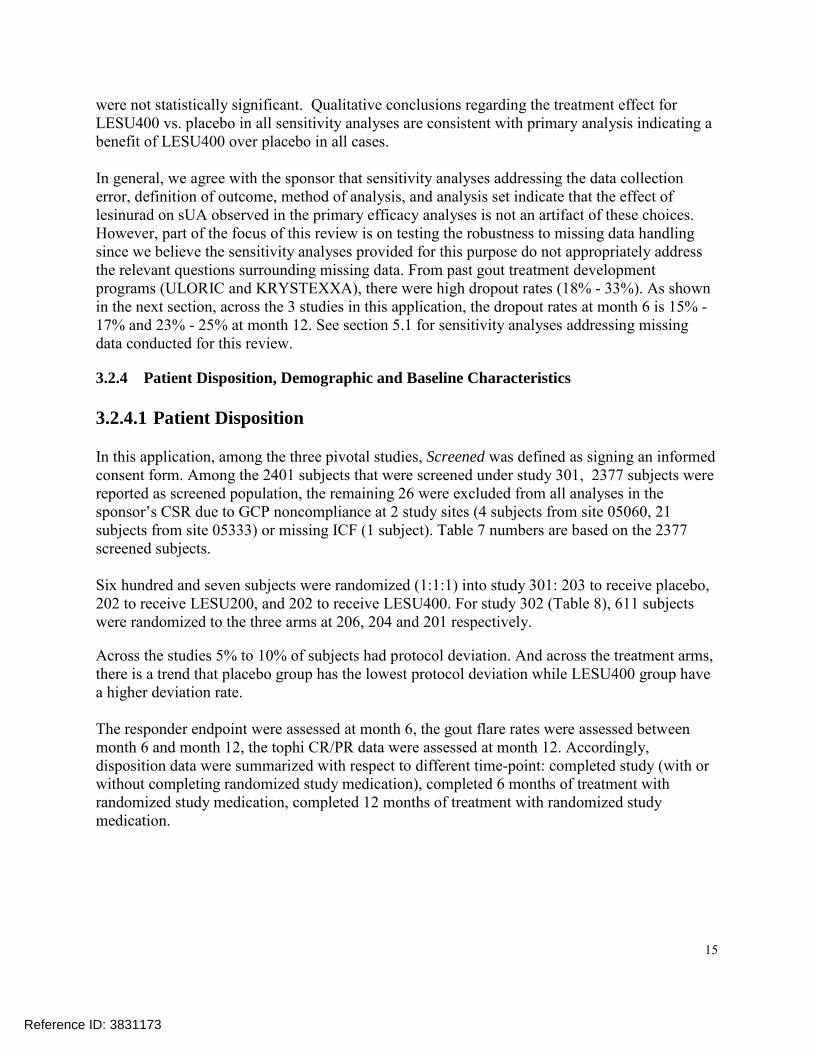
15
were not statistically significant. Qualitative conclusions regarding the treatment effect for LESU400 vs. placebo in all sensitivity analyses are consistent with primary analysis indicating a benefit of LESU400 over placebo in all cases. In general, we agree with the sponsor that sensitivity analyses addressing the data collection error, definition of outcome, method of analysis, and analysis set indicate that the effect of lesinurad on sUA observed in the primary efficacy analyses is not an artifact of these choices. However, part of the focus of this review is on testing the robustness to missing data handling since we believe the sensitivity analyses provided for this purpose do not appropriately address the relevant questions surrounding missing data. From past gout treatment development programs (ULORIC and KRYSTEXXA), there were high dropout rates (18% - 33%). As shown in the next section, across the 3 studies in this application, the dropout rates at month 6 is 15% - 17% and 23% - 25% at month 12. See section 5.1 for sensitivity analyses addressing missing data conducted for this review.
3.2.4 Patient Disposition, Demographic and Baseline Characteristics
3.2.4.1 Patient Disposition In this application, among the three pivotal studies, Screened was defined as signing an informed consent form. Among the 2401 subjects that were screened under study 301, 2377 subjects were reported as screened population, the remaining 26 were excluded from all analyses in the sponsor’s CSR due to GCP noncompliance at 2 study sites (4 subjects from site 05060, 21 subjects from site 05333) or missing ICF (1 subject). Table 7 numbers are based on the 2377 screened subjects. Six hundred and seven subjects were randomized (1:1:1) into study 301: 203 to receive placebo, 202 to receive LESU200, and 202 to receive LESU400. For study 302 (Table 8), 611 subjects were randomized to the three arms at 206, 204 and 201 respectively. Across the studies 5% to 10% of subjects had protocol deviation. And across the treatment arms, there is a trend that placebo group has the lowest protocol deviation while LESU400 group have a higher deviation rate. The responder endpoint were assessed at month 6, the gout flare rates were assessed between month 6 and month 12, the tophi CR/PR data were assessed at month 12. Accordingly, disposition data were summarized with respect to different time-point: completed study (with or without completing randomized study medication), completed 6 months of treatment with randomized study medication, completed 12 months of treatment with randomized study medication.
Reference ID: 3831173


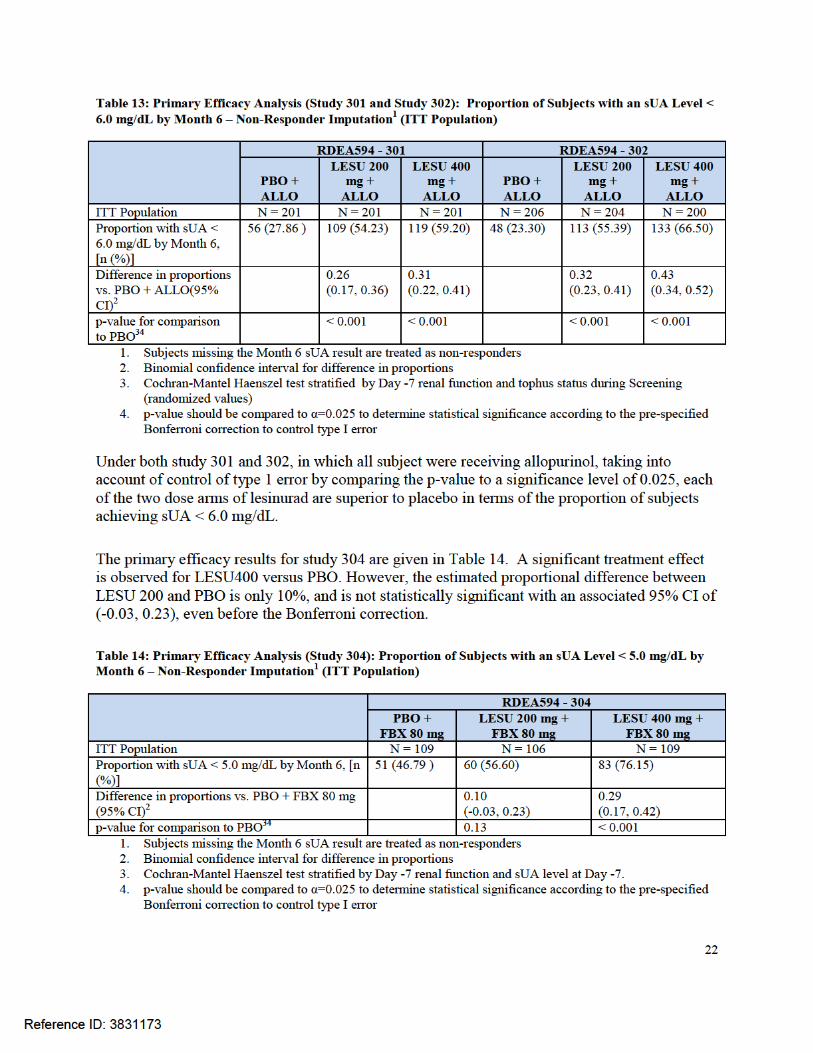

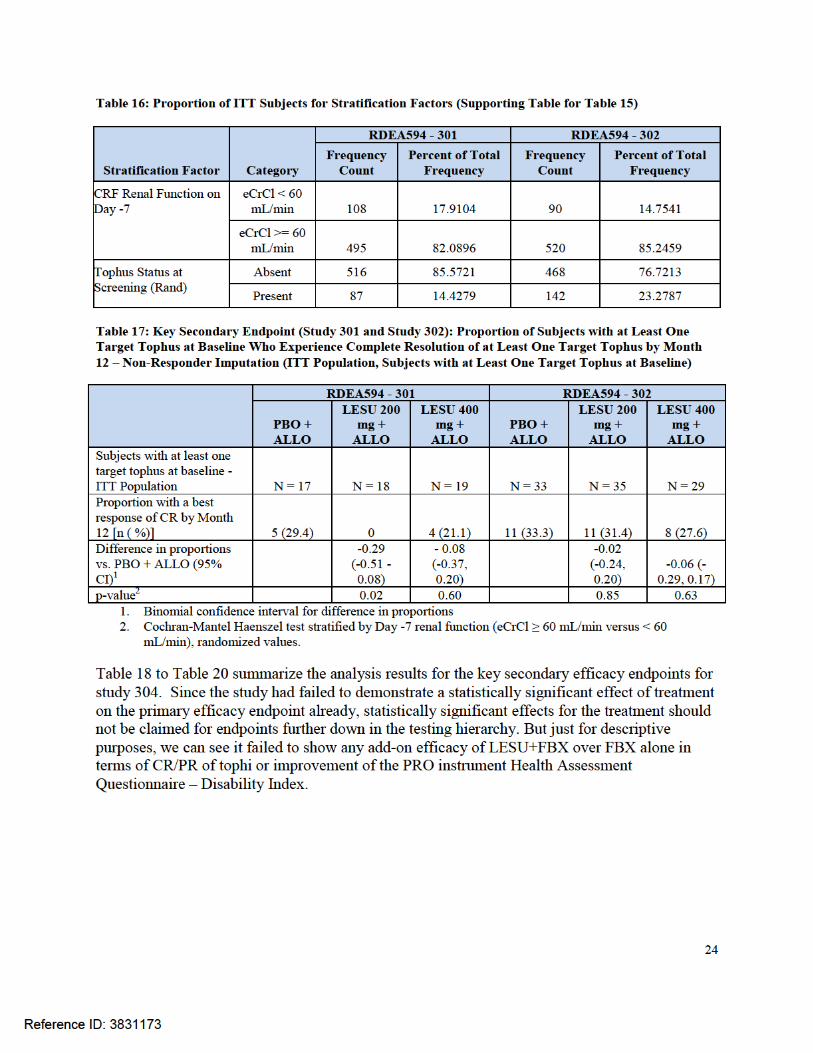
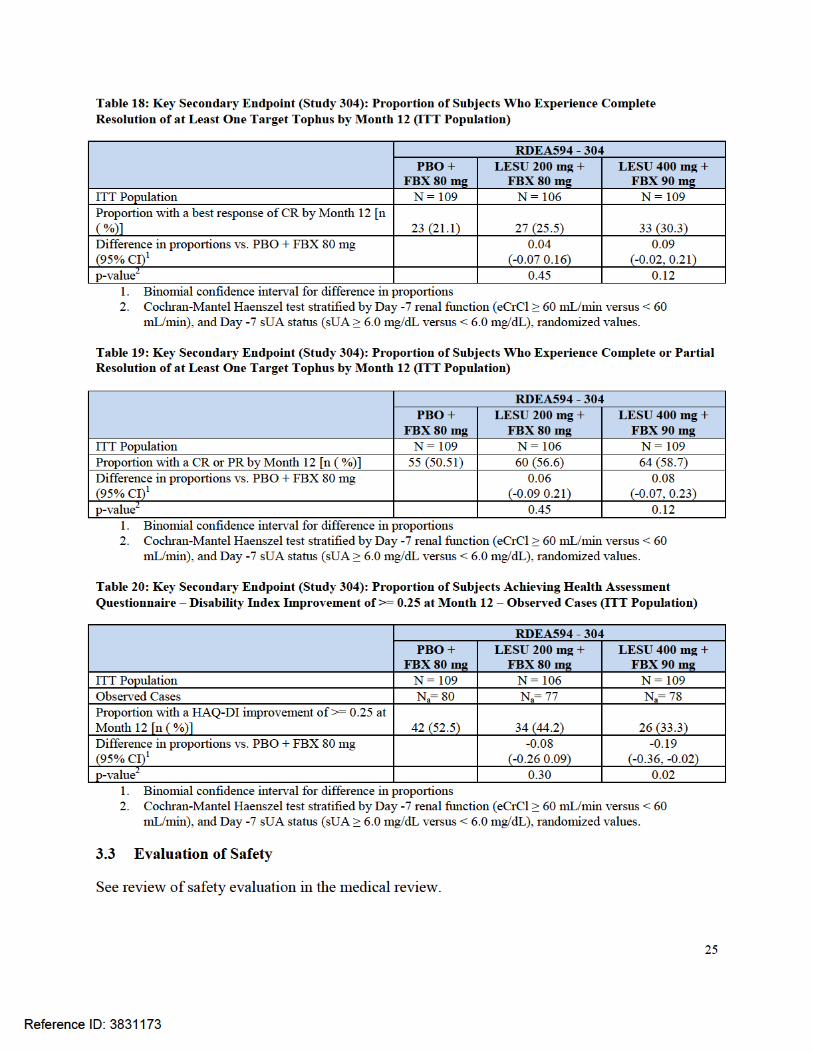

26
4 FINDINGS IN SPECIAL/SUBGROUP POPULATIONS In this review, subgroup analyses were conducted on two measures of month 6 sUA level:
1. The primary endpoint, proportion of subjects achieving sUA < 6.0 (or 5.0) mg/dL by month 6, a binary responder version of month 6 sUA level.
2. Change from baseline mean sUA level at month 6, the continuous version. For each endpoint, subgroup analyses were performed for each of the following two sets of factors:
1. Demographic factors: age (<65, >=65), sex (male, female), race (non-white, white), and region (US, non-US)
2. Baseline disease characteristics: baseline renal function (eCrCl: <45, 45 to <60, >=60), baseline background ULT (Allopurinol) dose (< 300, =300, >300) in studies 301 and 302, and in study 304, baseline sUA level (<5, >=5).
Subgroup analyses were performed in each individual phase 3 study as long as the subgrouping factor variable data is available in that study. As none of the three studies was powered to detect subgroup treatment effect, studies 301 and 302 data were pooled to give more precise estimates as these two studies are similar in design. For the binary sUA responder endpoint, interaction tests were performed using a logistic regression model with treatment, subgroup variable and treatment by subgroup variable interaction as fixed effects in the model. All the three treatment arms LESU200 + XO, LESU 400 + XO and Placebo + XO were included for the test of interaction. Estimates of by group treatment effect versus placebo were derived with the assumption of a binomial distribution of responder. The continuous version of change from baseline sUA levels was used to explore the numerical improvement across the subgroup factor levels. It may also help to mitigate the lack of power associated with responder rate data and the small sample size. The interaction tests were performed using an ANCOVA model with treatment, baseline sUA level, subgroup variable and treatment by subgroup variable interaction as fixed effects in the model. All the three treatment arms LESU200 + XO, LESU 400 + XO and Placebo + XO were included for the test of interaction. By group treatment effect was estimated with an ANCOVA regression model including treatment, baseline sUA on that specific subgroup of data. 4.1 Sex, Race, Age, and Geographic Region
For the primary endpoint, the proportion of subjects with month 6 sUA level less than 6.0 mg/dL, Table 23 to Table 26 provide a complete summary of the differences between LESU 200 mg and placebo within each demographic characteristic and baseline disease characteristic. Cases where statistically significant treatment-by-subgroup interactions are observed are comment upon in detail here.
Reference ID: 3831173


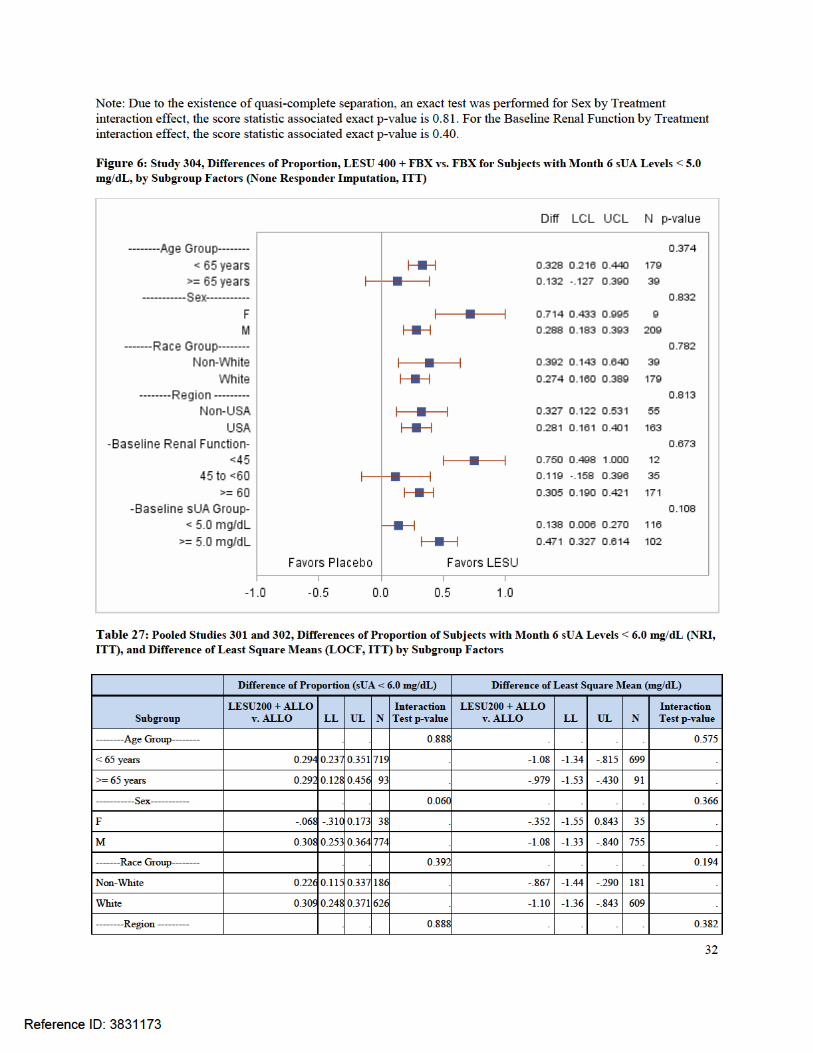

34
Across the factors and studies, there is no statistically significant interaction between treatment and subgroup factor. One close to significant observation was found in study 302 with region. The estimated mean and confidence interval of the treatment arm LESU400 + ALLO was almost separated from those of the placebo arm. Study 301 was conducted only in the US. Results from study 304 do not show such a strong signal. Analyses on change from baseline sUA are in a sense sensitivity analyses to support the interpretation of the analysis results on the responder endpoint. By using the continuous measurement of sUA level, a more robust estimate of the subgroup treatment effects and corresponding interaction tests can be derived. No evidence of heterogeneity of treatment efficacy exists in the baseline demographic subgroups examined. 4.2 Baseline Disease Characteristics Subgroup analyses were also conducted on both the primary endpoint, the dichotomized sUA response and the change from baseline sUA level for the following baseline disease characteristic factors: baseline renal function (eCrCl), background Allopurinol dose (in studies 301 and 302), and baseline sUA. Lesinurad is believed to be a selective uric acid reabsorption inhibitor and its activity is dependent on the renal function of the patients (See Dr. Jianmeng Chen’s OCP review). The Applicant summarized treatment effects on sUA by subgroups dichotomized with varying cut-point of baseline renal function (eCrCl) values. In this review, we chose, in consultation with the FDA medical and clinical pharmacology teams, the following cut-points and corresponding intervals to categorize severe renal impairment group (eCrCl <45 mL/min), moderate renal impairment group (45 to <60 mL/min) and mild to normal renal function group (>=60). Note that in the Applicant’s reports, >90 mL/min was used as an additional category to differentiate normal and not normal renal function.
Consistency of treatment effect among baseline background ULT (Allopurinol) dose groups (< 300, =300, >300) in study 301 and 302 were also investigated. The medical team is also concerned with the observation that in study 304 that around 50% of subjects had reached the urate lowering target at the baseline visit. Treatment effect of further urate lowering and consistency of treatment effect across these patient groups is explored with subgroup analysis for baseline sUA level (<5, >=5). The analysis methods are the same as described in section 4.1. In all the three studies 301, 302 and 304, there were no statistically significant treatment by baseline renal function interactions. Note that the relative small severe baseline renal impairment group sample sizes result in sampling zero in the case of severe baseline renal impairment (eCrCl < 45 mL/min) non-responder count (Table 23) in study 304. An exact test for the interaction effect was performed instead of just reporting the Wald Statistics from maximum likelihood estimation. In studies 301 and 302, there were no statistically significant treatment by background allopurinol dose interaction.
Reference ID: 3831173
35
In study 304, for subgroup analysis for baseline sUA group, the subgroup analysis on the responder endpoint, the treatment by baseline sUA group interaction is not statistically significant (p-value=0.108). However, in the subgroup analysis on change from baseline sUA level, there is a statistically significant (p-value=0.048) interaction between treatment and baseline sUA group. If we focus on the comparison between LESU 200 + FBX and FBX, the responder analysis give a better treatment effect in the baseline sUA group of >=5.0 mg/dL; the change from baseline measure give a better treatment effect in the baseline sUA group of <5.0 mg/dL. The directions of the estimated effects are conflicting within the comparison (LESU200+FBX over FBX) between the two endpoints. However, a close examination of the estimates and associated confidence intervals in comparisons on LESU400+FBX over FBX showed consistent trends. 5 SUMMARY AND CONCLUSIONS 5.1 Statistical Issues
5.1.1 Missing Data and Sensitivity Analysis
5.1.1.1 Tipping Point Analysis for Responder Rate The primary analyses of sUA Responder rate were conducted, as pre-specified, on the ITT population in which subjects with missing month 6 serum uric acid data were imputed as non-responders (NRI), without differentiation between the different reasons for drop out, across the treatment arms. This is considered a fair representation of the efficacy of the study treatment in that patients who chose to prematurely discontinue study treatment have in fact indicated that they are not willing to continue taking the study medication in exchange for what level of efficacy is being received (i.e., that the study treatment is ineffective for that patient). Nonetheless, in the review, tipping point analyses are provided to gauge the extent to which the demonstration of a treatment effect is dependent on the NRI. The tipping point approach is a method that estimates the treatment effect under varying assumptions about the outcomes of the dropouts in each treatment group. By exploring the whole range of possible and meaningful outcomes for the dropouts and imputing with different rate under different arms, we may assess how extreme the off-study-treatment unobserved data would have to have been to negate the treatment effects estimated from the observed data. If this “tipping point” is so extreme that it is not clinically plausible, one may conclude that demonstration of efficacy is reliable despite the missing data. From study 301 and 304, early study treatment discontinuation and therefore early study withdrawal as the protocol did not distinguish between the two was slightly more common in the LESU groups at approximately 18-19% as opposed to 13-14% in the Placebo groups. The most common reasons for early withdrawal were “withdraw consent,” “adverse event,” “non-compliance.”
Reference ID: 3831173

36
Table 27 and Table 28 provide estimates of the treatment effect (proportional difference and 97.5% confidence interval) and p-values associated with a test of whether the proportion difference from LESU 200 + XOI relative to XOI alone in the responder rate, respectively. These analyses incorporate both observed data and imputed data. Imputed data are generated with varying assumptions about the rate of responder for each treatment group (from total non-responder to total responder) in patients who withdrew from the study early during the time for which they should have been observed but were not. Results on the diagonal indicate analyses based on assumptions that require equal post-discontinuation exacerbation rates in each treatment group. Areas below those cells assume that the post-discontinuation responder rates in the XOI alone arm would have been higher than that of the LESU + XOI arm. Areas above the diagonal represent the cases where the unobserved responder rates for the LESU + XOI arm are assumed to be higher than that of the XOI alone arm. Pink shaded regions include the cases where the assumptions regarding the post-discontinuation data are sufficient to “tip” the analysis of the proportional difference for the responder rate (including observed and unobserved imputed data) so that the result numerically favoring the LESU + XOI group is no longer associated with a p-value less than 0.025. In order for the hypothesis test to fail to demonstrate an advantage of LESU200+XOI over XOI alone in Study 301, the responder rate of the XOI only arm would need to be higher by an absolute difference of at least 86% in the XOI dropouts than in the LESU200+XOI dropouts. As a point of reference, the responder rate in the observed data was 54% and 28% for the LESU200+XOI and XOI alone, respectively. The post-discontinuation responder rate for XOI patients would have to be more than three times as high as the observed responder rate whiles the post-discontinuation mean exacerbation rate for the LESU200+XOI patients would have to be 0 to reach the tipping point for the test of the proportional difference being equal to one. Given the similar proportions of patients and distributions of reasons for early withdrawal on the two treatment arms, an assumption of such large differences between the outcomes in dropouts on the two arms seems implausible. Therefore, these tipping point analyses largely support the findings of the key efficacy analyses of the observed data presented in Section 3.2.5, Table 13. The situation in study 302 is more extreme while nowhere on the spectrum of assumption can the conclusion be tipped.
Reference ID: 3831173


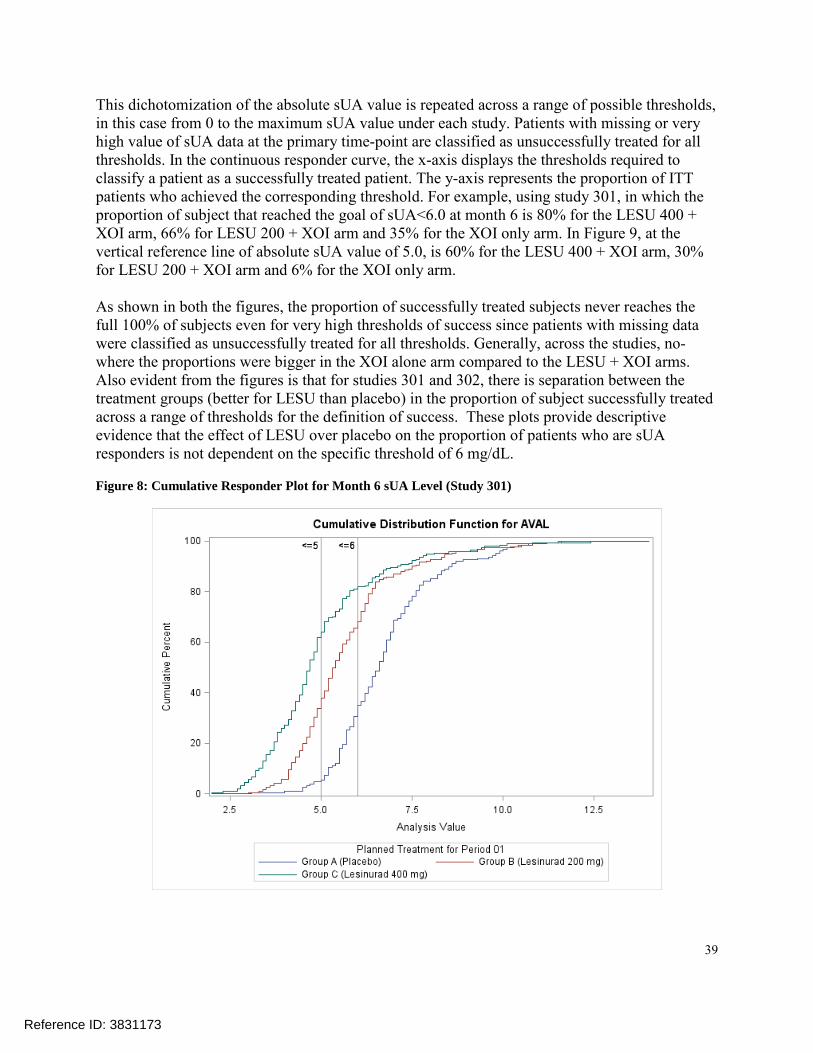
39
This dichotomization of the absolute sUA value is repeated across a range of possible thresholds, in this case from 0 to the maximum sUA value under each study. Patients with missing or very high value of sUA data at the primary time-point are classified as unsuccessfully treated for all thresholds. In the continuous responder curve, the x-axis displays the thresholds required to classify a patient as a successfully treated patient. The y-axis represents the proportion of ITT patients who achieved the corresponding threshold. For example, using study 301, in which the proportion of subject that reached the goal of sUA<6.0 at month 6 is 80% for the LESU 400 + XOI arm, 66% for LESU 200 + XOI arm and 35% for the XOI only arm. In Figure 9, at the vertical reference line of absolute sUA value of 5.0, is 60% for the LESU 400 + XOI arm, 30% for LESU 200 + XOI arm and 6% for the XOI only arm. As shown in both the figures, the proportion of successfully treated subjects never reaches the full 100% of subjects even for very high thresholds of success since patients with missing data were classified as unsuccessfully treated for all thresholds. Generally, across the studies, no-where the proportions were bigger in the XOI alone arm compared to the LESU + XOI arms. Also evident from the figures is that for studies 301 and 302, there is separation between the treatment groups (better for LESU than placebo) in the proportion of subject successfully treated across a range of thresholds for the definition of success. These plots provide descriptive evidence that the effect of LESU over placebo on the proportion of patients who are sUA responders is not dependent on the specific threshold of 6 mg/dL. Figure 8: Cumulative Responder Plot for Month 6 sUA Level (Study 301)
Reference ID: 3831173
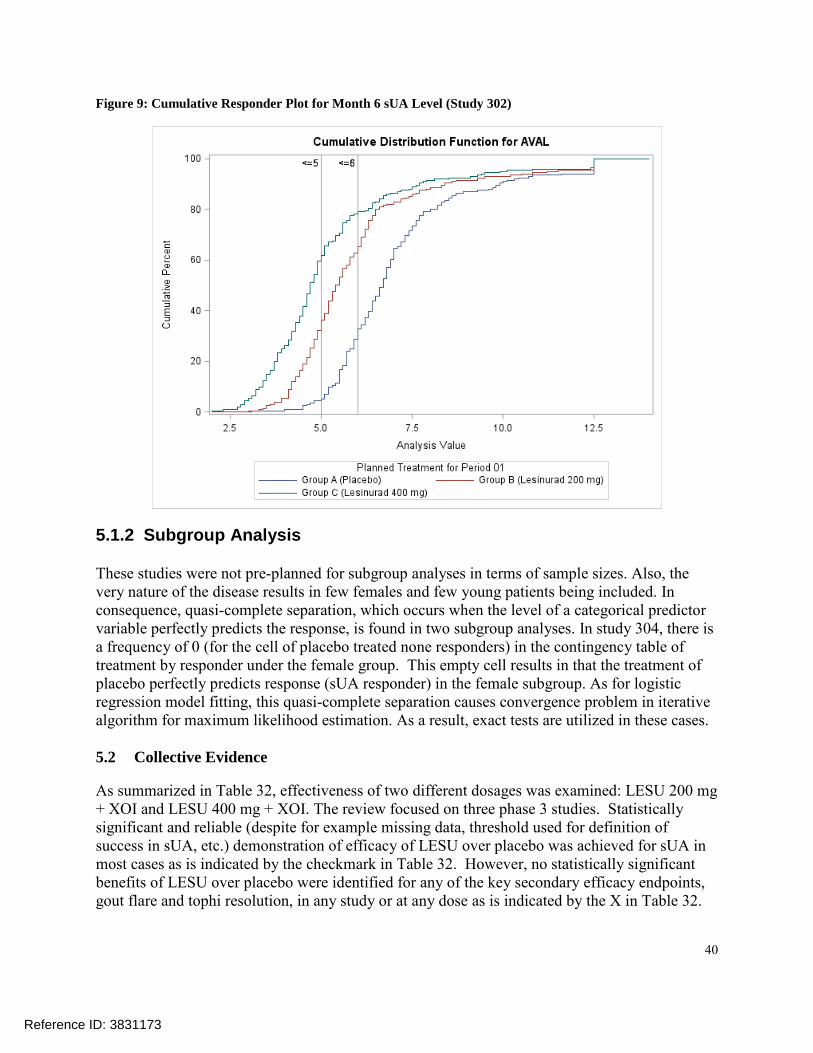
40
Figure 9: Cumulative Responder Plot for Month 6 sUA Level (Study 302)
5.1.2 Subgroup Analysis These studies were not pre-planned for subgroup analyses in terms of sample sizes. Also, the very nature of the disease results in few females and few young patients being included. In consequence, quasi-complete separation, which occurs when the level of a categorical predictor variable perfectly predicts the response, is found in two subgroup analyses. In study 304, there is a frequency of 0 (for the cell of placebo treated none responders) in the contingency table of treatment by responder under the female group. This empty cell results in that the treatment of placebo perfectly predicts response (sUA responder) in the female subgroup. As for logistic regression model fitting, this quasi-complete separation causes convergence problem in iterative algorithm for maximum likelihood estimation. As a result, exact tests are utilized in these cases. 5.2 Collective Evidence As summarized in Table 32, effectiveness of two different dosages was examined: LESU 200 mg + XOI and LESU 400 mg + XOI. The review focused on three phase 3 studies. Statistically significant and reliable (despite for example missing data, threshold used for definition of success in sUA, etc.) demonstration of efficacy of LESU over placebo was achieved for sUA in most cases as is indicated by the checkmark in Table 32. However, no statistically significant benefits of LESU over placebo were identified for any of the key secondary efficacy endpoints, gout flare and tophi resolution, in any study or at any dose as is indicated by the X in Table 32.
Reference ID: 3831173


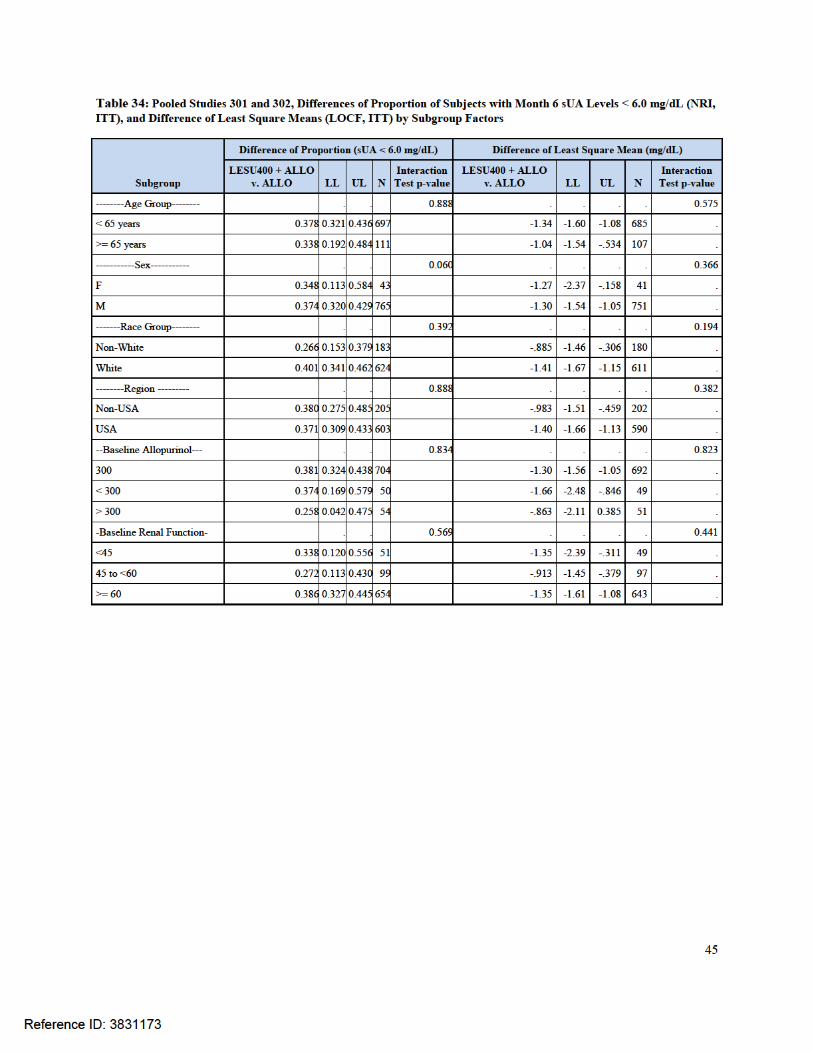

46
Figure 10: Study 301, Differences of Proportion, LESU 400 + ALLO vs. ALLO for Subjects with Month 6 sUA Levels < 6.0 mg/dL, by Subgroup Factors (None Responder Imputation, ITT)
Figure 11: Study 302, Differences of Proportion, LESU 400 + ALLO vs. ALLO for Subjects with Month 6 sUA Levels < 6.0 mg/dL, by Subgroup Factors (None Responder Imputation, ITT)
Reference ID: 3831173

47
Figure 12: Study 304, Differences of Proportion, LESU 400 + ALLO vs. ALLO for Subjects with Month 6 sUA Levels < 5.0 mg/dL, by Subgroup Factors (None Responder Imputation, ITT)
Figure 13: Studies 301 and 302, Differences of Proportion, LESU 400 + ALLO vs. ALLO for Subjects with Month 6 sUA Levels < 5.0 mg/dL, by Subgroup Factors (None Responder Imputation, ITT)
Reference ID: 3831173

48
Figure 14: Study 301, Estimated Mean Differences, LESU 200 + ALLO vs. ALLO, of Change from Baseline Month 6 sUA Levels, by Subgroup Factors (LOCF, ITT)
Figure 15: Study 301, Estimated Mean Differences, LESU 400 + ALLO vs. ALLO, of Change from Baseline Month 6 sUA Levels, by Subgroup Factors (LOCF, ITT)
Reference ID: 3831173

49
Figure 16: Study 302, Estimated Mean Differences, LESU 200 + ALLO vs. ALLO, of Change from Baseline Month 6 sUA Levels, by Subgroup Factors (LOCF, ITT)
Figure 17: Study 302, Estimated Mean Differences, LESU 400 + ALLO vs. ALLO, of Change from Baseline Month 6 sUA Levels, by Subgroup Factors (LOCF, ITT)
Reference ID: 3831173
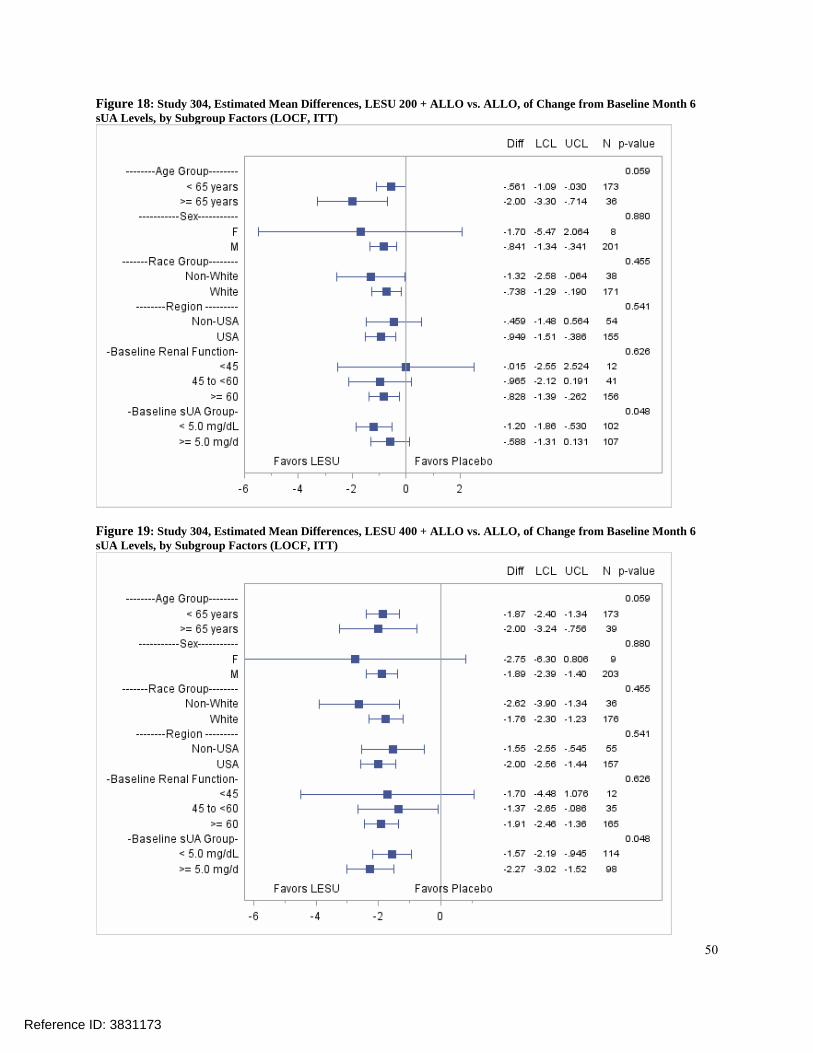
50
Figure 18: Study 304, Estimated Mean Differences, LESU 200 + ALLO vs. ALLO, of Change from Baseline Month 6 sUA Levels, by Subgroup Factors (LOCF, ITT)
Figure 19: Study 304, Estimated Mean Differences, LESU 400 + ALLO vs. ALLO, of Change from Baseline Month 6 sUA Levels, by Subgroup Factors (LOCF, ITT)
Reference ID: 3831173

51
Figure 20: Pooled Studies 301 and 302, Estimated Mean Differences, LESU 200 + ALLO vs. ALLO, of Change from Baseline Month 6 sUA Levels, by Subgroup Factors (LOCF, ITT)
Figure 21: Pooled Studies 301 and 302, Estimated Mean Differences, LESU 400 + ALLO vs. ALLO, of Change from Baseline Month 6 sUA Levels, by Subgroup Factors (LOCF, ITT)
Reference ID: 3831173

52
7 Bibliography Ardea Biosciences, Inc. (2014). LESINURAD Clinical Overview. Doherty, M., Jansen, T. J., Nuki, G., Pascual, E., Perez-Ruiz, F., Ounzi, L., et al. (2012). Gout: why is this curable
disease so seldom cured? Ann Rheum Dis, 1765-1770. Keith, M. P., & Gilliland, W. R. (2007). Updates in the Management of Gout. The American Journal of Medicine,
221-224. Neogi, T. (2011). Gout. The New England Journal of Medicine, 443-52.
Reference ID: 3831173

---------------------------------------------------------------------------------------------------------This is a representation of an electronic record that was signedelectronically and this page is the manifestation of the electronicsignature.---------------------------------------------------------------------------------------------------------/s/----------------------------------------------------
YU WANG10/08/2015
RUTHANNA C DAVI10/08/2015
Reference ID: 3831173

STATISTICS FILING CHECKLIST FOR NDA 207988
Statistics Filing Checklist for NDA 207988
NDA Number: 207988 Applicant: Ardea Bioscience, Inc. Stamp Date: December 29, 2014
Drug Name: Lesinurad NDA Type: Standard
On initial overview of the NDA application for RTF: Studies 301, 302 and 304
Content Parameter Yes No NA Comments
1 Index is sufficient to locate necessary reports, tables, data, etc.
X
2 ISS, ISE, and complete study reports are available (including original protocols, subsequent amendments, etc.)
X
3 Safety and efficacy were investigated for gender, racial, and geriatric subgroups investigated (if applicable).
X
4 Data sets in EDR are accessible and do they conform to applicable guidances (e.g., existence of define.pdf file for data sets).
X
IS THE STATISTICAL SECTION OF THE APPLICATION FILEABLE? Yes
Comment:
Please identify and list any potential review issues to be forwarded to the Applicant for the 74-day letter.
Content Parameter (possible review concerns for 74-day letter)
Yes No NA Comment
Designs utilized are appropriate for the indications requested. X
Endpoints and methods of analysis are specified in the protocols/statistical analysis plans. X
Interim analyses (if present) were pre-specified in the protocol and appropriate adjustments in significance level made. DSMB meeting minutes and data are available.
X
Appropriate references for novel statistical methodology (if present) are included.
X
Safety data organized to permit analyses across clinical trials in the NDA/BLA.
X
Investigation of effect of dropouts on statistical analyses as described by applicant appears adequate. X
Reference ID: 3705507


STATISTICS FILING CHECKLIST FOR NDA 207988
Statistics Filing Checklist for NDA 207988
Among the three studies, studies 301 and 302 demonstrated efficacy in the primary responder analyses, study 304 failed to meet its primary endpoint.
Reference ID: 3705507
---------------------------------------------------------------------------------------------------------This is a representation of an electronic record that was signedelectronically and this page is the manifestation of the electronicsignature.---------------------------------------------------------------------------------------------------------/s/----------------------------------------------------
YU WANG02/20/2015
DAVID M PETULLO02/20/2015I concur.
Reference ID: 3705507