&20387(5 6&,(1&( $1' (1*,1((5,1*amsdottorato.unibo.it/8945/1/TesiMattiaSalvaro.pdf · EEG...
72
Alma Mater Studiorum – Università di Bologna DOTTORATO DI RICERCA IN COMPUTER SCIENCE AND ENGINEERING Ciclo XXXI Settore Concorsuale: 09/H1 Settore Scientifico Disciplinare: ING-INF/05 A fully-wearable non-invasive SSVEP-based BCI system enabled by AR techniques for daily use in real environment. Presentata da: Mattia Salvaro Coordinatore Dottorato Supervisore Prof. Paolo Ciaccia Prof. Michela Milano Co-supervisore Prof. Luca Benini Esame finale anno 2019
Transcript of &20387(5 6&,(1&( $1' (1*,1((5,1*amsdottorato.unibo.it/8945/1/TesiMattiaSalvaro.pdf · EEG...

AAllmmaa MMaatteerr SSttuuddiioorruumm –– UUnniivveerrssiittàà ddii BBoollooggnnaa
DOTTORATO DI RICERCA IN
COMPUTER SCIENCE AND ENGINEERING
Ciclo XXXI
Settore Concorsuale: 09/H1 Settore Scientifico Disciplinare: ING-INF/05
A fully-wearable non-invasive SSVEP-based BCI system enabled by AR techniques for daily use in real environment.
Presentata da: Mattia Salvaro Coordinatore Dottorato Supervisore Prof. Paolo Ciaccia Prof. Michela Milano
Co-supervisore
Prof. Luca Benini
Esame finale anno 2019
ALMA MATER STUDIORUM - UNIVERSITY OF BOLOGNA
A fully-wearable non-invasive
SSVEP-based BCI system enabled by
AR techniques for daily use in real
environment.
by
Mattia Salvaro
A thesis submitted for the degree of
Doctor of Philosophy
in the
Faculty of Engineering
Department of Computer Science and Engineering (DISI)
February 2019


“If we knew what it was we were doing, it would not be called research, would it?”
Albert Einstein


ALMA MATER STUDIORUM - UNIVERSITY OF BOLOGNA
Abstract
Faculty of Engineering
Department of Computer Science and Engineering (DISI)
Doctor of Philosophy
by Mattia Salvaro
This thesis aims to explore the design and implementation of Brain Computer Inter-
faces (BCIs) specifically for non medical scenarios, and therefore to propose a solution
that overcomes typical drawbacks of existing systems such as long and uncomfortable
setup time, scarce or nonexistent mobility, and poor real-time performance. The research
starts from the design and implementation of a plug-and-play wearable low-power BCI
that is capable of decoding up to eight commands displayed on a LCD screen, with about
2 seconds of latency. The thesis also addresses the issues emerging from the usage of the
BCI during a walk in a real environment while tracking the subject via indoor position-
ing system. Furthermore, the BCI is then enhanced with a smart glasses device that
projects the BCI visual interface with augmented reality (AR) techniques, unbinding
the system usage from the need of infrastructures in the surrounding environment.


Acknowledgements
I would like to thank my advisors, Michela Milano and Luca Benini, for giving
me the opportunity to pursue this PhD, my supervisors at Micrel Lab Simone Benatti
and Marco Guermandi, and my lab fellows Victor Kartsch, Fabio Montagna, Hanie
Aghazadeh, Tommaso Polonelli and Alberto Girolami. It has been very nice to share
this experience with all of you.
I would also like to thank my supportive family, to which I owe this achievement,
and my girlfriend Manuela, that helped me a lot through thick and thin.
vi


Contents
Abstract iv
Acknowledgements vi
List of Figures x
List of Tables xii
Abbreviations xiii
1 Introduction 1
1.1 Thesis contribution . . . . . . . . . . . . . . . . . . . . . . . . . . . . . . . 3
2 Brain Computer Interface 4
2.1 Overview . . . . . . . . . . . . . . . . . . . . . . . . . . . . . . . . . . . . 4
2.2 EEG signal . . . . . . . . . . . . . . . . . . . . . . . . . . . . . . . . . . . 6
2.2.1 Signal Description . . . . . . . . . . . . . . . . . . . . . . . . . . . 6
2.2.2 Signal Acquisition . . . . . . . . . . . . . . . . . . . . . . . . . . . 8
2.3 Taxonomy . . . . . . . . . . . . . . . . . . . . . . . . . . . . . . . . . . . . 9
2.4 State of the Art . . . . . . . . . . . . . . . . . . . . . . . . . . . . . . . . . 11
2.5 Canonical Correlation Analysis . . . . . . . . . . . . . . . . . . . . . . . . 14
2.6 Wearable BCI . . . . . . . . . . . . . . . . . . . . . . . . . . . . . . . . . . 16
2.6.1 Hardware . . . . . . . . . . . . . . . . . . . . . . . . . . . . . . . . 17
2.6.2 Firmware implementation . . . . . . . . . . . . . . . . . . . . . . . 18
2.7 Experiments and results . . . . . . . . . . . . . . . . . . . . . . . . . . . . 19
2.7.1 Experimental setup . . . . . . . . . . . . . . . . . . . . . . . . . . . 19
2.7.2 Experimental results . . . . . . . . . . . . . . . . . . . . . . . . . . 22
2.7.3 Computational results . . . . . . . . . . . . . . . . . . . . . . . . . 25
3 Location-Based BCI 28
3.1 System description . . . . . . . . . . . . . . . . . . . . . . . . . . . . . . . 29
3.1.1 Android app . . . . . . . . . . . . . . . . . . . . . . . . . . . . . . 29
3.1.2 EEG acquisition system . . . . . . . . . . . . . . . . . . . . . . . . 30
3.1.3 Signal processing . . . . . . . . . . . . . . . . . . . . . . . . . . . . 31
3.1.4 Challenges . . . . . . . . . . . . . . . . . . . . . . . . . . . . . . . 32
viii

Contents ix
3.2 Experiments and results . . . . . . . . . . . . . . . . . . . . . . . . . . . . 33
3.2.1 Experimental setup . . . . . . . . . . . . . . . . . . . . . . . . . . . 33
3.2.2 Experimental results . . . . . . . . . . . . . . . . . . . . . . . . . . 34
4 AR-based BCI 37
4.1 Smart glasses . . . . . . . . . . . . . . . . . . . . . . . . . . . . . . . . . . 38
4.2 AR for stimuli presentation . . . . . . . . . . . . . . . . . . . . . . . . . . 38
4.3 AR-based stimuli validation . . . . . . . . . . . . . . . . . . . . . . . . . . 40
4.4 Experiments and results . . . . . . . . . . . . . . . . . . . . . . . . . . . . 41
4.4.1 Experimental setup . . . . . . . . . . . . . . . . . . . . . . . . . . . 41
4.4.2 Experimental results . . . . . . . . . . . . . . . . . . . . . . . . . . 42
5 Conclusions 44
Bibliography 47

List of Figures
2.1 Structure of a neuron (source: Wikimedia commons). The cell body (a)contains the cell nucleus and acts as the cell’s life support center. The cellbody gathers and aggregates the signals arriving from other cells thoughdendrites (b). The axon (c) allows the neuron to spread the signal awayfrom the cell body to other neurons. The information is constituted by aneural impulse (d), flowing from the cell body to the peripheral synapticterminals (e), that in turn communicate with another neuron. . . . . . . 7
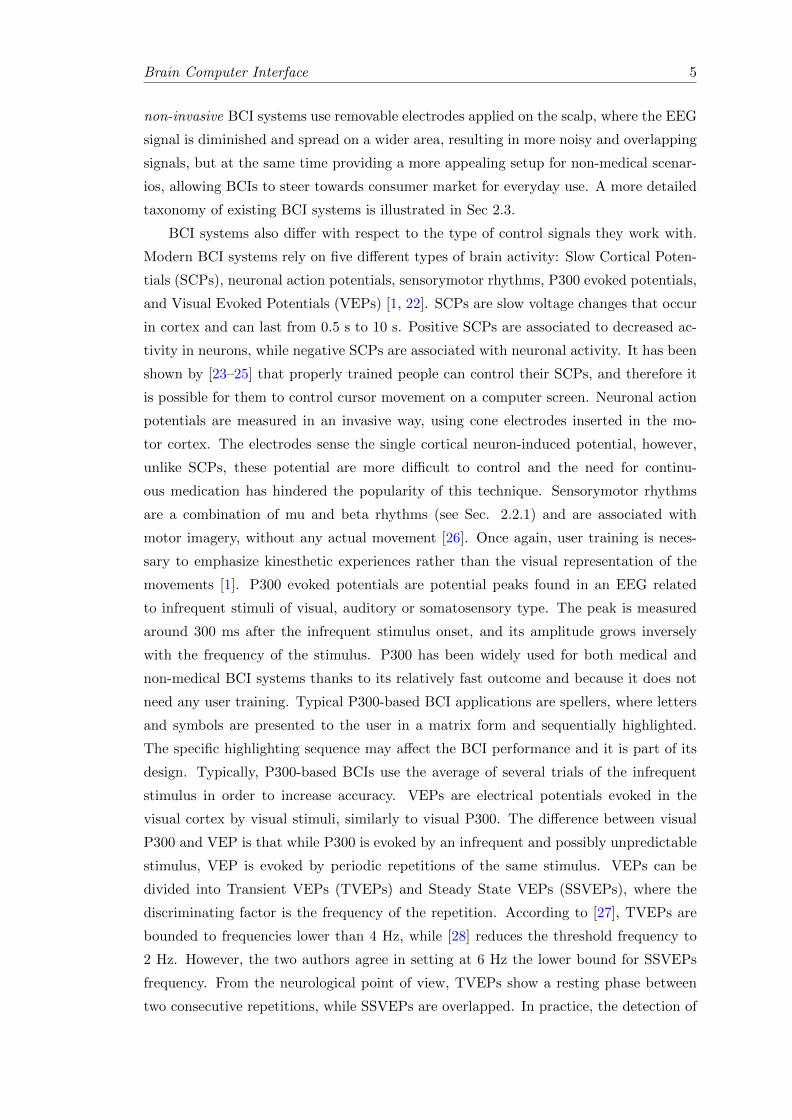
2.2 (a) Picture of the g.SAHARA dry electrode with custom amplifier PCB.(b) Electrical schematics of the custom amplifier PCB. . . . . . . . . . . 8
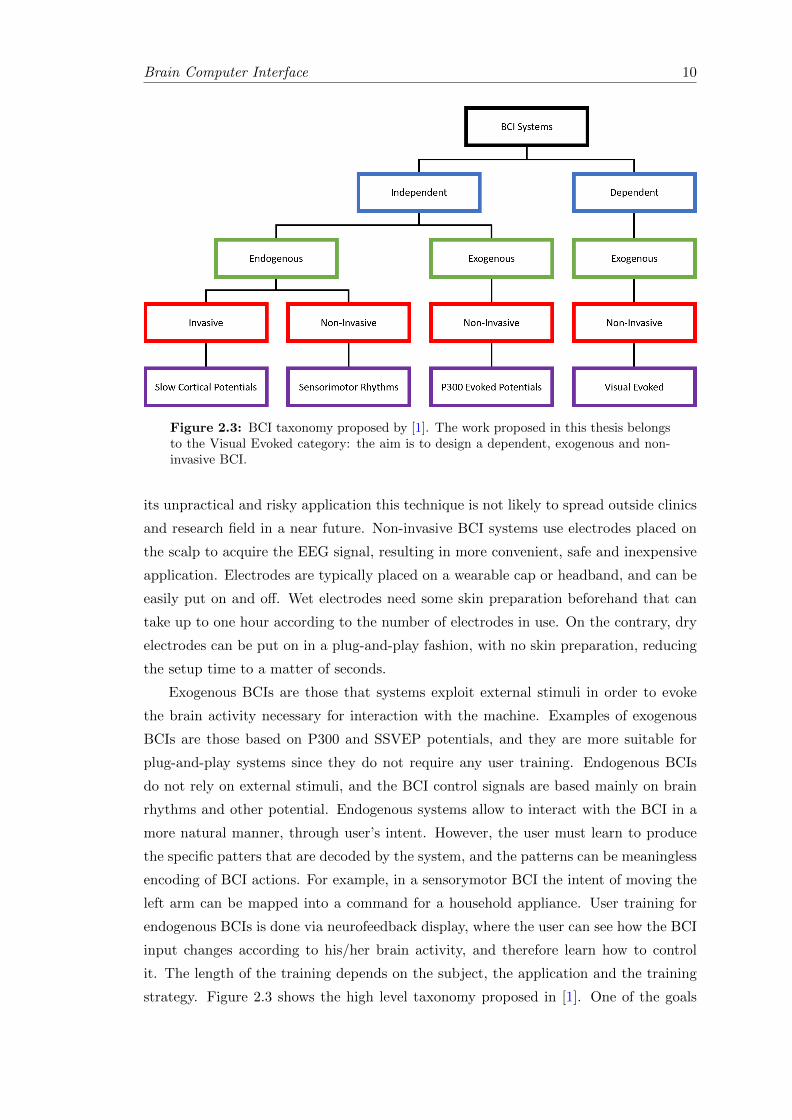
2.3 BCI taxonomy proposed by [1]. The work proposed in this thesis be-longs to the Visual Evoked category: the aim is to design a dependent,exogenous and non-invasive BCI. . . . . . . . . . . . . . . . . . . . . . . . 10
2.4 Block diagram of CCA algorithm and implementation. (a) Signal matricesinput for CCA. (b) CCA formulation algorithm. (c) CCA implementationalgorithm. (d) Feature extraction. . . . . . . . . . . . . . . . . . . . . . . 15
2.5 Architectural diagram of the proposed system. Fig. 2.5 (a) and (b) show,respectively, an image and the block diagram of the wearable node. Fig.2.5 (c) presents an image of the dry active electrodes and (d) the electricalschematics of the custom amplifier stage PCB. Finally, in Fig. 2.5 (e) theLCD screen with stimuli presentation is depicted. . . . . . . . . . . . . . . 17
2.6 Acquisition setup: the flickering stimuli layouts (layout L2 in the figure,featuring four checkerboards) are presented on a 24-inches LED screen.The subject stares at the screen from a distance of 80 cm. . . . . . . . . . 20
2.7 Average CCA correlation of SSVEP responses for different stimuli (x-axes) calculated with different reference signals (y-axes). On the diago-nal it is possible to observe higher correlation due to the correspondencebetween the stimulus frequency and the reference signals. Noticeably, thelower part of the stimuli spectrum allows for higher correlation responsewith respect to the higher part. . . . . . . . . . . . . . . . . . . . . . . . 22
2.8 Average ITR results for the system with wet electrodes (blue triangles),and dry electrodes (red circles) calculated using different classificationthresholds. A threshold value of 0.55 is shown to maximize ITR for bothwet and dry electrodes. . . . . . . . . . . . . . . . . . . . . . . . . . . . . 23
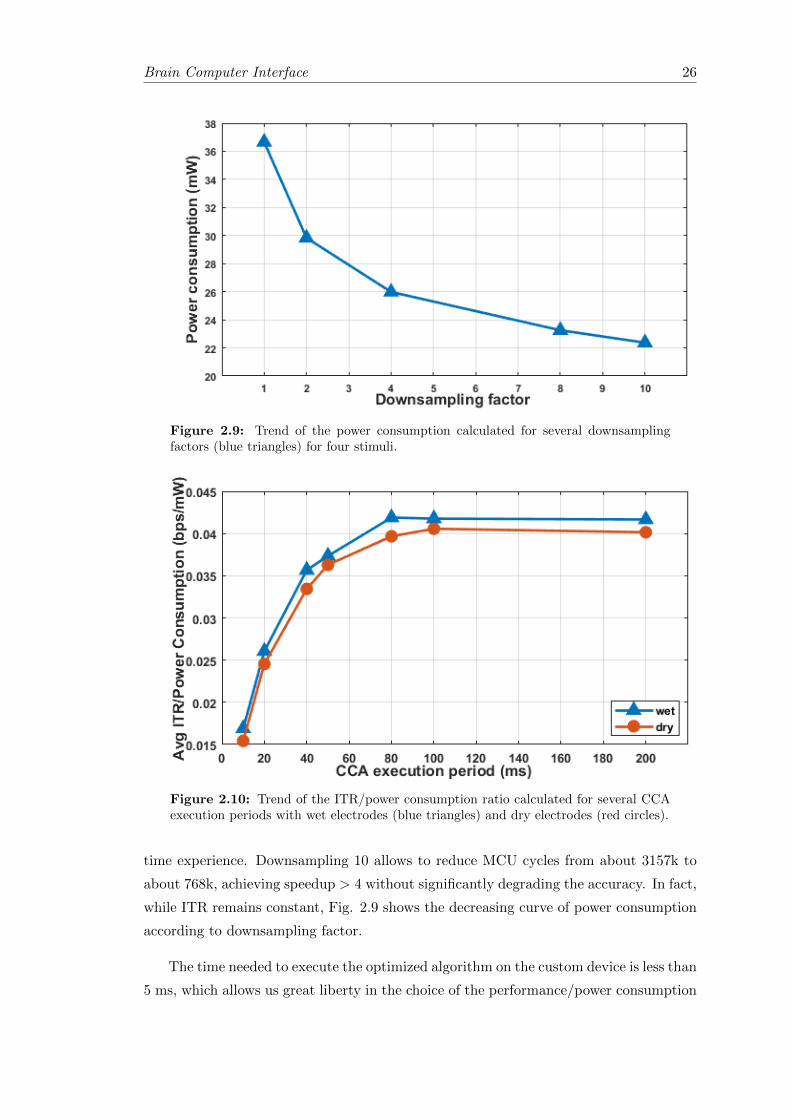
2.9 Trend of the power consumption calculated for several downsampling fac-tors (blue triangles) for four stimuli. . . . . . . . . . . . . . . . . . . . . . 26
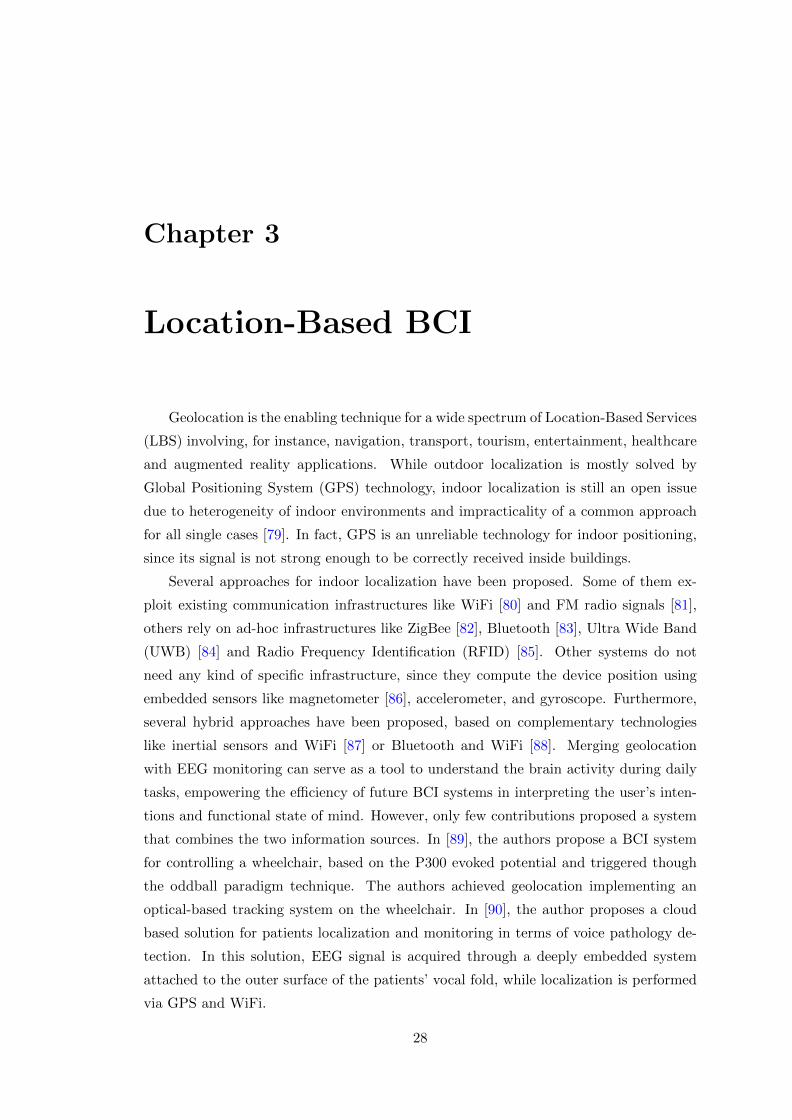
2.10 Trend of the ITR/power consumption ratio calculated for several CCAexecution periods with wet electrodes (blue triangles) and dry electrodes(red circles). . . . . . . . . . . . . . . . . . . . . . . . . . . . . . . . . . . . 26
3.1 Android app architecture . . . . . . . . . . . . . . . . . . . . . . . . . . . 29
x

List of Figures xi
3.2 EEG acquisition board . . . . . . . . . . . . . . . . . . . . . . . . . . . . . 30
3.3 Spectrogram of the EEG data and positions . . . . . . . . . . . . . . . . . 31
3.4 Overview of the full wearable system composed by the BCI board andelectrodes placed on the head, and the Android hand held device. . . . . . 33
3.5 Predefined path and stimuli location . . . . . . . . . . . . . . . . . . . . . 33
3.6 Frequency Response for SSVEP at 12.5Hz. . . . . . . . . . . . . . . . . . . 34
3.7 Frequency Response for SSVEP at 20Hz. . . . . . . . . . . . . . . . . . . . 35
4.1 Example of the application usage from the user’s perspective. . . . . . . . 39
4.2 Frequency response of stimuli generated on the AR glasses and capturedby a photo-resistor. The deviation from the target frequency is < 0.1 Hz. 40
4.3 CCA correlation . . . . . . . . . . . . . . . . . . . . . . . . . . . . . . . . 41
4.4 Front and back view of the complete setup during a test.The HDMI cableattached to the board is used only for testing purpose, and it is notrequired during normal operation of the system. Similarly, the currentsize and weight of the PCB allow an easy debugging. Nevertheless, theentire hardware dimensions can be reduced to a half. . . . . . . . . . . . . 41

List of Tables
2.1 Comparison between state-of-the-art BCI Systems in terms of setups andITR. . . . . . . . . . . . . . . . . . . . . . . . . . . . . . . . . . . . . . . . 11
2.2 Offline results for 4 stimuli BCI, wet and dry setup. . . . . . . . . . . . . 24
2.3 Offline results for 8 stimuli BCI, wet and dry setup. . . . . . . . . . . . . 25
2.4 Online results for 4 stimuli BCI, wet and dry setup. . . . . . . . . . . . . 25
2.5 Online results for 8 stimuli BCI, wet and dry setup. . . . . . . . . . . . . 25
3.1 Comparison between different electrode placement . . . . . . . . . . . . . 32
3.2 Relation between the subject speed and the frequency of the movementartifacts. The growing trend suggests a correlation between the two mea-sures. . . . . . . . . . . . . . . . . . . . . . . . . . . . . . . . . . . . . . . 35
4.1 Experimental results. For each subject results of three trials are reported. 42
xii

Abbreviations
ADC Analog-to-Digital Converter
AFE Analog Front End
ANN Artificial Neural Network
AR Augmanted Reality
ASL Amyotrophic Lateral Sclerosis
BCI Brain Computer Interface
BMI Brain Machine Interface
CCA Canonical Correlation Analysis
CPS Cyber Physical System
DSP Digital Signal Processing
ECoG ElectroCorticoGraphy
EEG ElectroEncephaloGraphy
EMG ElectroMyoGram
EOG ElectroOculoGraphy
fMRI functional Magnetic Resonance Imaging
FFT Fast Fourier Transform
FPU Floating Point Unit
FTA Frequency Tagging Analysis
HCI Human Computer Interface
HMI Human Machine Interface
HMD Head-Mounted Display
GUI Graphic User Interface
GPS Global Positioning System
IEEG Intracranial EEG
IDE Integrated Development Environment
xiii

Abbreviations xiv
IoT Internet of Things
ITR Information Transfer Rate
LBS Location-Based Service
LDA Linear Discriminant Analysis
LED Light Emitting Diode
MEG MagnetoEncephaloGraphy
MFD Matched Filter Detector
PCA Principal Component Analysis
PCB Printed Circuit Board
PLI Power Line Interference
PSD Power Spectral Density Analysis
RFID Radio Frequency IDentification
SCP Slow Cortical Potential
SPI Serial Peripheral Interface
SVD Singular Value Decomposition
SVM Support Vector Machine
SSVEP Steady State VEP
TRCA Task Related Component Analysis
TVEP Transient VEP
SNR Signal-to-Noise Ratio
UWB Ultra Wide Band
VEP Visual Evoked Potential

To my family.
xv

Chapter 1
Introduction
Interaction with machines and electronic systems has become more and more fre-
quent and well-established since the third industrial revolution, often referred to as
digital revolution, starting from the second half of the 20th century. During this time,
the adoption and proliferation of digital computers marked the beginning of the In-
formation Age, which still continues to the present days. To control those electronic
systems several paradigms of Human Machine Interactions (HMIs) have been developed
during the years, starting from the keyboard based command line, to the more recent
vocal interface, passing through Graphic User Interfaces (GUIs) and touch screen. The
fourth industrial revolution, started in the beginning of the 21st century, pushed the
capabilities of electronic systems even farther thanks to the miniaturization of powerful
and power efficient computational and communication units. The ability of decentral-
ize computation near sensor and the empowered communication are key factors for the
rise of technologies such as Internet of Things (IoT), Cyber Physical Systems (CPSs)
and cloud computing. In industry, the exploitation of these new technologies is generi-
cally called Industry 4.0, where benefits are achieved through CPSs that create virtual
representation of the physical production processes and are able to take autonomous
decentralized decisions or communicate and cooperate with each other at both internal
and inter-company level.
The digital revolution reflects in the mass market with products like smartphones,
smartwatches, wristbands and any kind of wearable device capable of short range or
long range communication. Along with new devices development, also new and smarter
HMI paradigms have been devised that exploit the device internal sensors to detect
user commands (e.g. step counter for smartphones, or wrist rotation for smartwatches).
Other devices exploit biosignals for user interaction like Myo Armband [2], which is
able to sense Electromyogram (EMG) of the forearm muscles and translates the signal
1

Introduction 2
into commands. Brain Computer Interfaces (BCIs), also known as Brain Machine Inter-
faces (BMIs), are a particular type of HMIs that exploit brain activity signals acquired
via Electroencephalography (EEG). BCIs were first developed to support people with
disabilities in their interaction with the external world, with one of the first successful
examples being BCI spellers. Recent years have seen BCI applications reach out to a
larger set of scenarios, such as industry, gaming, learning, healthcare [3] and rehabilita-
tion [4]. Several tech companies developing consumer-oriented products (Google, Apple,
Facebook, etc.) have also become active in this field [5–7], with the vision of being able
to substitute traditional HMIs based on conventional computer input devices, gesture
and voice recognition, touch-screen interaction [2, 8, 9], with the possibility to directly
interact and control computers with our brain.
Bringing this fascinating idea into life will be a tremendous boost towards integrat-
ing actions and interactions with objects in a fully-connected IoT scenario. Applications
can range from verifying whether a worker is attending a specific task or effectively re-
ceiving a communication for safety purposes, to remotely control devices in industrial
or home environments, to navigating menus in shops or restaurants, to gaming. These
applications have different requirements as compared to traditional BCI spellers. On
the one hand, they mostly require less symbols to be recognized with respect to a full
speller, on the other hand they need system latencies to be minimized, both in setup
time and real-time performance. However, traditional BCI systems suffer from a certain
complexity, cost and size, which can only be reduced by moving processing to an exter-
nal hardware, compromising portability and ease-of-use.
The foundation of every BCI system lies in the acquisition of signals that relates
to brain activity. Among the available techniques to extract such information, EEG is
considered as the ideal (if not the only) candidate for consumer applications and has
enjoyed significant improvements in recent years. What was once possible only through
expensive and cumbersome devices, it is now available on the market in cheap and rela-
tively attractive form-factors. Most of them are conceived for gaming and entertainment
or leisure, like MindMaze Mask [10], Neurosky MindWave [11], and Emotiv Insight and
EPOC+ [12]. Not all these systems can acquire EEG with the same signal quality and
setup complexity (i.e. number and type of electrodes), resulting in different BCI ease-
of-use and performance. Moreover, these consumer products are conceived to be more a
toy that identifies mood, focus, meditation, or facial expression of the user, rather than
an actual machine communication tool. Only few commercial products are designed for
custom BCI application development, OpenBCI [13] for example offers an open source
platform for biosignals (mainly EEG) acquisition and streaming, while g.tec Intendix
[14] provides a full PC based BCI speller. A common drawback of these systems is that
they require a continuous data-link between on-body sensors and mobile phones/tablets,
or laptop computers and workstations. This impairs some important features such as

Brain Computer Interface 3
wearability and minimal intrusiveness, increasing overall system cost as well. More-
over, it causes a severe reduction of the energy efficiency of the whole system [15–17]
as it requires transmission of non-negligible amounts of data. To avoid these issues, the
digital processing should be moved near-sensor, executing algorithms directly on the
wearable device [18, 19]. Such solutions are not readily available, both in commercial
systems and research literature. The focus of this work is to build and validate a BCI
system that fulfill desirable features such as wearability, power efficiency, fast setup,
stand-alone, fast responsiveness. The next section depicts in more detail what are the
original contribution of this thesis.
1.1 Thesis contribution
In an effort to provide a BCI system better tailored for the new scenarios that are
envisioned for the near future, this work proposes three major contributions. The first
one is the design and implementation of an embedded, minimally invasive, low-power,
low-cost, asynchronous BCI speller, able to recognize up to eight different stimuli with
an information transfer rate (ITR) of more than 1 b/s with zero-preparation time thanks
to the usage of dry electrodes. This is comparable with state-of-the-art non-wearable
systems (where signal processing is computed on external hardware), thanks to careful
optimization of the processing and pre-processing algorithms, which are specifically tai-
lored on the proposed system configuration. The second contribution is the assessment
of the wearable BCI in a task that implies user navigation, binding the EEG response
with the position of the subject, in order to understand the challenges of the acquisition
of EEG signals (artifacts, external noise and hardware constrains) in real environments,
and to study the correlations between the brain activity and the subject’s location or
movements. The final contribution is the enhancement of the proposed wearable BCI
system with a Head-Mounted Display (HMD) that provides visual stimuli through Aug-
mented Reality techniques (AR), achieving 80% accuracy with average latency of 3
seconds and allowing for a fully wearable fast and reliable BCI system. The structure
of this thesis will follow the order of the three main contributions stated above.

Chapter 2
Brain Computer Interface
2.1 Overview
Brain Computer Interfaces (BCIs) are hardware-software systems that enables hu-
man machine communication without need of muscles or peripheral nerves, exploiting
exclusively electroencephalographic activity (EEG) as control signals [20]. BCI systems
are typically composed by a signal acquisition headset and a signal processing device,
and optionally feature an input stimuli presentation system and an output display or
actuator. BCI systems recognize patterns in EEG signal following five stages: sig-
nal acquisition, signal enhancement or preprocessing, features extraction, classification,
control interface [21]. The underlying implementation of the five stages are driven by
design goals including target application and users, form factor, type of brain activity
leveraged, and desired target performance.
Decoding brain signal is a very challenging task. In fact, the control signal is cap-
tured together with other signals from other brain activities that may overlap in time and
space. Further noise can be added by artifacts due to muscular and ocular movements,
generating a different type of signal measurable by techniques such as electromyography
(EMG) and electroculography (EOG). Both EMG and EOG signals are present in some
areas of the head where EEG is also observable, interfering with EEG acquisition. In
addition, the amplitude of the EEG signal can be more or less diminished according to
the type of acquisition system adopted. In invasive BCI systems, microelectrode arrays
are physically implanted in the cerebral cortex, the implant requires brain surgery and
is therefore prerogative of very specific experimental medical settings. This technique
is called electrocorticography (ECoG), and compared to EEG it provides better SNR,
since it avoids artifacts like eye blinking or movements and it is more spatially accurate
since the electrodes are physically attached to the signal source area. On the other hand,
4
Brain Computer Interface 5
non-invasive BCI systems use removable electrodes applied on the scalp, where the EEG
signal is diminished and spread on a wider area, resulting in more noisy and overlapping
signals, but at the same time providing a more appealing setup for non-medical scenar-
ios, allowing BCIs to steer towards consumer market for everyday use. A more detailed
taxonomy of existing BCI systems is illustrated in Sec 2.3.
BCI systems also differ with respect to the type of control signals they work with.
Modern BCI systems rely on five different types of brain activity: Slow Cortical Poten-
tials (SCPs), neuronal action potentials, sensorymotor rhythms, P300 evoked potentials,
and Visual Evoked Potentials (VEPs) [1, 22]. SCPs are slow voltage changes that occur
in cortex and can last from 0.5 s to 10 s. Positive SCPs are associated to decreased ac-
tivity in neurons, while negative SCPs are associated with neuronal activity. It has been
shown by [23–25] that properly trained people can control their SCPs, and therefore it
is possible for them to control cursor movement on a computer screen. Neuronal action
potentials are measured in an invasive way, using cone electrodes inserted in the mo-
tor cortex. The electrodes sense the single cortical neuron-induced potential, however,
unlike SCPs, these potential are more difficult to control and the need for continu-
ous medication has hindered the popularity of this technique. Sensorymotor rhythms
are a combination of mu and beta rhythms (see Sec. 2.2.1) and are associated with
motor imagery, without any actual movement [26]. Once again, user training is neces-
sary to emphasize kinesthetic experiences rather than the visual representation of the
movements [1]. P300 evoked potentials are potential peaks found in an EEG related
to infrequent stimuli of visual, auditory or somatosensory type. The peak is measured
around 300 ms after the infrequent stimulus onset, and its amplitude grows inversely
with the frequency of the stimulus. P300 has been widely used for both medical and
non-medical BCI systems thanks to its relatively fast outcome and because it does not
need any user training. Typical P300-based BCI applications are spellers, where letters
and symbols are presented to the user in a matrix form and sequentially highlighted.
The specific highlighting sequence may affect the BCI performance and it is part of its
design. Typically, P300-based BCIs use the average of several trials of the infrequent
stimulus in order to increase accuracy. VEPs are electrical potentials evoked in the
visual cortex by visual stimuli, similarly to visual P300. The difference between visual
P300 and VEP is that while P300 is evoked by an infrequent and possibly unpredictable
stimulus, VEP is evoked by periodic repetitions of the same stimulus. VEPs can be
divided into Transient VEPs (TVEPs) and Steady State VEPs (SSVEPs), where the
discriminating factor is the frequency of the repetition. According to [27], TVEPs are
bounded to frequencies lower than 4 Hz, while [28] reduces the threshold frequency to
2 Hz. However, the two authors agree in setting at 6 Hz the lower bound for SSVEPs
frequency. From the neurological point of view, TVEPs show a resting phase between
two consecutive repetitions, while SSVEPs are overlapped. In practice, the detection of

Brain Computer Interface 6
TVEPs and SSVEPs requires the same kind of processing, and the two techniques can
be basically considered as one. VEPs, together with P300, are the most used techniques
for medical and non-medical BCIs. Like P300, VEP requires no training, but it has
been shown to be faster [29]. As a drawback, the signal is usually very noisy, since its
acquisition is performed in a non-invasive fashion, and the amplitude and phase of the
VEP is very sensitive to stimulus parameters such as frequency and contrast.
The lack of a common evaluation framework for BCI systems caused the adoption
of heterogeneous performance metrics. In literature, it is possible to find assessment of
BCIs made on different metrics, usually reflecting the particular BCI application metric.
As a result, it is sometimes hard, or even impossible, to compare BCIs performance to
each other if different metrics have been used. In a review of the performance assessment
for medical BCI systems, [30] shows that the most used metrics are accuracy, accuracy
combined with information transfer rate (ITR), and ITR alone. ITR is a measure that
estimate the quantity of useful information transferred from brain to machine, in terms
of bits per second (b/s). ITR computation takes into account the number of possible
inputs, the accuracy and the latency of the system. Such metric is generic and suitable
for any BCI with a finite set of inputs (e.g. speller), but is not applicable for example
in BCIs using sensorymotor rhythms to move a cursor on a screen. It is also under-
standable that in medical BCI applications the focus is on the sole accuracy, since users
do not have any other mean of communication. On the contrary, in non-medical BCI
applications the latency (i.e. the time needed by the machine to detect which input the
user is trying to activate) plays a critical role for the system’s acceptance by able-bodied
users.
In this work, the goal is to explore the capabilities and to assess the performance
of plug-and-play portable BCI systems for non-medical scenarios. Therefore, the focus
will be on embedded wearable non-invasive systems adopting VEPs as control signals
(in particular SSVEPs), and ITR as metric for performance assessment.
2.2 EEG signal
2.2.1 Signal Description
EEG measures the electric brain activity caused by electric currents that flow within
the neurons of the brain. Neurons are the cells that constitute the brain tissues and
their structure is depicted in Fig. 2.1. Despite the apparent simplicity of the neural
cell structure, the biophysics of neural current flow relies on complex models of ionic
current generation and conduction. Basically, when a neuron is excited by other neurons
through burst of action potentials (APs), excitatory postsynaptic potentials (EPSPs) are

Brain Computer Interface 7
Figure 2.1: Structure of a neuron (source: Wikimedia commons). The cell body (a)contains the cell nucleus and acts as the cell’s life support center. The cell body gathersand aggregates the signals arriving from other cells though dendrites (b). The axon (c)allows the neuron to spread the signal away from the cell body to other neurons. Theinformation is constituted by a neural impulse (d), flowing from the cell body to theperipheral synaptic terminals (e), that in turn communicate with another neuron.
generated at its aptic dendritic branches. The dendritic membrane becomes depolarized
and extracellularly electronegative with respect to the cell body. This potential differ-
ence causes a current, called primary current, to flow from the nonexcited membrane
of the body to the dendritic tree sustaining the EPSPs [31]. The principle of conser-
vation of electric charges imposes that the flow is looped with extracellular currents,
called secondary current. Primary and secondary current both contribute to generate
the magnetic field measured by the electrodes on the scalp; however, the spatial cell
arrangement is critical for the superposition neural currents in order to produce mea-
surable fields. In fact, the measured EEG signal is the result of the current generated
by the EPSPs of thousands of synchronously activated neurons, because of the coher-
ent distribution of their large dendritic trunks locally oriented in parallel, and pointing
perpendicularly to the cortical surface [31]. The signal must cross several layer before
reaching the electrodes places on the scalp, especially the skull, which attenuates the
signal approximately one hundred times more than the soft layers [32]. Noise within the
brain and over the scalp contribute to lower the SNR, and therefore only large amount
of active neurons can generate enough potential to be recorded by scalp electrodes [32].
Brain Computer Interface 8
Figure 2.2: (a) Picture of the g.SAHARA dry electrode with custom amplifier PCB.(b) Electrical schematics of the custom amplifier PCB.
2.2.2 Signal Acquisition
EEG signal acquisition is an easy and non-invasive operation that allowed great
spread of this technique over others (MEG, fMRI, ECoG). In fact, to acquire EEG
signal it is sufficient to measure a set of electric potential differences between pairs
of electrodes attached on the skin. However, detecting EEG activity is not a trivial
task, since sensors and circuitry must cope with non-stable skin-electrode interface as
well as with an intrinsically high-noise signal. Apart from brain activity unrelated to
the SSVEP, additional sources of noise can come from acquisition system like electrical
noise and external interference. The most common source of EEG signal degradation
is the finite contact impedance at the interface between the electrode and the skin. A
high value of contact impedance leads to a potential divider effect at the amplifier input,
which causes a reduction of the capability to reject common-mode noise such as that
from mains, increases the noise generated at the metal-skin interface and augments the
effect of interference coupling through capacitive effects to the cables, or artifacts due to
cable movement, microphony and piezoelectric effect. Contact impedance is minimized
in clinical EEG protocols by removing superficial skin layers by abrasion and inserting
a conductive gel or paste in-between the two surfaces. Skin preparation is obviously not
suitable for non-clinical settings where system setup needs to be as quick and easy as
possible for an untrained person, and associated infection risks are not acceptable.
To minimize setup time and allow self-positioning of the system, zero-preparation
electrodes were adopted as interface between the system and the subject. Two options
were evaluated, dry and wet electrodes. Dry electrodes are recognized as the best option
for zero-preparation time. However, they present contact impedance up to 3 orders of
magnitude higher than wet electrodes with skin preparation; hence, to mitigate such
high contact impedance, an amplification stage is placed directly right on the electrode.
Fig. 2.2 (a) and (b) show, respectively, a picture and the schematic of the active
sensor custom PCB designed for this work. As single-ended amplification stages with
gain higher than one reduce the rejection of common mode noise, only signal buffering
Brain Computer Interface 9
is performed on the active electrode by a low-power, low-noise, rail-to-rail Operational
Amplifier (O.A.) connected as a unity-gain buffer. Protection resistors with 68 KΩ
are used to limit patient auxiliary current in cases of single fault condition below the
applicable limit of 50 µA. The O.A. is an AD8603 from Analog Devices, which has a
quiescent current of 50 µA and low voltage noise (2.3 µV peak-to-peak in the 0.1 to 10
Hz band and 25 nV/√Hz at 1 KHz). The input leakage current is below 1 pA at room
temperature, while total input capacitance is below 5 pF, which translates into an input
impedance in excess of 500 MΩ in the EEG band. In Sec. 2.7.2, the system performance
is evaluated either with wet passive electrodes (Kendall from Covidien-Medtronic [33])
and dry active electrodes (g.SAHARA from g.tec Gmbh [34]).
2.3 Taxonomy
State of the art of BCIs includes heterogeneous systems, that differ for target au-
dience, application and design choices. A taxonomy of the existing BCIs could help
to understand which kinds of devices have been developed so far. Traditionally, BCIs
feature three main characteristics: independent vs dependent, invasive vs non-invasive,
exogenous vs endogenous [1]. An independent BCI is a system that does not depend on
peripheral nerves or muscles, which means that the brain activity necessary for control-
ling the BCI does not need the activity from such brain peripherals (in this case, the
optic nerve is considered brain core). Examples of independent BCIs are all P300-based
BCIs where the stimuli are presented one at a time. In this case, the user gaze is fixed at
the single stimulus source, and the user intention is what actually triggers the BCI. In-
dependent BCIs are often used in medical scenarios, because they are especially suitable
for people suffering from severe neuromuscolar disabilities. In contrast to independent
BCIs, dependent BCIs need the activity of brain’s peripherals for the brain to generate
the required activity. Examples of dependent BCIs are P300-based BCIs where symbols
are displayed in a matrix fashion, or SSVEP-based BCIs, where all the symbols must
appear to the user at the same time. In these cases in fact, it is the user’s gaze that
determines the required brain activity. Dependent BCIs can also be used by disabled
people to some extent. For example, the aforementioned dependent BCIs can be used by
people affected by Amyotrophic lateral sclerosis (ASL), as long as they can move their
eyes. However, dependent BCIs are overall more suitable for able-bodied users.
Invasive BCIs are those systems that require implanting electrodes into the users’
brain. This practice requires brain surgery and may affect patients’ health, and it is per-
formed for research purpose only in medical scenarios. The technique used for invasive
BCIs is called electrocortography (ECoG), also known as Intracranial EEG (IEEG) [1].
ECoG allows for better SNR and better spatial resolution than EEG; however, due to
Brain Computer Interface 10
Figure 2.3: BCI taxonomy proposed by [1]. The work proposed in this thesis belongsto the Visual Evoked category: the aim is to design a dependent, exogenous and non-invasive BCI.
its unpractical and risky application this technique is not likely to spread outside clinics
and research field in a near future. Non-invasive BCI systems use electrodes placed on
the scalp to acquire the EEG signal, resulting in more convenient, safe and inexpensive
application. Electrodes are typically placed on a wearable cap or headband, and can be
easily put on and off. Wet electrodes need some skin preparation beforehand that can
take up to one hour according to the number of electrodes in use. On the contrary, dry
electrodes can be put on in a plug-and-play fashion, with no skin preparation, reducing
the setup time to a matter of seconds.
Exogenous BCIs are those that systems exploit external stimuli in order to evoke
the brain activity necessary for interaction with the machine. Examples of exogenous
BCIs are those based on P300 and SSVEP potentials, and they are more suitable for
plug-and-play systems since they do not require any user training. Endogenous BCIs
do not rely on external stimuli, and the BCI control signals are based mainly on brain
rhythms and other potential. Endogenous systems allow to interact with the BCI in a
more natural manner, through user’s intent. However, the user must learn to produce
the specific patters that are decoded by the system, and the patterns can be meaningless
encoding of BCI actions. For example, in a sensorymotor BCI the intent of moving the
left arm can be mapped into a command for a household appliance. User training for
endogenous BCIs is done via neurofeedback display, where the user can see how the BCI
input changes according to his/her brain activity, and therefore learn how to control
it. The length of the training depends on the subject, the application and the training
strategy. Figure 2.3 shows the high level taxonomy proposed in [1]. One of the goals

Brain Computer Interface 11
of this thesis is the assessment of wearable, low power, fast, plug-and-play BCI systems
that can be used daily in non-medical scenarios, and therefore, in the reminder of this
chapter, the focus will be on dependent, exogenous and non-invasive systems based on
SSVEPs.
2.4 State of the Art
Table 2.1: Comparison between state-of-the-art BCI Systems in terms of setups and ITR.
Ref. Stimulustype
Phasesynch.
Signalproc.
Synch/Asynch
Acq.system
Training Electrodestype
N Elec-trodes
Processingplatform
Classifier ITR
[35] SSVEP yes TRCA synch Synamps2 yes wet 9 PC n/a 5.42
[36] SSVEP yes CCA synch Synamps2 yes wet 9 PC n/a 4.50
[37] SSVEP no CCA synch Synamps2 no wet 9 PC n/a 1.75
[38] SSVEP no MFD synch Quickamp no n/a 1 PC max 0.83
[39] c-VEP yes CCA synch g.USBamp yes dry 16 PC threshold 0.76
[40] SSVEP no CCA asynch custom no wet up to 16 PC confidenceindicator
0.72
[41] SSVEP no PCA asynch g.tec no wet 6 PC threshold 0.63
[42] SSVEP no FFT synch NeuroSky n/a n/a 2 tablet max 0.56
[43] SSVEP no PSDA synch custom no wet 2 PC max 0.46
[44] SSVEP no FFT synch BlackrockCerebus
no dry 1 PC threshold 0.44
[45] SSVEP no PSDA synch custom no wet 3 phone max 0.40CCA dry 0.44
noncontact 0.24
[46] SSVEP no CCA asynch custom no dry 3 wearable threshold 1.06
After a brief story of BCIs development, this section reviews the current state of the
art on BCIs focusing on dependent, exogenous, non-invasive systems, based on SSVEPs
or more generally VEPs potentials. Table 2.1 shows a comparison of such systems in
terms of setup and ITR.
The first BCI spellers were introduced at the end of the 80s and exploited a cerebral
reaction called Event-Related Potential (ERP), consisting in very small responses to
specific events or sensory stimuli, which can be detected by acquiring and processing
the EEG signal on the scalp of the subject [47]. In particular, P300 is an ERP, which is
elicited by a relevant stimuli (i.e. the flashing of the intended symbol), which is infre-
quently presented among non-relevant ones (i.e. the other available symbols). In [48],
researchers presented a BCI capable of detecting 36 different target stimuli associated
with the letters of the alphabet and some symbols. By repeatedly flashing entire rows
or columns of a matrix constructed with the target characters, the authors capture the
attended symbol as the intersection of the row and column that elicited the P300 re-
sponse. This first approach to P300 BCI led to an overall performance of 2.3 characters
per minute with 95% accuracy, which translates to an ITR of 0.17 bits per second.
Similar attempts were introduced later by [49] and [50], where the original Farwell
Brain Computer Interface 12
and Donchin’s system is enhanced with regard to the computing platform or the pro-
cessing algorithm, resulting in ITR improvements up to respectively 0.45 and 0.40 b/s.
While less than half bit per second might be an acceptable transfer rate for disabled
people, it is still quite a slow communication speed to be tolerated by able-bodied sub-
jects, which most likely will refuse to adopt such system. Steady State Visual Evoked
Potential (SSVEP) is another BCI paradigm that has been used in more recent works
with considerable success [35–38]. This potential is elicited in the primary visual cortex
as a result of repetitive external visual stimulation, and is therefore phase and frequency
locked with it. Processing requires identifying the frequency (and possibly the phase)
of the SSVEP signal to determine which stimuli evoked it. The SSVEP paradigm is
attractive due to its higher signal-to-noise ratio (SNR) in comparison with ERPs, being
significantly more immune to eye-related and electrode shifting artifacts when a proper
frequency band is used [29].
SSVEPs relying only on frequency information have two major advantages with re-
spect to mixed phase/frequency SSVEP and ERPs. The first one is that they do not
require synchronization between stimuli and detection platform. This allows to mini-
mize setup time since it considers stimulation and acquisition/processing as stand-alone
systems. Such solution simplifies SSVEP use in IoT environments where the user might
need to interact with several different stimuli presentation systems, which might not be
on the same network or might not be connected at all [51]. The second advantage is that
they can operate directly without the need for a training phase in which the BCI adapts
to the specific user. As this training is often a function of the specific session setup
(including exact electrode position and contact quality), in many cases it must be peri-
odically repeated [52], severely hampering the plug-and-play features of such a device.
Nevertheless, many works still rely on both frequency and phase, significantly reducing
the advantages of such techniques and focusing only on maximizing ITR [53]. This work
demonstrates that practical ITR can be achieved with ”frequency only” SSVEP [46].
Basic feature extraction for SSVEP can be performed using simple techniques. An
early example is found in [54], where the authors designed and implemented a BCI to
help users to input phone numbers based almost entirely on FFT-based Power Spectral
Density Analysis (PSDA). Some studies later combined FFT-based features with more
advanced classification algorithms such as Linear Discriminant Analysis (LDA) [55],
Support Vector Machine (SVM) or Artificial Neural Networks (ANNs) [56] to improve
performance. Nevertheless, these systems are relatively slow, with ITR of 0.56 and 0.44
b/s, respectively.
Other systems employ different signal processing techniques like PSDA [43, 45], PCA
[41] and Matched Filter Detector (MFD) [38]. Chi et al. [45] and Garcia et al. [43]
developed a BCI based on custom acquisition systems. The former uses LED matrices
for stimuli presentation, while the latter focuses on assessing the performance of three
Brain Computer Interface 13
types of electrodes: wet, dry and contactless. Both of them use PSDA for features
extraction, achieving an ITR of respectively 0.44 and 0.46 b/s. Cecotti [41] proposes
an asynchronous multilevel speller grouping letters within three stimuli, meaning that
for each letter selection the BCI must correctly perform SSVEP detection three times.
Feature extraction is performed using PCA, and the ITR is 0.63 b/s. Chang et al. [38]
analyzed SSVEP response with a MFD, which consists of a bank of matched filters,
followed by an amplitude detector. The authors managed to remotely control a wheel
robot, achieving an ITR of 0.83 b/s using only one electrode.
Such systems have the common drawback of low ITR. To tackle this issue, a well
accepted solution is represented by the use of Canonical Correlation Analysis (CCA).
Developed by Hotelling [57] and first introduced by Lin et al. in the BCI context, it
explores the relationship of two multivariate sets of variables, determining if they have
some underlying correlation [58]. Lin et al. [58] employed CCA to extract the cor-
relation features from nine frequency-coded simulations from multiple EEG channels,
demonstrating that ITR can be improved with respect to FFT-based methods. Authors
in [59] have also confirmed that CCA outperforms FFT-based methods in accuracy and
response delay. Using a joint frequency-phase modulation method to tag 40 characters
with 0.5-s-long stimuli, authors in [36] have developed a noninvasive BCI capable of
achieving an ITR of 4.50 b/s. Some attempts were made also with similar correlation
analyses, like in Nakanishi et al. [35] where a high speed SSVEP brain speller uses Task
Related Component Analysis (TRCA), a spatial filtering in which weight coefficients
are optimized to maximize the covariance of time-locked SSVEP trials. The authors
achieved 5.42 b/s ITR using 9 channels and 40 phase-locked flickering targets. Another
powerful method for direct frequency estimation, described in [60, 61], is based on the
Vandermonde decomposition. Although this solution provides a direct frequency estima-
tion with a short time window, its computational complexity hinders the implementation
on a resource-constrained platform because of the large dimension (> 64 × 64) of the
input matrices calculated to execute the algorithm.
The approaches cited above can reach high level of ITR, enabling a fast BCI for
SSVEP decoding. Anyway, they require a training session to adapt the setup on the
user. A solution to adapt the CCA without specific subject-dependent training is pre-
sented in [37], where authors include in the CCA the information of frequency harmonics
from 9 EEG channels, achieving an ITR of 1.75 b/s using 42 different frequency-coded
stimuli. Nevertheless, all the aforementioned solutions require a synchronization mecha-
nism between stimuli and acquisition phases. Moreover, to maximize accuracy and ITR,
EEG acquisition systems rely on 9 wet electrodes, which limit ease-of-use and unob-
trusiveness, hindering the deployment of such solutions in wearable, minimally invasive
form-factor.
The work presented in [40] represents a step forward in the development of a CCA

Brain Computer Interface 14
based system, since it is based on non-synchronized stimuli presentation and it does not
require subject-dependent training. However, it achieve an ITR lower than 1 b/s, with
a bulky setup, based on 16 wet EEG electrodes.
The lesson learned from the analysis of the SoA in BCI speller is that the develop-
ment of a high-performance wearable platform for BCI spelling is still an open challenge.
Although some systems target a portable setup, (e.g. a tablet [42] or a smartphone [45]),
they achieve low values of ITR, in a bulky setup (i.e. many electrodes which requires
skin preparation) with power-hungry computational platforms.
Hence, the goal of this chapter is to show a design for a wearable BCI system that
relies on a minimally intrusive setup (i.e. 3 dry sensors), without subject dependent
training and stimuli synchronization, and achieving ITR higher than 1 b/s.
2.5 Canonical Correlation Analysis
The state-of-the-art algorithm for SSVEPs detection is named Canonical Correlation
Analysis (CCA) [62]. This method quantifies the linear dependency between two multidi-
mensional variables by finding a couple of linear combinations, one for each multidimen-
sional variable, that maximizes their correlation. The resulting maximized correlation is
called canonical coefficient and extends the concept of correlation to multidimensional
variables. More than that, CCA actually provides a whole set of canonical coefficients,
sorted by size. The first canonical coefficient of the set is the biggest, and represents
the correlation between a pair of linear combinations that maximizes the correlation.
The second canonical correlation coefficient is the second biggest, and represents the
correlation between another pair of linear combinations, that are uncorrelated with the
previous pair. The number of canonical correlation coefficients and corresponding linear
combination pairs depends on the dimension of the two variables, and corresponds to
the minimum of the dimension of the two variables. In SSVEP-based BCIs, the two
multidimensional variables to be correlated are the n EEG input channels, and a set of
m reference signals that identify the frequency of one single stimulus, usually sine and
cosine of that frequency and one or more harmonics. Therefore, one execution of the
CCA algorithm returns a set of size d = min(n,m) of canonical correlation coefficients
that quantify the correlation between the EEG signal window and one specific stimulus.
In order for the system to compute an output, it is necessary to retrieve canonical cor-
relation values with respect to all the reference signal sets, which means executing CCA
for each possible stimulus. Figure 2.4 summarizes the CCA algorithm and its actual
implementation on many statistical packages.

Brain Computer Interface 15
Figure 2.4: Block diagram of CCA algorithm and implementation. (a) Signal matricesinput for CCA. (b) CCA formulation algorithm. (c) CCA implementation algorithm.(d) Feature extraction.
Formally, let us define the multidimensional variable X as a time window of length
Ns samples of the n EEG input channels, such that:
X = X1, X2, ..., Xn,
Xi = xi,1, xi,2, ..., xi,Ns,
i = 1, . . . , n.
Let us define the reference signals as a set of sine and cosine of the stimulus frequency
f and its Nh harmonics, then the multidimensional variable Y is defined as follows:
Y =
Y1
Y2
Y3
Y4...
Ym−1
Ym
=
sin(2πft)
cos(2πft)
sin(4πft)
cos(4πft)...
sin(2Nhπft)
cos(2Nhπft)
for t = 1Fs, 2Fs, · · · , Ns
Fs
where Fs is the sample frequency of the EEG acquisition system. Let us define the linear
combinations of X and Y as:
U = Xa
V = Y b

Brain Computer Interface 16
Then the function to maximize is:
ρ = maxa,b
corr(Xa, Y b)
After retrieving the first canonical correlation coefficient ρ1 and the corresponding
couple of linear combination coefficient matrices a1 and b1, the algorithm continues the
search looking for a couple (a2, b2) such that the linear combinations U2 = Xa2 and
V2 = Y b2 belong to an orthogonal subspace with reference to U1 = Xa1 and V1 = Y b1.
The search continues until the orthogonal subspaces of the less ranked multidimensional
variable are exhausted, resulting in a vector of canonical coefficients
R = ρ1, ρ2, . . . , ρd
sorted in decreasing order. Quite often only the first canonical coefficient is used as
feature for frequency detection. However, authors in [63] proved that the combination
of the information held by the other coefficients helps to improve frequency detection
accuracy. In particular, the feature used for frequency detection is calculated as the
Euclidean norm of the first s canonical coefficient:
r =
√√√√ s∑i=1
ρi
In this work, the Euclidean norm of the first s = 3 canonical coefficients is used as
a feature for frequency detection. The implemented algorithm is described later in Sec.
2.6.2
2.6 Wearable BCI
The system presented is a novel embedded asynchronous BCI featuring a custom
acquisition platform and non-invasive dry electrodes for real-time classification of eight
frequency-coded stimuli. Being able to operate in stand-alone mode, it provides full
portability by removing the need for any external processing device. At the core of the
system, a CCA-based algorithm performs the feature extraction of the incoming EEG
signals from three dry electrodes. The system requires no training phase and does not
need to tailor any parameter on the specific subject or trial, as all critical parameters of
the system, such as the number of channels and location, frequency band, and window

Brain Computer Interface 17
Figure 2.5: Architectural diagram of the proposed system. Fig. 2.5 (a) and (b) show,respectively, an image and the block diagram of the wearable node. Fig. 2.5 (c) presentsan image of the dry active electrodes and (d) the electrical schematics of the customamplifier stage PCB. Finally, in Fig. 2.5 (e) the LCD screen with stimuli presentationis depicted.
lengths, are fixed through offline data analysis before the final implementation in a user-
independent fashion. An overview of the overall system is depicted in Fig. 2.5.
The wearable platform is designed for medical IoT applications and derived from [64]
and [65]. The system is composed of an active EEG sensor array interfaced to a custom
board with a biopotential ADC and a low power microcontroller with DSP capabilities.
It acquires and processes the subject response to a visual stimuli. The results of the
CCA analysis, computed in real-time on the microcontroller, can then be communicated
to the host PC as HMI commands.
2.6.1 Hardware
The proposed IoT node is based on a multichannel commercial Analog Front End
(AFE) [66] connected with a low power ARM Cortex M4 microcontroller. The AFE
is the de-facto standard used in biopotential acquisition platforms. The 8 channels are
connected in single ended configuration with the active EEG sensors while the AFE’s
back-end streams the data via SPI to the microcontroller. The ARM Cortex M4 mi-
crocontroller is equipped with a single precision FPU unit and has an instruction set
architecture with DSP extensions to enable a more efficient near-sensor processing. It
can reach operating frequency of 168 MHz with 192 kB of RAM and 1 Mb of FLASH
memory.
The board is a 6-layers Printed Circuit Board (PCB) with a single solid ground
plane. To minimize current return paths, the power planes are split, keeping separated
the analog and digital circuitry. Discrete components were carefully placed on both sides
of the PCB to maximize signal integrity, maintaining a low level of noise and a small
Brain Computer Interface 18
form-factor that results in 85x50 mm. The board mounts a dedicated IC for power man-
agement, that automatically detects the power source (battery or USB). Analog, digital
and communication subsystems are supplied by separate low-dropout voltage regula-
tors. This versatile configuration allows power management strategies, like duty-cycling
submodules, to enhance battery life.
2.6.2 Firmware implementation
All firmware has been implemented in C language on a low-power ARM CORTEX
M4 microcontroller, using STM32 WorkBench, a dedicated Integrated Development En-
vironment (IDE) based on the open-source GCC compiler version 5.4.1. The proposed
implementation of CCA is based on the Golub algorithm [67, 68], which, by virtue of
its computational efficiency, is widely used in many statistical packages [69]. The Golub
algorithm relies on the computation of two QR decompositions, followed by a SVD fac-
torization. The implemented algorithm is summarized in Fig. 2.4c.
In the implementation of the firmware, this algorithm must be executed Nf times,
once for every stimulus presented at different frequency, and its execution must be op-
timized in order to achieve near real-time performance even with several stimuli. Three
levels of optimization are applied: (i) usage of CMSIS-DSP library provided by ARM
whenever possible [70], (ii) precomputation and storage in Flash memory of the orthog-
onal matrices Qy resulting from the QR decomposition of all the reference signals, and
(iii) input filtering and downsampling. A time window of the acquired EEG signal chan-
nels constitutes the multidimensional variable X. The length Ns of the time window
is a parameter affecting the overall BCI performance, and its computation is described
later.
Before applying CCA, the input signal must be preprocessed in two steps: (i) a
band pass filter is applied for removing low frequency and 50 Hz noise, and allowing a
downsampling factor up to 10, that reflects in a speedup > 4 in CCA computation; (ii)
all the channels are reduced to zero mean in order to be later correlated with the refer-
ence signals. The band pass filter features a low pass 100 taps FIR with cutoff frequency
at 18.4 Hz, and a second order high pass IIR. The low pass FIR filter guarantees to
preserve the signal amplitude up to the first harmonic of the higher stimulus frequency,
since this system uses Nh = 1, and at the same time it achieves 60 dB attenuation at 50
Hz, without introducing excessive delay or computational effort.
After preprocessing, the resulting multidimensional variable X must be correlated
with the corresponding reference signals for each frequency used for the stimuli. The
QR decomposition is therefore computed once only, obtaining the orthogonal matrix
Qx, then the algorithm enters a loop for each stimulus frequency k, where the same Qx
Brain Computer Interface 19
matrix is multiplied by the corresponding Qy(k) matrix already precomputed and stored
in Flash memory. The resulting matrix is factorized by the SVD, where the optimized
code skips all the computation that involves elements of the matrices which zeros values.
All the coefficients of the diagonal matrix S obtained by the decomposition are used
in the computation of the Euclidean norm, which is the measure of the correlation be-
tween EEG and reference signal that is used for frequency detection. The algorithm
performance is discussed in Sec. 2.7.3.
Since this BCI system is asynchronous, independent and potentially disconnected
from the source of the stimuli, at the end of each data window processing the system
must deliver some output, regardless of actual activity of the user. The frequency clas-
sification is performed by simple thresholding: if the maximum of the Nf correlation
features exceeds the threshold, then the BCI output is the corresponding frequency,
otherwise the system output is the rest or idle state, decoded with class 0. The choice
of the threshold value will be discussed in Sec. 2.7.2.
2.7 Experiments and results
2.7.1 Experimental setup
A graphical interface of the SSVEP-based BCI system usually consists of different
areas of a screen which are associated to different commands, e.g. letters or symbols,
that flicker at specific frequencies. When the user pays attention to a particular flicker-
ing command, SSVEPs are induced at the corresponding frequency and its harmonics.
The BCI system identifies the user intention by quantifying and classifying SSVEP. It is
generally acknowledged that the SSVEP response depends on the frequency of the stim-
ulation, nevertheless there is no consensus on which frequency bands are better suited
for maximizing information transfer rate and accuracy. Regan has shown three distinct
maxima in the response to flickering stimuli at 10, 13-25 and 40-60 Hz [71]. Other sub-
sequent works showed similar results [72]. Kus et al. [73] observed how signal-to-noise
ratio of SSVEP signal vs. unrelated brain activity is maximized in the 8-20 Hz band,
however not taking into account higher order harmonics in the computation. It should
be observed that, in general, the lower the target frequencies, the lower the sampling
rate required to the system, and consequently its power consumption, which is of major
importance in portable systems.
The BCI system presented in this work is the product of an initial phase of offline
tests used to fix critical parameters, such as the number and location of electrodes, fre-
quency intervals, window length for data processing, etc. Subsequently, online tests have
been carried out to assess the real-time performance. Eight healthy subjects (aged 25-40

Brain Computer Interface 20
Figure 2.6: Acquisition setup: the flickering stimuli layouts (layout L2 in the figure,featuring four checkerboards) are presented on a 24-inches LED screen. The subjectstares at the screen from a distance of 80 cm.
years) with normal or corrected-to-normal vision participated in the offline experiments.
Another group of five subjects was taken later for the online tests. All participants re-
ported no history of neurological or psychiatric disorders and provided a written consent
to participate in the experiments.
SSVEP signals are elicited by adjusting the luminosity (contrast) of black and white
10 x 10 square checkerboards [74] on a grey background employing the sampled sinu-
soidal stimulation method [75] on three different layouts. The first layout (L1) only
contains one checkerboard covering 75 % of the screen and centered at the middle point
and is employed to display different stimuli in successive order. The second layout (L2),
comprises four checkerboards arranged in a 2 x 2 pattern at equidistant positions, each
displaying a different frequency-coded stimulus (a single checkerboard occupies 20 % of
the screen). The third layout (L3) contains eight checkerboards arranged in a 2 x 4
pattern, each one covering 10 % of the screen. The design of the layouts aims to test the
level of response of the SSVEP signals with consecutive smaller stimuli in the presence
of non-target stimuli. Fig. 2.6 depicts the acquisition setup with L2.

Brain Computer Interface 21
The luminosity (contrast) of the checkerboards was adjusted using the following
equation:
Contrast(f, φ, i) = A · sin(2πfi/Fr + φ) +A
where i indicates the frame index, A the initial amplitude, φ the initial phase,
constant for all experiments (φ=0), f the frequency of the stimulation, and Fr is the
refresh rate of the screen. All checkerboards included a grey diagonal cross to help
visual fixation. All the textures were generated using Psychtoolbox 3.0.10 for Windows
in Matlab 9.1. All the layouts were presented on a 24-inch LED (60fps) screen at a
distance of approximately 80 cm. This setup is fixed for all the subjects, in order to
measure the SSVEP elicited by the most uniform stimulation possible. Since there is no
uniformity in literature for the distance between the subject and the screen ([3, 76, 77]),
this choice is arbitrary.
EEG data were acquired using the hardware presented in section 2.6.1 at a sample
rate of 1 KHz. For the offline test, five electrodes over the occipital lobe (P5, PO3,
POZ, PO4, and P6) and two over the frontal lobe (F3 and F4) were placed to record
the SSVEPs, with reference and ground electrodes located at A1 and A2 respectively.
Online tests were performed only with three electrodes, located at P5, POZ, and P6,
while reference and ground remained at the same position. Electrodes impedance was
kept below 10KΩ. Triggers generated by the stimulation program were bound to the
incoming raw data by custom software. It is worth mentioning that all experiments were
repeated twice to evaluate the performance of the dry electrode system with respect to
a classic wet configuration.
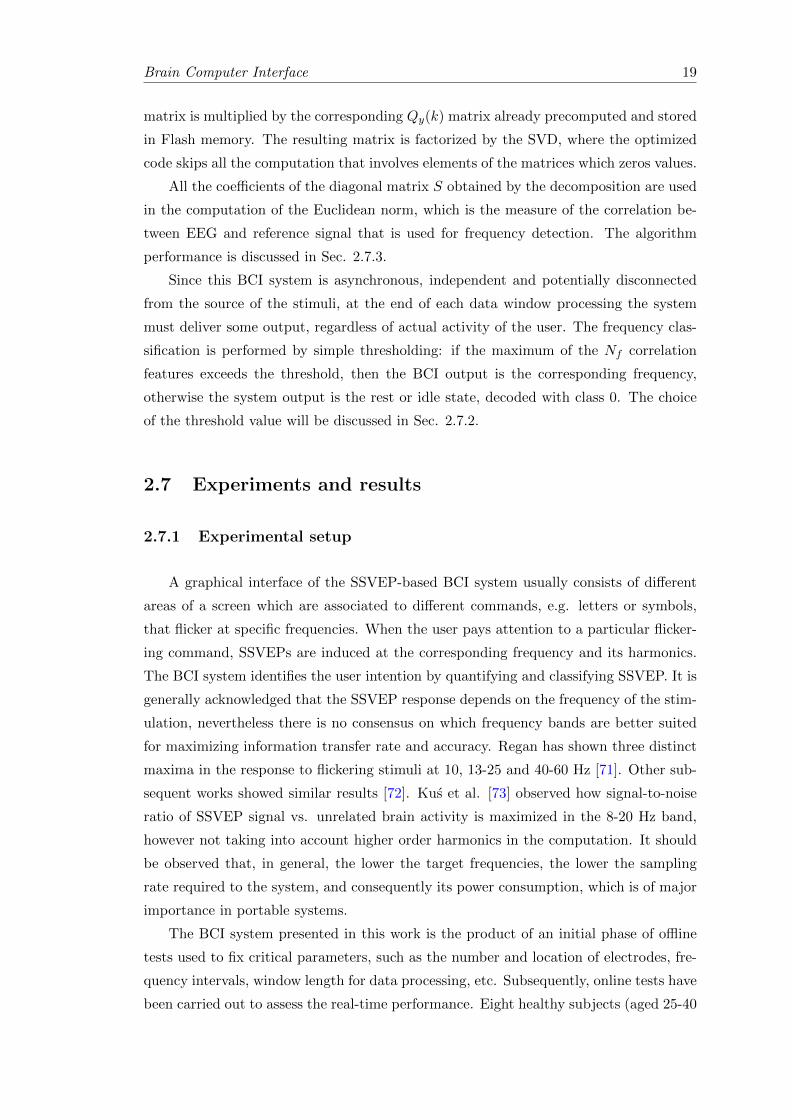
Equally spaced frequency-coded stimuli ranging from 5 Hz to 17.5 Hz, with a step of
1.2 Hz were used to select suitable frequency targets. Each trial included five seconds of
stimulation followed by 5 seconds of pause to reduce visual fatigue. The results from eight
test subjects are summarized in Fig. 2.7 showing that the range of frequencies between
5-12.2 Hz have a significantly higher average correlation magnitude. Nevertheless, the
useful range has been narrowed up to 9.5 Hz to avoid any interference from the alpha
band in the final implementation. Simultaneously, the design exploits an exhaustive
search to determine the minimum number of electrodes required, finding that there are
no significant differences in correlation when using only the electrodes P5, POz and P6
with respect to the full setup. Thus, the final system adopted these changes allowing
us to maximize the performance while reducing overall the complexity and intrusiveness
of the hardware. It is worth noticing that Fig. 2.7 only presents the results of the
wet-electrodes test since there are no significant differences when using dry electrodes.
Brain Computer Interface 22
Figure 2.7: Average CCA correlation of SSVEP responses for different stimuli (x-axes) calculated with different reference signals (y-axes). On the diagonal it is possibleto observe higher correlation due to the correspondence between the stimulus frequencyand the reference signals. Noticeably, the lower part of the stimuli spectrum allows forhigher correlation response with respect to the higher part.
2.7.2 Experimental results
The system presented at 2.6.2 was evaluated using dry and wet electrodes while
performing a new test session using L2 and L3 layouts presenting four and eight simul-
taneous stimuli, respectively. All the stimuli were coded using a ∆F = range/Nstimuli,
to allow maximum separation between targets in the frequency range. The subjects
(same as the previous test) fixed the sight at the target frequency indicated with a red
square before the onset of the stimulation. Later, all the stimuli remained active for five
seconds with a resting time of 5 seconds in between trials. The experiment ends when
the subject has been staring once at each stimulus on the screen.
An exhaustive analysis of the offline results shows that the most performing data
window length is 2 s for both wet and dry systems, which turns in Ns = 2000 samples
Brain Computer Interface 23
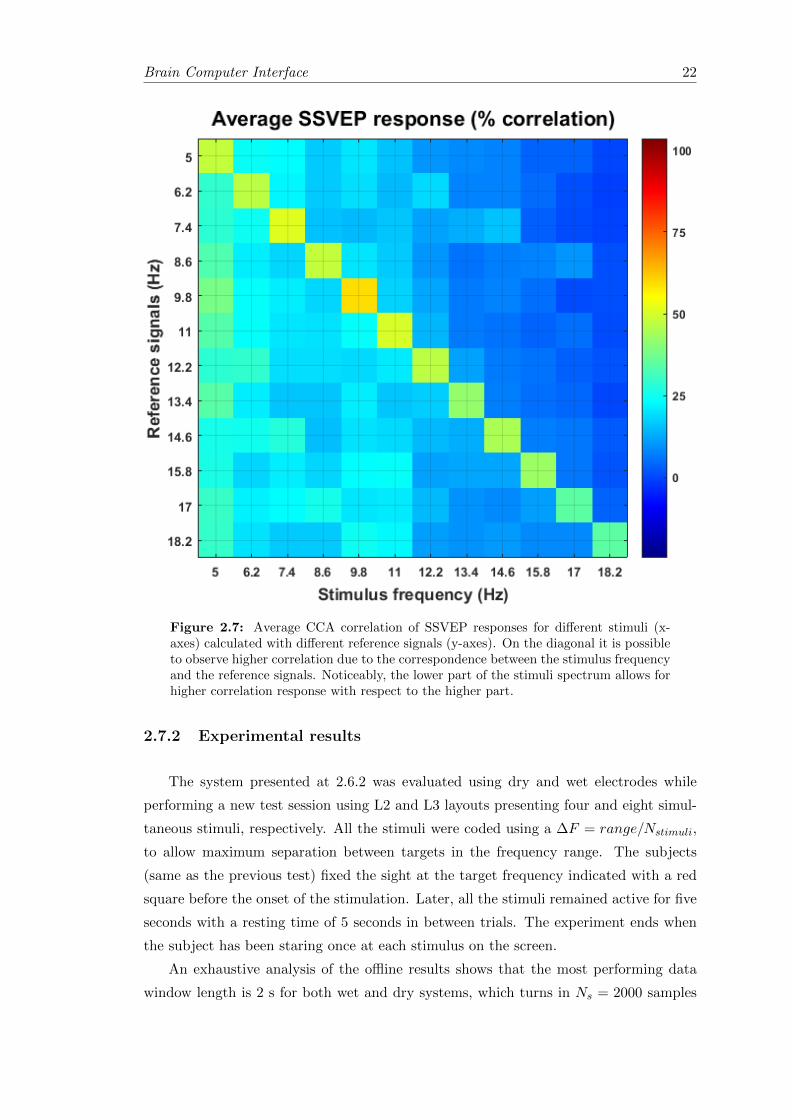
Figure 2.8: Average ITR results for the system with wet electrodes (blue triangles),and dry electrodes (red circles) calculated using different classification thresholds. Athreshold value of 0.55 is shown to maximize ITR for both wet and dry electrodes.
to process for each channel at each CCA iteration. This window size guarantees a good
trade-off between system latency (∼ 2s) and accuracy (> 90%). Even if the system is
asynchronous, offline system latency is assessed by measuring the time interval between
the stimulus onset and the first correct detection. For detailed results description refer
to tables 2.2 and 2.3. The other parameter of the system, the classification threshold, is
chosen to maximize the average ITR, calculated for the asynchronous BCIs as in [78]:
ITR =1− Pr
davg
(log2Nf + (1− Pw) log2(1− Pw) + Pw log2
(PW
Nf − 1
))
where Pr is the probability of non-detected stimuli or trial error, Pw is the prob-
ability of incorrect detected cases, Nf is the number of target stimuli, and davg is the
average delay or latency of the system in seconds. Fig. 2.8 depicts the values of the
average ITR of the wet and dry system calculated with several thresholds. The figure
shows that the threshold value of 0.55 maximizes both curves, therefore it is the most
suitable threshold value to use for the BCI output classification.
Tables 2.2 and 2.3 show the classification performance using four and eight stimuli
Brain Computer Interface 24
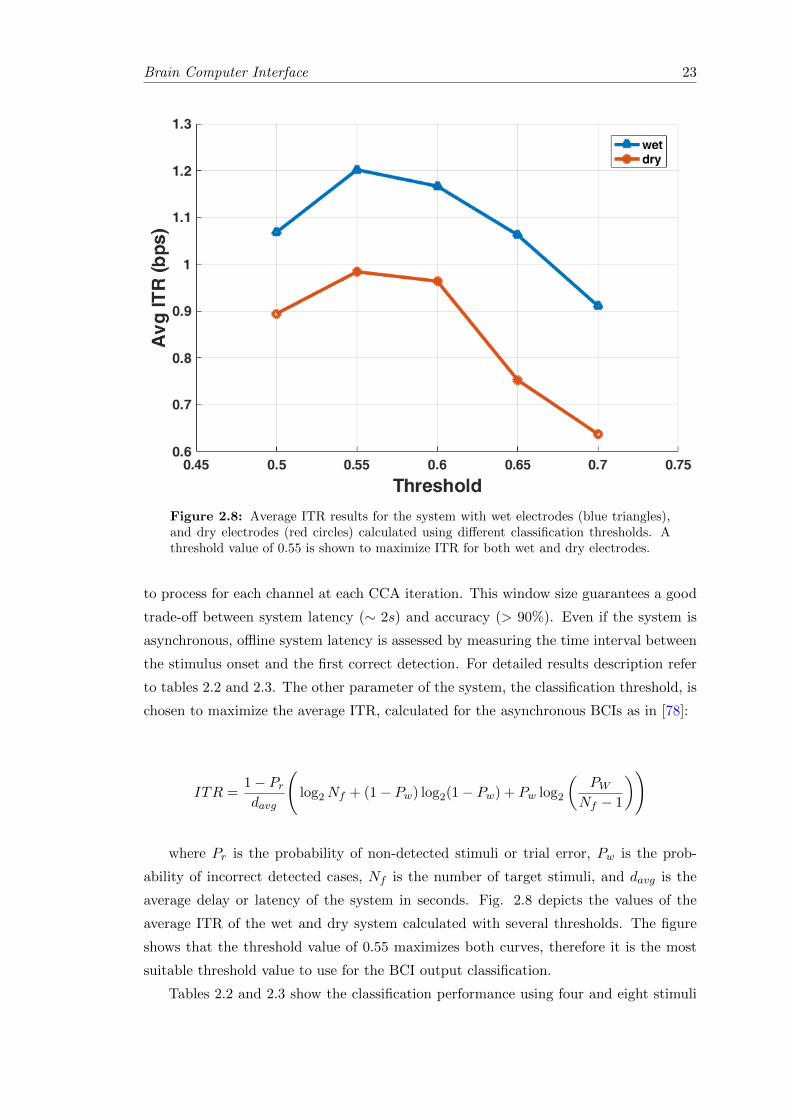
for wet and dry electrodes. Even though the average latency for the 4-stimuli wet system
is smaller than the 8-stimuli system, the latter achieves higher ITR due to the increase in
the number of targets. This situation improves when analyzing the dry systems, where
the 8-stimuli not only outperforms the 4-stimuli, it also achieves similar performance
than the wet system. These results also demonstrate that the interference created by
placing different stimuli at the same layout with decreasing target size is negligible.
Following the results introduced above, the system is validated while performing
the acquisition of the EEG data and classification in real time, employing five test sub-
jects, that have not been involved in the offline experiments. To ease the computation
of the results, the outputs of the classification are transmitted directly to a computer
using a BT communication module, automatically synchronized with the onset of the
corresponding stimulation by a custom software. During the experiments, the checker-
boards with the target frequency were indicated with a red square that appears before
the stimulation. Once a valid frequency was detected, the stimulation was stopped and
the detected frequency was highlighted and cued with a white frame. The accuracy
of the system was then asserted by the number of correct classifications over the total
number of classifications, and the latency is computed as the time needed for detection
of the trials that succeeded. The results of the experiment are summarized in tables
2.4 and 2.5, allowing us to conclude that there are no significant differences between
offline and online experiments. Also, the average ITR using eight stimuli and the dry
sensor interface is 1.25 b/s, proving that the introduced embedded implementation can
achieve performance that is comparable with non-wearable systems [37–39, 41], while
outperforming other wearable or mobile systems [40, 42, 45].
Table 2.2: Offline results for 4 stimuli BCI, wet and dry setup.
Total accuracy Trial accuracy Latency [s] ITR [b/s](wet / dry) (wet / dry) (wet / dry) (wet / dry)
S1 0.97 / 0.98 1 / 1 1.91 / 1.86 0.94 / 1.00
S2 0.96 / 0.96 1 / 0.75 1.57 / 2.41 1.07 / 0.53
S3 0.98 / 0.96 1 / 1 1.60 / 1.83 1.12 / 0.91
S4 0.95 / 0.96 1 / 0.75 2.10 / 1.91 0.79 / 0.67
S5 0.96 / 0.98 1 / 1 1.41 / 1.65 1.19 / 1.11
S6 0.99 / 0.97 1 / 1 1.33 / 1.60 1.42 / 1.09
S7 0.95 / 0.99 1 / 1 0.86 / 1.17 1.90 / 1.59
S8 0.97 / 0.98 1 / 1 1.33 / 2.00 1.32 / 0.90
Average 0.97 / 0.97 1 / 0.94 1.51 / 1.80 1.22 / 0.98

Brain Computer Interface 25
Table 2.3: Offline results for 8 stimuli BCI, wet and dry setup.
Total accuracy Trial accuracy Latency [s] ITR [b/s](wet/dry) (wet/dry) (wet/dry) (wet/dry)
S1 0.92 / 0.92 1 / 1 2.11 / 2.84 1.12 / 0.84
S2 0.93 / 0.93 1 / 1 1.43 / 1.66 1.69 / 1.48
S3 0.89 / 0.96 1 / 1 2.24 / 3.25 0.99 / 0.82
S4 0.94 / 0.92 1 / 1 1.71 / 1.87 1.46 / 1.27
S5 0.95 / 0.97 1 / 1 1.70 / 1.59 1.51 / 1.70
S6 0.98 / 0.98 0.75 / 1 2.37 / 2.17 0.90 / 1.28
S7 0.74 / 0.94 1 / 1 1.21 / 3.42 1.20 / 0.74
S8 0.92 / 0.91 1 / 1 1.53 / 1.58 1.54 / 1.48
Average 0.91 / 0.94 0.97 / 1 1.79 / 2.30 1.30 / 1.20
Table 2.4: Online results for 4 stimuli BCI, wet and dry setup.
Total accuracy Trial accuracy Latency [s] ITR [b/s](wet/dry) (wet/dry) (wet/dry) (wet/dry)
S1 0.88 / 0.87 1 / 1 0.76 / 3.01 1.69 / 0.41
S2 0.87 / 0.91 1 / 1 0.76 / 1.34 1.64 / 1.06
S3 0.91 / 0.92 1 / 1 1.44 / 2.05 1.01 / 0.72
S4 0.93 / 0.94 1 / 1 2.16 / 1.31 0.70 / 1.24
S5 0.89 / 0.92 1 / 1 1.36 / 0.99 0.96 / 1.48
Average 0.89 / 0.91 1 / 1 1.30 / 1.74 1.20 / 0.99
Table 2.5: Online results for 8 stimuli BCI, wet and dry setup.
Total accuracy Trial accuracy Latency [s] ITR [b/s](wet/dry) (wet/dry) (wet/dry) (wet/dry)
S1 0.83 / 0.83 1 / 1 2.01 / 2.52 0.92 / 0.74
S2 0.84 / 0.88 1 / 1 1.19 / 1.34 1.62 / 1.57
S3 0.89 / 0.86 1 / 1 1.18 / 1.50 1.83 / 1.36
S4 0.81 / 0.76 1 / 1 1.65 / 1.40 1.07 / 1.08
S5 0.79 / 0.83 1 / 1 1.79 / 2.02 0.94 / 0.92
Average 0.83 / 0.83 1 / 1 1.56 / 1.76 1.27 / 1.13
2.7.3 Computational results
The algorithm described in 2.6.2 was implemented on the board described in 2.6.1.
DMA transfer, clock gating and optimization of clock frequency were used to minimize
the power consumption. To speed up execution time, the code employs CMSIS [70] func-
tions when possible, and pushed compiler optimization to -O2 within those functions.
As mentioned before, the number of samples to process at each CCA iteration is 2000.
However, it is possible to downsample the data up to factor 10 for a twofold goal: reduce
power consumption and decrease the delay between two consecutive classifications. In
fact, higher BCI output frequency contributes to boost ITR and to enhance the user real
Brain Computer Interface 26
Figure 2.9: Trend of the power consumption calculated for several downsamplingfactors (blue triangles) for four stimuli.
Figure 2.10: Trend of the ITR/power consumption ratio calculated for several CCAexecution periods with wet electrodes (blue triangles) and dry electrodes (red circles).
time experience. Downsampling 10 allows to reduce MCU cycles from about 3157k to
about 768k, achieving speedup > 4 without significantly degrading the accuracy. In fact,
while ITR remains constant, Fig. 2.9 shows the decreasing curve of power consumption
according to downsampling factor.
The time needed to execute the optimized algorithm on the custom device is less than
5 ms, which allows us great liberty in the choice of the performance/power consumption

Location-Based BCI 27
trade-off. In principle, the power consumption decreases when the CCA execution period
increases, because the algorithm is execute less frequently. At the same time, also the
ITR decreases due to BCI response latency growth. Fig. 2.10 shows the trend of the ITR
over power consumption with reference to the period of the CCA execution. The curves
suggest that 100 ms is a good CCA execution period for both dry and wet systems, in
fact 100 ms period guarantees average ITR > 1b/s, power consumption of 22.4 mW for
four stimuli and 27.5 mW for eight stimuli, and ten outputs per seconds for a real-time
user experience. The power consumption was measured on the board using a source
measure unit instrument.
Chapter 3
Location-Based BCI
Geolocation is the enabling technique for a wide spectrum of Location-Based Services
(LBS) involving, for instance, navigation, transport, tourism, entertainment, healthcare
and augmented reality applications. While outdoor localization is mostly solved by
Global Positioning System (GPS) technology, indoor localization is still an open issue
due to heterogeneity of indoor environments and impracticality of a common approach
for all single cases [79]. In fact, GPS is an unreliable technology for indoor positioning,
since its signal is not strong enough to be correctly received inside buildings.
Several approaches for indoor localization have been proposed. Some of them ex-
ploit existing communication infrastructures like WiFi [80] and FM radio signals [81],
others rely on ad-hoc infrastructures like ZigBee [82], Bluetooth [83], Ultra Wide Band
(UWB) [84] and Radio Frequency Identification (RFID) [85]. Other systems do not
need any kind of specific infrastructure, since they compute the device position using
embedded sensors like magnetometer [86], accelerometer, and gyroscope. Furthermore,
several hybrid approaches have been proposed, based on complementary technologies
like inertial sensors and WiFi [87] or Bluetooth and WiFi [88]. Merging geolocation
with EEG monitoring can serve as a tool to understand the brain activity during daily
tasks, empowering the efficiency of future BCI systems in interpreting the user’s inten-
tions and functional state of mind. However, only few contributions proposed a system
that combines the two information sources. In [89], the authors propose a BCI system
for controlling a wheelchair, based on the P300 evoked potential and triggered though
the oddball paradigm technique. The authors achieved geolocation implementing an
optical-based tracking system on the wheelchair. In [90], the author proposes a cloud
based solution for patients localization and monitoring in terms of voice pathology de-
tection. In this solution, EEG signal is acquired through a deeply embedded system
attached to the outer surface of the patients’ vocal fold, while localization is performed
via GPS and WiFi.
28
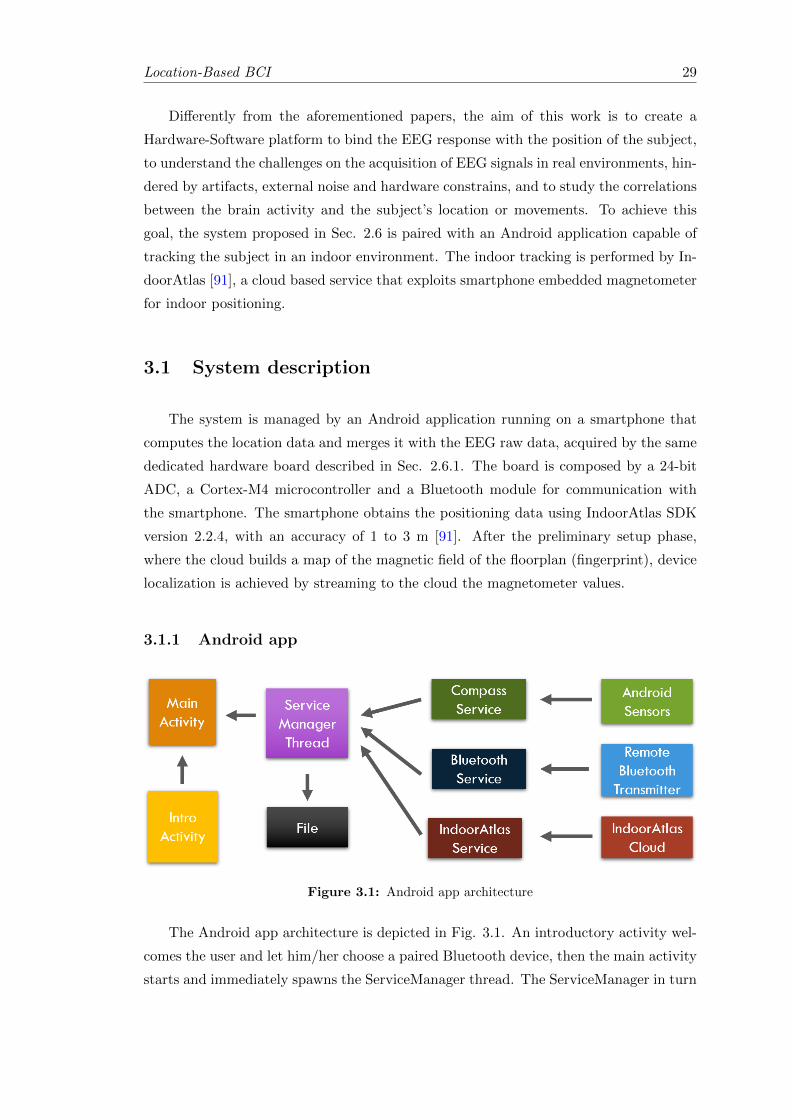
Location-Based BCI 29
Differently from the aforementioned papers, the aim of this work is to create a
Hardware-Software platform to bind the EEG response with the position of the subject,
to understand the challenges on the acquisition of EEG signals in real environments, hin-
dered by artifacts, external noise and hardware constrains, and to study the correlations
between the brain activity and the subject’s location or movements. To achieve this
goal, the system proposed in Sec. 2.6 is paired with an Android application capable of
tracking the subject in an indoor environment. The indoor tracking is performed by In-
doorAtlas [91], a cloud based service that exploits smartphone embedded magnetometer
for indoor positioning.
3.1 System description
The system is managed by an Android application running on a smartphone that
computes the location data and merges it with the EEG raw data, acquired by the same
dedicated hardware board described in Sec. 2.6.1. The board is composed by a 24-bit
ADC, a Cortex-M4 microcontroller and a Bluetooth module for communication with
the smartphone. The smartphone obtains the positioning data using IndoorAtlas SDK
version 2.2.4, with an accuracy of 1 to 3 m [91]. After the preliminary setup phase,
where the cloud builds a map of the magnetic field of the floorplan (fingerprint), device
localization is achieved by streaming to the cloud the magnetometer values.
3.1.1 Android app
Figure 3.1: Android app architecture
The Android app architecture is depicted in Fig. 3.1. An introductory activity wel-
comes the user and let him/her choose a paired Bluetooth device, then the main activity
starts and immediately spawns the ServiceManager thread. The ServiceManager in turn
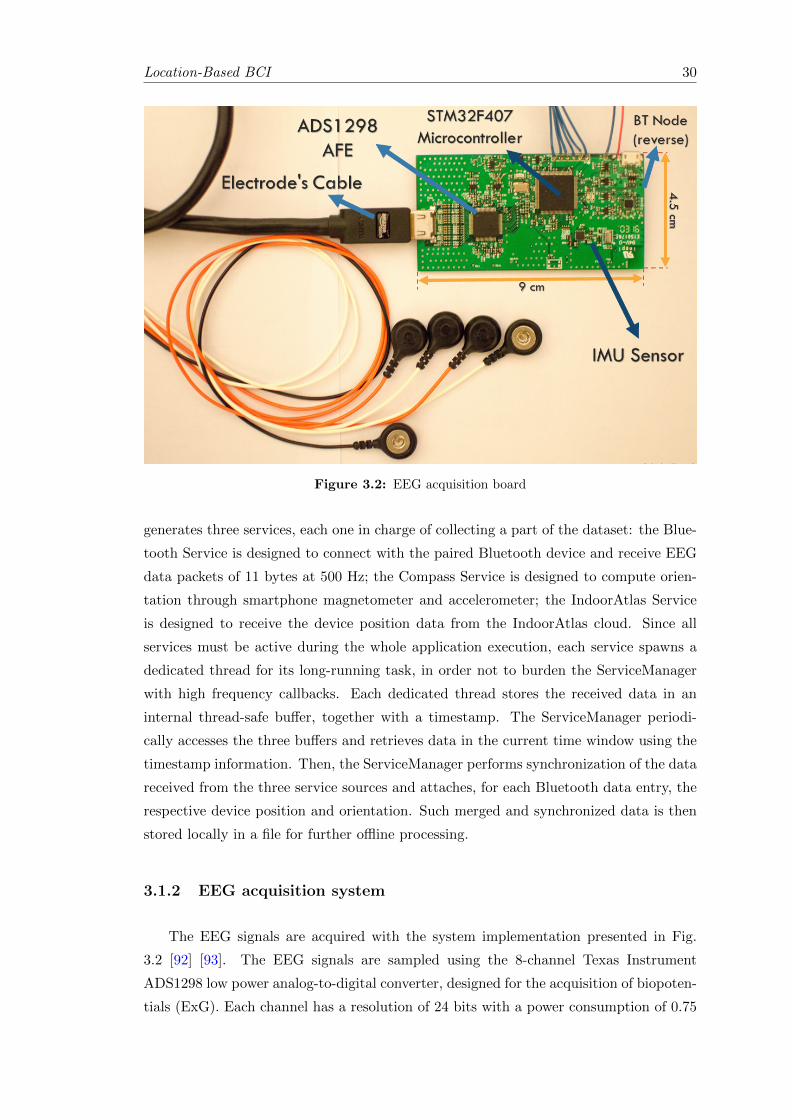
Location-Based BCI 30
Figure 3.2: EEG acquisition board
generates three services, each one in charge of collecting a part of the dataset: the Blue-
tooth Service is designed to connect with the paired Bluetooth device and receive EEG
data packets of 11 bytes at 500 Hz; the Compass Service is designed to compute orien-
tation through smartphone magnetometer and accelerometer; the IndoorAtlas Service
is designed to receive the device position data from the IndoorAtlas cloud. Since all
services must be active during the whole application execution, each service spawns a
dedicated thread for its long-running task, in order not to burden the ServiceManager
with high frequency callbacks. Each dedicated thread stores the received data in an
internal thread-safe buffer, together with a timestamp. The ServiceManager periodi-
cally accesses the three buffers and retrieves data in the current time window using the
timestamp information. Then, the ServiceManager performs synchronization of the data
received from the three service sources and attaches, for each Bluetooth data entry, the
respective device position and orientation. Such merged and synchronized data is then
stored locally in a file for further offline processing.
3.1.2 EEG acquisition system
The EEG signals are acquired with the system implementation presented in Fig.
3.2 [92] [93]. The EEG signals are sampled using the 8-channel Texas Instrument
ADS1298 low power analog-to-digital converter, designed for the acquisition of biopoten-
tials (ExG). Each channel has a resolution of 24 bits with a power consumption of 0.75
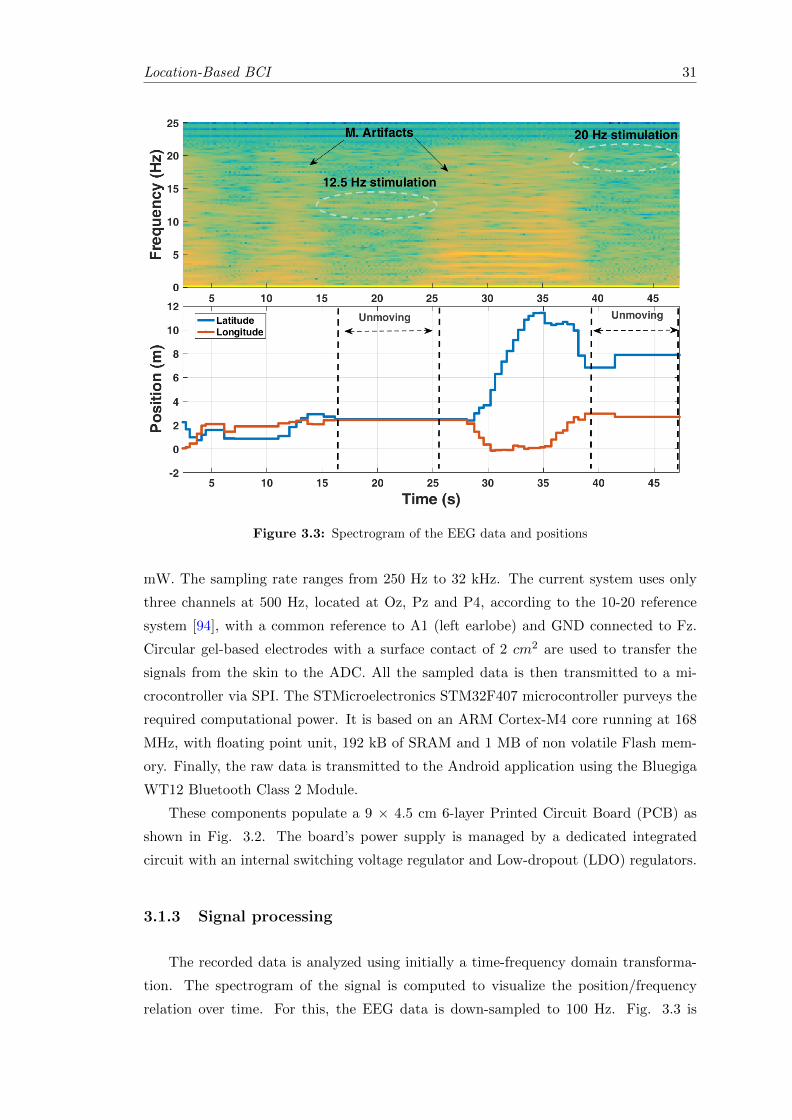
Location-Based BCI 31
Figure 3.3: Spectrogram of the EEG data and positions
mW. The sampling rate ranges from 250 Hz to 32 kHz. The current system uses only
three channels at 500 Hz, located at Oz, Pz and P4, according to the 10-20 reference
system [94], with a common reference to A1 (left earlobe) and GND connected to Fz.
Circular gel-based electrodes with a surface contact of 2 cm2 are used to transfer the
signals from the skin to the ADC. All the sampled data is then transmitted to a mi-
crocontroller via SPI. The STMicroelectronics STM32F407 microcontroller purveys the
required computational power. It is based on an ARM Cortex-M4 core running at 168
MHz, with floating point unit, 192 kB of SRAM and 1 MB of non volatile Flash mem-
ory. Finally, the raw data is transmitted to the Android application using the Bluegiga
WT12 Bluetooth Class 2 Module.
These components populate a 9 × 4.5 cm 6-layer Printed Circuit Board (PCB) as
shown in Fig. 3.2. The board’s power supply is managed by a dedicated integrated
circuit with an internal switching voltage regulator and Low-dropout (LDO) regulators.
3.1.3 Signal processing
The recorded data is analyzed using initially a time-frequency domain transforma-
tion. The spectrogram of the signal is computed to visualize the position/frequency
relation over time. For this, the EEG data is down-sampled to 100 Hz. Fig. 3.3 is

Location-Based BCI 32
obtained using the spectrogram function (Matlab) with window size of 100 samples and
50% overlap. It is plotted in relation to the cartesian coordinates in m from a corner
of the corridor. The points where the position remains unchanged reveal the moments
where the subject is receiving the visual stimulation (10 seconds approximately). Since
the quality of the spectrogram is not sufficient to correctly quantify the VEPs, the sec-
tions containing the visual stimulation are extracted for a thorough analysis. Given the
time-locked nature of the stimuli, signal averaging (on a given time window) is used to
increase the signal-to-noise ratio of the segment. Subsequently, the window is analyzed
using the Frequency Tagging Analysis (FTA) by average of the frequency components
of small chunks of the original signal.
3.1.4 Challenges
Table 3.1: Comparison between different electrode placement
Conf SNR (SSVEP) PLI1 BA2 MA2
A 3.14 3.26 9.29 129.25
B 4.65 2.24 39.03 130.29
C 4.10 2.80 8.70 115.21
1Measured in Vrms
The major challenge regarding the Android application is data synchronization be-
tween services. In fact, there is no practical way to determine via software the arrival
time of a Bluetooth packet with ms precision. The Bluetooth unit of the smartphone
stores locally the received packets and delivers them to the Android Bluetooth adapter
in batches. The frequency of the batch delivery to the Android Bluetooth adapter de-
pends not only on the remote Bluetooth transmission frequency, but also on the internal
implementation of the two units. To overcome this problem, an algorithm is devised to
estimate the arrival time of one packet and then the transmission frequency knowledge
is exploited to update the timestamp for each following packet.
Regarding the acquisition of the EEG signals, challenges arise because of the dif-
ferent sources of noise. These are normally lessened by carrying out experimentation
in carefully controlled environments. Mainly, three sources of interference are present
during the recordings. The first corresponds to the movement artifacts (MA), caused by
the movement of the electrode and/or the electrical changes due to energy equalization
between the subject and the ground. The second, the blink artifacts (BA), normally
present in EEG measurements, are generated by the movement of the eyes. The third
corresponds to the 50 Hz power line interference (PLI). While recording on real-life
scenarios, the location of the electrodes plays an important role in reducing the effects
of the mentioned artifacts, but simultaneously, it can also affect the amplitude of the
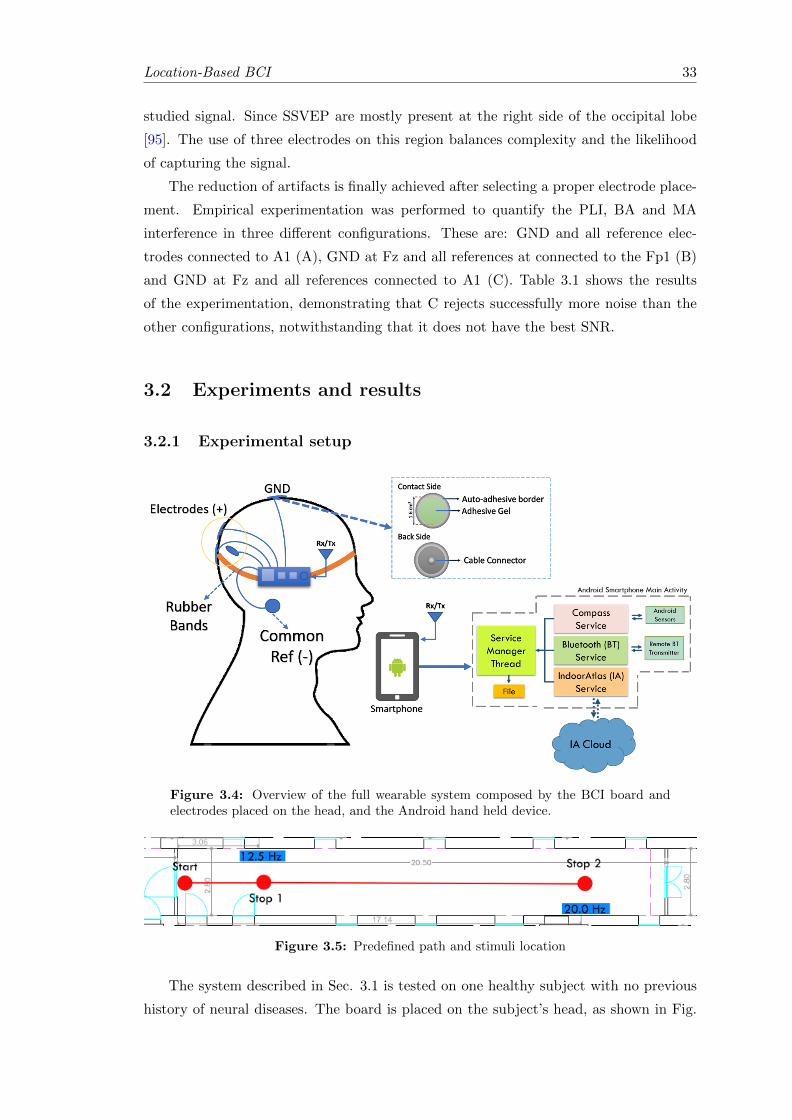
Location-Based BCI 33
studied signal. Since SSVEP are mostly present at the right side of the occipital lobe
[95]. The use of three electrodes on this region balances complexity and the likelihood
of capturing the signal.
The reduction of artifacts is finally achieved after selecting a proper electrode place-
ment. Empirical experimentation was performed to quantify the PLI, BA and MA
interference in three different configurations. These are: GND and all reference elec-
trodes connected to A1 (A), GND at Fz and all references at connected to the Fp1 (B)
and GND at Fz and all references connected to A1 (C). Table 3.1 shows the results
of the experimentation, demonstrating that C rejects successfully more noise than the
other configurations, notwithstanding that it does not have the best SNR.
3.2 Experiments and results
3.2.1 Experimental setup
Figure 3.4: Overview of the full wearable system composed by the BCI board andelectrodes placed on the head, and the Android hand held device.
Figure 3.5: Predefined path and stimuli location
The system described in Sec. 3.1 is tested on one healthy subject with no previous
history of neural diseases. The board is placed on the subject’s head, as shown in Fig.
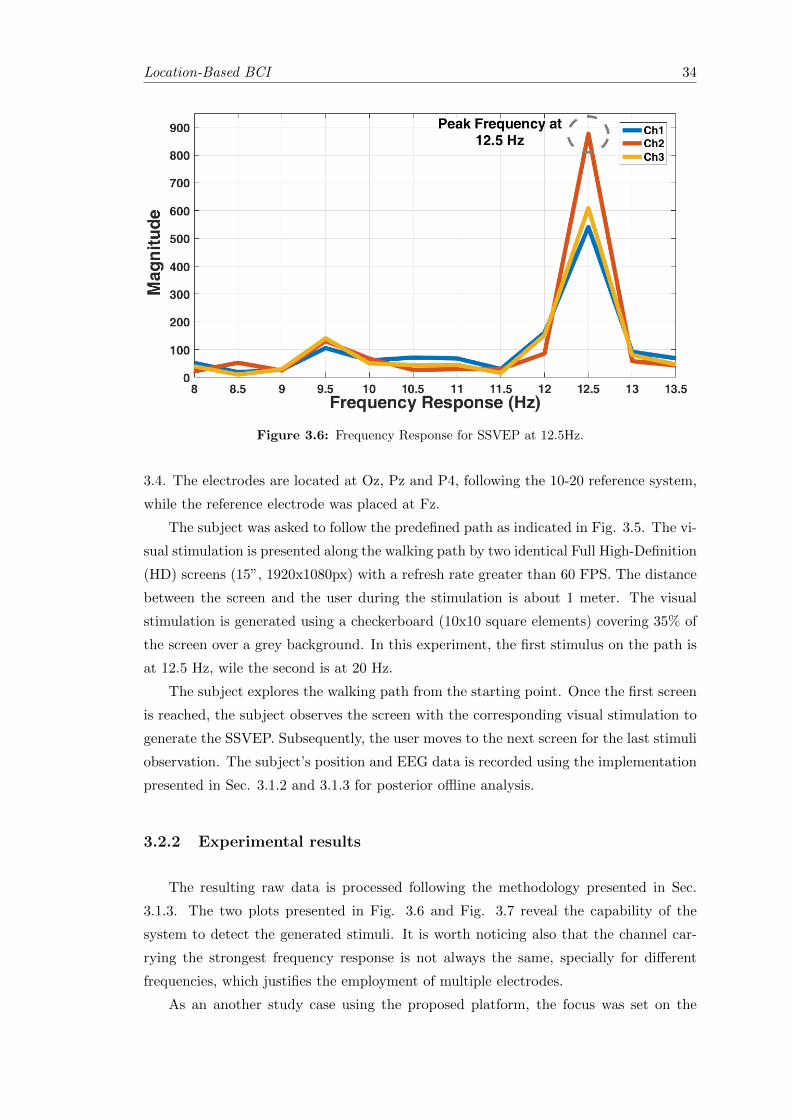
Location-Based BCI 34
Figure 3.6: Frequency Response for SSVEP at 12.5Hz.
3.4. The electrodes are located at Oz, Pz and P4, following the 10-20 reference system,
while the reference electrode was placed at Fz.
The subject was asked to follow the predefined path as indicated in Fig. 3.5. The vi-
sual stimulation is presented along the walking path by two identical Full High-Definition
(HD) screens (15”, 1920x1080px) with a refresh rate greater than 60 FPS. The distance
between the screen and the user during the stimulation is about 1 meter. The visual
stimulation is generated using a checkerboard (10x10 square elements) covering 35% of
the screen over a grey background. In this experiment, the first stimulus on the path is
at 12.5 Hz, wile the second is at 20 Hz.
The subject explores the walking path from the starting point. Once the first screen
is reached, the subject observes the screen with the corresponding visual stimulation to
generate the SSVEP. Subsequently, the user moves to the next screen for the last stimuli
observation. The subject’s position and EEG data is recorded using the implementation
presented in Sec. 3.1.2 and 3.1.3 for posterior offline analysis.
3.2.2 Experimental results
The resulting raw data is processed following the methodology presented in Sec.
3.1.3. The two plots presented in Fig. 3.6 and Fig. 3.7 reveal the capability of the
system to detect the generated stimuli. It is worth noticing also that the channel car-
rying the strongest frequency response is not always the same, specially for different
frequencies, which justifies the employment of multiple electrodes.
As an another study case using the proposed platform, the focus was set on the
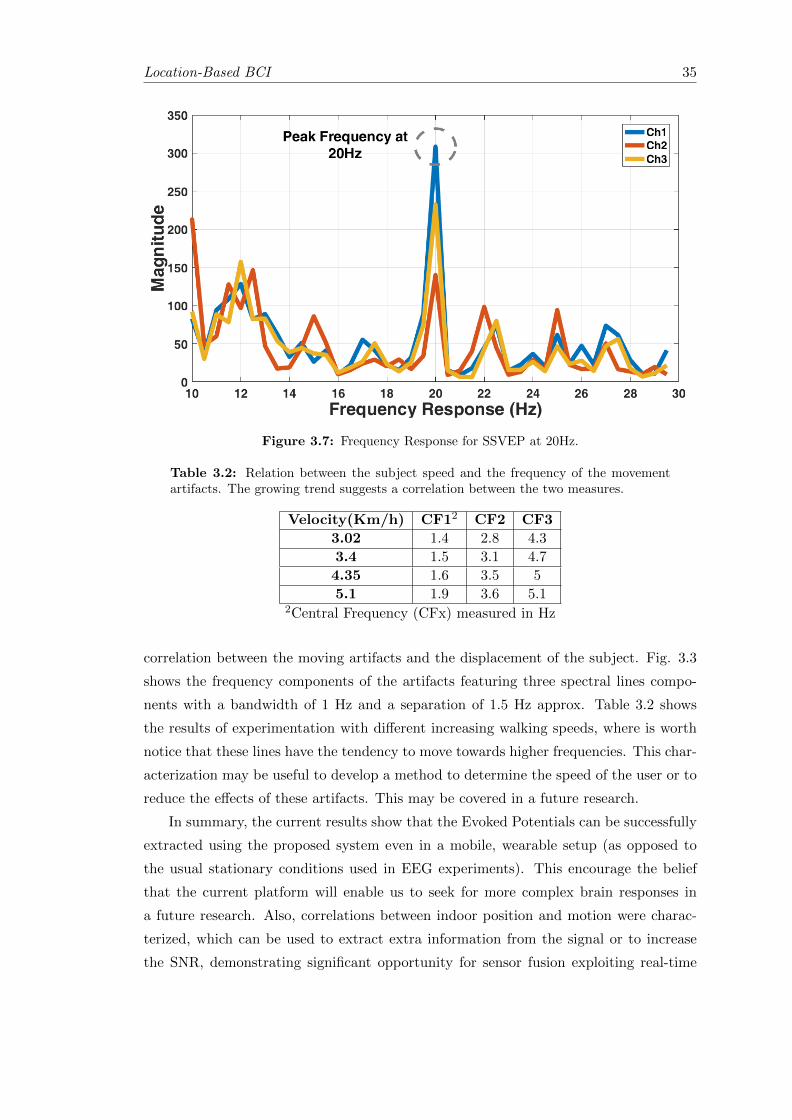
Location-Based BCI 35
Figure 3.7: Frequency Response for SSVEP at 20Hz.
Table 3.2: Relation between the subject speed and the frequency of the movementartifacts. The growing trend suggests a correlation between the two measures.
Velocity(Km/h) CF12 CF2 CF3
3.02 1.4 2.8 4.3
3.4 1.5 3.1 4.7
4.35 1.6 3.5 5
5.1 1.9 3.6 5.12Central Frequency (CFx) measured in Hz
correlation between the moving artifacts and the displacement of the subject. Fig. 3.3
shows the frequency components of the artifacts featuring three spectral lines compo-
nents with a bandwidth of 1 Hz and a separation of 1.5 Hz approx. Table 3.2 shows
the results of experimentation with different increasing walking speeds, where is worth
notice that these lines have the tendency to move towards higher frequencies. This char-
acterization may be useful to develop a method to determine the speed of the user or to
reduce the effects of these artifacts. This may be covered in a future research.
In summary, the current results show that the Evoked Potentials can be successfully
extracted using the proposed system even in a mobile, wearable setup (as opposed to
the usual stationary conditions used in EEG experiments). This encourage the belief
that the current platform will enable us to seek for more complex brain responses in
a future research. Also, correlations between indoor position and motion were charac-
terized, which can be used to extract extra information from the signal or to increase
the SNR, demonstrating significant opportunity for sensor fusion exploiting real-time

AR-based BCI 36
location and EEG tracking. Moreover, the system can be applied for studying the en-
vironmental context such as the visibility of the stimuli, the presence of other persons
obstructing the stimuli, or the interest of one person to stare at a particular portion of
the wall, with possible applications in exposition contexts like stores or museums. It is
worth mentioning that all the data-set generated so far and in future experimentations
will be publicly available, enabling other researchers to study the brain activity in re-
lation with position. Another important contribution of this work is that all the data
is collected in real scenarios. This will challenge the current methods but will empower
the development of new algorithms to mitigate the effects of undesired signals present
in the environment.

Chapter 4
AR-based BCI
Despite BCIs moving towards being embedded in wearable devices, visual stimuli
are still mostly presented on large LCD monitors, limiting their application to fixed
locations of the environment. By combining BCIs with AR tools such as smart glasses,
microprojectors or head-mounted displays (HMD), the system flexibility can be dramat-
ically increased. As an example, visual stimuli can be triggered adaptively according to
the user’s position or action. So, if the user approaches a specific object, a BCI starts
to interact with that object through the HMD.
An example of the integration of a P300 based BCI system used to enable HMI is
reported in [96], where an EEG acquisition system is coupled with an AR system to
enable the control of a smart home. The system is tested on three subjects for tasks of
domotic control (i.e. TV channel switching, opening and closing doors.). The subjects
were firstly trained in numbers and characters spelling based on their P300 response.
The final needed time for recognition task is typically around 30s with accuracy ranging
from 83 to 100%. This system reaches high accuracy but it is intended for users with
severe disabilities, based on a full coverage EEG cap and not suitable for a wearable
consumer application.
The work of [97] presents a wearable interface that combines an eye-tracker with a
BCI trigger to detect the response to visual stimulation using a binary classifier. Basi-
cally, the eye-tracker detects where the user is looking, and enables the SSVEP stimuli
mapped on the intended object, enabling the user to choose how to interact with the ob-
ject. The system is based on a modified version of the Emotiv NeuroHeadset, using wet
saline electrodes which acquire the EEG signal at 128 Hz. Samples are sent wirelessly
to an Odroid board, powered by a high-end processor (i.e. Samsung Exynos4412 Prime
chip operating with 1.7 GHz ARM Cortex-A9 Quad Cores). The average classification
accuracy is 73.5% while the time needed to perform a recognition task is higher than 4
seconds.
37
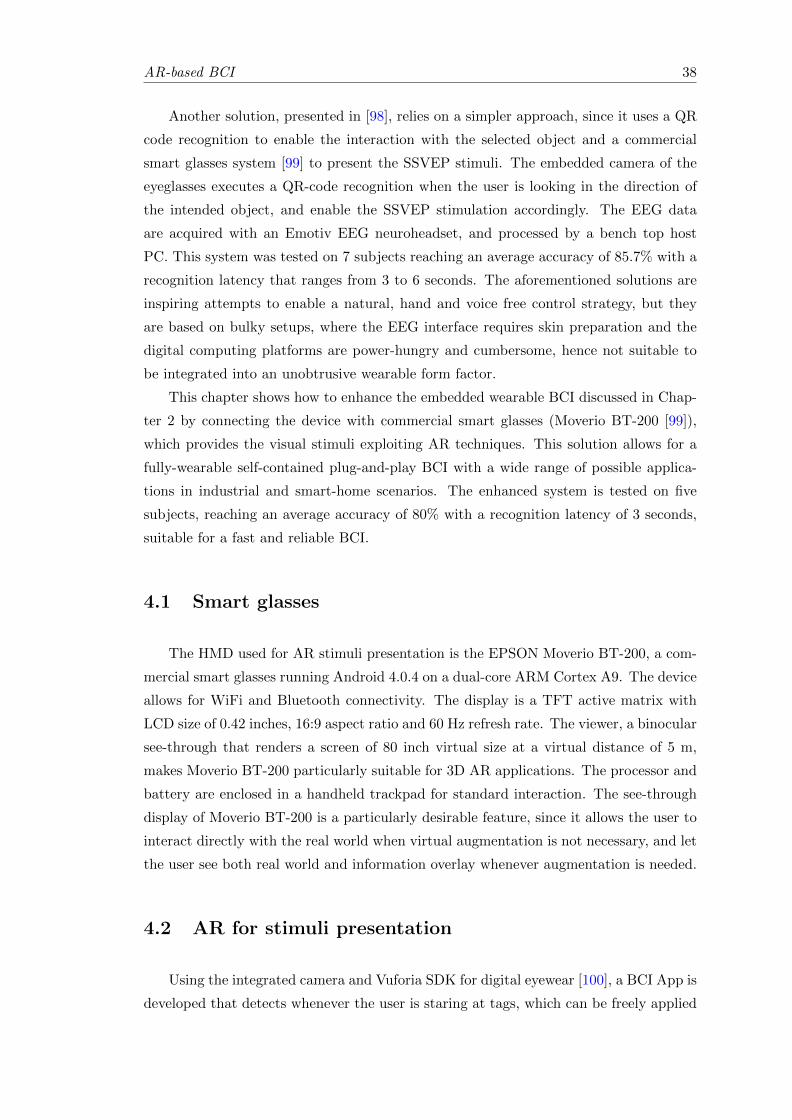
AR-based BCI 38
Another solution, presented in [98], relies on a simpler approach, since it uses a QR
code recognition to enable the interaction with the selected object and a commercial
smart glasses system [99] to present the SSVEP stimuli. The embedded camera of the
eyeglasses executes a QR-code recognition when the user is looking in the direction of
the intended object, and enable the SSVEP stimulation accordingly. The EEG data
are acquired with an Emotiv EEG neuroheadset, and processed by a bench top host
PC. This system was tested on 7 subjects reaching an average accuracy of 85.7% with a
recognition latency that ranges from 3 to 6 seconds. The aforementioned solutions are
inspiring attempts to enable a natural, hand and voice free control strategy, but they
are based on bulky setups, where the EEG interface requires skin preparation and the
digital computing platforms are power-hungry and cumbersome, hence not suitable to
be integrated into an unobtrusive wearable form factor.
This chapter shows how to enhance the embedded wearable BCI discussed in Chap-
ter 2 by connecting the device with commercial smart glasses (Moverio BT-200 [99]),
which provides the visual stimuli exploiting AR techniques. This solution allows for a
fully-wearable self-contained plug-and-play BCI with a wide range of possible applica-
tions in industrial and smart-home scenarios. The enhanced system is tested on five
subjects, reaching an average accuracy of 80% with a recognition latency of 3 seconds,
suitable for a fast and reliable BCI.
4.1 Smart glasses
The HMD used for AR stimuli presentation is the EPSON Moverio BT-200, a com-
mercial smart glasses running Android 4.0.4 on a dual-core ARM Cortex A9. The device
allows for WiFi and Bluetooth connectivity. The display is a TFT active matrix with
LCD size of 0.42 inches, 16:9 aspect ratio and 60 Hz refresh rate. The viewer, a binocular
see-through that renders a screen of 80 inch virtual size at a virtual distance of 5 m,
makes Moverio BT-200 particularly suitable for 3D AR applications. The processor and
battery are enclosed in a handheld trackpad for standard interaction. The see-through
display of Moverio BT-200 is a particularly desirable feature, since it allows the user to
interact directly with the real world when virtual augmentation is not necessary, and let
the user see both real world and information overlay whenever augmentation is needed.
4.2 AR for stimuli presentation
Using the integrated camera and Vuforia SDK for digital eyewear [100], a BCI App is
developed that detects whenever the user is staring at tags, which can be freely applied

AR-based BCI 39
Figure 4.1: Example of the application usage from the user’s perspective.
to objects in the environment, and informs the BCI wearable node that the user wants
to interact with a certain object. Different tags can trigger different numbers of stimuli
but, remarkably, different tags can trigger stimuli using the same set of frequencies,
overcoming the bottleneck problem of pushing as many target frequencies as possible in
a small bandwidth between 5 Hz and 10 Hz, where the SSVEP response is maximized.
Each stimulus consists of a PNG image representing an 8 x 8 black and white square
checkerboard, with a gray diagonal cross to guide user’s gaze. The frequency of the
stimulus is rendered by modulating the image opacity from 0 to 1 with a sine waveform.
The app can dynamically arrange up to six different checkerboards at the same time,
however in this work the focus is on a four checkerboard setup. Each checkerboard is
controlled by its own ValueAnimator object, initialized for linearly animating float values
from 0 to 2, representing the coefficient of π in the sine wave equation. The duration
of the animation reflects the stimulus frequency, and it is computed from the frequency
attribute, which can be set directly in the XML layout file. An AnimatorUpdateListener
object is used to intercept the updates of the ValueAnimator animation, and set the
opacity of the image accordingly. The animation is then repeated for a number of times
calculated on the predefined stimulation length, and then the checkerboard disappears.
Fig 4.1 shows an example of the application usage from the user’s perspective: when
the user looks at a tag, four flickering checkerboards appear on the HMD, representing
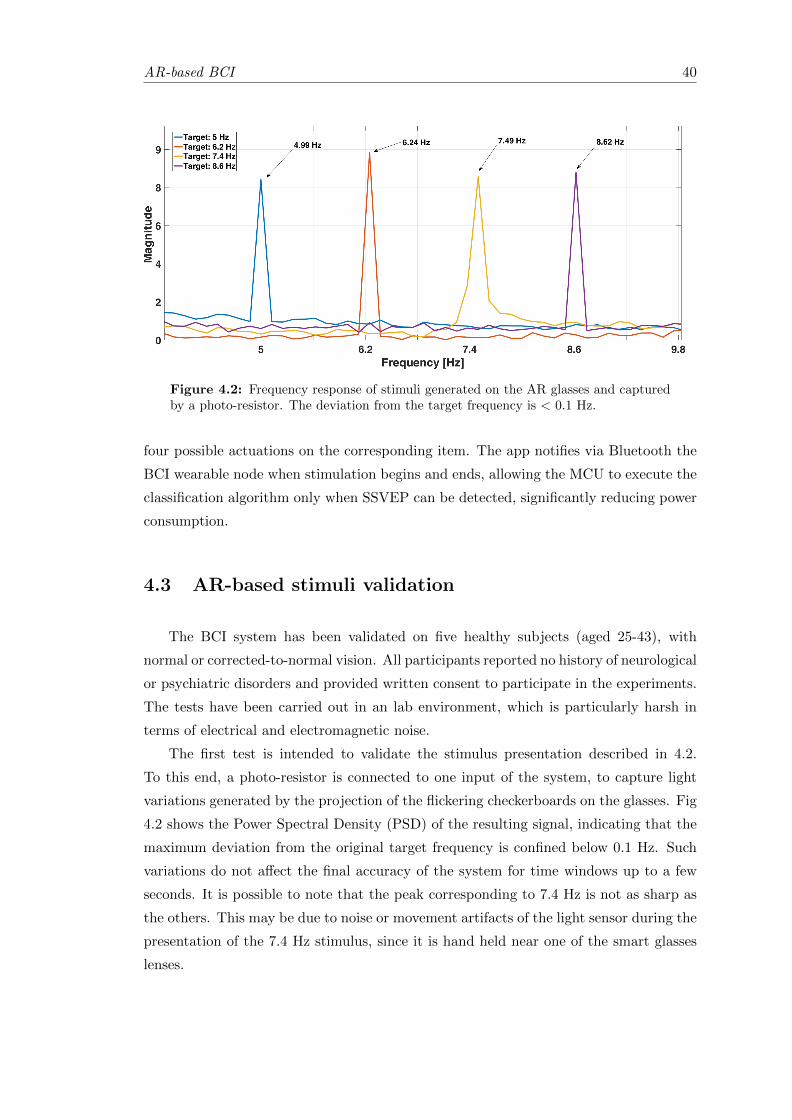
AR-based BCI 40
Figure 4.2: Frequency response of stimuli generated on the AR glasses and capturedby a photo-resistor. The deviation from the target frequency is < 0.1 Hz.
four possible actuations on the corresponding item. The app notifies via Bluetooth the
BCI wearable node when stimulation begins and ends, allowing the MCU to execute the
classification algorithm only when SSVEP can be detected, significantly reducing power
consumption.
4.3 AR-based stimuli validation
The BCI system has been validated on five healthy subjects (aged 25-43), with
normal or corrected-to-normal vision. All participants reported no history of neurological
or psychiatric disorders and provided written consent to participate in the experiments.
The tests have been carried out in an lab environment, which is particularly harsh in
terms of electrical and electromagnetic noise.
The first test is intended to validate the stimulus presentation described in 4.2.
To this end, a photo-resistor is connected to one input of the system, to capture light
variations generated by the projection of the flickering checkerboards on the glasses. Fig
4.2 shows the Power Spectral Density (PSD) of the resulting signal, indicating that the
maximum deviation from the original target frequency is confined below 0.1 Hz. Such
variations do not affect the final accuracy of the system for time windows up to a few
seconds. It is possible to note that the peak corresponding to 7.4 Hz is not as sharp as
the others. This may be due to noise or movement artifacts of the light sensor during the
presentation of the 7.4 Hz stimulus, since it is hand held near one of the smart glasses
lenses.

AR-based BCI 41
Figure 4.3: CCA correlation
Figure 4.4: Front and back view of the complete setup during a test.The HDMI cableattached to the board is used only for testing purpose, and it is not required duringnormal operation of the system. Similarly, the current size and weight of the PCB allowan easy debugging. Nevertheless, the entire hardware dimensions can be reduced to ahalf.
4.4 Experiments and results
4.4.1 Experimental setup
SSVEP signals are elicited employing four black and white checkerboards as de-
scribed in Sec. 4.2, arranged in a 2 x 2 pattern, located at the corners of the visual
field of the smart glasses display. Four equally spaced frequency-coded stimuli (5.0 Hz,
6.2 Hz, 7.4 Hz and 8.6 Hz) are used as targets. During the tests, the subjects will fix
the eyesight at a target indicated with a red cue before the onset of the stimulation.
Later, all the stimuli will remain active for ten seconds, followed by 5 seconds of pause

Conclusions 42
to reduce visual fatigue. This process is repeated four times to cover all checkerboards,
and the trial is repeated three times for each subject.
Concurrently, EEG data is acquired using the hardware presented in Sec. 2.2.2 and
2.6.1 from three electrodes placed at the occipital lobe (P5, POZ, and P6), with refer-
ence and ground located at A1 and A2 respectively. An example of the complete setup
is presented at Fig. 4.4.
Before each test with the smart glasses, a control test is performed using a regu-
lar 24-inch LED (60fps) display. The results obtained are later used to evaluate the
performance of the AR projections with respect to the classical technique for SSVEP
stimulation [101].
4.4.2 Experimental results
Subject Latency (s) Accuracy ITR (b/s)
S12.57 1.00 0.784.50 1.00 0.443.08 1.00 0.65
S22.95 0.67 0.193.85 0.91 0.372.25 1.00 0.89
S33.03 0.63 0.153.78 0.68 0.162.00 0.87 0.62
S41.70 0.91 0.833.13 0.85 0.371.58 0.82 0.65
S55.63 0.69 0.113.00 0.50 0.072.50 0.50 0.08
Average 3.04 0.80 0.42
Table 4.1: Experimental results. For each subject results of three trials are reported.
Table 4.1 reports detailed results for all subjects. To account for some occasional
variabilities regarding the acquisition setup each subject has repeated the test three
times. Of the five subjects, only S5 has performed poorly, possibly due to a certain
degree of intolerance to bearing the eyeglass frames. Nevertheless, the average results
show that the system is reliable (average accuracy 80%) and responsive (average latency
of about 3 s), with an average ITR with four targets of 0.42 b/s.
The results demonstrate that the presented embedded implementation outperforms
systems based on AR eyeglasses while being also aligned with the SoA traditional SSVEP
systems. Moreover, this work shows that online and real-time processing is achievable

Conclusions 43
through a low-intrusivity setup, which is a significant step forward with respect to the
current offline and bulky systems.

Chapter 5
Conclusions
This dissertation presents a novel SSVEP embedded BCI system based on a cus-
tom hardware platform for medical IoT and a minimally intrusive setup with 3 zero-
preparation EEG dry electrodes. Leveraging a multimodal approach, which ranges from
EEG acquisition to embedded optimization, this work aims at widening the usage of
BCI systems among able-bodied people, by designing a fully wearable and easy-to-use
system for brain-machine communication with up to eight stimuli. The work goes a step
further combining a deeply embedded platform with dry electrodes, which highlights
the contribution of this work with regards of current system based on cumbersome
processing platforms and wet electrodes. The whole processing chain, from raw EEG
signal acquisition to frequency identification via CCA algorithm, is executed in real-time
on an embedded cost-effective microcontroller. The code optimization, tailored for the
CORTEX M4 Instruction Set Architecture allows to calculate up to 10 EEG feature clas-
sifications per second, keeping power consumption as low as 27.5 mW. The system has
been fully designed, tested and validated on five subjects, achieving an average ITR of
1.06 b/s with the dry electrodes interface and 1.28 b/s with the wet electrodes interface.
The proposed solution does not require subject dependent training and synchronization
mechanisms for the stimuli presentation, hence it is suitable for the deployment in non-
prepared environment.
In the third chapter, the same hardware is used in a study for combining EEG signals
with subject position data retrieved with a smartphone via indoor positioning system.
Differently form the setup in the second chapter, this time the system features only wet
electrodes and the results are analyzed offline. The system is tested in a real environ-
ment and experimental results show that it is possible to extract Evoked Potentials from
the EEG signal and therefore locate the subject.
In the fourth chapter is presented the enhancement of the BCI system described
in the second chapter, resulting in a fully-wearable BCI composed of a low-power EEG
44
Conclusions 45
acquisition system for SSVEP detection connected to a pair of commercial smart glasses
for stimuli presentation. The use of AR environment delivers a realistic BCI, promising
a more intuitive way of brain communication. The wearable BCI offers the performance
of the current SoA systems while also providing a real-time EEG signal classification
through a non-intrusive, embedded processing platform. The system has been validated
on five subjects, achieving an average ITR of 0.42 b/s and an average output latency
of 3.0 seconds. This performance substantially improves those of SoA wearable systems
employing AR and smart glasses in terms of both accuracy and delay [97, 98]. Firmware
optimization of the algorithm has been shown helpful in keeping power consumption as
low as 32.12 mW, essential for providing extended hours of operation. The usage bot-
tleneck of the system is therefore constituted by the battery duration of the commercial
HMD device.
This work aims at spreading the usage of BCI systems by devising a wearable easy-
to-use online system ready to be deployed in fields where reliability constraints are
stronger, such as smart environments like industry 4.0. The ability of the proposed
system to provide a real-time user experience highlights the contribution of this work
towards a more realistic and useful BCI. It is already possible to envision some future
enhancements to the current system, under hardware and software point of view. As
a first remark, the commercial smart glasses used for stimuli augmentation represent a
bottleneck for power consumption, hindering the long term usage capability of the BCI.
To overcome this problem, future work can follow two possible scenarios: acting on the
smart glasses device hardware, or acting on the BCI configuration. In former case, a
careful hardware design for a custom low power smart glasses device is required. In
latter case, another BCI based on mu or beta rhythm, or EOG, can be used to control
stimuli activation. Unlike the current system, where the smart glasses camera is active
all the time and the device is performing continuous pattern recognition, in this scenario
the stimuli presentation is triggered by the low power BCI, and the power hungry smart
glasses can be kept idle for the remaining time. The BCI in this configuration must
implement two behavioural states: regular SSVEP-based classification during stimuli
presentation and ”start stimuli command” detection the rest of time. The command
can be encoded into a double eyeblink and decoded using EOG, or with a brain rhythm
pattern like mu, beta or alpha waves. In case of EOG encoding, at least one more elec-
trode is needed near the forehead to capture the eye blinking, whereas in case of alpha,
beta and mu waves the user might need training to learn how to produce the required
pattern.
Hardware upgrade can be done also for the BCI device, by porting the firmware on
a Parallel Ultra Low Power (PULP) architecture [102]. Switching to such architecture
would bring an advantage in the power consumption over performance trade-off of the
system, making room for a better suited and more performing classifiers than simple

Conclusions 46
threshold. In particular, Convolutional Neural Networks have been proven to be good
classifiers for SSVEP-based dry electrodes BCI [103], and it would be interesting to test
their performance on a minimal invasive and wearable setup like the one discussed in this
thesis. As a further investigation, it would be interesting to assess the value of ITR on
varying number of stimuli and number and position of channels. Such characterization
could clarify the trade-offs between performance, electrodes, and stimuli, helping BCI
designers to choose the most suitable configuration for their target application.

Bibliography
[1] Angela T Chan, Juan C Quiroz, Sergiu Dascalu, and FC Harris. An overview
of brain computer interfaces. In Proc. 30th Int. Conf. on Computers and Their
Applications, 2015.
[2] Thalmic Labs. Thalmic’s MYO Armband. URL https://www.myo.com/.
[3] Gernot R Muller-Putz and Gert Pfurtscheller. Control of an electrical prosthesis
with an SSVEP-based BCI. IEEE Transactions on Biomedical Engineering, 55(1):
361–364, 2008.
[4] Kai Keng Ang et al. Brain-computer interface-based robotic end effector system
for wrist and hand rehabilitation: results of a three-armed randomized controlled
trial for chronic stroke. Frontiers in neuroengineering, 7:30, 2014.
[5] Phoebe Weston. Battle for control of your brain: Microsoft takes
on Facebook with plans for a mind-reading HEADBAND that will
let you use devices with the power of thought. Mail Online, 2018.
URL http://www.dailymail.co.uk/sciencetech/article-5274823/
Microsoft-takes-Facebook-mind-reading-technology.html.
[6] Sarah Marsh. Neurotechnology, Elon Musk and the goal
of human enhancement. The Guardian, 2018. URL
https://www.theguardian.com/technology/2018/jan/01/
elon-musk-neurotechnology-human-enhancement-brain-computer-interfaces.
[7] Kristen V. Brown. Here Are the First Hints of How Facebook Plans
to Read Your Thoughts. Wired, 2018. URL https://gizmodo.com/
here-are-the-first-hints-of-how-facebook-plans-to-read-1818624773.
[8] VeeaR, Global Industry Analysts, Inc. (GIA), 2018. URL http://www.veear.eu/.
[9] Google Inc. Google glass. URL https://x.company/glass/.
[10] Mindmaze. Mindmaze Mask, 2018. URL https://www.mindmaze.com/mask/.
47
Bibliography 48
[11] Neurosky. Neurosky MindWave, 2018. URL http://neurosky.com/biosensors/
eeg-sensor/biosensors/.
[12] Emotiv, 2018. URL https://www.emotiv.com/.
[13] OpenBCI, 2018. URL http://openbci.com/.
[14] g.tec GmbH. g.tec Intendix, 2018. URL http://www.gtec.at/Products/
Complete-Solutions/intendiX-Specs-Features.
[15] Donghee Son et al. Multifunctional wearable devices for diagnosis and therapy of
movement disorders. Nature nanotechnology, 9(5):397, 2014.
[16] Gert Pfurtscheller et al. The hybrid BCI. Frontiers in neuroscience, 4:3, 2010.
[17] T Klingeberg and Marcel Schilling. Mobile wearable device for long term monitor-
ing of vital signs. Computer methods and programs in biomedicine, 106(2):89–96,
2012.
[18] M. Hooshmand et al. Boosting the battery life of wearables for health monitoring
through the compression of biosignals. IEEE Internet of Things Journal, 2017.
[19] A. A. Abdellatif et al. EEG-based Transceiver Design with Data Decomposition
for Healthcare IoT Applications. IEEE Internet of Things Journal, pages 1–1,
2018. doi: 10.1109/JIOT.2018.2832463.
[20] Luis Fernando Nicolas-Alonso and Jaime Gomez-Gil. Brain computer interfaces,
a review. Sensors, 12(2):1211–1279, 2012.
[21] Muhammad Bilal Khalid, Naveed Iqbal Rao, Intisar Rizwan-i Haque, Sarmad Mu-
nir, and Farhan Tahir. Towards a brain computer interface using wavelet transform
with averaged and time segmented adapted wavelets. In Computer, control and
communication, 2009. ic4 2009. 2nd international conference on, pages 1–4. IEEE,
2009.
[22] Jonathan R Wolpaw, Niels Birbaumer, Dennis J McFarland, Gert Pfurtscheller,
and Theresa M Vaughan. Brain–computer interfaces for communication and con-
trol. Clinical neurophysiology, 113(6):767–791, 2002.
[23] Thomas Elbert, Brigitte Rockstroh, Werner Lutzenberger, and Niels Birbaumer.
Biofeedback of slow cortical potentials. i. Electroencephalography and clinical neu-
rophysiology, 48(3):293–301, 1980.
[24] Niels Birbaumer, Nimr Ghanayim, Thilo Hinterberger, Iver Iversen, Boris
Kotchoubey, Andrea Kubler, Juri Perelmouter, Edward Taub, and Herta Flor.
A spelling device for the paralysed. Nature, 398(6725):297, 1999.

Bibliography 49
[25] Niels Birbaumer, Andrea Kubler, Nimr Ghanayim, Thilo Hinterberger, Jouri
Perelmouter, Jochen Kaiser, Iver Iversen, Boris Kotchoubey, Nicola Neumann,
and Herta Flor. The thought translation device (ttd) for completely paralyzed
patients. IEEE Transactions on rehabilitation Engineering, 8(2):190–193, 2000.
[26] Gert Pfurtscheller, Ch Neuper, Doris Flotzinger, and Martin Pregenzer. Eeg-based
discrimination between imagination of right and left hand movement. Electroen-
cephalography and clinical Neurophysiology, 103(6):642–651, 1997.
[27] Hui Shen, Li Zhao, Yan Bian, and Longteng Xiao. Research on ssvep-based con-
trolling system of multi-dof manipulator. In International Symposium on Neural
Networks, pages 171–177. Springer, 2009.
[28] Xiaorong Gao, Dingfeng Xu, Ming Cheng, and Shangkai Gao. A bci-based environ-
mental controller for the motion-disabled. IEEE Transactions on neural systems
and rehabilitation engineering, 11(2):137–140, 2003.
[29] William M Perlstein et al. Steady-state visual evoked potentials reveal frontally-
mediated working memory activity in humans. Neuroscience letters, 342(3):191–
195, 2003.
[30] David E Thompson, Stefanie Blain-Moraes, and Jane E Huggins. Performance
assessment in brain-computer interface-based augmentative and alternative com-
munication. Biomedical engineering online, 12(1):43, 2013.
[31] Sylvain Baillet, John C Mosher, and Richard M Leahy. Electromagnetic brain
mapping. IEEE Signal processing magazine, 18(6):14–30, 2001.
[32] Saeid Sanei and Jonathon A Chambers. Eeg signal processing. 2007.
[33] COVIDIEN. Covidien Kendall, 2015. URL https://bio-medical.com/
covidien-kendall-disposable-surface-emg-ecg-ekg-electrodes-1-3-8-35mm-50pkg.
html.
[34] g.tec GmbH. g.SAHARA. URL http://www.gtec.at/Products/
Electrodes-and-Sensors/g.SAHARA-Specs-Features.
[35] Masaki Nakanishi et al. Enhancing Detection of SSVEPs for a high-speed brain
speller using task-related component analysis. IEEE Transactions on Biomedical
Engineering, 65(1), 2018.
[36] Xiaogang Chen et al. High-speed spelling with a noninvasive brain–computer
interface. Proceedings of the national academy of sciences, 112(44):E6058–E6067,
2015.

Bibliography 50
[37] Xiaogang Chen, Zhikai Chen, Shangkai Gao, and Xiaorong Gao. A high-ITR
SSVEP-based BCI speller. Brain-Computer Interfaces, 1(3-4):181–191, 2014.
[38] Hsiang-Chih Chang et al. Real-time control of an SSVEP-actuated remote-
controlled car. In SICE Annual Conference 2010, Proceedings of, pages 1884–1887.
IEEE, 2010.
[39] Martin Spuler. A high-speed brain-computer interface (BCI) using dry EEG elec-
trodes. PloS one, 12(2), 2017.
[40] Niccolo Mora et al. Plug&play brain–computer interfaces for effective active and
assisted living control. Medical & biological engineering & computing, 55(8):1339–
1352, 2017.
[41] Hubert Cecotti. A self-paced and calibration-less SSVEP-based brain–computer
interface speller. IEEE Transactions on Neural Systems and Rehabilitation Engi-
neering, 18(2):127–133, 2010.
[42] Jzau-Sheng Lin and Cheng-Hung Hsieh. A wireless BCI-controlled integration
system in smart living space for patients. Wireless Personal Communications, 88
(2):395–412, 2016.
[43] PA Garcıa et al. An Embedded Hybrid BCI Speller. In VII Latin Ameri-
can Congress on Biomedical Engineering CLAIB 2016, Bucaramanga, Santander,
Colombia, October 26th-28th, 2016, pages 26–29. Springer, 2017.
[44] Xuhong Guo et al. Developing a one-channel BCI system using a dry claw-like
electrode. In Engineering in Medicine and Biology Society (EMBC), 2016 IEEE
38th Annual International Conference of the, pages 5693–5696. IEEE, 2016.
[45] Yu Mike Chi et al. Dry and noncontact EEG sensors for mobile brain–computer
interfaces. IEEE Transactions on Neural Systems and Rehabilitation Engineering,
20(2):228–235, 2012.
[46] M. Salvaro and S. Benatti and V. Kartsch and M. Guermandi and L. Benini. A
Minimally Invasive Low-Power Platform for Real-Time Brain Computer Interac-
tion based on Canonical Correlation Analysis. IEEE Internet of Things Journal,
pages 1–1, 2018. ISSN 2327-4662. doi: 10.1109/JIOT.2018.2866341.
[47] Shravani Sur and VK Sinha. Event-related potential: An overview. Industrial
psychiatry journal, 18(1):70, 2009.
[48] Lawrence Ashley Farwell and Emanuel Donchin. Talking off the top of your head:
toward a mental prosthesis utilizing event-related brain potentials. Electroen-
cephalography and clinical Neurophysiology, 70(6):510–523, 1988.

Bibliography 51
[49] Emanuel Donchin et al. The mental prosthesis: assessing the speed of a P300-
based brain-computer interface. IEEE transactions on rehabilitation engineering,
8(2):174–179, 2000.
[50] Hilit Serby et al. An improved P300-based brain-computer interface. IEEE Trans-
actions on neural systems and rehabilitation engineering, 13(1):89–98, 2005.
[51] Mattia Salvaro, Victor Kartsch, Simone Benatti, Michela Milano, and Luca Benini.
Towards a novel hmi paradigm based on mixed eeg and indoor localization plat-
forms. In CAS (NGCAS), 2017 New Generation of, pages 217–220. IEEE, 2017.
[52] Alban Dupres et al. SSVEP-based BCIs: study of classifier stability over time and
effects of human learning on classification accuracy. AMSE, Journal of the Associ-
ation for the Advancement of Modelling and Simulation Techniques in Enterprises
(Special edition HANDICAP), 2014.
[53] Min Hye Chang et al. Eliciting dual-frequency SSVEP using a hybrid SSVEP-P300
BCI. Journal of neuroscience methods, 258:104–113, 2016.
[54] Ming Cheng et al. Design and implementation of a brain-computer interface with
high transfer rates. IEEE transactions on biomedical engineering, 49(10):1181–
1186, 2002.
[55] Robert Prueckl and Christoph Guger. A brain-computer interface based on steady
state visual evoked potentials for controlling a robot. In Bio-Inspired Systems:
Computational and Ambient Intelligence, pages 690–697, Berlin, Heidelberg, 2009.
Springer Berlin Heidelberg.
[56] Rajesh Singla and BA Haseena. Comparison of SSVEP signal classification tech-
niques using SVM and ANN models for BCI applications. International Journal
of Information and Electronics Engineering, 4(1):6, 2014.
[57] Harold Hotelling. Relations between two sets of variates. Biometrika, JSTOR, 28
(3/4):321–377, 1936.
[58] Z. Lin et al. Frequency Recognition Based on Canonical Correlation Analysis
for SSVEP-Based BCIs. IEEE Transactions on Biomedical Engineering, 53(12):
2610–2614, Dec 2006. ISSN 0018-9294. doi: 10.1109/TBME.2006.886577.
[59] Guangyu Bin et al. An online multi-channel SSVEP-based brain–computer inter-
face using a canonical correlation analysis method. Journal of neural engineering,
6(4):046002, 2009.
[60] G. Tang et al. Compressed Sensing Off the Grid. IEEE Transactions on Informa-
tion Theory, 59(11):7465–7490, Nov 2013.

Bibliography 52
[61] J. Ying et al. Hankel matrix nuclear norm regularized tensor completion for n-
dimensional exponential signals. IEEE Transactions on Signal Processing, 65(14):
3702–3717, July 2017.
[62] Zhonglin Lin et al. Frequency recognition based on canonical correlation analysis
for SSVEP-based BCIs. IEEE transactions on biomedical engineering, 53(12):
2610–2614, 2006.
[63] Valeria Mondini, Anna Lisa Mangia, Luca Talevi, and Angelo Cappello. Sinc-
windowing and multiple correlation coefficients improve ssvep recognition based
on canonical correlation analysis. Computational Intelligence and Neuroscience,
2018, 2018.
[64] Victor Javier Kartsch et al. A sensor fusion approach for drowsiness detection in
wearable ultra-low-power systems. Information Fusion, 43:66–76, 2018.
[65] Simone Benatti et al. Multiple biopotentials acquisition system for wearable ap-
plications. In BIODEVICES, pages 260–268, 2015.
[66] Texas Instruments, 2015. URL http://www.ti.com/lit/ds/symlink/ads1298.
pdf.
[67] Gene H Golub. Matrix decompositions and statistical calculations. In Statistical
Computation, pages 365–397. Elsevier, 1969.
[68] Ake Bjorck and Gene H Golub. Numerical methods for computing angles between
linear subspaces. Mathematics of computation, 27(123):579–594, 1973.
[69] MATLAB. version 9.2.0 (R2017a). The MathWorks Inc., Natick, Massachusetts,
2017.
[70] ARM. CMSIS Library, 2016. URL https:
//www.arm.com/products/processors/cortex-m/
cortex-microcontroller-software-interface-standard.php.
[71] David Regan. Recent advances in electrical recording from the human brain.
Nature, 253(5491):401, 1975.
[72] Christoph S Herrmann. Human EEG responses to 1–100 Hz flicker: resonance
phenomena in visual cortex and their potential correlation to cognitive phenomena.
Experimental brain research, 137(3-4):346–353, 2001.
[73] Rafa l Kus et al. On the quantification of SSVEP frequency responses in human
EEG in realistic bci conditions. PloS one, 8(10):e77536, 2013.

Bibliography 53
[74] J Vernon Odom et al. Visual evoked potentials standard (2004). Documenta
ophthalmologica, 108(2):115–123, 2004.
[75] Nikolay V Manyakov et al. Sampled sinusoidal stimulation profile and multichan-
nel fuzzy logic classification for monitor-based phase-coded ssvep brain–computer
interfacing. Journal of neural engineering, 10(3):036011, 2013.
[76] Fabrizio Beverina, Giorgio Palmas, Stefano Silvoni, Francesco Piccione, Silvio
Giove, et al. User adaptive bcis: Ssvep and p300 based interfaces. PsychNol-
ogy Journal, 1(4):331–354, 2003.
[77] Yosuke Kimura, Toshihisa Tanaka, Hiroshi Higashi, and Naoki Morikawa. Ssvep-
based brain–computer interfaces using fsk-modulated visual stimuli. IEEE Trans-
actions on Biomedical Engineering, 60(10):2831–2838, 2013.
[78] Pablo F Diez et al. Asynchronous BCI control using high-frequency SSVEP. Jour-
nal of neuroengineering and rehabilitation, 8(1):39, 2011.
[79] Jirı Karnık and Jakub Streit. Summary of available indoor location techniques.
IFAC-PapersOnLine, 49(25):311–317, 2016.
[80] Chouchang Yang and Huai-Rong Shao. Wifi-based indoor positioning. IEEE
Communications Magazine, 53(3):150–157, 2015.
[81] Dempster Andrew G Lim Samsung Moghtadaiee, Vahideh. Indoor localization
using fm radio signals: A fingerprinting approach. In Indoor Positioning and
Indoor Navigation (IPIN). IEEE, 2011.
[82] Janire Larranaga, Leire Muguira, Juan-Manuel Lopez-Garde, and Juan-Ignacio
Vazquez. An environment adaptive zigbee-based indoor positioning algorithm. In
Indoor Positioning and Indoor Navigation (IPIN), 2010 International Conference
on, pages 1–8. IEEE, 2010.
[83] S. Liu, Y. Jiang, and A. Striegel. Face-to-face proximity estimationusing bluetooth
on smartphones. IEEE Transactions on Mobile Computing, 13(4):811–823, April
2014. ISSN 1536-1233. doi: 10.1109/TMC.2013.44.
[84] Yuechun Chu and Aura Ganz. A uwb-based 3d location system for indoor en-
vironments. In Broadband Networks, 2005. BroadNets 2005. 2nd International
Conference on, pages 1147–1155. IEEE, 2005.
[85] L. M. Ni, Yunhao Liu, Yiu Cho Lau, and A. P. Patil. Landmarc: indoor location
sensing using active rfid. In Proceedings of the First IEEE International Conference
on Pervasive Computing and Communications, 2003. (PerCom 2003)., pages 407–
415, March 2003. doi: 10.1109/PERCOM.2003.1192765.

Bibliography 54
[86] Jaewoo Chung, Matt Donahoe, Chris Schmandt, Ig-Jae Kim, Pedram Razavai, and
Micaela Wiseman. Indoor location sensing using geo-magnetism. In Proceedings
of the 9th international conference on Mobile systems, applications, and services,
pages 141–154. ACM, 2011.
[87] Qian Lu, Xuewen Liao, Shulin Xu, and Wei Zhu. A hybrid indoor positioning
algorithm based on wifi fingerprinting and pedestrian dead reckoning. In Personal,
Indoor, and Mobile Radio Communications (PIMRC), 2016 IEEE 27th Annual
International Symposium on. IEEE, 2016.
[88] Ching-Chieh Chiu, Jen-Chieh Hsu, and Jenq-Shiou Leu. Implementation and
analysis of hybrid wireless indoor positioning with ibeacon and wi-fi. In Ultra
Modern Telecommunications and Control Systems and Workshops (ICUMT), 2016
8th International Congress on. IEEE, 2016.
[89] B. Rebsamen, E. Burdet, C. Guan, H. Zhang, C. L. Teo, Q. Zeng, C. Laugier, and
M. H. Ang Jr. Controlling a wheelchair indoors using thought. IEEE Intelligent
Systems, 22(2), March 2007. ISSN 1541-1672. doi: 10.1109/MIS.2007.26.
[90] M Shamim Hossain. Cloud-supported cyber–physical localization framework for
patients monitoring. IEEE Systems Journal, 2015.
[91] IndoorAtlas. Homepage. https://www.indooratlas.com/.
[92] M. Tomasini, S. Benatti, B. Milosevic, E. Farella, and L. Benini. Power line
interference removal for high-quality continuous biosignal monitoring with low-
power wearable devices. IEEE Journal, 2016. doi: 10.1109/JSEN.2016.2536363.
[93] V. Kartsch, S. Benatti, D. Rossi, and L. Benini. A wearable eeg-based drowsiness
detection system with blink duration and alpha waves analysis. In 8th International
IEEE EMBS Conference on Neural Engineering. IEEE, 2017.
[94] Richard W Homan, John Herman, and Phillip Purdy. Cerebral location of in-
ternational 1020 system electrode placement. Electroencephalography and Clin-
ical Neurophysiology, 66(4):376 – 382, 1987. ISSN 0013-4694. doi: https:
//doi.org/10.1016/0013-4694(87)90206-9.
[95] Yijun Wang, Zhiguang Zhang, Xiaorong Gao, and Shangkai Gao. Lead selection
for ssvep-based brain-computer interface. In Engineering in Medicine and Biology
Society, 2004. IEMBS’04. IEEE.
[96] Christoph Guger, Clemens Holzner, Christoph Gronegress, Gunther Edlinger, and
Mel Slater. Control of a smart home with a brain-computer interface. 2008.

Bibliography 55
[97] YONGWON Kim, NETIWIT Kaongoen, and SUNGHO Jo. Hybrid-bci smart
glasses for controlling electrical devices. In Society of Instrument and Control
Engineers of Japan (SICE), 2015 54th Annual Conference of the, pages 1162–
1166. IEEE, 2015.
[98] Abdul Saboor, Aya Rezeika, Piotr Stawicki, Felix Gembler, Mihaly Benda,
Thomas Grunenberg, and Ivan Volosyak. Ssvep-based bci in a smart home sce-
nario. In International Work-Conference on Artificial Neural Networks, pages
474–485. Springer, 2017.
[99] EPSON. Moverio BT-200. https://www.epson.it/products/
see-through-mobile-viewer/moverio-bt-200, 2018.
[100] Vuforia. Vuforia SDK for digital eyewear. https://library.vuforia.com/
articles/Training/Vuforia-for-Digital-Eyewear, 2018.
[101] Danhua Zhu, Jordi Bieger, Gary Garcia Molina, and Ronald M Aarts. A survey
of stimulation methods used in ssvep-based bcis. Computational intelligence and
neuroscience, 2010:1, 2010.
[102] Davide Rossi, Francesco Conti, Andrea Marongiu, Antonio Pullini, Igor Loi,
Michael Gautschi, Giuseppe Tagliavini, Alessandro Capotondi, Philippe Flatresse,
and Luca Benini. Pulp: A parallel ultra low power platform for next generation iot
applications. In Hot Chips 27 Symposium (HCS), 2015 IEEE, pages 1–39. IEEE,
2015.
[103] Nik Khadijah Nik Aznan, Stephen Bonner, Jason D Connolly, Noura Al Moubayed,
and Toby P Breckon. On the classification of ssvep-based dry-eeg signals via
convolutional neural networks. arXiv preprint arXiv:1805.04157, 2018.