© Mark E. Damon - All Rights Reserved Another Presentation © 2011 - All rights Reserved.

©2021
Ioanna Tsoulou
ALL RIGHTS RESERVED
ii
A SOCIAL-ECOLOGICAL APPROACH FOR HEAT ADAPTATION
OF SENIOR LOW-INCOME HOUSING
by
IOANNA TSOULOU
A dissertation submitted to the
School of Graduate Studies
Rutgers, The State University of New Jersey
In partial fulfillment of the requirements
For the degree of
Doctor of Philosophy
Graduate Program in Planning and Public Policy
Written under the direction of
Clinton J. Andrews
And approved by
____________________________
____________________________
____________________________
____________________________
New Brunswick, New Jersey
January, 2021
ii
ii
ABSTRACT OF THE DISSERTATION
A Social-Ecological Approach for Heat Adaptation of Senior Low-Income Housing
By IOANNA TSOULOU
Dissertation Director:
Clinton J. Andrews
As elevated summer temperatures increase in frequency and duration, they pose threats to
human health and well-being that differentially affect the most vulnerable urban
residents, including older adults in low-resource communities. The percentage of the
senior population living in cities is projected to increase in the US and a high proportion
are likely to live in poor housing conditions, which makes them more susceptible to
environmental challenges. In the 1995 Chicago heat wave, it was found that most of the
heat victims were low-income older adults living in highly urbanized neighborhoods,
with no access to air-conditioning. More recently, during Hurricane Irma, several heat-
related deaths in Florida were attributed to power outages that exacerbated an existing
medical condition by depriving residents of cooling. Such cases highlight the strong
institutional dimensions of heat adaptation at socially vulnerable sites and emphasize the
need to provide integrated solutions across spatial scales.
This research is about the real experiences and exposures of seniors living in a low-
income urban area in NJ, US during heat waves. The focus is on thermal and air quality
iii
iii
conditions in multi-family public housing, and the availability of mitigating affordances.
It employs a social-ecological systems framework that conceptualizes urban sites as
complex interacting social, natural and built environments, in order to document and
describe the relative roles of building systems, microclimate, social context and
individual agency in heat adaptation.
The social-ecological systems approach is found to be helpful as a descriptive and
diagnostic tool to guide study design, data collection and modeling, but also as a means
to identify cost-effective, integrated heat adaptation strategies at nested scales. In
particular, it is demonstrated that although indoor environments are critical in protecting
seniors from heat, there is value in investing in outdoor environments, which can function
as alternative shelters during heat wave periods. Furthermore, it is shown that heat
adaptation is not only subject to built-environment characteristics indoors and outdoors,
but also depends on how people interact with these resources and the extent to which they
receive support from social networks and community organizations.
Eventually, this research leads to the realization that heat adaptation pathways are found
at the very localized scales and inevitably include indoor-outdoor synergies, tied to
individual users, local actors and institutions. It concludes with a list of concrete
recommendations, through a set of behavioral and physical alterations for transforming
built environments in order to improve the thermal experiences of low-income seniors.
iv
iv
ACKNOWLEDGMENTS
I would like to express my sincerest gratitude to the many individuals who have
contributed to the completion of this dissertation. Starting with my advisor, Clinton J.
Andrews, I am deeply grateful for his invaluable guidance and support throughout the
years of the PhD, but also for his mentorship while pursuing my master’s at Bloustein.
From the first email I sent him back in 2012, he has trusted me and encouraged me in
pursuing graduate studies. He has been a true mentor, who has fundamentally shaped my
research development. I am also very grateful to my dissertation committee members,
Lyna Wiggins (Bloustein), Frank Felder (Bloustein) and Anu Ramaswami (Princeton), as
well as the Graduate Director Robert Noland for their valuable assistance, which
substantially helped me improve the quality of this thesis.
Special thanks also go to the Rutgers Center for Green Building (RCGB) team, especially
Jennifer Senick, Gediminas Mainelis, Deborah Plotnik and MaryAnn Sorensen Allacci
for their support in pursuing this thesis and the opportunity to expand my research
horizons and work in a variety of exciting projects over the years. I would also like to
kindly thank the residents and managers of HACE, who welcomed me and the rest of the
RCGB team in their community and fully supported this thesis. I further acknowledge the
gracious support from National Science Foundation for pursuing this work. Thanks also
to many colleagues from Bloustein, who made qualification exams and conferences fun!
A very special thanks goes to my friends and amazing people, Marilou, Anthi, Aretousa,
Chrysa, Tolis, Tasos, Matina, Savvas, Alejandro, Anastasoula, Gabriel, Thanasis,
Spencer, Giannis, Giannis and Giannis (!), Popi, Handi, Kostas, Miriam and Maria Sole,
v
v
who may be living in different parts of the world now, but made my life wonderful over
the years in NJ.
Final thanks go to my family with the hope that I have made them proud; thanks to my
parents Kostantina and Vasilis and my brother Ted for a lifetime of support and
inspiration, and thanks to my partner Dionysis for literally taking this journey together.
vi
vi
TABLE OF CONTENTS
ABSTRACT OF THE DISSERTATION ........................................................................................ ii
ACKNOWLEDGMENTS .............................................................................................................. iv
LIST OF TABLES ........................................................................................................................... x
LIST OF FIGURES ....................................................................................................................... xii
LIST OF ABREVIATIONS ......................................................................................................... xvi
1. Chapter 1 Introduction ............................................................................................................. 1
1.1 Research Background ............................................................................................................ 1
Impacts of Heat Waves on Urban Areas and Populations ....................................................... 1
The Socio-Ecological Dimensions of Heat Adaptation ........................................................... 3
1.2 Approach and Methodology .................................................................................................. 6
Research Questions and Hypotheses........................................................................................ 7
Methods ................................................................................................................................... 9
1.3 Research Contributions ........................................................................................................ 20
1.4 Research Structure ............................................................................................................... 22
2. Chapter 2 Forming a Heat-Wave Social-Ecological Framework .......................................... 24
2.1 Background .......................................................................................................................... 24
The Social-Ecological Systems Approach ............................................................................. 24
Cities as Social-Ecological Systems ...................................................................................... 27
2.2 Forming a Social-Ecological Framework for Heat Waves .................................................. 29
vii
vii
2.3 Applying the Social-Ecological Framework to the Study Community ............................... 32
Results .................................................................................................................................... 34
2.4 Discussion ............................................................................................................................ 43
3. Chapter 3 Indoor Environments: Thermal Conditions and Senior Resident Behaviors ........ 45
3.1 Background .......................................................................................................................... 45
Indoor Environment and Heat Vulnerability ......................................................................... 45
3.2 Methods ............................................................................................................................... 48
Data Analysis ......................................................................................................................... 48
3.3 Results .................................................................................................................................. 50
Indoor Thermal Performance ................................................................................................. 50
Regression Analysis of Indoor Heat Index ............................................................................ 64
3.4 Discussion ............................................................................................................................ 72
4. Chapter 4 Indoor Environments: Behaviors and Indoor Thermal and Air Quality Trade-offs
80
4.1 Background .......................................................................................................................... 80
Heat, Pollution and Health in Urban Environments .............................................................. 80
Determinants of Thermal Comfort and Air Quality in Indoor Environments ........................ 82
4.2 Methods ............................................................................................................................... 84
Data Analysis ......................................................................................................................... 85
4.3 Results .................................................................................................................................. 86
Indoor Thermal and Air Quality Conditions .......................................................................... 86
viii
viii
Variations Across and Within Sites ....................................................................................... 87
Window Opening Patterns: Thermal and Air Quality Trade-Offs ......................................... 94
4.4 Discussion .......................................................................................................................... 100
5. Chapter 5 Outdoor Environments: Site Amenities and Senior Activities ............................ 104
5.1 Background ........................................................................................................................ 104
Outdoor Environments: Landscape Design and Amenities ................................................. 104
5.2 Methods ............................................................................................................................. 107
Data Analysis ....................................................................................................................... 107
5.3 Results ................................................................................................................................ 108
Outdoor Activities and Temporal Patterns ........................................................................... 108
Regression Analysis of Indoor Occupancy .......................................................................... 115
5.4 Discussion .......................................................................................................................... 120
6. Chapter 6 Heat Adaptation Policy through a Social-Ecological Framework ....................... 123
6.1 Summary of Findings ......................................................................................................... 123
6.2 Revisiting the Social-Ecological Systems Approach ......................................................... 129
6.3 Synthesizing an Inventory of Integrated Policy for Heat Adaptation ................................ 130
Implications for Heat Adaptation Policy Addressing Behavioral Alterations ..................... 131
Implications for Heat Adaptation Policy Addressing Physical Alterations ......................... 134
6.4 Contributions and Future Directions .................................................................................. 140
APPENDIX A INTERVIEWS .................................................................................................... 143
Baseline Interview Protocol ..................................................................................................... 143
ix
ix
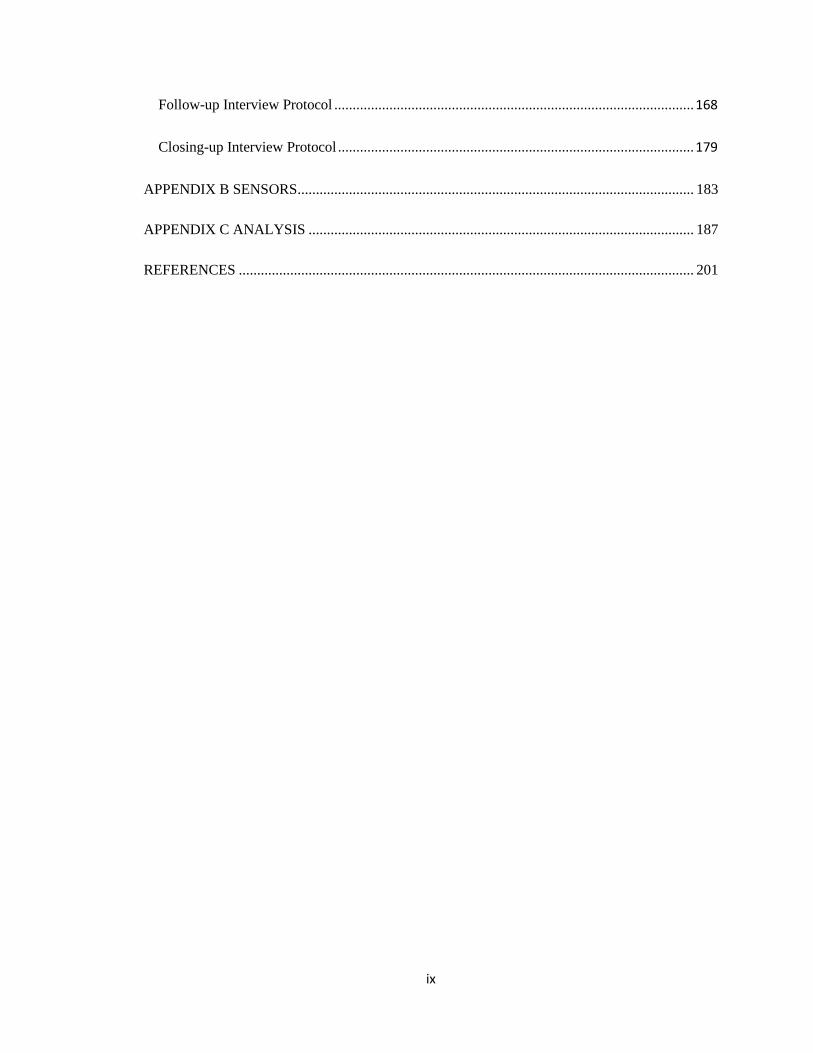
Follow-up Interview Protocol .................................................................................................. 168
Closing-up Interview Protocol ................................................................................................. 179
APPENDIX B SENSORS............................................................................................................ 183
APPENDIX C ANALYSIS ......................................................................................................... 187
REFERENCES ............................................................................................................................ 201
x
x
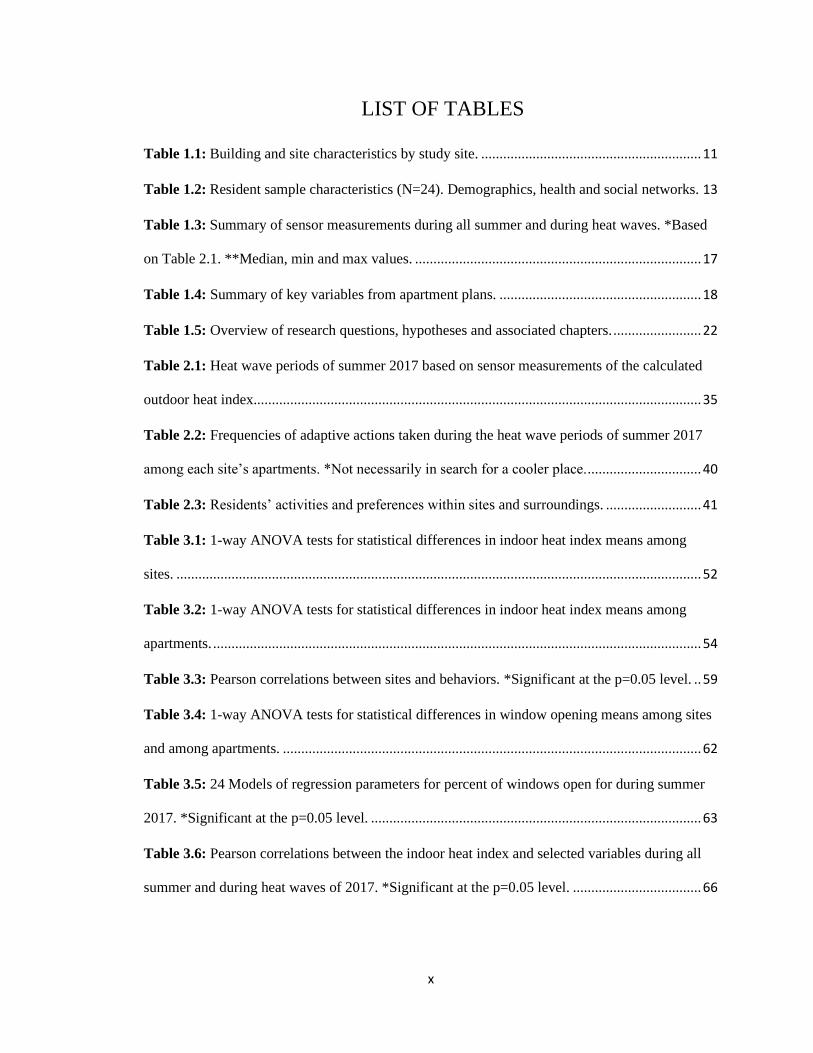
LIST OF TABLES
Table 1.1: Building and site characteristics by study site. ............................................................ 11
Table 1.2: Resident sample characteristics (N=24). Demographics, health and social networks. 13
Table 1.3: Summary of sensor measurements during all summer and during heat waves. *Based
on Table 2.1. **Median, min and max values. .............................................................................. 17
Table 1.4: Summary of key variables from apartment plans. ....................................................... 18
Table 1.5: Overview of research questions, hypotheses and associated chapters. ........................ 22
Table 2.1: Heat wave periods of summer 2017 based on sensor measurements of the calculated
outdoor heat index.......................................................................................................................... 35
Table 2.2: Frequencies of adaptive actions taken during the heat wave periods of summer 2017
among each site’s apartments. *Not necessarily in search for a cooler place. ............................... 40
Table 2.3: Residents’ activities and preferences within sites and surroundings. .......................... 41
Table 3.1: 1-way ANOVA tests for statistical differences in indoor heat index means among
sites. ............................................................................................................................................... 52
Table 3.2: 1-way ANOVA tests for statistical differences in indoor heat index means among
apartments. ..................................................................................................................................... 54
Table 3.3: Pearson correlations between sites and behaviors. *Significant at the p=0.05 level. .. 59
Table 3.4: 1-way ANOVA tests for statistical differences in window opening means among sites
and among apartments. .................................................................................................................. 62
Table 3.5: 24 Models of regression parameters for percent of windows open for during summer
2017. *Significant at the p=0.05 level. .......................................................................................... 63
Table 3.6: Pearson correlations between the indoor heat index and selected variables during all
summer and during heat waves of 2017. *Significant at the p=0.05 level. ................................... 66
xi
xi
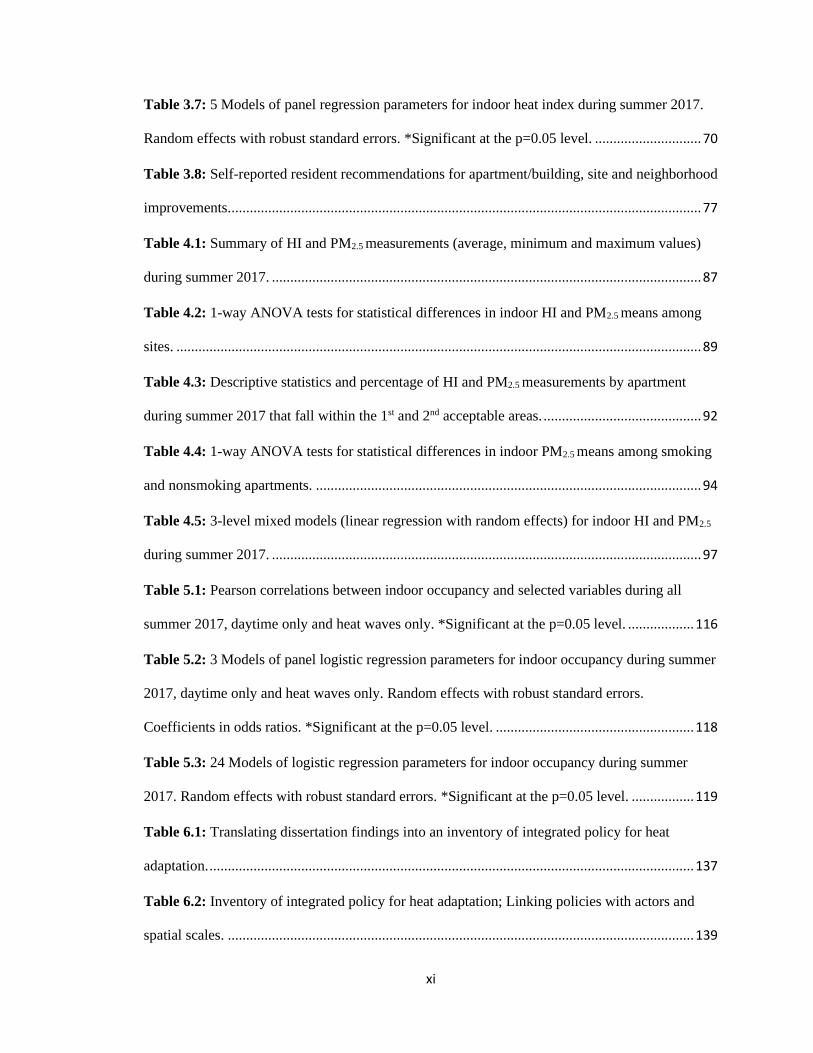
Table 3.7: 5 Models of panel regression parameters for indoor heat index during summer 2017.
Random effects with robust standard errors. *Significant at the p=0.05 level. ............................. 70
Table 3.8: Self-reported resident recommendations for apartment/building, site and neighborhood
improvements. ................................................................................................................................ 77
Table 4.1: Summary of HI and PM2.5 measurements (average, minimum and maximum values)
during summer 2017. ..................................................................................................................... 87
Table 4.2: 1-way ANOVA tests for statistical differences in indoor HI and PM2.5 means among
sites. ............................................................................................................................................... 89
Table 4.3: Descriptive statistics and percentage of HI and PM2.5 measurements by apartment
during summer 2017 that fall within the 1st and 2nd acceptable areas. ........................................... 92
Table 4.4: 1-way ANOVA tests for statistical differences in indoor PM2.5 means among smoking
and nonsmoking apartments. ......................................................................................................... 94
Table 4.5: 3-level mixed models (linear regression with random effects) for indoor HI and PM2.5
during summer 2017. ..................................................................................................................... 97
Table 5.1: Pearson correlations between indoor occupancy and selected variables during all
summer 2017, daytime only and heat waves only. *Significant at the p=0.05 level. .................. 116
Table 5.2: 3 Models of panel logistic regression parameters for indoor occupancy during summer
2017, daytime only and heat waves only. Random effects with robust standard errors.
Coefficients in odds ratios. *Significant at the p=0.05 level. ...................................................... 118
Table 5.3: 24 Models of logistic regression parameters for indoor occupancy during summer
2017. Random effects with robust standard errors. *Significant at the p=0.05 level. ................. 119
Table 6.1: Translating dissertation findings into an inventory of integrated policy for heat
adaptation. .................................................................................................................................... 137
Table 6.2: Inventory of integrated policy for heat adaptation; Linking policies with actors and
spatial scales. ............................................................................................................................... 139
xii
xii
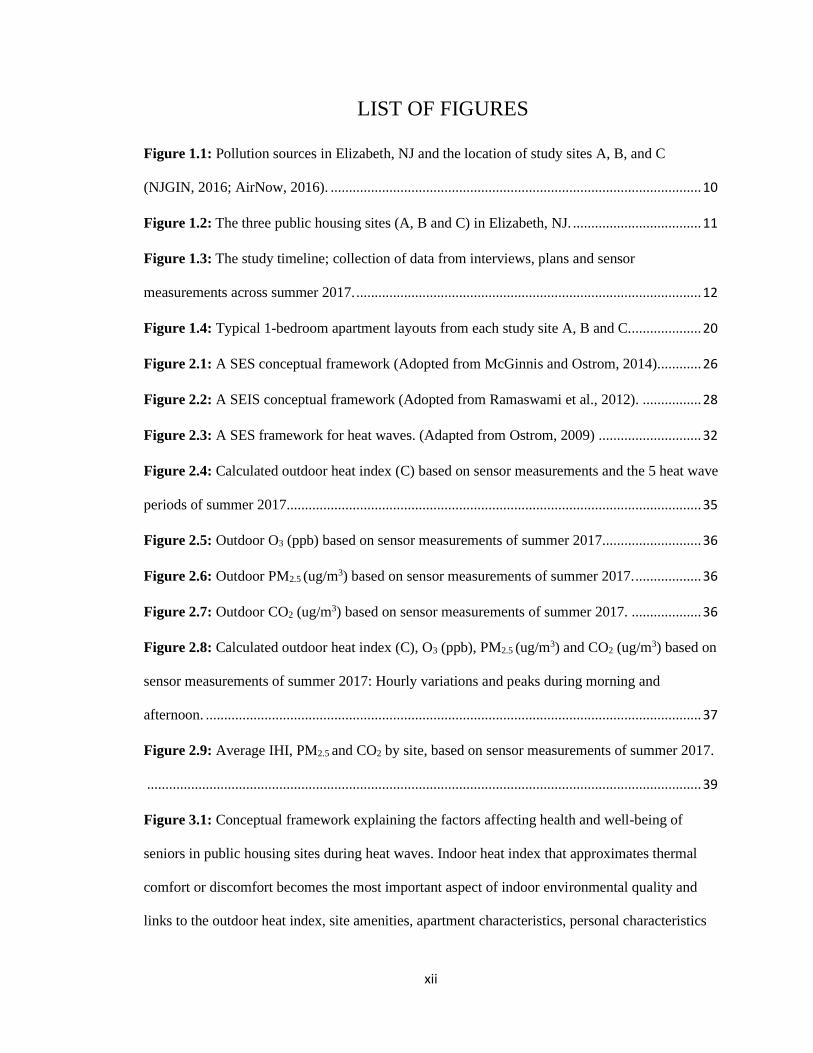
LIST OF FIGURES
Figure 1.1: Pollution sources in Elizabeth, NJ and the location of study sites A, B, and C
(NJGIN, 2016; AirNow, 2016). ..................................................................................................... 10
Figure 1.2: The three public housing sites (A, B and C) in Elizabeth, NJ. ................................... 11
Figure 1.3: The study timeline; collection of data from interviews, plans and sensor
measurements across summer 2017. .............................................................................................. 12
Figure 1.4: Typical 1-bedroom apartment layouts from each study site A, B and C. ................... 20
Figure 2.1: A SES conceptual framework (Adopted from McGinnis and Ostrom, 2014). ........... 26
Figure 2.2: A SEIS conceptual framework (Adopted from Ramaswami et al., 2012). ................ 28
Figure 2.3: A SES framework for heat waves. (Adapted from Ostrom, 2009) ............................ 32
Figure 2.4: Calculated outdoor heat index (C) based on sensor measurements and the 5 heat wave
periods of summer 2017................................................................................................................. 35
Figure 2.5: Outdoor O3 (ppb) based on sensor measurements of summer 2017. .......................... 36
Figure 2.6: Outdoor PM2.5 (ug/m3) based on sensor measurements of summer 2017. .................. 36
Figure 2.7: Outdoor CO2 (ug/m3) based on sensor measurements of summer 2017. ................... 36
Figure 2.8: Calculated outdoor heat index (C), O3 (ppb), PM2.5 (ug/m3) and CO2 (ug/m3) based on
sensor measurements of summer 2017: Hourly variations and peaks during morning and
afternoon. ....................................................................................................................................... 37
Figure 2.9: Average IHI, PM2.5 and CO2 by site, based on sensor measurements of summer 2017.
....................................................................................................................................................... 39
Figure 3.1: Conceptual framework explaining the factors affecting health and well-being of
seniors in public housing sites during heat waves. Indoor heat index that approximates thermal
comfort or discomfort becomes the most important aspect of indoor environmental quality and
links to the outdoor heat index, site amenities, apartment characteristics, personal characteristics
xiii
xiii
and occupant actions. Occupant actions are subject to personal characteristics and the
indoor/outdoor resources available to the residents. ...................................................................... 49
Figure 3.2: Daily averages of calculated indoor heat index (C) based on sensor measurements by
site during summer 2017. ............................................................................................................... 51
Figure 3.3: Calculated indoor heat index (C) based on sensor measurements during summer and
during heat waves of 2017. Green indicates apartments with the lowest IHIs, yellow corresponds
to mid values and orange to high IHIs that exceed 27 C. 13 apartments exceed the threshold of 27
C during the heat wave periods. Apartments A3 and A5 (highlighted with asterisk) have
considerably higher heat indexes compared to apartments A4, B11 and C4 (highlighted in green).
....................................................................................................................................................... 53
Figure 3.4: Calculated indoor heat index (C) based on sensor measurements in selected
apartments during summer 2017: Hourly variations. ..................................................................... 55
Figure 3.5: Self-reported general thermal comfort during summer of 2017 from the baseline
interviews. A high percentage of residents located in site A report thermal discomfort, followed
by residents in C and B. ................................................................................................................. 56
Figure 3.6: Self-reported key adaptive behaviors during summer and during heat waves of 2017.
Windows indicates window opening. ............................................................................................ 57
Figure 3.7: Self-reported time of day variations in behaviors during all summer 2017 and during
heat waves. Windows indicates window opening. ......................................................................... 58
Figure 3.8: Comparison of self-reported key adaptive behaviors among sites during heat waves
of 2017 from the follow-up interviews. (Windows indicates window opening). .......................... 59
Figure 3.9: Calculated daily average percentage of window opening based on sensor
measurements by apartment during all summer and during heat waves of 2017. Green indicates
apartments with the lowest IHIs, yellow corresponds to mid values and orange to high IHIs that
exceed the threshold of 27 C. WO percentages and ranges are higher in A apartments and this
xiv
xiv
pattern repeats during heat waves. Apartment A5 (highlighted with asterisk) that has no A/C unit
has the widest range of window opening percentages. In contrast, apartment A4 (highlighted in
green), which has the lowest indoor HI, has the smallest percentage and range. .......................... 61
Figure 4.1: Outdoor and indoor HI ranges during summer 2017 based on environmental
monitoring with HW periods highlighted. ..................................................................................... 86
Figure 4.2: Outdoor and indoor PM2.5 ranges during summer 2017 based on environmental
monitoring with HW periods highlighted. ..................................................................................... 87
Figure 4.3: Indoor HI and PM2.5 ranges during summer 2017 based on environmental monitoring
grouped by site. Shaded areas indicate the 1st and 2nd acceptable areas constructed based on
ASHRAE and US EPA thresholds for HI and PM2.5. .................................................................... 88
Figure 4.4: Indoor HI and PM2.5 ranges during summer 2017 based on environmental monitoring
grouped by apartment. Shaded areas indicate the 1st and 2nd acceptable areas constructed based on
ASHRAE and US EPA thresholds for HI and PM2.5. .................................................................... 91
Figure 4.5: Percentage of window opening during summer 2017 based on behavioral monitoring
grouped by site. .............................................................................................................................. 95
Figure 4.6: Percentage of window opening during summer 2017 based on behavioral monitoring
grouped by apartment. ................................................................................................................... 96
Figure 4.7: Percentage of kitchen and living room WO coefficients for indoor HI and PM2.5:
linear regression results.................................................................................................................. 99
Figure 4.8: Temporal patterns of bedroom and living room WO in 3 apartments of site A. [1
indicates window opening and 0 indicates window closing.] ...................................................... 100
Figure 5.1: Study Site A and its Surroundings ((NJGIN), 2016; Maps, 2017). .......................... 109
Figure 5.2: Study Site B and its Surroundings ((NJGIN), 2016; Maps, 2017). .......................... 110
Figure 5.3: Study Site C and its Surroundings ((NJGIN), 2016; Maps, 2017). .......................... 110
xv
xv
Figure 5.4: Visual network of self-reported outdoor destinations of seniors during summer of
2017 from the baseline and follow-up interviews. The most popular destinations are highlighted
with green on the left and the most active residents are highlighted with green on the right. ..... 111
Figure 5.5: Self-reported outdoor destinations of seniors during summer and during heat waves
of 2017 from the baseline and follow-up interviews: variations by site. ..................................... 113
Figure 5.6: Self-reported time of day variations in outdoor activities by site during summer 2017.
Residents in sites A and B mostly went out in the afternoon....................................................... 114
xvi
xvi
LIST OF ABREVIATIONS
A/C: Air Conditioner
ASHRAE: American Society of Heating, Refrigerating and Air-Conditioning Engineers
CAS: Complex Adaptive Systems
CO2: Carbon Dioxide
HACE: Housing Authority of the City of Elizabeth
HI: Heat Index
HVAC: Heating, Ventilating and Air-Conditioning
HW: Heat Wave
IAQ: Indoor Air Quality
IEQ: Indoor Environmental Quality
IHI: Indoor Heat index
NOAA: National Oceanic and Atmospheric Administration
NO2: Nitrogen Dioxide
OB: Occupant Behavior
OHI: Outdoor Heat index
OSHA: Occupational Safety and Health Administration
O3: Ozone
PM: Particulate Matter
PM2.5: Particulate Matter (diameter<2.5 micrometers)
PM10: Particulate Matter (diameter<10 micrometers)
SEIS: Social-Ecological-Infrastructural System
SES: Social-Ecological System
UHI: Urban Heat Island
WO: Window Opening
1
1. Chapter 1 Introduction
This chapter discusses the impacts of heat waves on urban areas and populations and
explores past research and current knowledge gaps on the social and physical factors
affecting heat coping processes of low-income seniors. It then identifies the socio-
ecological dimensions of heat adaptation, which leads to the initial premise of this
research that senior public-housing sites can be conceptualized as social-ecological
systems. Arguing that such an approach can be helpful in understanding the interactions
between actors, infrastructure and the environment and eventually in identifying
pathways for heat adaptation, it then lays out the research questions and associated
hypotheses. It proceeds by presenting the case study and data collection process and
concludes by summarizing the research contributions.
1.1 Research Background
Impacts of Heat Waves on Urban Areas and Populations
Our changing climate is increasing the frequency of extreme heat events, which cause
both local and global impacts (IPCC, 2014; Horton et al., 2014; Stone, Vargo and
Habeeb, 2012). Urban environments experience aggravated consequences of heat, due to
high human population concentrations and ubiquitous heat absorbing surfaces, such as
asphalt, concrete, metal and stone that cover cities, which produce higher surface air
temperatures via the urban heat island effect (UHI) (Knowlton et al., 2007; Rosenthal,
2010). This in turn translates into higher energy demand and worsened air quality, so that
ground-level ozone and particulate matter (PM) increase during heat waves (Kalisa et al.,
2018; Steeneveld et al., 2018, Peterson et al., 2014; Jacob and Winner, 2009). Residents
are exposed to health-associated risks related to both heat stress and air pollution’s effects
2
on the respiratory tract, such as damage to the lungs, bronchitis, emphysema and asthma,
which link to ozone and PM levels (EPA, 2012; EPA, 2015). This long causal chain is
especially likely to affect those suffering from chronic, pre-existing heart and lung
conditions, children and the elderly (EPA, 2015; Horton et al., 2014, Kovats and Hajat,
2008).
According to the Intergovernmental Panel on Climate Change, vulnerability to climate
change includes both the sensitivity of socioeconomic and biophysical systems and their
ability to cope with actual or expected impacts of climate change (He et al., 2019; IPCC,
2014). Heat vulnerability at the individual level is influenced by age, gender, health
status, race, income, and educational levels (Bélanger et al., 2015; Bouchama et al., 2007)
that are often linked to location attributes and built environment characteristics (Kenny et
al., 2010; Phadke, Manning and Burlanger, 2015; Reid et al., 2009; Zanobetti et al.,
2012). Access to resources, the condition of human settlements and indoor/outdoor living
conditions like the absence of air-conditioning, may increase thermal discomfort and the
health risk from heat (Reid et al., 2009). Lastly, indoor living conditions and the indoor
environment are particularly important, considering that people, and especially seniors,
spend about 90% of their time indoors (ASHRAE, 2011; Klepeis et al., 2001; Spalt et al.,
2016).
The percentage of the senior population living in cities is projected to increase in the US
and a proportion are likely to live in poor housing conditions (Arnberger et al., 2017;
Joint Center for Housing Studies, Harvard, 2016), which makes them more susceptible to
environmental challenges. Vandentorren et al. (2006) found that during the 2003 heat
wave in France, lack of thermal insulation and being on the top floor were among the
3
most important housing characteristics associated with mortality in elderly people. Diaz
et al. (2018) showed that improvements in building systems, such as the installation of
air-conditioning, can lower the impact of heat on senior mortality. More recently, Issa et
al. (2018) found that during Hurricane Irma, several heat-related deaths in Florida, USA
were attributed to power outages that exacerbated an existing medical condition by
depriving senior residents of cooling. These findings suggest that vulnerable populations,
such as the elderly, should be prioritized during heat events and that more research is
needed to understand the thermal conditions experienced by seniors in low-income
housing and the factors that affect them (Nahlik et al., 2017).
The Socio-Ecological Dimensions of Heat Adaptation
As governments engage in long-term climate planning to mitigate heat, local authorities
and organizations strive to find immediate cost-effective ways to support their most
vulnerable populations and infrastructure (Phadke, Manning and Burlager, 2015). Much
research has recognized that when temperatures are up, low-income seniors are among
the most vulnerable groups (see Bélanger et al., 2015; Horton et al., 2014, Kovats and
Hajat, 2008; Phadke, Manning and Burlager, 2015). The indoor environment is
particularly important and a better understanding of the actual indoor thermal conditions
experienced by low-income seniors and occupant behavior can help forming realistic
policies and interventions to reduce the risk of overheating (Klingsborough, Jenkins and
Hall, 2017; Kuras et al., 2017).
Yet, different research communities offer their own perspectives in coping with heat and
often, those efforts are not aligned among disciplines and only partly address heat
vulnerability. Urban planning and public policy-oriented literature usually concentrates
4
around the urban heat island (UHI) and related mitigation (see Hondula, Georgescu and
Balling, 2014; McMichael et al., 2008; Parsaee et al., 2019; Steeneveld et al., 2018; Stone
et al., 2014; Ziter et al., 2019), but does not focus on indoor living conditions. Likewise,
building science research often focuses on building envelope modifications to improve
the indoor thermal performance (see Bauwens and Roels, 2013; Mohammad and Shea,
2013; Nahilik et al., 2016), but may not include the occupants’ comfort and behaviors,
while cost-effective and easily accessible building retrofits are scarce. Lastly, thermal
comfort-related studies, although advanced in occupant behavior and comfort models
(see Escandon, Suarez and Sendra, 2019; Kim, Schiavon and Brager, 2018; Peng, Nagy
and Schluter, 2019), do not often address the adaptive responses of seniors in low-income
sites (see Giamalaki and Kolokotsa, 2019; Mendez et al., 2015; Terés-Zubiaga, Erkoreka
and Sala, 2013).
Heat adaptation described as the adjustment process to heat and its effects (Hondula et
al., 2015), is challenging at socially vulnerable sites, as there are fewer resources, guides
and institutions to provide support (Carmin, Nadkarni and Rhie, 2012). The availability
of residential air conditioning is recognized by many as one of the most effective
adaptation measures (see Luber and McGeehin, 2008; Sailor et al., 2019) and based on
past heat-disaster reports, it is argued that heat-related senior morbidity and mortality
would be avoided with access to functioning A/C systems (Sailor et al., 2019). Yet, about
13% of the US households still lack A/C (EIA, 2015) and those households are
disproportionately poor, while landlords are not required to provide cooling in most
places (Fraser et al., 2017; HACE, 2017). Furthermore, even if low-income households
have access to air conditioning, there may be additional limitations, such as the cost of
5
running the A/C, as well as the effectiveness of it (e.g. small window units covering
single rooms) (Belanger et al., 2015; Green et al., 2019). Lastly, A/C use may not be a
preferred adaptation action, as it increases energy demand and greenhouse gas emissions
(Kingsborough, Jenkins and Hall, 2017).
These limitations indicate that the heat problem has strong institutional dimensions and
show that adaptation to heat goes beyond residential access to air conditioning, insights
which are especially important in disadvantaged communities with significant financial
restrictions (Belanger et al., 2015). The role of local organizations, such as community
centers, non-profit and volunteer groups may be vital, as they can assist with small-scale
initiatives like financial assistance programs to pay A/C bills (Yardley, Sigal and Kenny,
2011). Many studies also highlight the spatial scales of heat adaptation; Kingsborough,
Jenkins and Hall (2017) suggest that land-use planning, building design, occupant
behavior and community resilience should be considered together, as well as the
relationships between them and their effects on health and residential comfort should be
evaluated. Likewise, Yardley, Sigal and Kenny (2011) propose a socio-ecological
approach that would help identify the various factors contributing to heat vulnerability
and assist in formulating adaptation plans that fit the particular social and physical
characteristics of communities. Lastly, Barnett et al. (2013) approach people, housing and
neighborhood as a complex, social-ecological system and argue that heat-related health
risk in social housing can be reduced through a combination of urban and building-level
upgrades. They further show how different people at different scales can affect those
upgrades and consequently heat adaptation outcomes.
6
1.2 Approach and Methodology
Forming an effective heat adaptation policy to reduce the risk of overheating for seniors
living in low-income sites needs a focus on the very localized scales and a guiding
framework to address the complex interactions among humans, infrastructure and the
climate. The role of infrastructure systems is critical both indoors and outdoors, but
different actors and institutions become important at each scale. Indoor environments can
be highly influenced by resident behaviors and activities, while outdoor spaces involve
additional actors, such as local authorities and organizations. At the same time, individual
houses or buildings are nested within sites, which are in turn part of larger urban units,
and residents and local organizations move across those scales.
This dissertation grasps on these issues and examines senior low-income sites and their
real-time performance during heat waves, specifically impacts on thermal and air quality
conditions, human health and well-being. It draws from an empirical study of a public
housing community and its elderly residents in Elizabeth, NJ, USA.
The framework for this research stems from urban social-ecological systems (SESs)
approaches that view cities as complex interacting social, natural and built environments.
It conceptualizes senior, low-income sites as SESs, in order to document and describe the
interactions among social-ecological factors, such as the local climate, infrastructure,
social context and individual agency, on heat coping processes. It then seeks to better
understand the relative roles of those factors in heat adaptation. Eventually, the aim is to
provide an integrated policy that can guide interventions to assist low-income seniors in
coping with heat.
7
This dissertation focuses on the site as a suitable unit of analysis, because it is a well-
defined geographical entity that physically represents the indoor and immediate outdoor
environments where seniors live. Therefore, it allows for a closer examination of their
infrastructure characteristics. At the same time, the site serves as a good analogy of a
SES, since it involves the interactions between multiple individuals at nested spatial
scales, including residents, managers, operators, local authorities and organizations. In
other words, it makes the role of human agency in heat adaptation visible.
Research Questions and Hypotheses
The research questions of this work are guided by the premise that senior low-income
sites can be conceptualized as SESs. From that I ask:
1. What social and ecological components become relevant in the case of senior
low-income sites suffering from heat waves?
This primary question is of particular importance, as it frames the remaining research. It
seeks to connect SESs with heat waves and provide a descriptive social-ecological
structure to the senior public housing community. This includes organizing the spatial
scales (e.g. indoors and outdoors) in which seniors move and identifying the
infrastructure characteristics (e.g. dwelling envelopes, site landscaping) that influence
environmental conditions within the site boundaries, as well as the social actors (e.g.
senior residents, managing authority, local organizations) and the ways in which they
may affect heat coping processes. Once the SES framework is empirically derived, I aim
to explore which of these social and ecological components have a higher influence to
thermal and air quality conditions. The main hypotheses here are that 1) heat waves
require actors to adapt and change key behaviors, and that 2) some SES parts (e.g.
8
resident activities, indoor affordances, outdoor amenities) give sites an advantage in
increasing the chances of heat adaptation.
2. What is the role of indoor environments in mediating heat and which social
and ecological factors influence indoor environmental conditions?
Drawing on the previous inquiry and the SES’s spatial scales, this question attempts to
document the indoor environmental conditions experienced by low-income seniors and
examine variations across different dwellings. It further aims to identify the social-
ecological factors contributing to those variations and explain their interactions, from the
outdoor climate and occupant adaptive actions to the indoor and outdoor amenities, as
well as their relative effects and trade-offs on indoor thermal and air quality performance.
Here, I hypothesize that 1) outdoor environmental conditions can influence indoor
environmental conditions, and certain site and apartment characteristics can moderate or
strengthen this relationship, that 2) occupants engage in adaptive actions that can also
influence indoor environmental conditions and are subject to personal characteristics, but
also to the indoor and outdoor resources they have available, and that 3) certain occupant
actions have a trade-off on indoor thermal and air quality performance.
3. What is the value of outdoor environments in heat adaptation?
Following the exploration of indoor environmental conditions, this question aims at
investigating the extent to which, adjacent outdoor amenities (e.g. site landscaping) can
support seniors in coping with heat. Therefore, it focuses on mapping the outdoor
preferences and destinations of seniors within and outside the site boundaries, observing
the temporal patterns of those activities and documenting how and why residents interact
9
with them. The hypotheses here are that 1) if outdoor spaces are provided to them,
seniors use them, assuming they are in close proximity, and that 2) these spaces may
serve as alternatives in sites where indoor environments are inadequate in providing
shelter from heat.
4. How can we empirically inform policy towards heat adaptation through a
social-ecological systems lens?
This last question concludes the dissertation by assessing the value of taking an
integrated social-ecological systems approach towards heat adaptation. Through
discussing the findings from the previous questions, it aims to translate them into a set of
realistic policies that can guide cost-effective and easily accessible interventions to assist
elderly low-income communities in adapting to heat. The main hypothesis here is that the
heat waves problem needs integrated solutions across scales; from changes to residents’
habits, to building envelope modifications and building operations, and to outdoor space
alterations.
Methods
In order to examine the themes and issues raised in the research questions above, I
undertake field work in Elizabeth, NJ, USA. The focus is on three public housing sites
operated by the Housing Authority of the City of Elizabeth (HACE). Longitudinal
environmental and behavioral data were collected between May - October 2017.
Elizabeth is among the areas with the most severe urban heat island and worst air quality
levels in the state, based on high 24-hr average concentrations (29.1 μg/m3), and the
highest annual average (9.58 μg/m3) ambient particulate matter (PM2.5) concentration
10
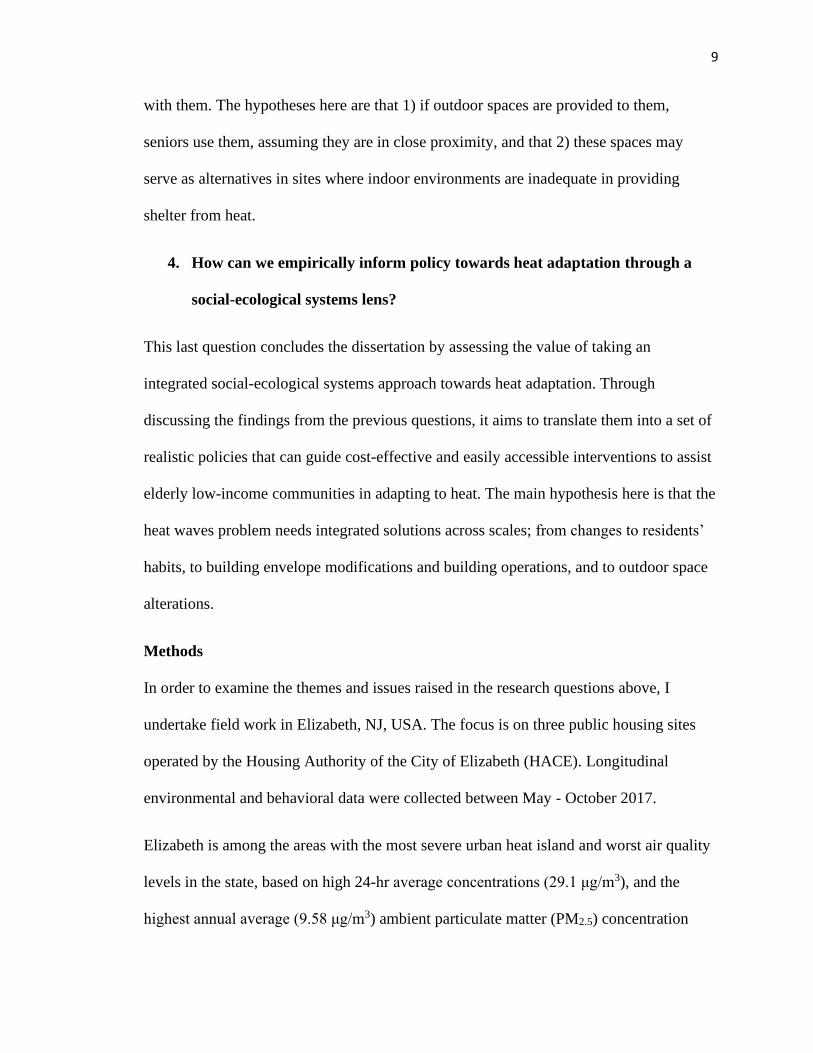
among NJ stations (NJDEP, 2017). As shown in Figure 1.1, the New Jersey Turnpike (I-
95), the Bayshore petrochemical complex, the Port Elizabeth Marine Terminal, the
Newark Liberty International Airport and a highly urbanized and industrialized profile,
all contribute to the city’s air pollution and thermal stresses, which can be exacerbated
during extreme heat periods (Kalisa et al., 2018; Steeneveld et al., 2018, Peterson et al.,
2014).
Figure 1.1: Pollution sources in Elizabeth, NJ and the location of study sites A, B, and C
(NJGIN, 2016; AirNow, 2016).
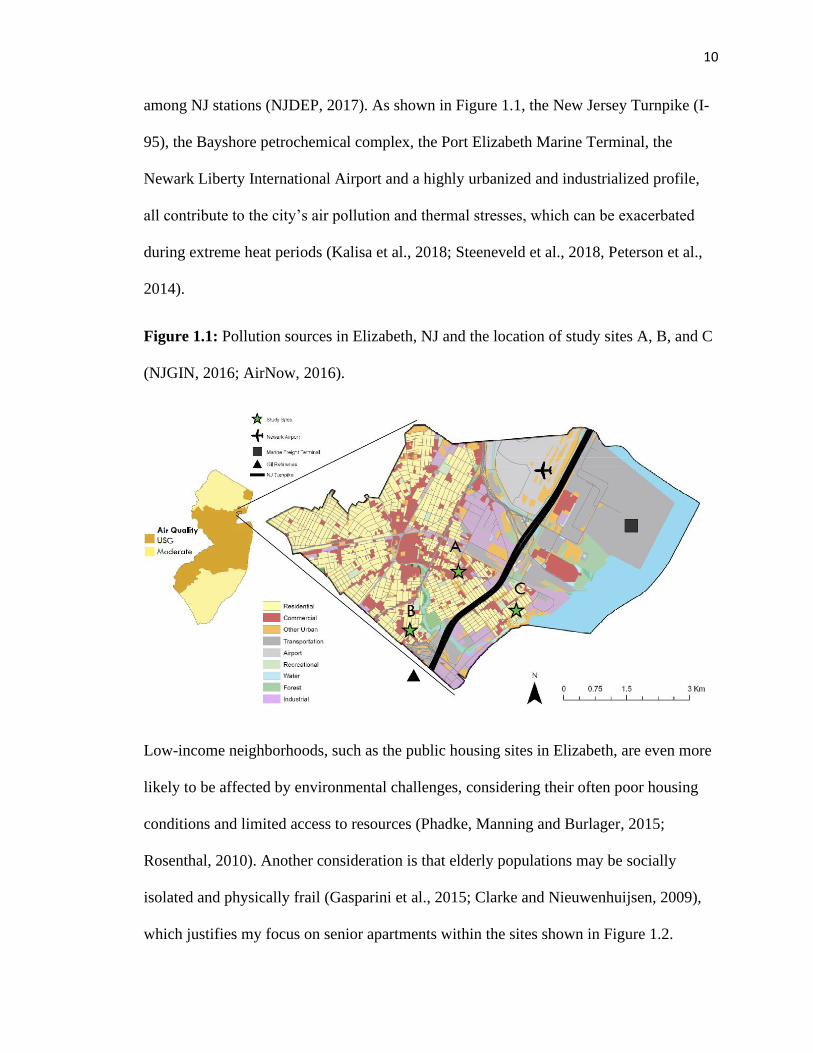
Low-income neighborhoods, such as the public housing sites in Elizabeth, are even more
likely to be affected by environmental challenges, considering their often poor housing
conditions and limited access to resources (Phadke, Manning and Burlager, 2015;
Rosenthal, 2010). Another consideration is that elderly populations may be socially
isolated and physically frail (Gasparini et al., 2015; Clarke and Nieuwenhuijsen, 2009),
which justifies my focus on senior apartments within the sites shown in Figure 1.2.
11
Figure 1.2: The three public housing sites (A, B and C) in Elizabeth, NJ.
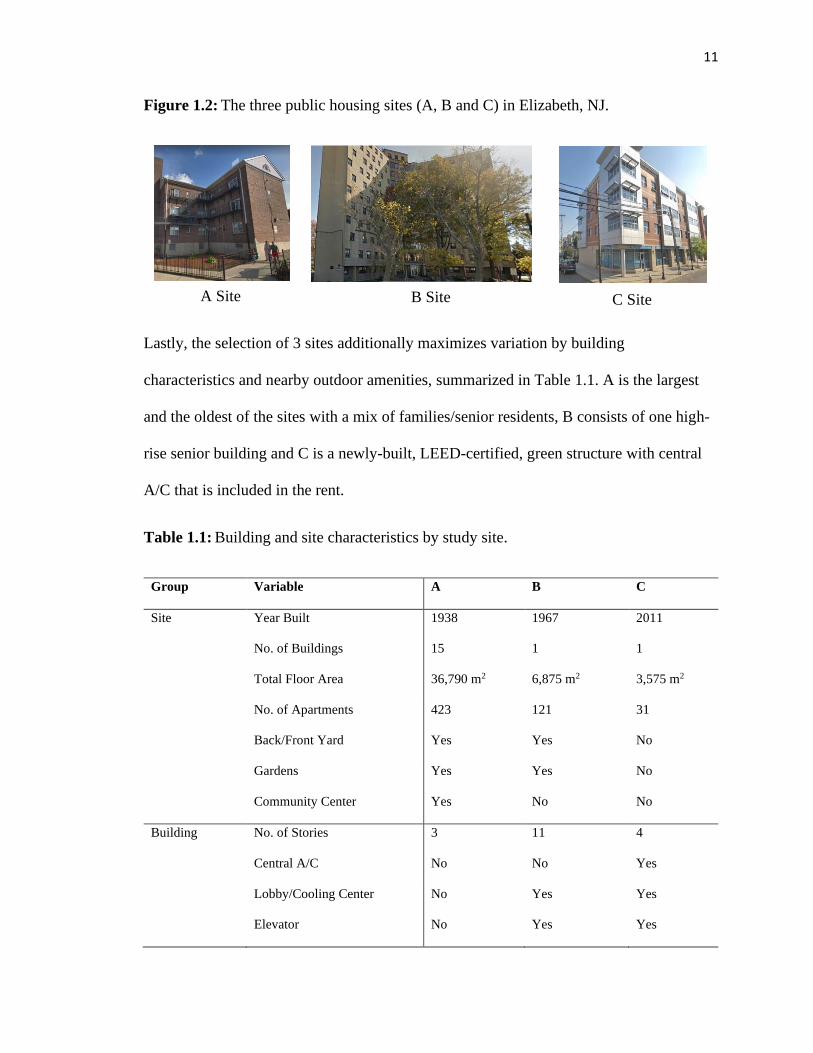
Lastly, the selection of 3 sites additionally maximizes variation by building
characteristics and nearby outdoor amenities, summarized in Table 1.1. A is the largest
and the oldest of the sites with a mix of families/senior residents, B consists of one high-
rise senior building and C is a newly-built, LEED-certified, green structure with central
A/C that is included in the rent.
Table 1.1: Building and site characteristics by study site.
Group Variable A B C
Site Year Built 1938 1967 2011
No. of Buildings 15 1 1
Total Floor Area 36,790 m2 6,875 m2 3,575 m2
No. of Apartments 423 121 31
Back/Front Yard Yes Yes No
Gardens Yes Yes No
Community Center Yes No No
Building No. of Stories 3 11 4
Central A/C No No Yes
Lobby/Cooling Center No Yes Yes
Elevator No Yes Yes
L Site
F SiteM SiteB Site A Site C Site
12
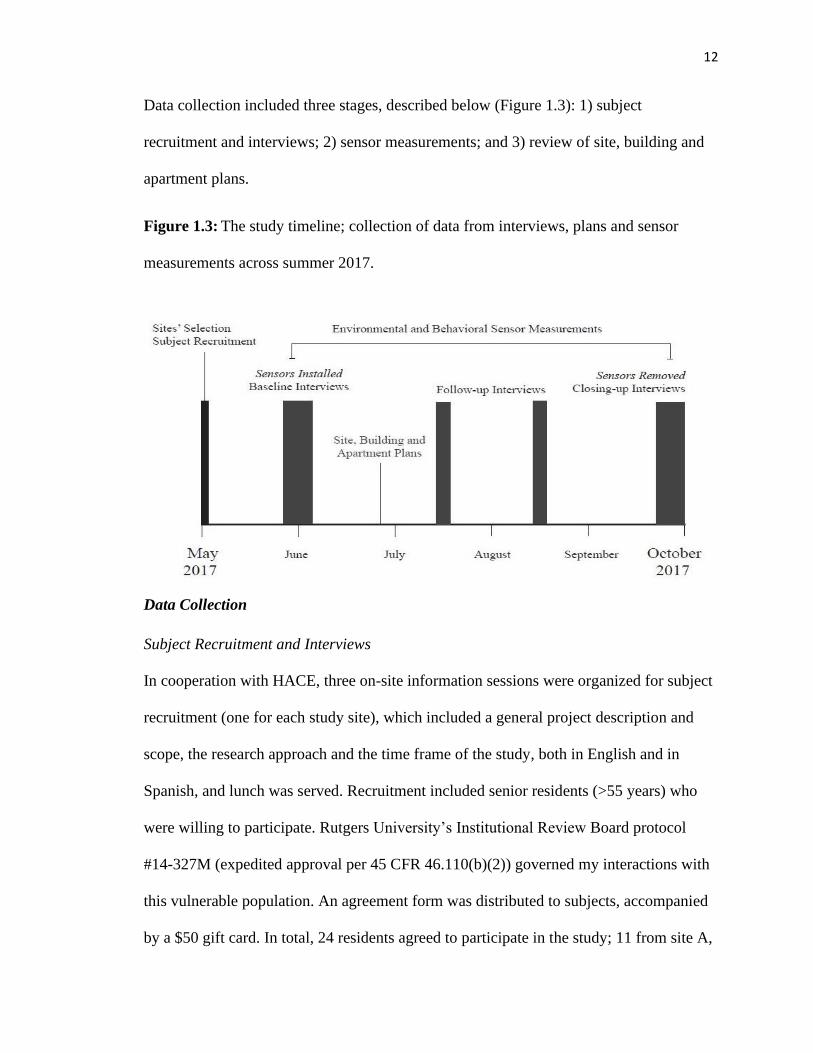
Data collection included three stages, described below (Figure 1.3): 1) subject
recruitment and interviews; 2) sensor measurements; and 3) review of site, building and
apartment plans.
Figure 1.3: The study timeline; collection of data from interviews, plans and sensor
measurements across summer 2017.
Data Collection
Subject Recruitment and Interviews
In cooperation with HACE, three on-site information sessions were organized for subject
recruitment (one for each study site), which included a general project description and
scope, the research approach and the time frame of the study, both in English and in
Spanish, and lunch was served. Recruitment included senior residents (>55 years) who
were willing to participate. Rutgers University’s Institutional Review Board protocol
#14-327M (expedited approval per 45 CFR 46.110(b)(2)) governed my interactions with
this vulnerable population. An agreement form was distributed to subjects, accompanied
by a $50 gift card. In total, 24 residents agreed to participate in the study; 11 from site A,
13
9 from site B and 4 from site C. Each resident agreed to have sensors placed in their
apartment and respond to a series of baseline, follow-up and closing-up interviews. Each
apartment/resident in the sample was given a unique identifier to preserve anonymity and
the interview data were stored online.
The baseline interviews were 50-min in-person, once for each participant during May-
June 2017; sensors were installed at the same time. The baseline questionnaire included
open and close-ended questions, related to:
• Demographics, general health and supportive social networks
• Apartment characteristics
• Environmental comfort and preferences
• Common behaviors and typical schedule
The baselines generated a total of 24 questionnaires; key statistics are summarized in
Table 1.2. The Interview Protocol and coding can be found in Appendix A.
Demographics show that the sample is dominated by females, and while gender is
considered to have an insignificant effect on thermal preferences (see ASHRAE, 2017),
one recent literature review suggested that female subjects may be preferred over males,
due to their higher levels of dissatisfaction with the indoor thermal environments
(Karjalainen, 2012).
Table 1.2: Resident sample characteristics (N=24). Demographics, health and social
networks.
All Sites A (N=11) B (N=9) C (N=4)
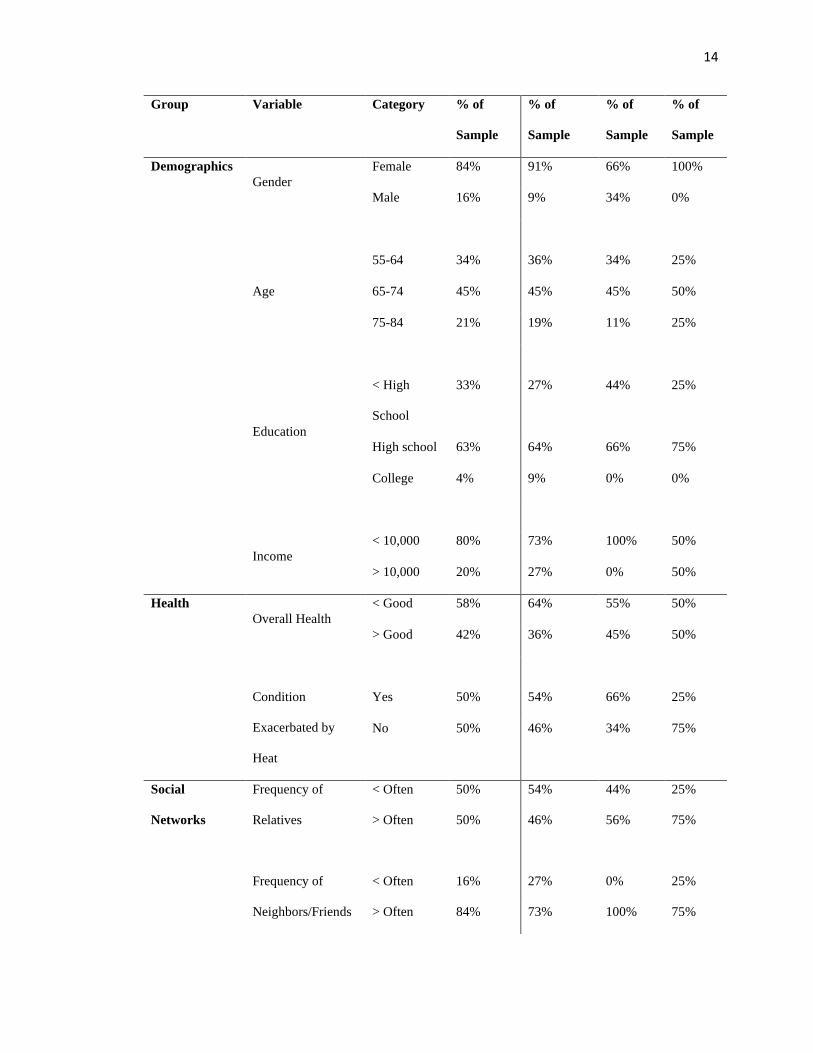
14
Group Variable Category % of
Sample
% of
Sample
% of
Sample
% of
Sample
Demographics
Gender
Female 84% 91% 66% 100%
Male 16% 9% 34% 0%
Age
55-64 34% 36% 34% 25%
65-74 45% 45% 45% 50%
75-84 21% 19% 11% 25%
Education
< High
School
33% 27% 44% 25%
High school 63% 64% 66% 75%
College 4% 9% 0% 0%
Income
< 10,000 80% 73% 100% 50%
> 10,000 20% 27% 0% 50%
Health
Overall Health
< Good 58% 64% 55% 50%
> Good 42% 36% 45% 50%
Condition
Exacerbated by
Heat
Yes 50% 54% 66% 25%
No 50% 46% 34% 75%
Social
Networks
Frequency of
Relatives
< Often 50% 54% 44% 25%
> Often 50% 46% 56% 75%
Frequency of
Neighbors/Friends
< Often 16% 27% 0% 25%
> Often 84% 73% 100% 75%
15
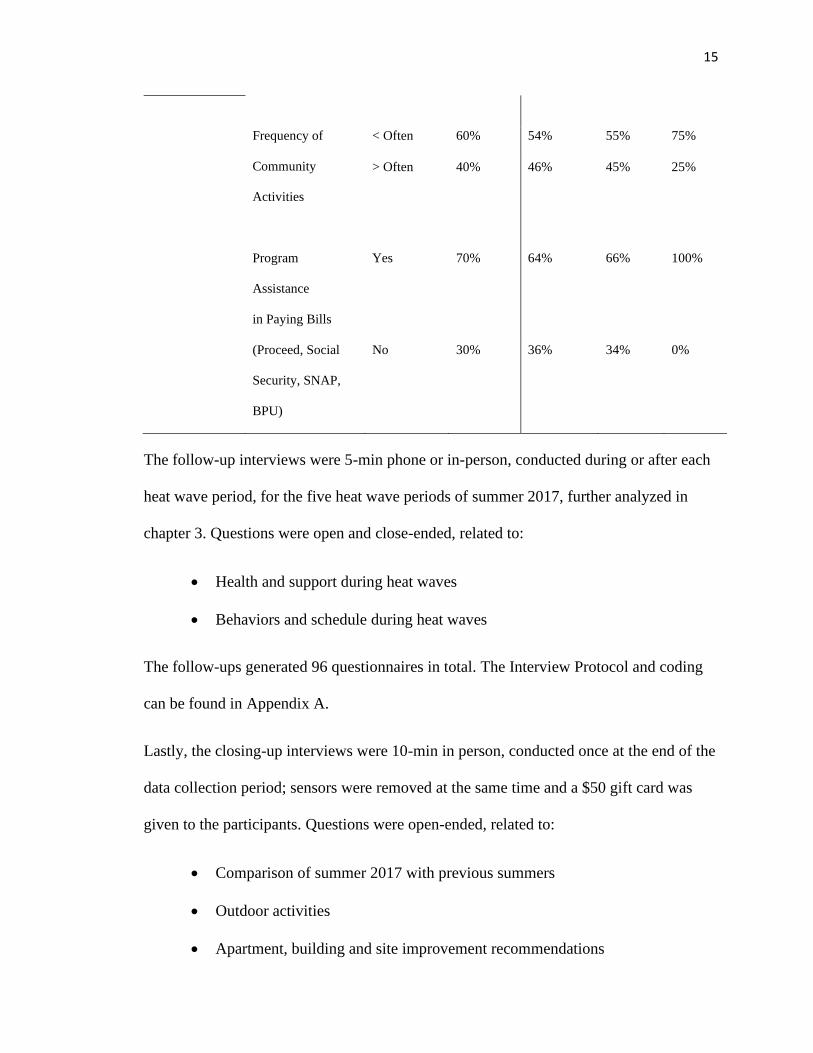
The follow-up interviews were 5-min phone or in-person, conducted during or after each
heat wave period, for the five heat wave periods of summer 2017, further analyzed in
chapter 3. Questions were open and close-ended, related to:
• Health and support during heat waves
• Behaviors and schedule during heat waves
The follow-ups generated 96 questionnaires in total. The Interview Protocol and coding
can be found in Appendix A.
Lastly, the closing-up interviews were 10-min in person, conducted once at the end of the
data collection period; sensors were removed at the same time and a $50 gift card was
given to the participants. Questions were open-ended, related to:
• Comparison of summer 2017 with previous summers
• Outdoor activities
• Apartment, building and site improvement recommendations
Frequency of
Community
Activities
< Often 60% 54% 55% 75%
> Often 40% 46% 45% 25%
Program
Assistance
in Paying Bills
Yes 70% 64% 66% 100%
(Proceed, Social
Security, SNAP,
BPU)
No 30% 36% 34% 0%
16
The closing-ups generated 24 questionnaires. The Interview Protocol can be found in
Appendix A.
Sensor Measurements
Consumer-grade sensors measuring thermal and air quality conditions (temperature,
humidity, ozone (O3), particulate matter (PM) and carbon dioxide (CO2)) and occupant
behaviors (occupant presence, window opening and air-conditioner (A/C) use) were
purchased in Fall 2016 and calibrated during Spring 2017 against professional-grade
instruments. In June 2017, and after arrangements with HACE, selected devices were
installed in an outdoor location within site A and were enclosed in a box 1.5 meters from
the ground that protected them against precipitation and heat radiation from outside
sources, while still allowing air to circulate freely through it. Additional sensors were
installed in an empty (control) apartment in site A. During the baseline interviews of June
2017, indoor sensors were placed in all 24 recruited households and remained until the
end of summer 2017 (un-installed during closing-up interviews). All indoor sensors were
located at a 0.4-08 meters height and at least 0.5 meters from the wall. The sensor names,
detailed calibration procedure, network and the locations in sample apartments can be
found in Appendix B. All pieces of equipment in each apartment connected and
transmitted data to a mobile Wi-Fi hotspot. The resulting dataset contains time-variant
data on hourly intervals over a 24-hour period for approximately 3 months on the
variables shown in Table 1 of Appendix B. Table 1.3 below summarizes the
measurements and their observed range for each variable during all summer and during
heat waves.
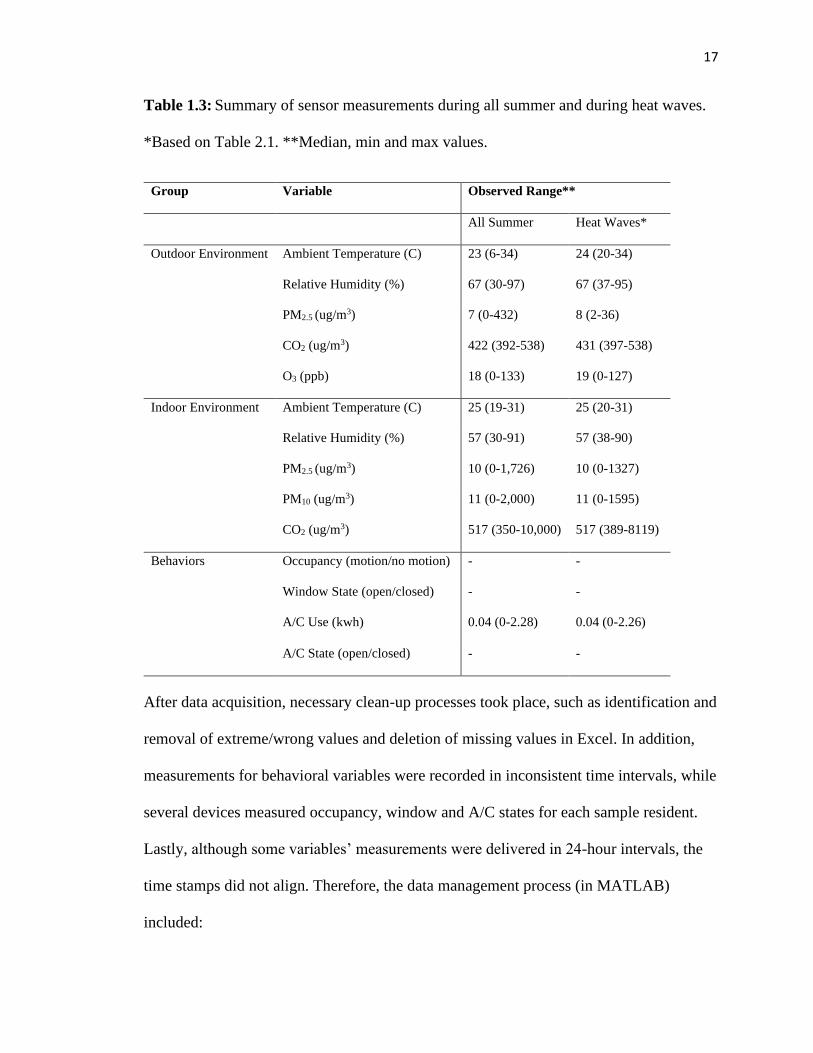
17
Table 1.3: Summary of sensor measurements during all summer and during heat waves.
*Based on Table 2.1. **Median, min and max values.
Group Variable Observed Range**
All Summer Heat Waves*
Outdoor Environment Ambient Temperature (C) 23 (6-34) 24 (20-34)
Relative Humidity (%) 67 (30-97) 67 (37-95)
PM2.5 (ug/m3) 7 (0-432) 8 (2-36)
CO2 (ug/m3) 422 (392-538) 431 (397-538)
O3 (ppb) 18 (0-133) 19 (0-127)
Indoor Environment Ambient Temperature (C) 25 (19-31) 25 (20-31)
Relative Humidity (%) 57 (30-91) 57 (38-90)
PM2.5 (ug/m3) 10 (0-1,726) 10 (0-1327)
PM10 (ug/m3) 11 (0-2,000) 11 (0-1595)
CO2 (ug/m3) 517 (350-10,000) 517 (389-8119)
Behaviors Occupancy (motion/no motion) - -
Window State (open/closed) - -
A/C Use (kwh) 0.04 (0-2.28) 0.04 (0-2.26)
A/C State (open/closed) - -
After data acquisition, necessary clean-up processes took place, such as identification and
removal of extreme/wrong values and deletion of missing values in Excel. In addition,
measurements for behavioral variables were recorded in inconsistent time intervals, while
several devices measured occupancy, window and A/C states for each sample resident.
Lastly, although some variables’ measurements were delivered in 24-hour intervals, the
time stamps did not align. Therefore, the data management process (in MATLAB)
included:
18
o Synchronize the time stamps of environmental variables across apartments,
o Produce consistent time stamps of behavioral variables for each apartment,
o Retime variables (behavioral) in hourly intervals,
o Generate new behavioral variables (e.g. total occupancy, % window opening
% A/C on),
o Merge environmental and behavioral variables in 24 separate apartment
datasets, and
o Concatenate all apartment datasets in one final database.
The final database covers from July to mid-September (7/1/17-9/15/17) in 24-hour
intervals.
Site and Apartment Plans
After the end of the baseline interviews and the sensor installation, hard copies of
building and apartment plans were obtained from HACE and were digitized in AutoCAD
and Sketchup. Alongside the plans, site maps were also prepared in Sketchup and
InDesign, based on a series of site observations and with the help of Google
Maps/Google Earth. Information from the maps and plans include neighborhood
amenities and more detailed site landscaping characteristics and engineered building and
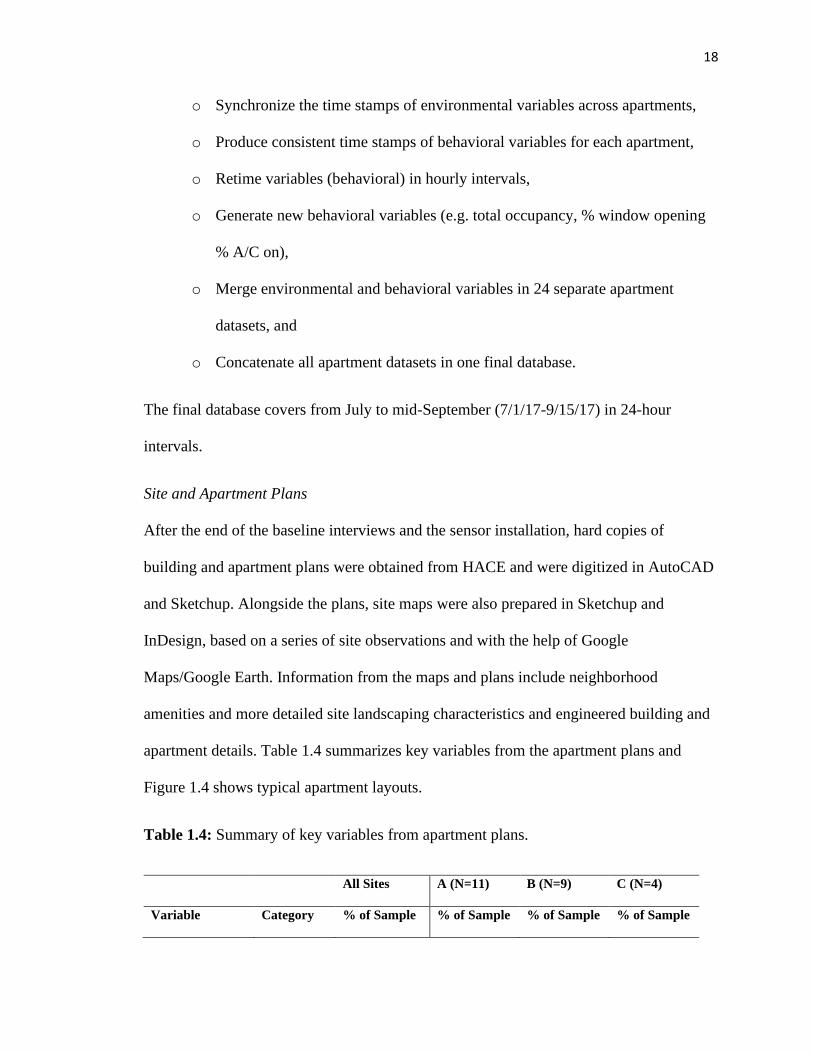
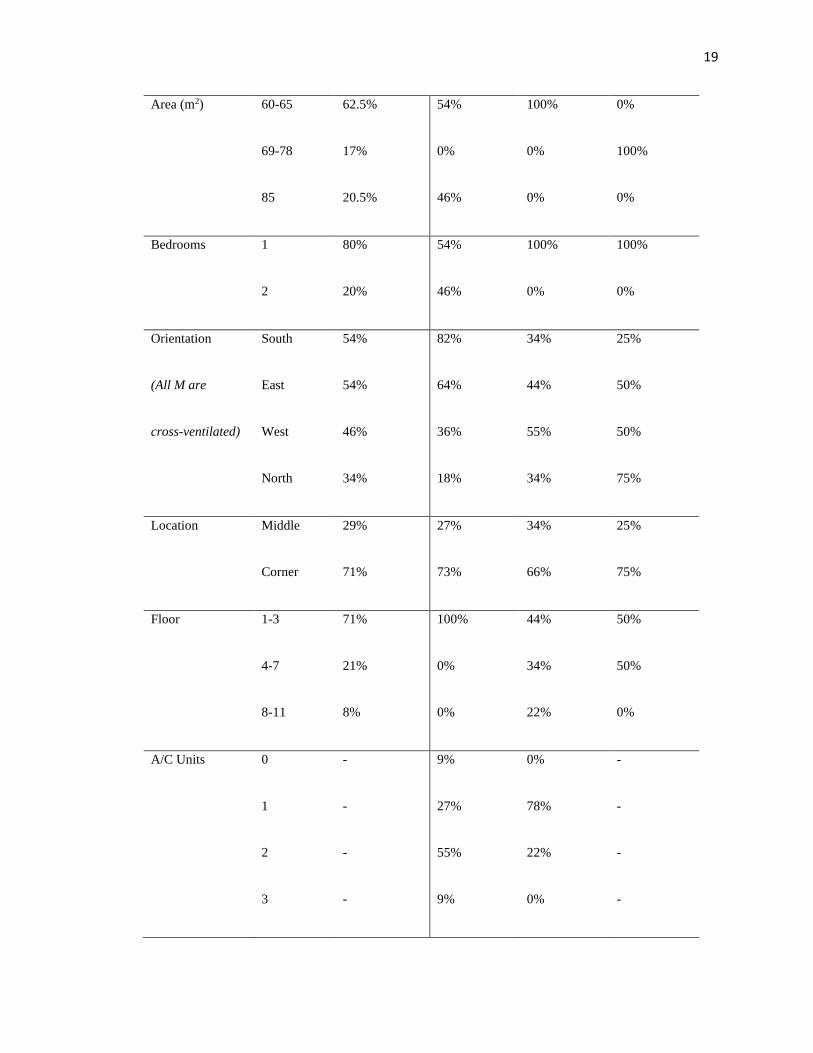
apartment details. Table 1.4 summarizes key variables from the apartment plans and
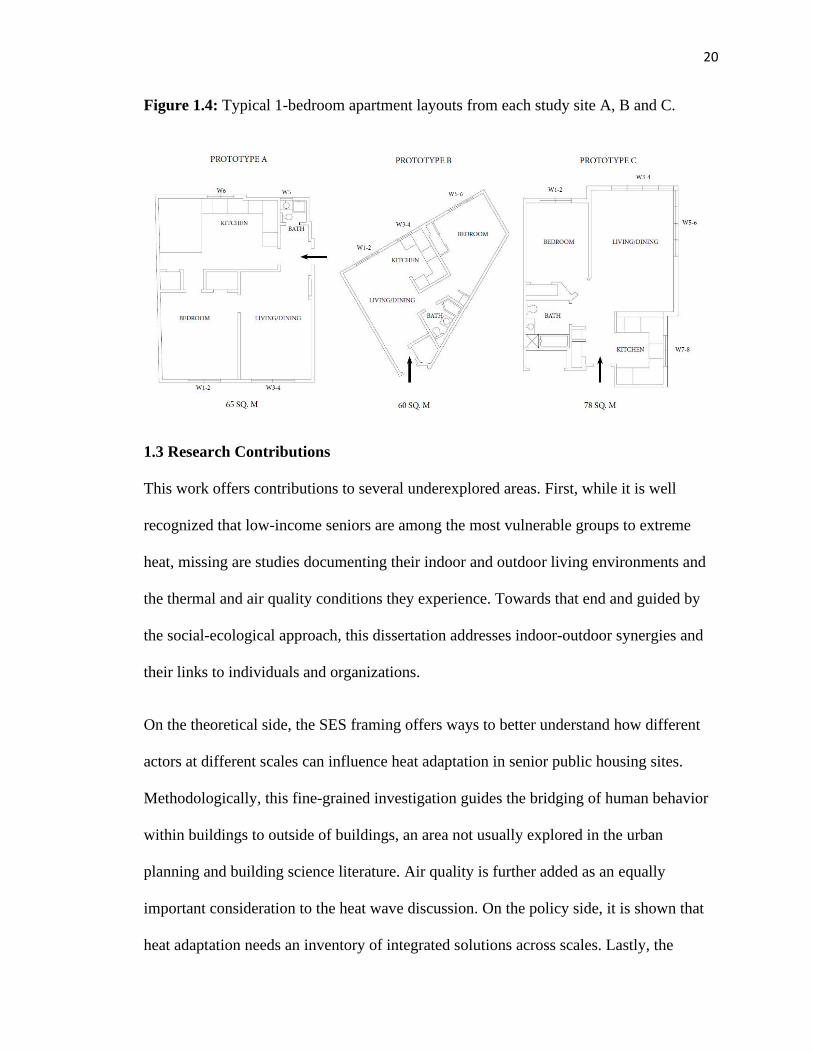
Figure 1.4 shows typical apartment layouts.
Table 1.4: Summary of key variables from apartment plans.
All Sites A (N=11) B (N=9) C (N=4)
Variable Category % of Sample % of Sample % of Sample % of Sample
19
Area (m2) 60-65 62.5% 54% 100% 0%
69-78 17% 0% 0% 100%
85 20.5% 46% 0% 0%
Bedrooms 1 80% 54% 100% 100%
2 20% 46% 0% 0%
Orientation South 54% 82% 34% 25%
(All M are East 54% 64% 44% 50%
cross-ventilated) West 46% 36% 55% 50%
North 34% 18% 34% 75%
Location Middle 29% 27% 34% 25%
Corner 71% 73% 66% 75%
Floor 1-3 71% 100% 44% 50%
4-7 21% 0% 34% 50%
8-11 8% 0% 22% 0%
A/C Units 0 - 9% 0% -
1 - 27% 78% -
2 - 55% 22% -
3 - 9% 0% -
20
Figure 1.4: Typical 1-bedroom apartment layouts from each study site A, B and C.
1.3 Research Contributions
This work offers contributions to several underexplored areas. First, while it is well
recognized that low-income seniors are among the most vulnerable groups to extreme
heat, missing are studies documenting their indoor and outdoor living environments and
the thermal and air quality conditions they experience. Towards that end and guided by
the social-ecological approach, this dissertation addresses indoor-outdoor synergies and
their links to individuals and organizations.
On the theoretical side, the SES framing offers ways to better understand how different
actors at different scales can influence heat adaptation in senior public housing sites.
Methodologically, this fine-grained investigation guides the bridging of human behavior
within buildings to outside of buildings, an area not usually explored in the urban
planning and building science literature. Air quality is further added as an equally
important consideration to the heat wave discussion. On the policy side, it is shown that
heat adaptation needs an inventory of integrated solutions across scales. Lastly, the
21
application of social-ecological systems to urban sites extends the SES literature by
connecting a conceptual framework to an empirical study, which shows that natural and
built environments are purely distinct. It also highlights that human agency, control and
ownership vary from indoor to outdoor scales and that the SES approach can benefit from
incorporating a behavior theory.
Taken as a whole, this study contributes to an integrative and interdisciplinary
understanding for long-term resilience and adaptation of elderly low-income
communities to heat. Stand-alone examination of either people or their built environment
does not capture the significant interrelations developed in the urban context, because at
every scale people can make choices and influence outcomes. Occupants can adjust
thermostats, windows, and clothing, or relocate. In buildings, we can improve cooling
systems, promote tighter envelopes, and manage solar gains; outdoors, we can redesign
key infrastructure such as open and public spaces. The equity aspects of the story that are
invisible at the global level become highly visible once we are able to focus on the
human-scale urban form.
Focusing on a local, relatively homogenous public-housing community is less of a
weakness and more of a strength of this research; each of the three study sites belongs to
a different neighborhood and can be separated from the rest in terms of outdoor
amenities, building characteristics, and the senior residents’ profiles. In addition, the aim
is to understand the role of human agency in heat adaptation, which can be succeeded
through a focus on the very localized scales. Therefore, such an approach is primarily
beneficial for communities who seek solutions on how to transform their built
22
environments, assuming joint collaborations among residents, designers, and public
officials.
1.4 Research Structure
The organization of this dissertation is as follows: The 2nd chapter links to the first
research question and offers background and literature in support of the premise that
senior low-income sites can be conceptualized as SESs. It extends this line of thinking to
the public housing sites of Elizabeth, in order to identify the social and ecological factors
that affect heat coping processes indoors and outdoors. Tied to the SES framing, chapters
3 and 4 link to the second research question and explore the seniors’ indoor
environments. The factors that affect thermal conditions are examined first, followed by
indoor thermal and air quality trade-offs. Then, chapter 5 extends to outdoor
environments and links to the third research question, which assesses the usefulness of
outdoor spaces in heat adaptation. Lastly, chapter 6 links to the fourth research question
and collects evidence from the previous chapters in support of an integrated approach to
the heat waves problem. It revisits the SES framing and offers recommendations for
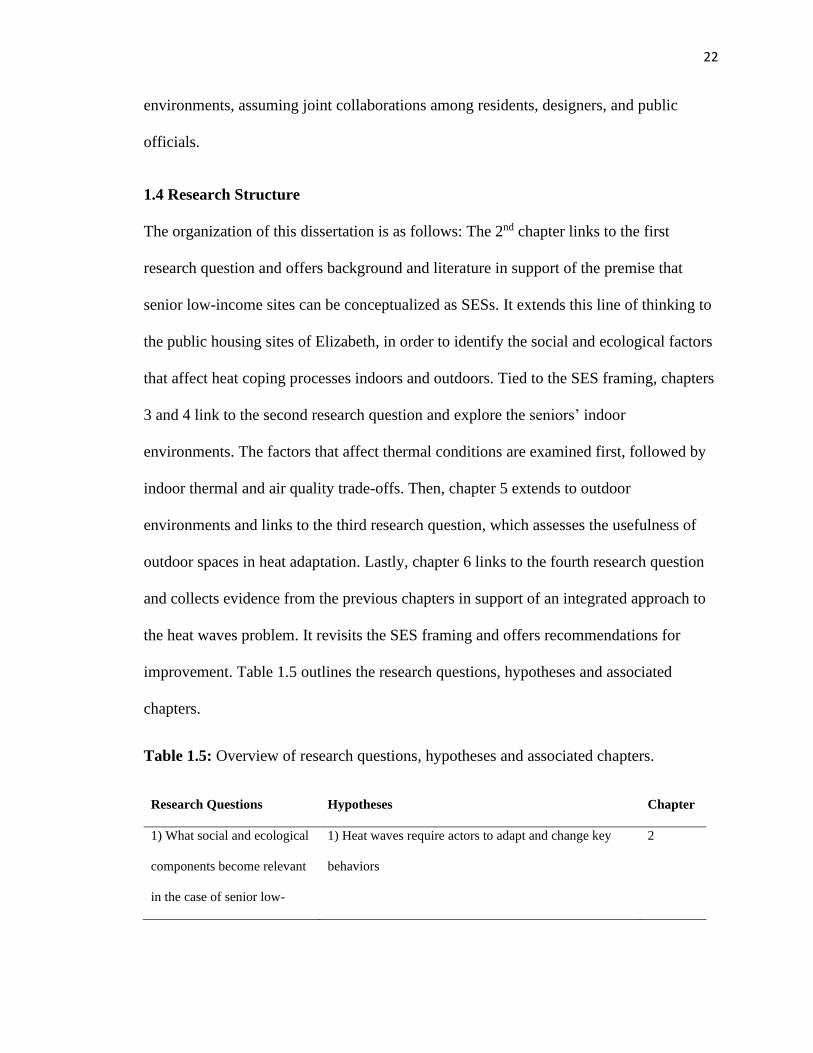
improvement. Table 1.5 outlines the research questions, hypotheses and associated
chapters.
Table 1.5: Overview of research questions, hypotheses and associated chapters.
Research Questions Hypotheses Chapter
1) What social and ecological
components become relevant
in the case of senior low-
1) Heat waves require actors to adapt and change key
behaviors
2
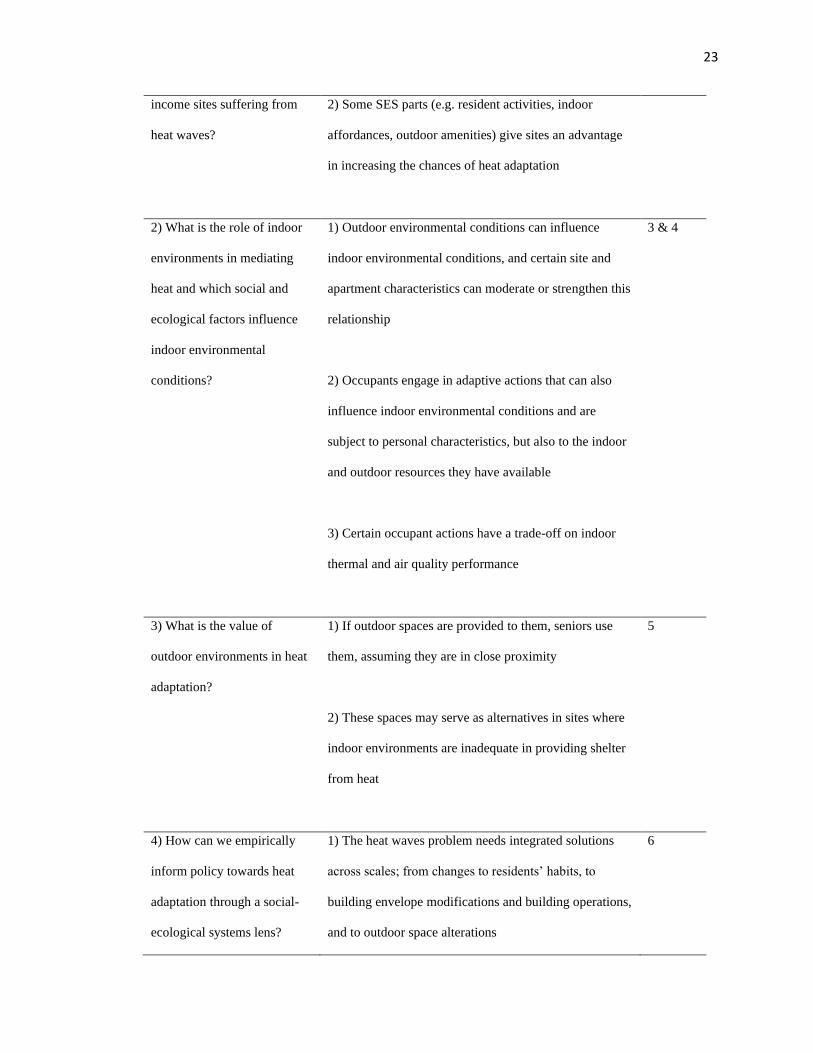
23
income sites suffering from
heat waves?
2) Some SES parts (e.g. resident activities, indoor
affordances, outdoor amenities) give sites an advantage
in increasing the chances of heat adaptation
2) What is the role of indoor
environments in mediating
heat and which social and
ecological factors influence
indoor environmental
conditions?
1) Outdoor environmental conditions can influence
indoor environmental conditions, and certain site and
apartment characteristics can moderate or strengthen this
relationship
2) Occupants engage in adaptive actions that can also
influence indoor environmental conditions and are
subject to personal characteristics, but also to the indoor
and outdoor resources they have available
3) Certain occupant actions have a trade-off on indoor
thermal and air quality performance
3 & 4
3) What is the value of
outdoor environments in heat
adaptation?
1) If outdoor spaces are provided to them, seniors use
them, assuming they are in close proximity
2) These spaces may serve as alternatives in sites where
indoor environments are inadequate in providing shelter
from heat
5
4) How can we empirically
inform policy towards heat
adaptation through a social-
ecological systems lens?
1) The heat waves problem needs integrated solutions
across scales; from changes to residents’ habits, to
building envelope modifications and building operations,
and to outdoor space alterations
6
24
2. Chapter 2 Forming a Heat-Wave Social-Ecological
Framework
This chapter offers background and a rationale for the initial premise of this work that
conceptualizes senior public-housing sites as social-ecological systems1. The first section
provides a literature review on the theory and urban applications of SESs. The next
section extends this line of thinking to the study community and assembles a descriptive
SES framework for heat waves that can guide future analysis. Drawing on information
from sensors, interviews and site plans, the last part of the chapter concludes with
identifying the key social and ecological dimensions of heat adaptation, in relation to
thermal and air quality conditions.
2.1 Background
The Social-Ecological Systems Approach
The social-ecological systems approach has emerged as a research tradition among
scholars concerned with the management of sustainable systems, including ecologists,
biologists, economists, sociologists and others (Gadgil et al., 2003). A common unifying
pool is the realization that phenomena with multiple and diverse causes cannot be fully
understood without combining theories and practices from both the social and natural
sciences (Berkes, Colding and Folke, 2003; Folke, 2006; Gadgil et. al, 2003). Therefore,
a social-ecological system is an organized structure that includes human and non-human
1 The information presented in this chapter comes from a co-authored peer-reviewed conference paper. The
citation is: Tsoulou, I., Senick, J., Andrews, C. J., Mainelis, G., He, R., & Putra H.C. (2020). “Heat Waves
and Seniors in Public Housing: A Social-Ecological Exploration in an Urban Context.” In the 12th
International Forum on Urbanism, Beyond Resilience, June 27-29, 2019, Jakarta, Indonesia.
25
forms (e.g. natural, infrastructural or technical components) interacting with each other in
a specific location (Halliday and Glaser, 2011).
SESs build upon complex adaptive systems (CAS), according to which, understanding of
a system comes from the examination of how its parts operate together and not in
isolation (Gadgil et.al, 2003). Therefore, they share all the CAS properties such as non-
linearity that links to rules of interaction that change as the system evolves, emergence of
behavior from the interaction of several parts, nestedness where each subsystem is nested
within larger subsystems, and self-organization that relies on the idea that systems will
reorganize at critical points of instability (Gadgil et.al, 2003).
Since the 1980s, social-ecological systems thinking has expanded in multiple
interdisciplinary fields besides systems ecology, which explicitly incorporate nature and
society interactions in their framing of issues; instances include ecological economics,
environmental psychology, human geography, resource environmental management,
anthropology and the social sciences (Folke, 2006; Gadgil et. al, 2003). Urban planning
and policy is recently added on that list, as urban researchers increasingly identify links
among social-ecological resilience and planning, especially those concerned with climate
change impacts on the built environment, urban governance and cross-scale spatial
dynamics in complex systems (Wilkinson, 2012).
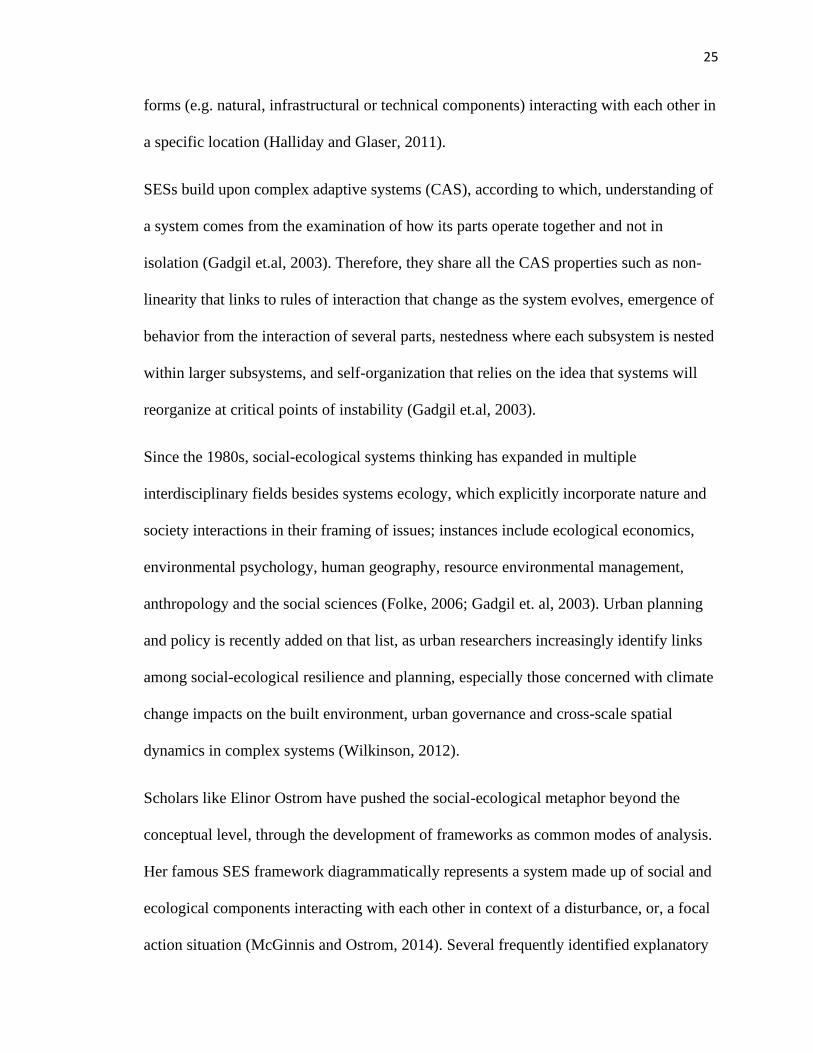
Scholars like Elinor Ostrom have pushed the social-ecological metaphor beyond the
conceptual level, through the development of frameworks as common modes of analysis.
Her famous SES framework diagrammatically represents a system made up of social and
ecological components interacting with each other in context of a disturbance, or, a focal
action situation (McGinnis and Ostrom, 2014). Several frequently identified explanatory
26
variables are found within each of these components and may be classified into first-level
variables and their secondary attributes (adapted from Ostrom, 2009). As shown in Figure
2.1, the dashed line indicates a well-defined SES that is affected by exogenous
ecosystems and social, economic and political settings operating at different scales.
Within the SES boundaries, the social part includes governance systems and actors and
the ecological part includes resource system(s) and units, and the corresponding
explanatory variables help characterize them (Ostrom, 2009). The choice of those
variables depends on the research questions, the type of SES and the spatio-temporal
scales of analysis.
Figure 2.1: A SES conceptual framework (Adopted from McGinnis and Ostrom, 2014).
27
Ostrom’s framework is flexible and can be applied to a wide range of research questions.
Common applications involve cases where humans interact with resources in a particular
location. The SES framework has been applied to phenomena in sectors as diverse as
agriculture, fishing, forestry, tourism and resilience of coastal zones (Campbell and
Gabriel, 2016; McGinnis and Ostrom, 2014; Ostrom, 2009; Stojanovic et al., 2016). In
most cases, population groups (the social component) depend heavily on natural or
community resources (e.g. forestry and tourism) for their survival. Resources represent
the ecological component of the system.
SES frameworks have also received some criticism. Stojanovic et al. point out to their
tendency to operationalize “the social”, disregarding sometimes questions of politics,
power, inequity, and marginalization (Stojanovic et al., 2016). Likewise, Vogt et al. argue
that absent from the framework are ecological considerations, such as ecological rules
and processes (Vogt et al., 2015). Nevertheless, the SES framing provides an essential
first step towards interdisciplinary research and can be valuable in describing a system’s
social-ecological structure (Alberti et al., 2011, Liu et al., 2007). The next step is to
extend this line of thinking to theoretical and methodological analysis for empirical
inquiry (Epstein et al., 2013, Ramaswami et al., 2012).
Cities as Social-Ecological Systems
In viewing cities as systems, urban ecological approaches identify infrastructural and
technological components that draw from natural resources and are linked to social actors
and institutions (McPhearson et al., 2016; Ramaswami et al., 2012). An understanding of
the system derives from an examination of how its components operate conjointly
(Gadgil et.al, 2003). The field of urban ecology explicitly adopts this view to advance
28
cities’ sustainability and resilience (McPhearson et al., 2016). Along those lines, it is
argued that social-ecological systems thinking is very relevant for planning theory, since
it responds directly to environmental and ecological considerations as a driving concern;
however, a stronger theoretical basis is needed to address issues of power, conflict and
culture (Wilkinson, 2012).
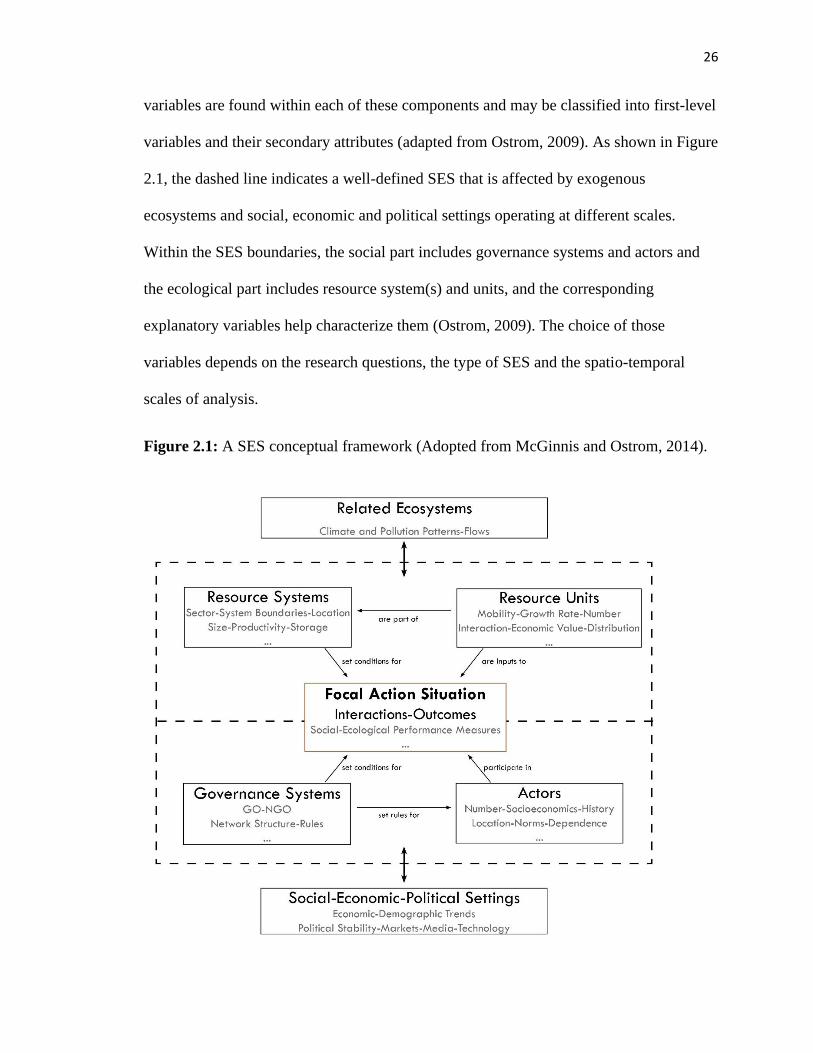
Urban scholars such as Ramaswami et al. (2012) have extended the applicability of the
SES framework in urban environments, framing cities as coupled social-ecological-
infrastructural systems (SEIS), where infrastructures feed from natural resources and
provide continuous support to their users. The main parts of the SEIS framework are
briefly summarized in Figure 2.2.
Figure 2.2: A SEIS conceptual framework (Adopted from Ramaswami et al., 2012).
29
A major distinction between the SES and the SEIS frameworks is that artificial systems
have inherently different dynamics than ecological systems. Also, unlike in a fishing or
forestry community, users of the resource system (e.g. buildings, transportation networks
etc.) may not be able to maintain it, which introduces the role of additional human
entities such as designers and operators (Ramaswami et al., 2012). These distinctions
should be considered in the explanatory variables of each SEIS part and the guiding
theory at later research stages.
2.2 Forming a Social-Ecological Framework for Heat Waves
To date, there are limited empirical studies applying a SES perspective to urban issues.
Such an effort is presented in the remainder of this chapter. Drawing on the works of
Ostrom and Ramaswami, I view urban sites as social-ecological systems and I argue that
the SES framework is helpful for understanding and measuring key elements of how heat
waves impact senior citizens living in public (low income) housing communities, and
seniors’ corresponding behavior and activities.
I commence with an 8-step process, premised on Ostrom (2009) and McGinnis and
Ostrom (2014), for assembling a SES framework to serve as the basis for the remaining
research:
• Define the focal action situation
• Locate the system boundaries
• Establish the ecological component
o Identify the resource system and units
• Establish the social component
o Identify the governance system and actors
30
• List the related social, economic and political settings
• List the related ecosystems
Define the Focal Action Situation
This first step is of primary importance, as it determines the selection of first and second-
level variables and attributes. Here, the focal action situation is heat waves and their
impacts on thermal and air quality conditions of urban sites. Therefore, resource systems,
units, governance institutions and actors interact with each other and produce outcomes
in relation to heat adaptation.
Locate the System Boundaries
The next step is to specify the study area that contains the resource systems and units and
is the place where primary users spend most of their time before and during the focal
action situation. Additional actors that link to governance systems can be located outside
the system boundaries, although they may influence interactions, outcomes and the
overall system performance during heat waves. The study area indicates a discrete whole,
but exogenous influences from related social, economic and political settings, and
ecosystems may affect any component of SES. In the case of heat waves, the system
boundaries are the site boundaries.
Establish the Ecological Component- Identify the Resource System and Units
The resouce systems and the units nested in them are first-level variables and are further
described and comprised by second-level attributes. In the case of heat waves, the
resource systems are the sites and the units are the dwellings (buildings and apartments).
Secondary attributes include the size and location of each, adjacent affordances, such as
31
shade trees and benches (e.g., landscaping), the outdoor and indoor climate and the
dwelling envelopes.
Establish the Social Component - Identify the Governance System and Actors
Actors and governance systems are first-level variables and are characterized by second-
level attributes. Primary actors are the individual users of the system, while additional
actors and governance institutions include the organization that manages the resource
systems and units. In an urban site affected by heat waves, primary actors are the
residents, and secondary actors and governance systems relate to the company that
operates the sites and buildings along with its employees. Second-level attributes include
the number of actors, their profiles (socio-demographics, culture, norms), their actions
during heat waves, and, for governance institutions, the frequency of support and the type
of services they provide.
List the Related Social, Economic and Political Settings
Social, economic and political settings indicate exogenous influences that may operate at
different scales than that of the SES. In the case of urban sites, this category relates to the
overall demographic, economic, political and technological trends shaping the wider area
in which the sites are located.
List the Related Ecosystems
Lastly, related ecosystems are not within the immediate system boundaries and represent
the overall climate and pollution patterns that may affect the study area characteristics. In
the case of heat waves, this translates into the local climate attributes that relate to the
urban heat island effects, and ambient air quality.
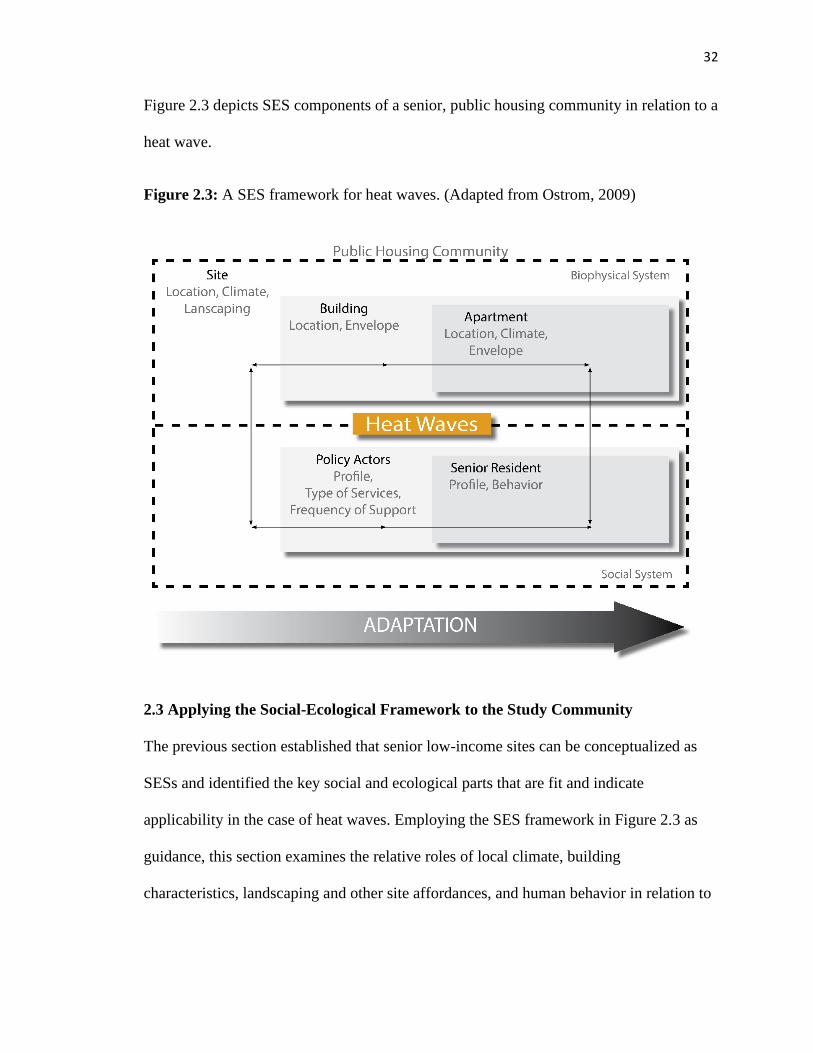
32
Figure 2.3 depicts SES components of a senior, public housing community in relation to a
heat wave.
Figure 2.3: A SES framework for heat waves. (Adapted from Ostrom, 2009)
2.3 Applying the Social-Ecological Framework to the Study Community
The previous section established that senior low-income sites can be conceptualized as
SESs and identified the key social and ecological parts that are fit and indicate
applicability in the case of heat waves. Employing the SES framework in Figure 2.3 as
guidance, this section examines the relative roles of local climate, building
characteristics, landscaping and other site affordances, and human behavior in relation to
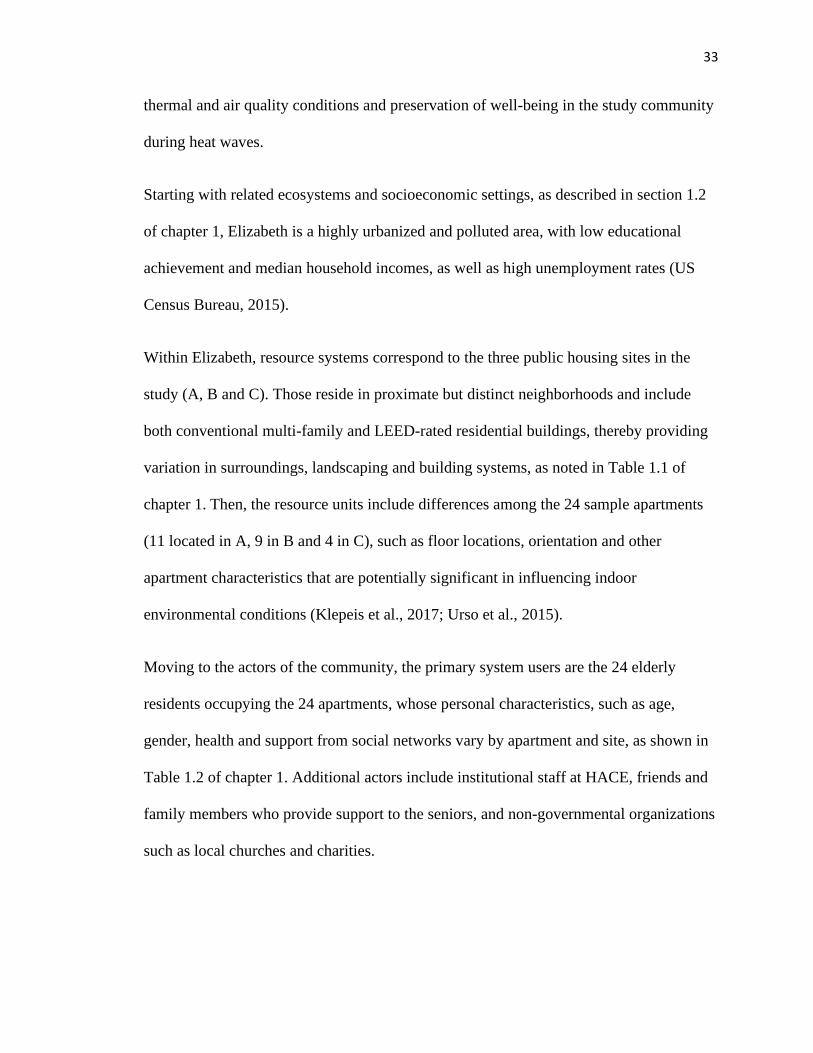
33
thermal and air quality conditions and preservation of well-being in the study community
during heat waves.
Starting with related ecosystems and socioeconomic settings, as described in section 1.2
of chapter 1, Elizabeth is a highly urbanized and polluted area, with low educational
achievement and median household incomes, as well as high unemployment rates (US
Census Bureau, 2015).
Within Elizabeth, resource systems correspond to the three public housing sites in the
study (A, B and C). Those reside in proximate but distinct neighborhoods and include
both conventional multi-family and LEED-rated residential buildings, thereby providing
variation in surroundings, landscaping and building systems, as noted in Table 1.1 of
chapter 1. Then, the resource units include differences among the 24 sample apartments
(11 located in A, 9 in B and 4 in C), such as floor locations, orientation and other
apartment characteristics that are potentially significant in influencing indoor
environmental conditions (Klepeis et al., 2017; Urso et al., 2015).
Moving to the actors of the community, the primary system users are the 24 elderly
residents occupying the 24 apartments, whose personal characteristics, such as age,
gender, health and support from social networks vary by apartment and site, as shown in
Table 1.2 of chapter 1. Additional actors include institutional staff at HACE, friends and
family members who provide support to the seniors, and non-governmental organizations
such as local churches and charities.
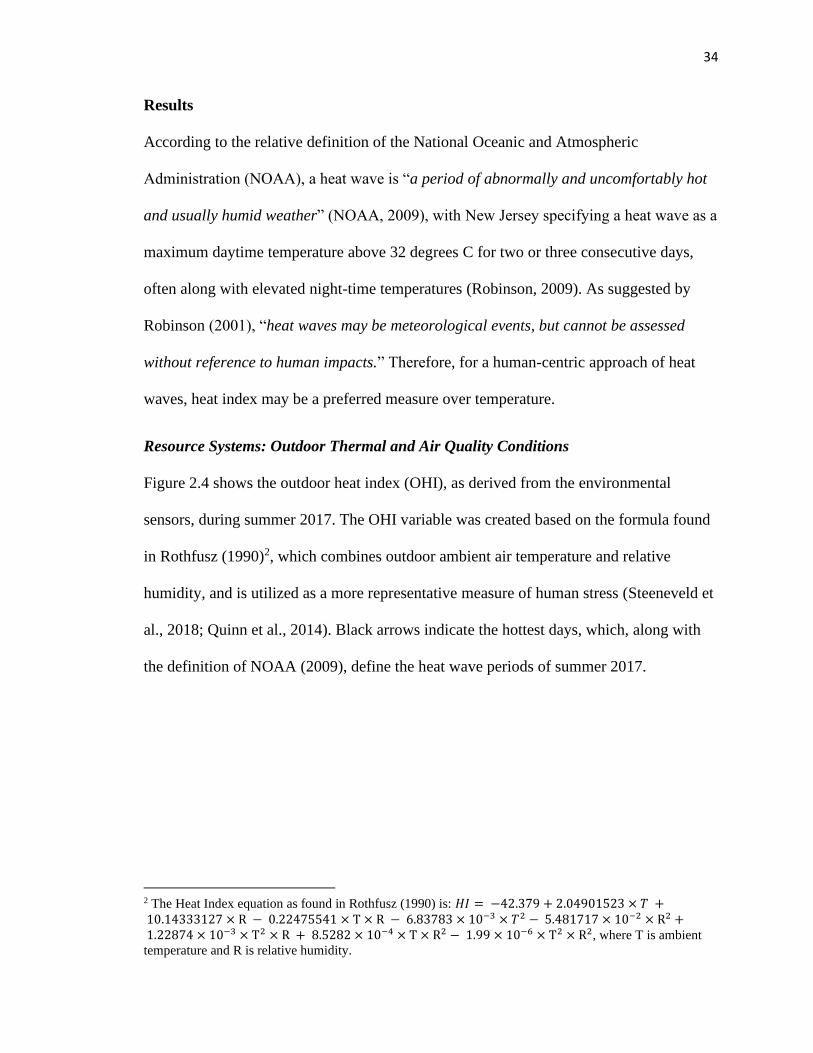
34
Results
According to the relative definition of the National Oceanic and Atmospheric
Administration (NOAA), a heat wave is “a period of abnormally and uncomfortably hot
and usually humid weather” (NOAA, 2009), with New Jersey specifying a heat wave as a
maximum daytime temperature above 32 degrees C for two or three consecutive days,
often along with elevated night-time temperatures (Robinson, 2009). As suggested by
Robinson (2001), “heat waves may be meteorological events, but cannot be assessed
without reference to human impacts.” Therefore, for a human-centric approach of heat
waves, heat index may be a preferred measure over temperature.
Resource Systems: Outdoor Thermal and Air Quality Conditions
Figure 2.4 shows the outdoor heat index (OHI), as derived from the environmental
sensors, during summer 2017. The OHI variable was created based on the formula found
in Rothfusz (1990)2, which combines outdoor ambient air temperature and relative
humidity, and is utilized as a more representative measure of human stress (Steeneveld et
al., 2018; Quinn et al., 2014). Black arrows indicate the hottest days, which, along with
the definition of NOAA (2009), define the heat wave periods of summer 2017.
2 The Heat Index equation as found in Rothfusz (1990) is: 𝐻𝐼 = −42.379 + 2.04901523 × 𝑇 + 10.14333127 × R − 0.22475541 × T × R − 6.83783 × 10⁻³ × 𝑇2 − 5.481717 × 10⁻² × R2 + 1.22874 × 10⁻³ × T2 × R + 8.5282 × 10⁻⁴ × T × R2 − 1.99 × 10⁻⁶ × T2 × R2, where T is ambient
temperature and R is relative humidity.
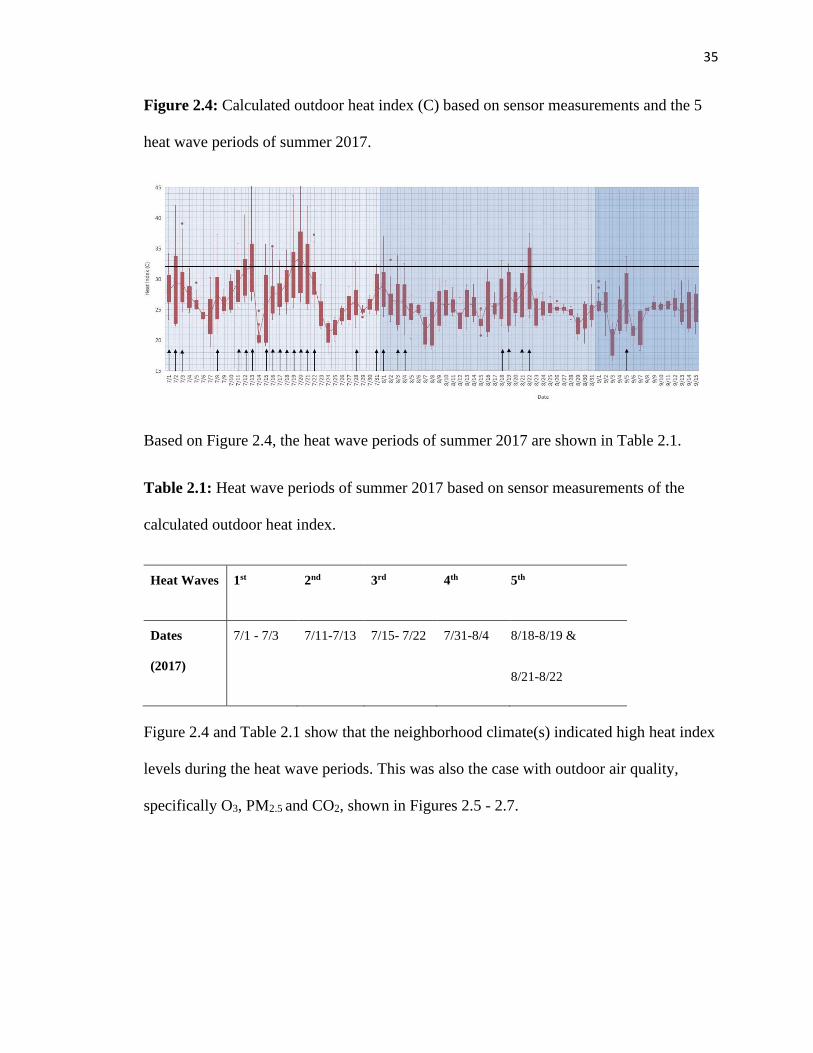
35
Figure 2.4: Calculated outdoor heat index (C) based on sensor measurements and the 5
heat wave periods of summer 2017.
Based on Figure 2.4, the heat wave periods of summer 2017 are shown in Table 2.1.
Table 2.1: Heat wave periods of summer 2017 based on sensor measurements of the
calculated outdoor heat index.
Heat Waves 1st 2nd 3rd 4th 5th
Dates
(2017)
7/1 - 7/3 7/11-7/13 7/15- 7/22 7/31-8/4 8/18-8/19 &
8/21-8/22
Figure 2.4 and Table 2.1 show that the neighborhood climate(s) indicated high heat index
levels during the heat wave periods. This was also the case with outdoor air quality,
specifically O3, PM2.5 and CO2, shown in Figures 2.5 - 2.7.
36
Figure 2.5: Outdoor O3 (ppb) based on sensor measurements of summer 2017.
Figure 2.6: Outdoor PM2.5 (ug/m3) based on sensor measurements of summer 2017.
Figure 2.7: Outdoor CO2 (ug/m3) based on sensor measurements of summer 2017.
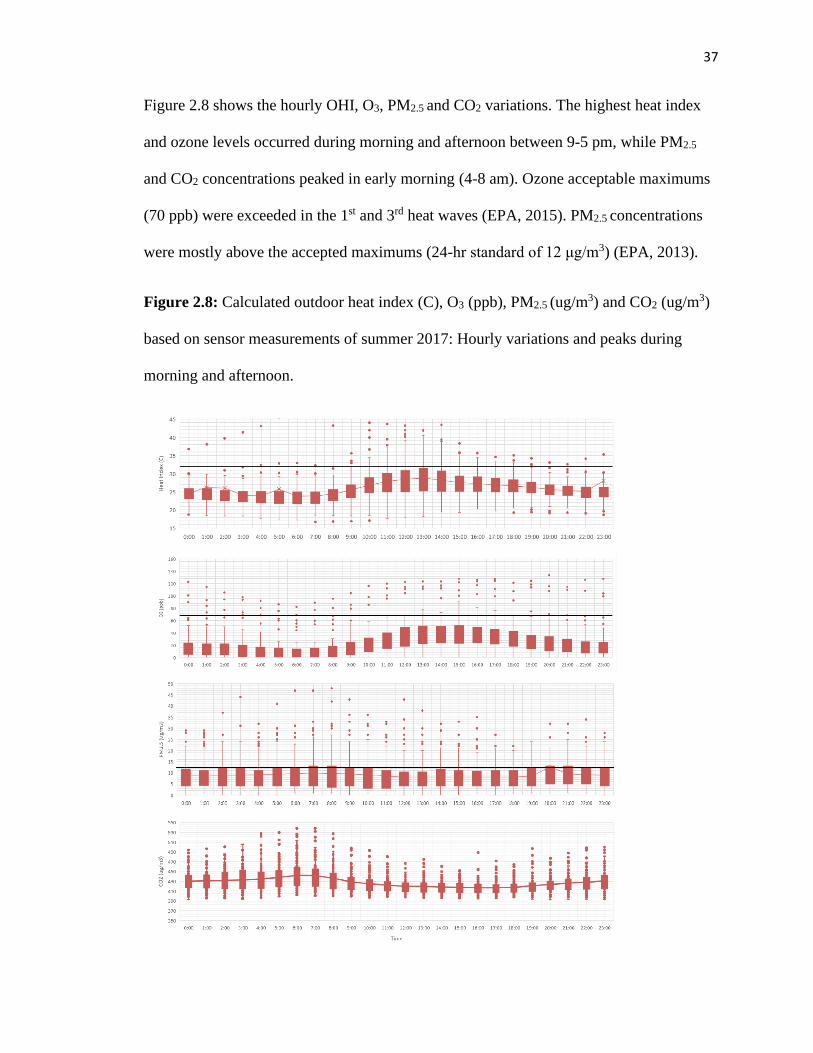
37
Figure 2.8 shows the hourly OHI, O3, PM2.5 and CO2 variations. The highest heat index
and ozone levels occurred during morning and afternoon between 9-5 pm, while PM2.5
and CO2 concentrations peaked in early morning (4-8 am). Ozone acceptable maximums
(70 ppb) were exceeded in the 1st and 3rd heat waves (EPA, 2015). PM2.5 concentrations
were mostly above the accepted maximums (24-hr standard of 12 μg/m3) (EPA, 2013).
Figure 2.8: Calculated outdoor heat index (C), O3 (ppb), PM2.5 (ug/m3) and CO2 (ug/m3)
based on sensor measurements of summer 2017: Hourly variations and peaks during
morning and afternoon.
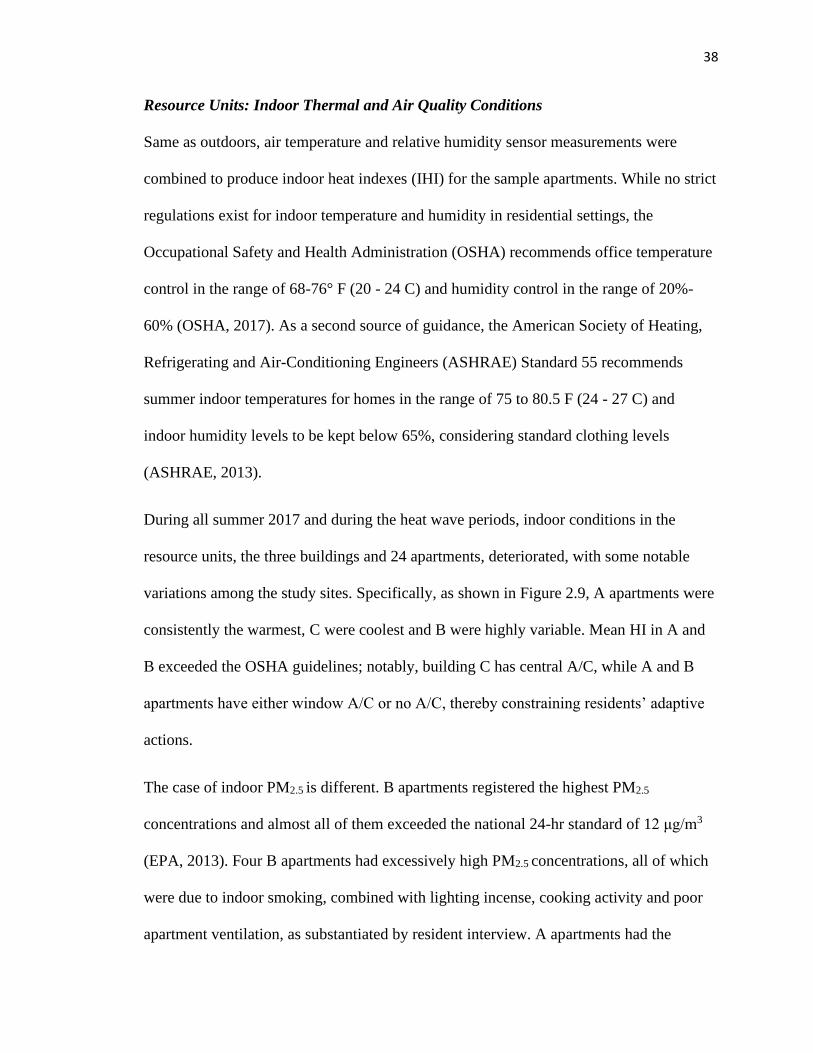
38
Resource Units: Indoor Thermal and Air Quality Conditions
Same as outdoors, air temperature and relative humidity sensor measurements were
combined to produce indoor heat indexes (IHI) for the sample apartments. While no strict
regulations exist for indoor temperature and humidity in residential settings, the
Occupational Safety and Health Administration (OSHA) recommends office temperature
control in the range of 68-76° F (20 - 24 C) and humidity control in the range of 20%-
60% (OSHA, 2017). As a second source of guidance, the American Society of Heating,
Refrigerating and Air-Conditioning Engineers (ASHRAE) Standard 55 recommends
summer indoor temperatures for homes in the range of 75 to 80.5 F (24 - 27 C) and
indoor humidity levels to be kept below 65%, considering standard clothing levels
(ASHRAE, 2013).
During all summer 2017 and during the heat wave periods, indoor conditions in the
resource units, the three buildings and 24 apartments, deteriorated, with some notable
variations among the study sites. Specifically, as shown in Figure 2.9, A apartments were
consistently the warmest, C were coolest and B were highly variable. Mean HI in A and
B exceeded the OSHA guidelines; notably, building C has central A/C, while A and B
apartments have either window A/C or no A/C, thereby constraining residents’ adaptive
actions.
The case of indoor PM2.5 is different. B apartments registered the highest PM2.5
concentrations and almost all of them exceeded the national 24-hr standard of 12 μg/m3
(EPA, 2013). Four B apartments had excessively high PM2.5 concentrations, all of which
were due to indoor smoking, combined with lighting incense, cooking activity and poor
apartment ventilation, as substantiated by resident interview. A apartments had the
39
highest CO2 levels. The highest CO2 concentrations were in two A apartments, whose
occupants reported keeping the windows closed to avoid noise and smells coming from
outside, and also reported having several pets.
Figure 2.9: Average IHI, PM2.5 and CO2 by site, based on sensor measurements of
summer 2017.
Governance Systems and Actors: Behaviors, Services and Support
The previous findings demonstrate effects of the seniors’ behaviors and activities on their
indoor environment. The interviews provided key information on varied adaptive (and
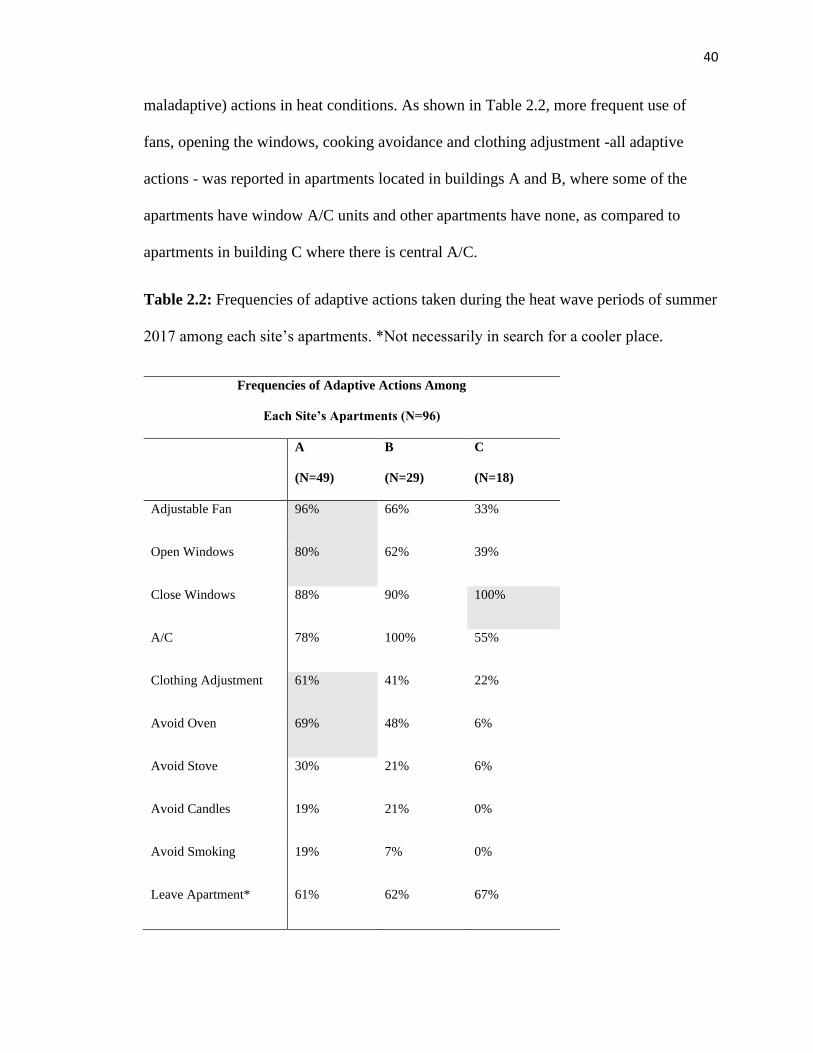
40
maladaptive) actions in heat conditions. As shown in Table 2.2, more frequent use of
fans, opening the windows, cooking avoidance and clothing adjustment -all adaptive
actions - was reported in apartments located in buildings A and B, where some of the
apartments have window A/C units and other apartments have none, as compared to
apartments in building C where there is central A/C.
Table 2.2: Frequencies of adaptive actions taken during the heat wave periods of summer
2017 among each site’s apartments. *Not necessarily in search for a cooler place.
Frequencies of Adaptive Actions Among
Each Site’s Apartments (N=96)
A
(N=49)
B
(N=29)
C
(N=18)
Adjustable Fan
a
96% 66% 33%
Open Windows
a
80% 62% 39%
Close Windows
a
88% 90% 100%
A/C
a
78% 100% 55%
Clothing Adjustment
a
61% 41% 22%
Avoid Oven
a
69% 48% 6%
Avoid Stove
a
30% 21% 6%
Avoid Candles
a
19% 21% 0%
Avoid Smoking
a
19% 7% 0%
Leave Apartment*
a
61% 62% 67%
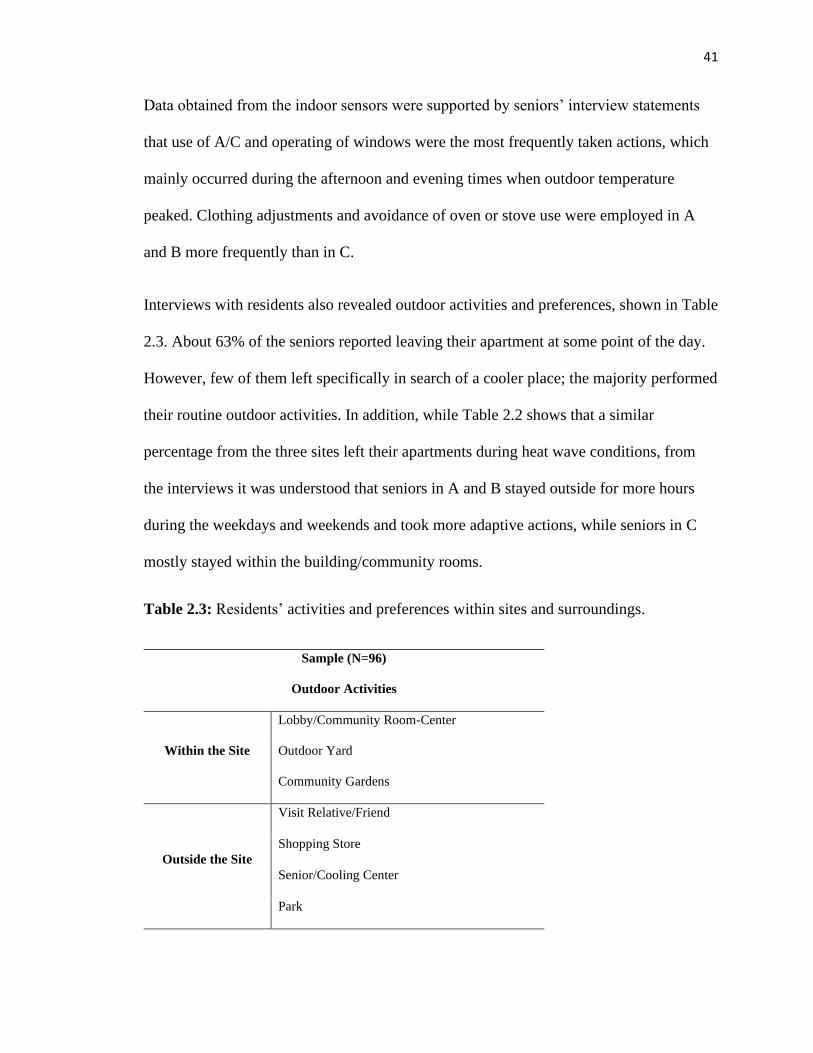
41
Data obtained from the indoor sensors were supported by seniors’ interview statements
that use of A/C and operating of windows were the most frequently taken actions, which
mainly occurred during the afternoon and evening times when outdoor temperature
peaked. Clothing adjustments and avoidance of oven or stove use were employed in A
and B more frequently than in C.
Interviews with residents also revealed outdoor activities and preferences, shown in Table
2.3. About 63% of the seniors reported leaving their apartment at some point of the day.
However, few of them left specifically in search of a cooler place; the majority performed
their routine outdoor activities. In addition, while Table 2.2 shows that a similar
percentage from the three sites left their apartments during heat wave conditions, from
the interviews it was understood that seniors in A and B stayed outside for more hours
during the weekdays and weekends and took more adaptive actions, while seniors in C
mostly stayed within the building/community rooms.
Table 2.3: Residents’ activities and preferences within sites and surroundings.
Sample (N=96)
Outdoor Activities
Within the Site
Lobby/Community Room-Center
Outdoor Yard
Community Gardens
Outside the Site
Visit Relative/Friend
Shopping Store
Senior/Cooling Center
Park
42
Library
Public Pool
Movie Theater
Church
Doctor/Hospital/Nursing Home/Pharmacy
Work
Additional policy actors played two crucial roles during the summer 2017 heat waves.
First, the HACE staff kept the buildings and grounds functioning, thereby ensuring that
residents had appropriate shelter. Second, Proceed-a local non-profit- had previously put
in place both window air conditioners where residents wanted them and arranged to pay
the associated electric bills for their operation, in some apartments. This allowed
residents to cope with the hot weather much more easily, generally within their own
homes.
As reported in informal discussions with HACE, other community actors such as the
facility managers (one manager per site) were responsible for the overall monitoring and
functioning of the sites, both in terms of the systems operations and maintenance and the
residents’ well-being. An example is assigning floor captains at site C, who occasionally
check on the residents’ status or report any issues with the units. Also, the Community
Service Staff provided free services to seniors such as flu shots, health and eye screenings
and health education workshops. It also collaborates with Union County and City of
Elizabeth Office of Aging to motivate the elderly to attend social, cultural and
recreational activities, along with informing them about transportation to medical
facilities, home aid, and day care programs (HACE, 2017).
43
Additional important governmental entities supporting seniors included actors
representing the U.S. Social Security Administration for retirement benefits, US Food
Nutrition Service (FNS-SNAP) in the form of food stamps, and lastly, Medicare for
health insurance, all of which were reported by the residents during the baseline
interviews. Other non-governmental actors were identified in the interviews, including
nearby churches that organized food pantries once a month or checked on the elderly
members; and Robert Wood Johnson Foundation (RWJF) programs including the
Shaping Elizabeth Coalition (NJ Health Initiatives, 2017). Lastly, some residents reported
receiving help from families/relatives (children, siblings) or social workers/nurses for
cleaning the apartments or going shopping.
2.4 Discussion
The previous sections assembled a heat wave SES framework for seniors residing in
public housing in low-income neighborhoods and demonstrated its effectiveness as a
heuristic for evaluating inter-relationships among actors and infrastructure at different
spatial scales. The Elizabeth, New Jersey, USA case study provides empirical evidence
on how and to what effect SES components are involved in heat coping processes. When
the heat waves occur, variations among the three study sites are reflected in the specific
actions residents from each site take. These actions depend on the indoor and outdoor
resources available to them and on the extent to which they receive support from social
networks and community services. The results indicate that a stronger focus on the
interactions among resident activities and apartment characteristics is needed, followed
by an examination of the role of outdoor environments.
44
A primary conclusion of this chapter concerns the role of human activities, which were
notable in their (positive and negative) mediating influences on measured indoor thermal
and air quality conditions, and well-being. Measured PM2.5 and CO2 concentrations were
influenced by behaviors such as window closing, smoking, lighting candles or incense
and having pets, in addition to the local climate. On the other hand, indoor heat index was
impacted more by the outdoor climate and building systems, especially the type of air-
conditioning systems. Yet, it was shown that residents in apartments with poor building
envelopes engaged in more adaptative actions, such as operating windows and fans,
cooking less, drinking extra water and adjusting clothing. Such actions have also been
positively linked to lower heat risks elsewhere (Bouchama, 2007; Zanobetti, 2012).
Additional factors, such as outdoor amenities appeared to affect the residents’ thermal
experience; seniors spent more time outside in sites with better landscaping (shaded
yards, community gardens etc.), substantiating the influence of these affordances.
As further empirical analysis emerges, a restructuring of the heat wave SES framework to
emphasize and further elaborate second-level attributes, especially human behavior, may
prove fruitful. Documenting the heat wave experiences of low-income seniors in the
urban environment of Elizabeth, NJ indicated that, while the role of infrastructure
systems is vital, in the end, heat adaptation depends on individual behavior and actions,
and the extent to which they receive support from area organizations and institutions.
Adaptation to heat waves, comprising individual, interpersonal, community-based,
institutional, environmental and public policy interventions lowers the percent increase in
heat wave-related deaths. The SES framework is a tool through which to characterize the
empirical pathways of adaptation and correspondingly how to improve upon them.
45
3. Chapter 3 Indoor Environments: Thermal Conditions and
Senior Resident Behaviors
Drawing on findings from chapter 2 and the community of Elizabeth, NJ, USA, this
chapter closely examines the role of indoor environments in mediating heat, which
corresponds to the 2nd research question of this dissertation3. It investigates the
summertime thermal performance of apartments within the 3 public housing sites and the
seniors' adaptive responses, based on data from sensors, interviews and plans. It adopts
an occupant-centric approach based on multi-level regression that utilizes the indoor heat
index as a proxy for heat stress, against site and building characteristics, and
environmental and personal variables. The chapter concludes with a discussion of the
results and next steps.
3.1 Background
Indoor Environment and Heat Vulnerability
Ongoing research on the thermal performance of residential housing aims to improve
energy efficiency and thermal comfort, both in new design and in building retrofits. But
building energy efficiency often appears as a separate design and operational objective
from building comfort, which aims at thermal comfort and improved indoor
environmental quality, despite their many interrelationships (Park and Nagy, 2018). In
both cases, an integrated design approach is preferred that considers several factors,
3 The information presented in this chapter comes from a co-authored peer-reviewed research paper
published in the Journal of Building and Environment. The citation is: Tsoulou, I., Andrews, C. J., He, R.,
Mainelis, G., & Senick, J. (2020). Summertime thermal conditions and senior resident behaviors in public
housing: A case study in Elizabeth, NJ, USA. Building and Environment, 168, 106411.
46
including the climate, building characteristics and technology, occupant behaviors and
operational practices (Li, Hong and Yan, 2014).
Regarding a building’s thermal performance, most emphasis is typically given on how
the heating, ventilating and cooling (HVAC) systems perform under specific climatic
conditions, while accounting for building envelope characteristics, including age and
geometry (Bauwens and Roels, 2013; Mohammad and Shea, 2013; Nahlik et al., 2017).
However, research directly investigating the summertime indoor thermal performance is
scarce and building control strategies rarely target cost-effective and easily accessible
retrofits that could improve the thermal conditions in low-income households (Nahlik et
al., 2017). In addition, common practice largely ignores aspects of occupant behavior and
their effect on a building’s thermal conditions and related energy use (Andrews et al.,
2016; Azar and Menassa, 2012; O'Brien and Gunay, 2014).
Research focusing on thermal comfort adopts instead an occupant-centric approach that
aims at understanding the effect of human behavior (Park and Nagy, 2018), since
occupants are the end-users of energy in buildings (D’Oca et al., 2017). Thermal comfort
is generally perceived as the human perception of satisfaction with the thermal
environment based on external and internal stimuli (ASHRAE 55, 2013). More recently,
several studies have started approaching a building’s comfort and efficient operation in
an integrated fashion (Langevin, Wen and Gurian, 2016; Marinakis et al., 2013; Park and
Nagy, 2018; Veselý and Zeiler, 2014), and the contribution of occupants’ adaptive
behaviors is well recognized (Hong and Lin, 2013; Langevin, Wen and Gurian, 2016).
However, it is still quite challenging to formally include multiple aspects of those
47
behaviors in building performance simulation (BPS) tools (Andrews et al., 2016; O'Brien
and Gunay, 2014).
Perhaps the most dominant model of thermal comfort is the Predicted Mean Vote (PMV)
by Fanger (1970), which has been incorporated in the ASHRAE-55 and ISO 7730
standards (ASHRAE 55, 2013; ISO 7730, 2005). It combines environmental factors -
temperature, humidity, and air speed - with personal factors - metabolic rate and clothing
levels – to produce a 7-point scale of thermal sensations (Kim, Schiavon and Brager,
2018; Park and Nagy, 2018). An alternative to the PMV is the adaptive model, which is
also part of the ASHRAE 55 and ISO 7730 standards (ASHRAE 55, 2013; ISO 7730,
2005), and linearly connects indoor operative temperature and satisfaction with the
outdoor temperature (Escandon, Suarez and Sendra, 2019; Kim, Schiavon and Brager,
2018; Park and Nagy, 2018). PMV is generally used in mechanically-ventilated
buildings, and the adaptive model is preferred in naturally-ventilated buildings
(ASHRAE 55, 2013).
Due to recent advances in data collection and methods, there is a shift towards personal
comfort models, where the focus is on understanding the behavior and comfort of
individuals instead of groups and related models are more dynamic compared to the
traditional PMV and adaptive approaches, as they get updated based on continuous data
input (Kim, Schiavon and Brager, 2018; Peng, Nagy and Schluter, 2019). Yet, there are
limited studies on the adaptive responses of vulnerable groups, such as the elderly,
despite the need to improve the health and welfare of those populations.
48
3.2 Methods
After the preliminary exploration of the SES components in chapter 2, this chapter
focuses on the seniors’ indoor environments and examines the summertime thermal
performance of apartments within the public housing sites in Elizabeth, NJ, USA and the
residents’ adaptive responses to this performance.
Based on hypotheses 1 and 2 of the 2nd research question, outlined in Table 1.5, the
objectives of this chapter are:
• To examine the relative effects of the outdoor climate, the site and apartment
characteristics and the residents’ actions on the indoor thermal performance.
• To investigate thermal variations in apartments across and within sites with
different indoor and outdoor characteristics.
• To identify behavioral variations and temporal patterns among seniors residing in
different sites.
• To identify cost-effective and easily accessible strategies that depend on
individual behaviors and outdoor amenities to help seniors in public housing
communities cope with heat.
Data Analysis
The data analysis is guided by the premise that since seniors spend about 90% of their
time indoors (ASHRAE, 2011; Klepeis et al., 2001; Spalt et al., 2016), indoor
environmental quality is particularly important for their health and well-being (Arif et al.,
2016). When summer temperatures are up, the focus is on indoor heat stress, which, here,
is approximated by the indoor heat index. Therefore, IHI outcomes are examined against
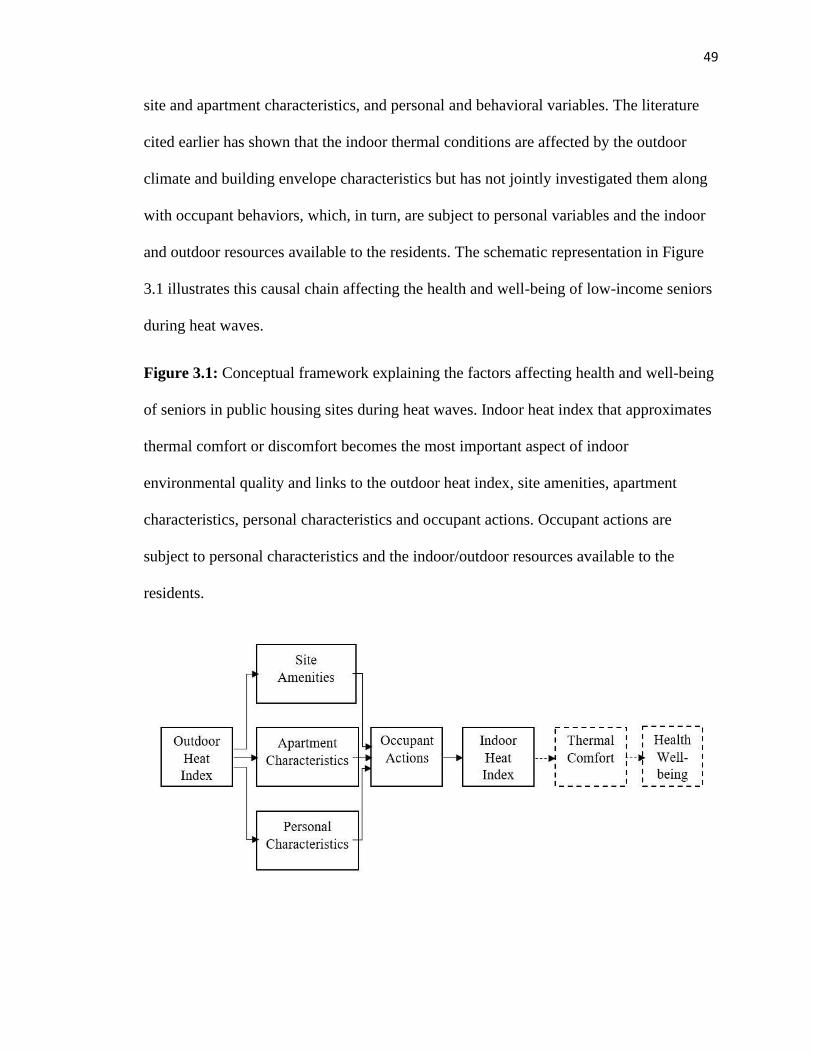
49
site and apartment characteristics, and personal and behavioral variables. The literature
cited earlier has shown that the indoor thermal conditions are affected by the outdoor
climate and building envelope characteristics but has not jointly investigated them along
with occupant behaviors, which, in turn, are subject to personal variables and the indoor
and outdoor resources available to the residents. The schematic representation in Figure
3.1 illustrates this causal chain affecting the health and well-being of low-income seniors
during heat waves.
Figure 3.1: Conceptual framework explaining the factors affecting health and well-being
of seniors in public housing sites during heat waves. Indoor heat index that approximates
thermal comfort or discomfort becomes the most important aspect of indoor
environmental quality and links to the outdoor heat index, site amenities, apartment
characteristics, personal characteristics and occupant actions. Occupant actions are
subject to personal characteristics and the indoor/outdoor resources available to the
residents.
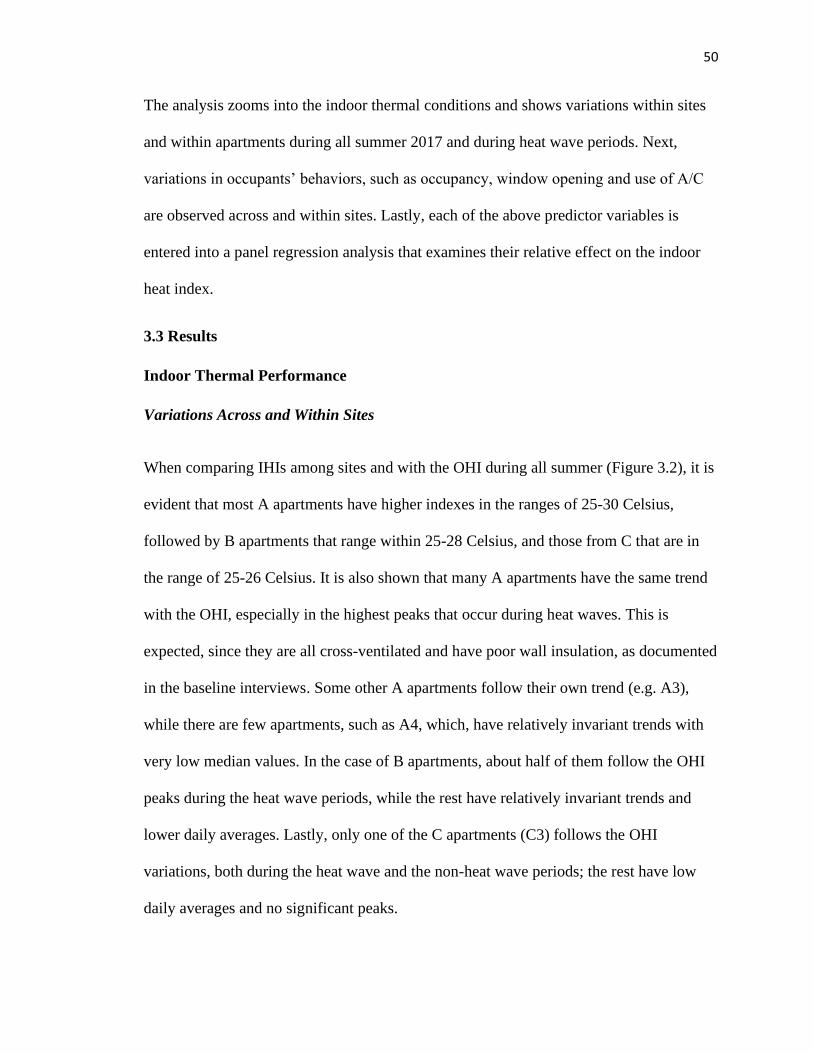
50
The analysis zooms into the indoor thermal conditions and shows variations within sites
and within apartments during all summer 2017 and during heat wave periods. Next,
variations in occupants’ behaviors, such as occupancy, window opening and use of A/C
are observed across and within sites. Lastly, each of the above predictor variables is
entered into a panel regression analysis that examines their relative effect on the indoor
heat index.
3.3 Results
Indoor Thermal Performance
Variations Across and Within Sites
When comparing IHIs among sites and with the OHI during all summer (Figure 3.2), it is
evident that most A apartments have higher indexes in the ranges of 25-30 Celsius,
followed by B apartments that range within 25-28 Celsius, and those from C that are in
the range of 25-26 Celsius. It is also shown that many A apartments have the same trend
with the OHI, especially in the highest peaks that occur during heat waves. This is
expected, since they are all cross-ventilated and have poor wall insulation, as documented
in the baseline interviews. Some other A apartments follow their own trend (e.g. A3),
while there are few apartments, such as A4, which, have relatively invariant trends with
very low median values. In the case of B apartments, about half of them follow the OHI
peaks during the heat wave periods, while the rest have relatively invariant trends and
lower daily averages. Lastly, only one of the C apartments (C3) follows the OHI
variations, both during the heat wave and the non-heat wave periods; the rest have low
daily averages and no significant peaks.
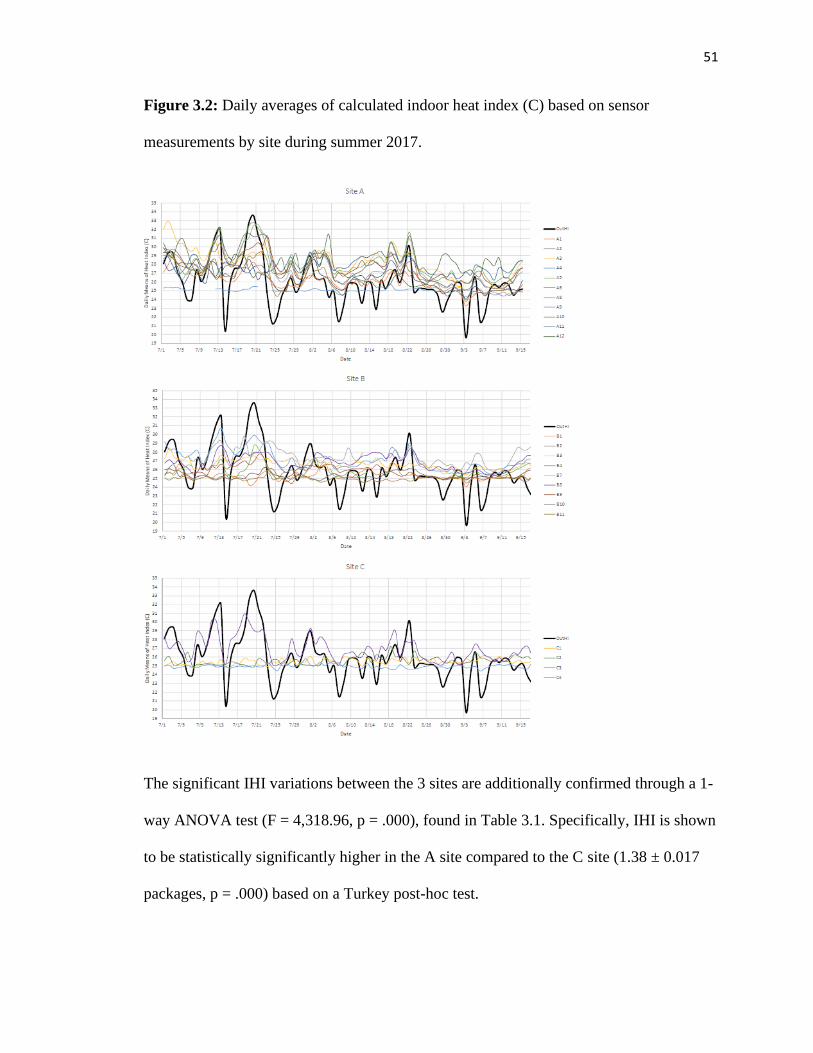
51
Figure 3.2: Daily averages of calculated indoor heat index (C) based on sensor
measurements by site during summer 2017.
The significant IHI variations between the 3 sites are additionally confirmed through a 1-
way ANOVA test (F = 4,318.96, p = .000), found in Table 3.1. Specifically, IHI is shown
to be statistically significantly higher in the A site compared to the C site (1.38 ± 0.017
packages, p = .000) based on a Turkey post-hoc test.
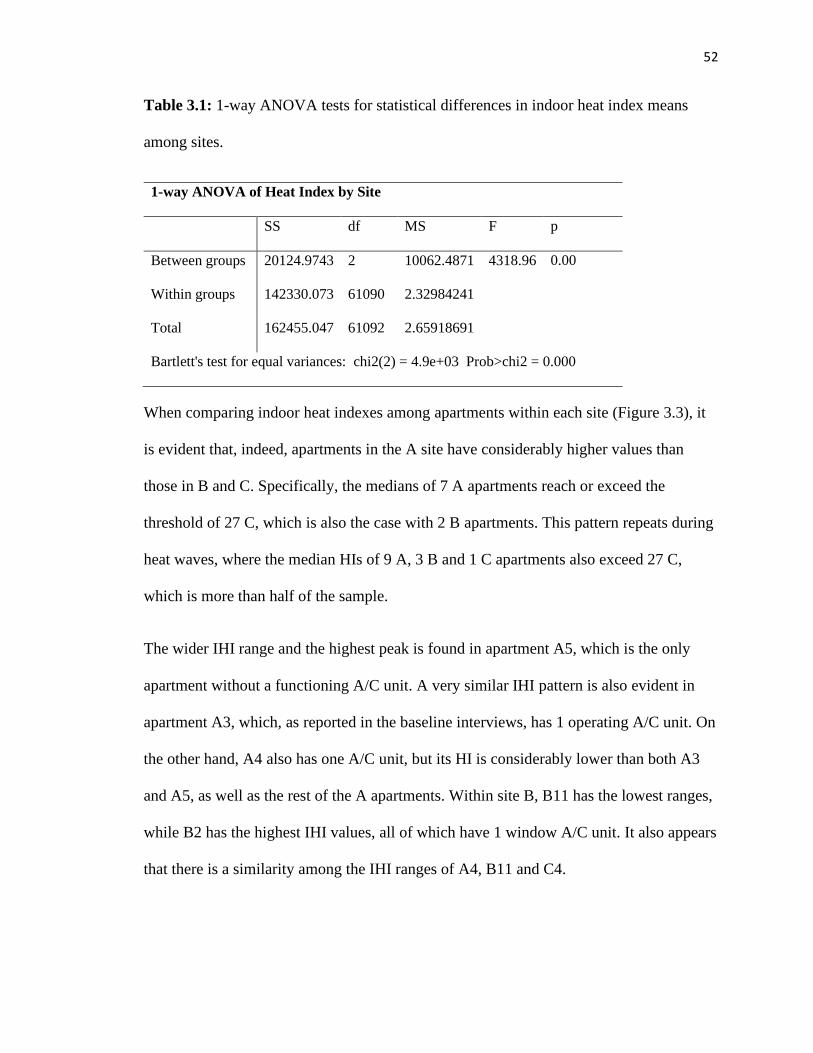
52
Table 3.1: 1-way ANOVA tests for statistical differences in indoor heat index means
among sites.
1-way ANOVA of Heat Index by Site
SS df MS F p
Between groups 20124.9743 2 10062.4871 4318.96 0.00
Within groups 142330.073 61090 2.32984241
Total 162455.047 61092 2.65918691
Bartlett's test for equal variances: chi2(2) = 4.9e+03 Prob>chi2 = 0.000
When comparing indoor heat indexes among apartments within each site (Figure 3.3), it
is evident that, indeed, apartments in the A site have considerably higher values than
those in B and C. Specifically, the medians of 7 A apartments reach or exceed the
threshold of 27 C, which is also the case with 2 B apartments. This pattern repeats during
heat waves, where the median HIs of 9 A, 3 B and 1 C apartments also exceed 27 C,
which is more than half of the sample.
The wider IHI range and the highest peak is found in apartment A5, which is the only
apartment without a functioning A/C unit. A very similar IHI pattern is also evident in
apartment A3, which, as reported in the baseline interviews, has 1 operating A/C unit. On
the other hand, A4 also has one A/C unit, but its HI is considerably lower than both A3
and A5, as well as the rest of the A apartments. Within site B, B11 has the lowest ranges,
while B2 has the highest IHI values, all of which have 1 window A/C unit. It also appears
that there is a similarity among the IHI ranges of A4, B11 and C4.
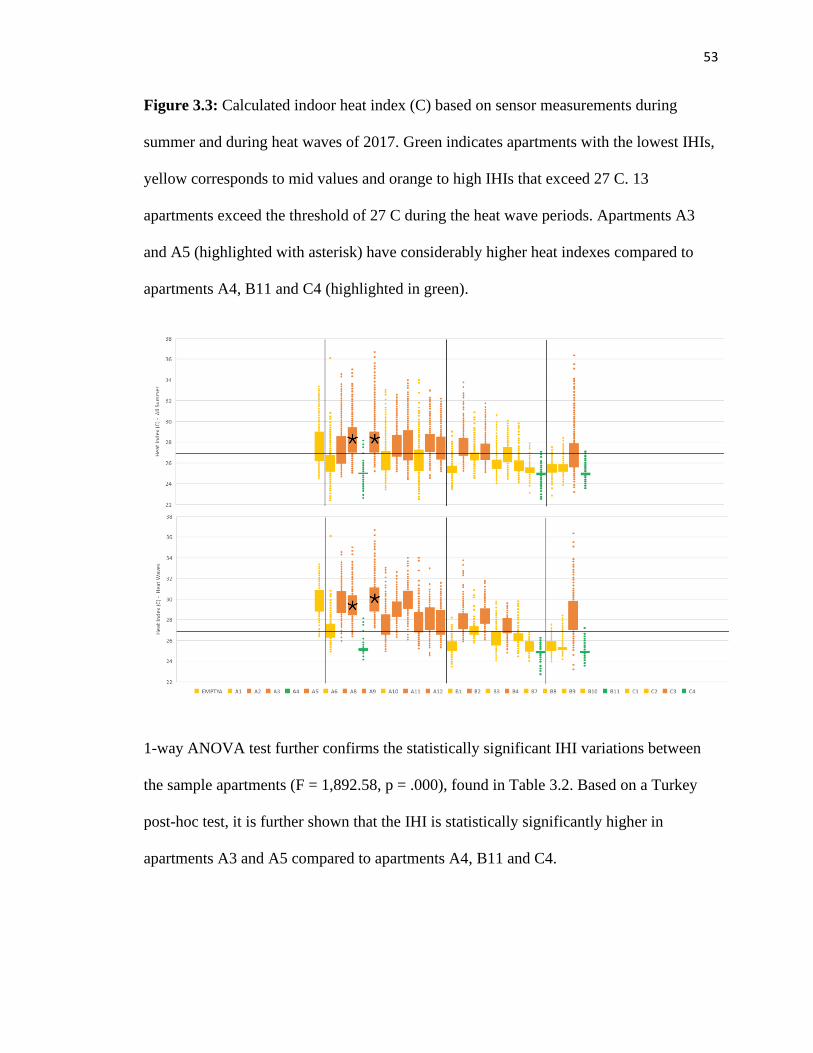
53
Figure 3.3: Calculated indoor heat index (C) based on sensor measurements during
summer and during heat waves of 2017. Green indicates apartments with the lowest IHIs,
yellow corresponds to mid values and orange to high IHIs that exceed 27 C. 13
apartments exceed the threshold of 27 C during the heat wave periods. Apartments A3
and A5 (highlighted with asterisk) have considerably higher heat indexes compared to
apartments A4, B11 and C4 (highlighted in green).
1-way ANOVA test further confirms the statistically significant IHI variations between
the sample apartments (F = 1,892.58, p = .000), found in Table 3.2. Based on a Turkey
post-hoc test, it is further shown that the IHI is statistically significantly higher in
apartments A3 and A5 compared to apartments A4, B11 and C4.
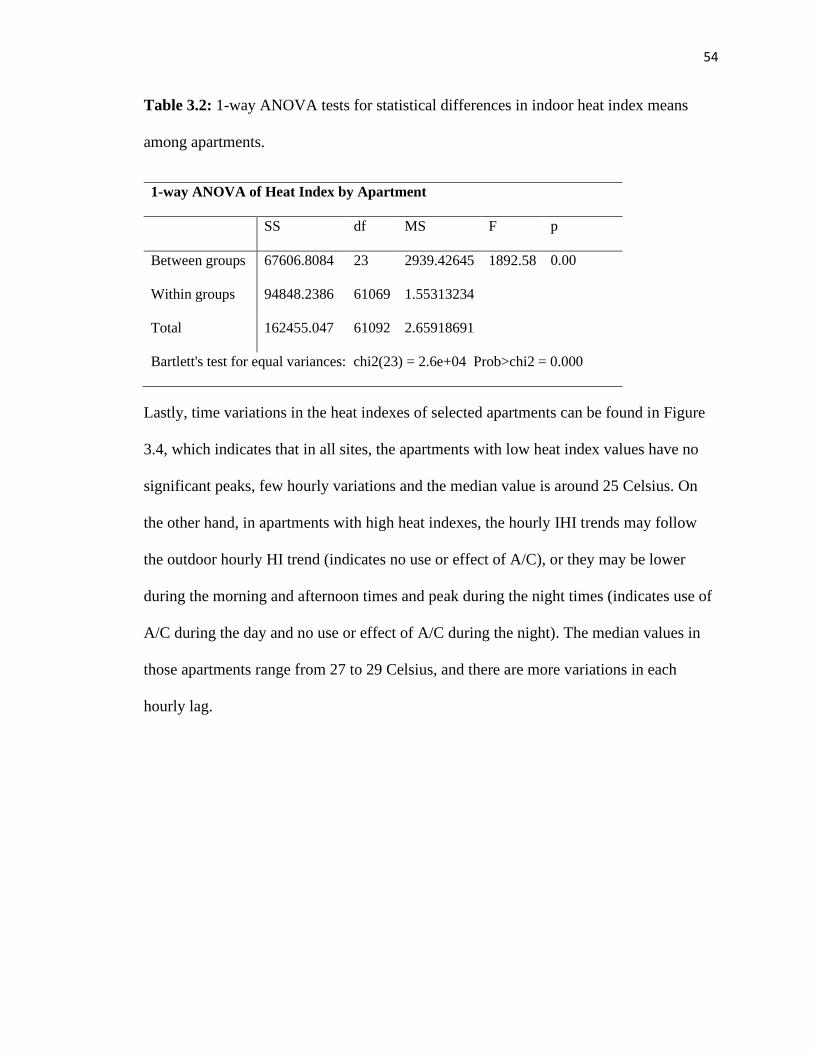
54
Table 3.2: 1-way ANOVA tests for statistical differences in indoor heat index means
among apartments.
1-way ANOVA of Heat Index by Apartment
SS df MS F p
Between groups 67606.8084 23 2939.42645 1892.58 0.00
Within groups 94848.2386 61069 1.55313234
Total 162455.047 61092 2.65918691
Bartlett's test for equal variances: chi2(23) = 2.6e+04 Prob>chi2 = 0.000
Lastly, time variations in the heat indexes of selected apartments can be found in Figure
3.4, which indicates that in all sites, the apartments with low heat index values have no
significant peaks, few hourly variations and the median value is around 25 Celsius. On
the other hand, in apartments with high heat indexes, the hourly IHI trends may follow
the outdoor hourly HI trend (indicates no use or effect of A/C), or they may be lower
during the morning and afternoon times and peak during the night times (indicates use of
A/C during the day and no use or effect of A/C during the night). The median values in
those apartments range from 27 to 29 Celsius, and there are more variations in each
hourly lag.
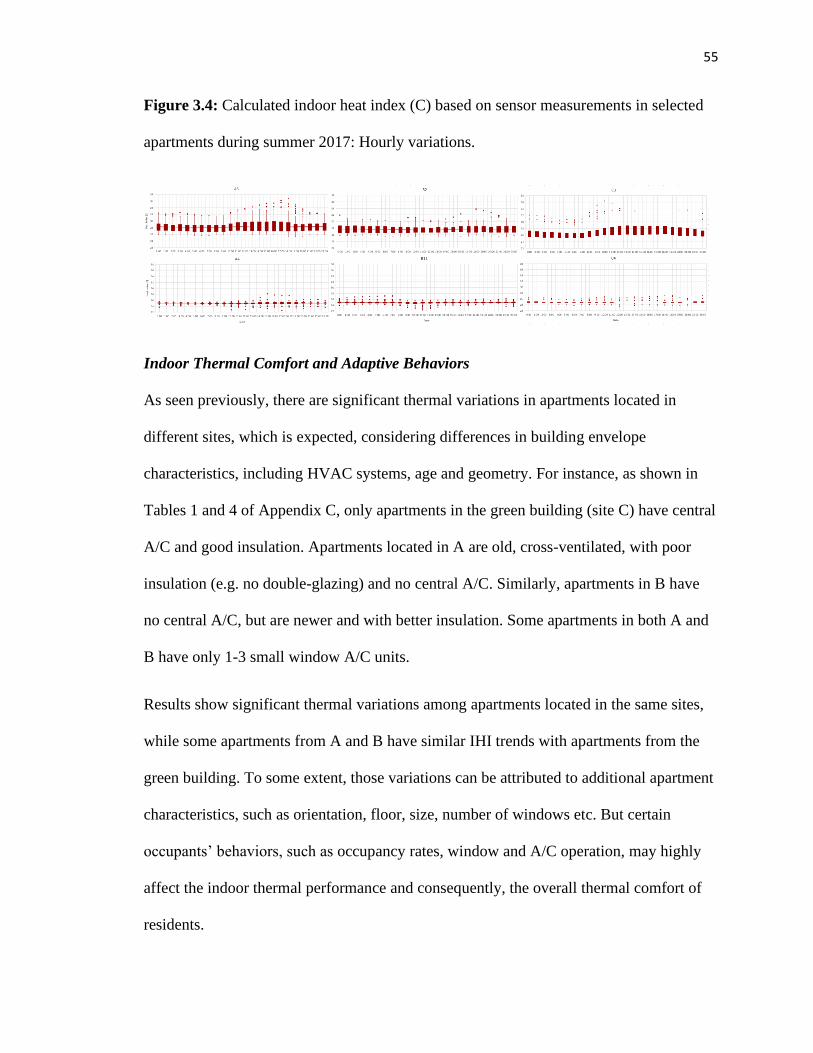
55
Figure 3.4: Calculated indoor heat index (C) based on sensor measurements in selected
apartments during summer 2017: Hourly variations.
Indoor Thermal Comfort and Adaptive Behaviors
As seen previously, there are significant thermal variations in apartments located in
different sites, which is expected, considering differences in building envelope
characteristics, including HVAC systems, age and geometry. For instance, as shown in
Tables 1 and 4 of Appendix C, only apartments in the green building (site C) have central
A/C and good insulation. Apartments located in A are old, cross-ventilated, with poor
insulation (e.g. no double-glazing) and no central A/C. Similarly, apartments in B have
no central A/C, but are newer and with better insulation. Some apartments in both A and
B have only 1-3 small window A/C units.
Results show significant thermal variations among apartments located in the same sites,
while some apartments from A and B have similar IHI trends with apartments from the
green building. To some extent, those variations can be attributed to additional apartment
characteristics, such as orientation, floor, size, number of windows etc. But certain
occupants’ behaviors, such as occupancy rates, window and A/C operation, may highly
affect the indoor thermal performance and consequently, the overall thermal comfort of
residents.
56
As documented in the baseline interviews, the overall self-reported comfort of seniors
across sites shows a consistent story with the sensors (Figure 3.5). There are high
percentages of dissatisfaction in all sites regarding the indoor air drafts, feeling of
stuffiness and extreme humidity, while half of the sample also reported feeling
uncomfortably warm during summer. As expected, the percentage of occupants
complaining that they are uncomfortably warm is higher in site A, but it is unexpected to
see a similar percentage of dissatisfaction in site C.
Figure 3.5: Self-reported general thermal comfort during summer of 2017 from the
baseline interviews. A high percentage of residents located in site A report thermal
discomfort, followed by residents in C and B.
Adaptive Behaviors Across and Within Sites
The most frequently reported behaviors in the baseline (all summer) and follow-up (heat
waves) interviews shown in Table 2.2, include the use of air-conditioning as the most
popular action, followed by fans, window opening (WO) and clothing adjustment.
Leaving the apartment is another consideration, although, as mentioned in chapter 2, it is
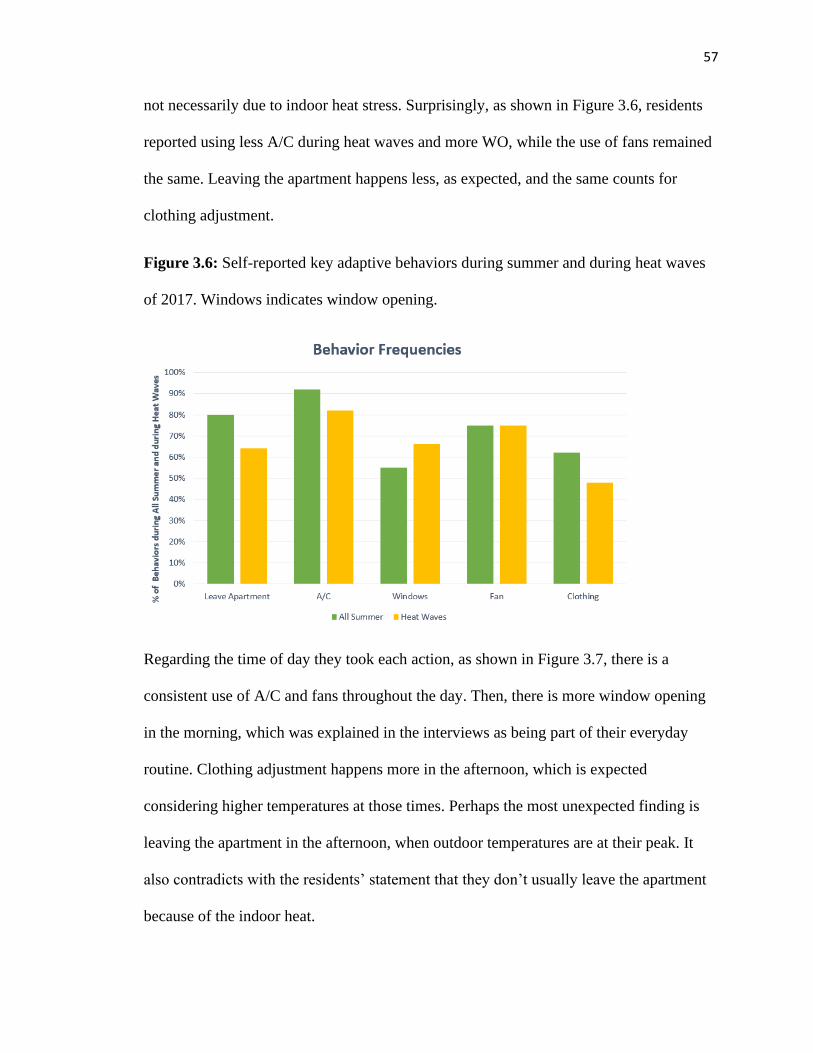
57
not necessarily due to indoor heat stress. Surprisingly, as shown in Figure 3.6, residents
reported using less A/C during heat waves and more WO, while the use of fans remained
the same. Leaving the apartment happens less, as expected, and the same counts for
clothing adjustment.
Figure 3.6: Self-reported key adaptive behaviors during summer and during heat waves
of 2017. Windows indicates window opening.
Regarding the time of day they took each action, as shown in Figure 3.7, there is a
consistent use of A/C and fans throughout the day. Then, there is more window opening
in the morning, which was explained in the interviews as being part of their everyday
routine. Clothing adjustment happens more in the afternoon, which is expected
considering higher temperatures at those times. Perhaps the most unexpected finding is
leaving the apartment in the afternoon, when outdoor temperatures are at their peak. It
also contradicts with the residents’ statement that they don’t usually leave the apartment
because of the indoor heat.
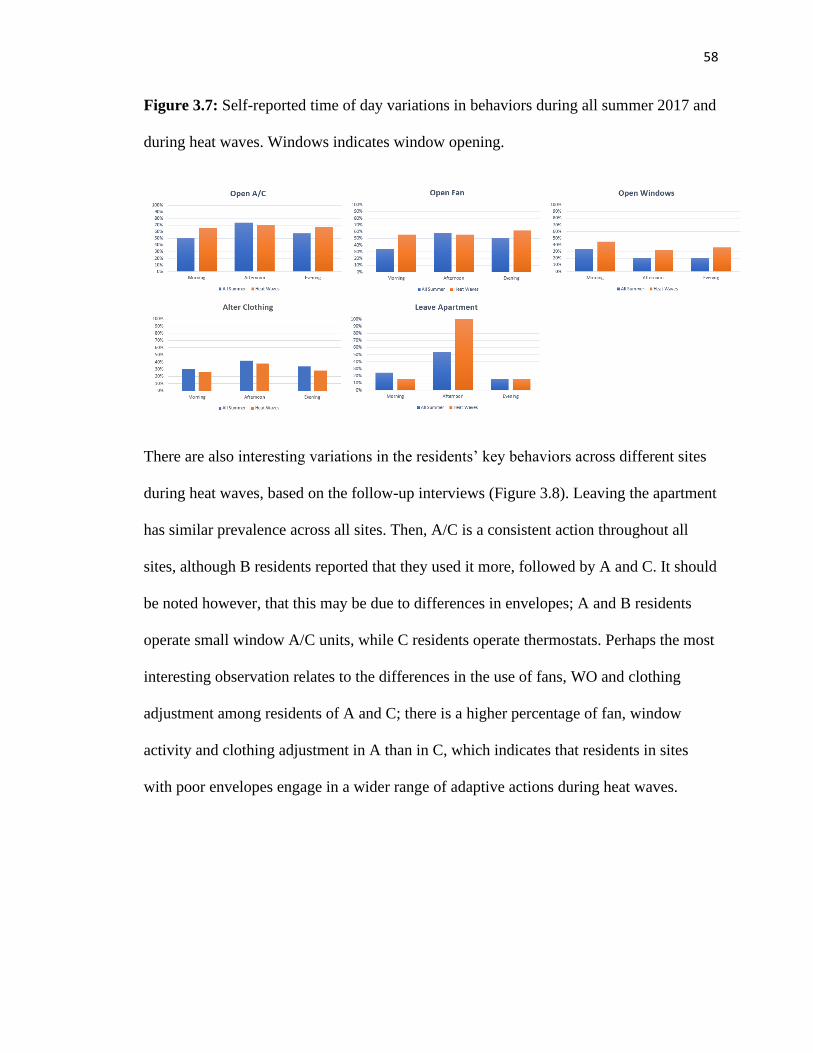
58
Figure 3.7: Self-reported time of day variations in behaviors during all summer 2017 and
during heat waves. Windows indicates window opening.
There are also interesting variations in the residents’ key behaviors across different sites
during heat waves, based on the follow-up interviews (Figure 3.8). Leaving the apartment
has similar prevalence across all sites. Then, A/C is a consistent action throughout all
sites, although B residents reported that they used it more, followed by A and C. It should
be noted however, that this may be due to differences in envelopes; A and B residents
operate small window A/C units, while C residents operate thermostats. Perhaps the most
interesting observation relates to the differences in the use of fans, WO and clothing
adjustment among residents of A and C; there is a higher percentage of fan, window
activity and clothing adjustment in A than in C, which indicates that residents in sites
with poor envelopes engage in a wider range of adaptive actions during heat waves.
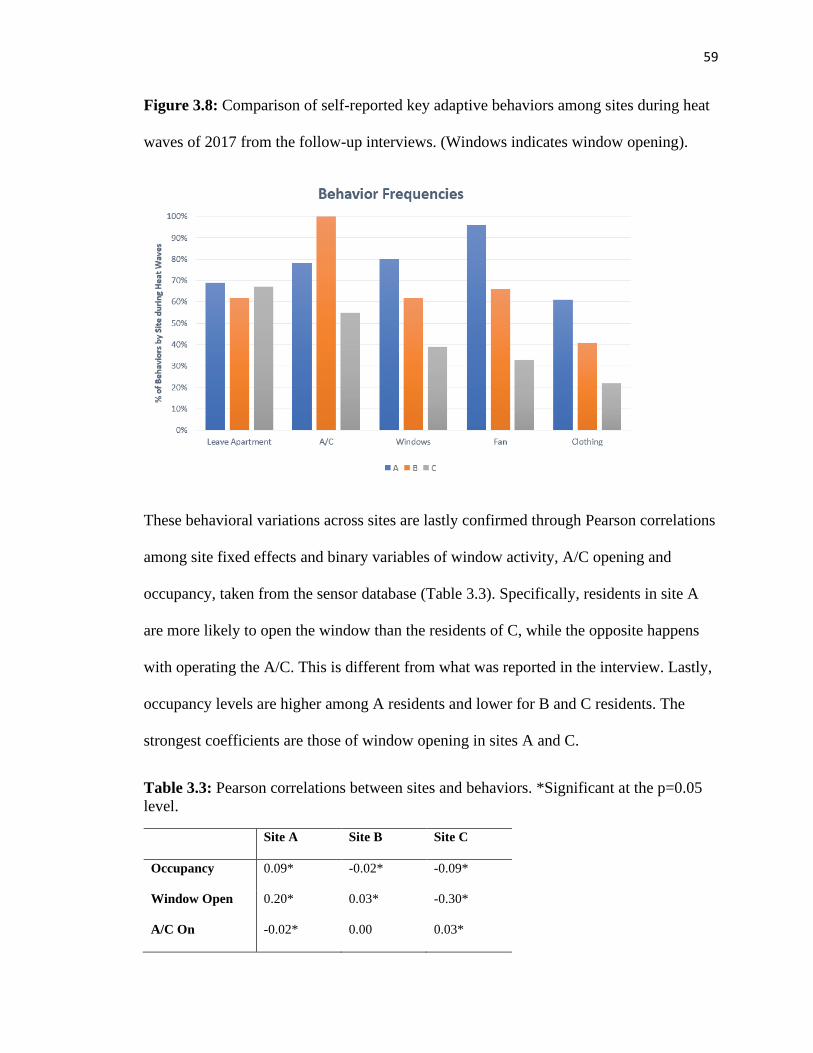
59
Figure 3.8: Comparison of self-reported key adaptive behaviors among sites during heat
waves of 2017 from the follow-up interviews. (Windows indicates window opening).
These behavioral variations across sites are lastly confirmed through Pearson correlations
among site fixed effects and binary variables of window activity, A/C opening and
occupancy, taken from the sensor database (Table 3.3). Specifically, residents in site A
are more likely to open the window than the residents of C, while the opposite happens
with operating the A/C. This is different from what was reported in the interview. Lastly,
occupancy levels are higher among A residents and lower for B and C residents. The
strongest coefficients are those of window opening in sites A and C.
Table 3.3: Pearson correlations between sites and behaviors. *Significant at the p=0.05
level.
Site A Site B Site C
Occupancy 0.09* -0.02* -0.09*
Window Open 0.20* 0.03* -0.30*
A/C On -0.02* 0.00 0.03*
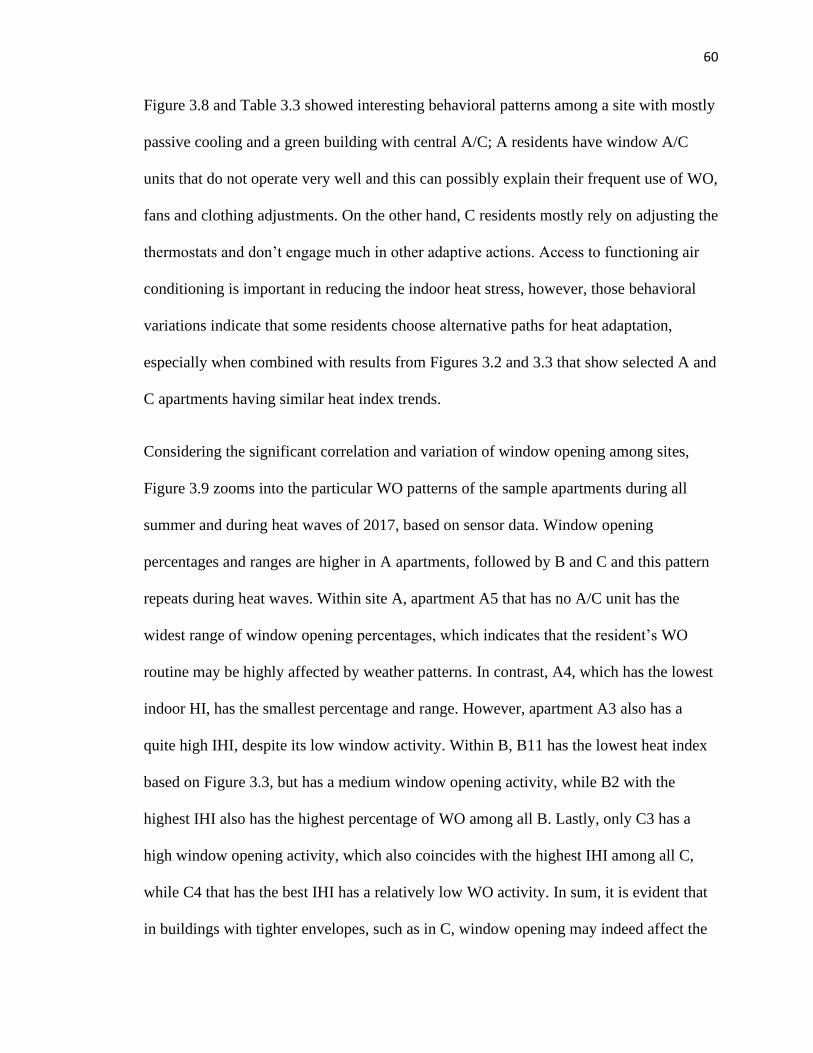
60
Figure 3.8 and Table 3.3 showed interesting behavioral patterns among a site with mostly
passive cooling and a green building with central A/C; A residents have window A/C
units that do not operate very well and this can possibly explain their frequent use of WO,
fans and clothing adjustments. On the other hand, C residents mostly rely on adjusting the
thermostats and don’t engage much in other adaptive actions. Access to functioning air
conditioning is important in reducing the indoor heat stress, however, those behavioral
variations indicate that some residents choose alternative paths for heat adaptation,
especially when combined with results from Figures 3.2 and 3.3 that show selected A and
C apartments having similar heat index trends.
Considering the significant correlation and variation of window opening among sites,
Figure 3.9 zooms into the particular WO patterns of the sample apartments during all
summer and during heat waves of 2017, based on sensor data. Window opening
percentages and ranges are higher in A apartments, followed by B and C and this pattern
repeats during heat waves. Within site A, apartment A5 that has no A/C unit has the
widest range of window opening percentages, which indicates that the resident’s WO
routine may be highly affected by weather patterns. In contrast, A4, which has the lowest
indoor HI, has the smallest percentage and range. However, apartment A3 also has a
quite high IHI, despite its low window activity. Within B, B11 has the lowest heat index
based on Figure 3.3, but has a medium window opening activity, while B2 with the
highest IHI also has the highest percentage of WO among all B. Lastly, only C3 has a
high window opening activity, which also coincides with the highest IHI among all C,
while C4 that has the best IHI has a relatively low WO activity. In sum, it is evident that
in buildings with tighter envelopes, such as in C, window opening may indeed affect the
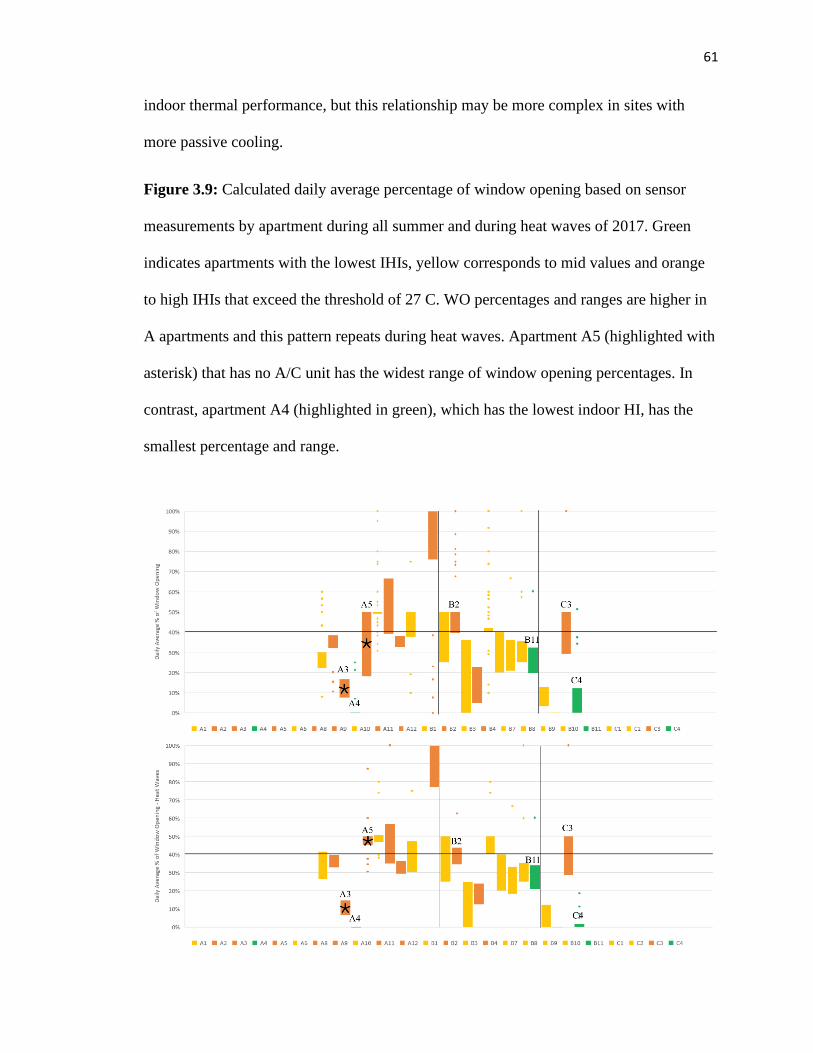
61
indoor thermal performance, but this relationship may be more complex in sites with
more passive cooling.
Figure 3.9: Calculated daily average percentage of window opening based on sensor
measurements by apartment during all summer and during heat waves of 2017. Green
indicates apartments with the lowest IHIs, yellow corresponds to mid values and orange
to high IHIs that exceed the threshold of 27 C. WO percentages and ranges are higher in
A apartments and this pattern repeats during heat waves. Apartment A5 (highlighted with
asterisk) that has no A/C unit has the widest range of window opening percentages. In
contrast, apartment A4 (highlighted in green), which has the lowest indoor HI, has the
smallest percentage and range.
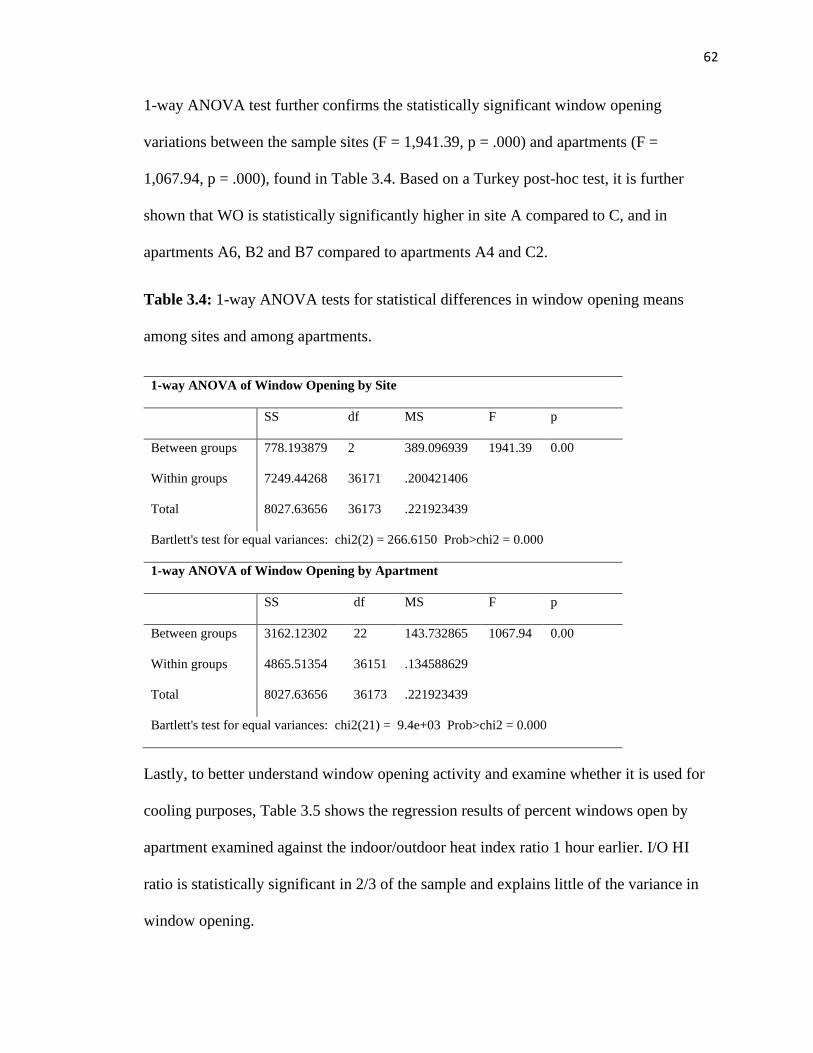
62
1-way ANOVA test further confirms the statistically significant window opening
variations between the sample sites (F = 1,941.39, p = .000) and apartments (F =
1,067.94, p = .000), found in Table 3.4. Based on a Turkey post-hoc test, it is further
shown that WO is statistically significantly higher in site A compared to C, and in
apartments A6, B2 and B7 compared to apartments A4 and C2.
Table 3.4: 1-way ANOVA tests for statistical differences in window opening means
among sites and among apartments.
1-way ANOVA of Window Opening by Site
SS df MS F p
Between groups 778.193879 2 389.096939 1941.39 0.00
Within groups 7249.44268 36171 .200421406
Total 8027.63656 36173 .221923439
Bartlett's test for equal variances: chi2(2) = 266.6150 Prob>chi2 = 0.000
1-way ANOVA of Window Opening by Apartment
SS df MS F p
Between groups 3162.12302 22 143.732865 1067.94 0.00
Within groups 4865.51354 36151 .134588629
Total 8027.63656 36173 .221923439
Bartlett's test for equal variances: chi2(21) = 9.4e+03 Prob>chi2 = 0.000
Lastly, to better understand window opening activity and examine whether it is used for
cooling purposes, Table 3.5 shows the regression results of percent windows open by
apartment examined against the indoor/outdoor heat index ratio 1 hour earlier. I/O HI
ratio is statistically significant in 2/3 of the sample and explains little of the variance in
window opening.
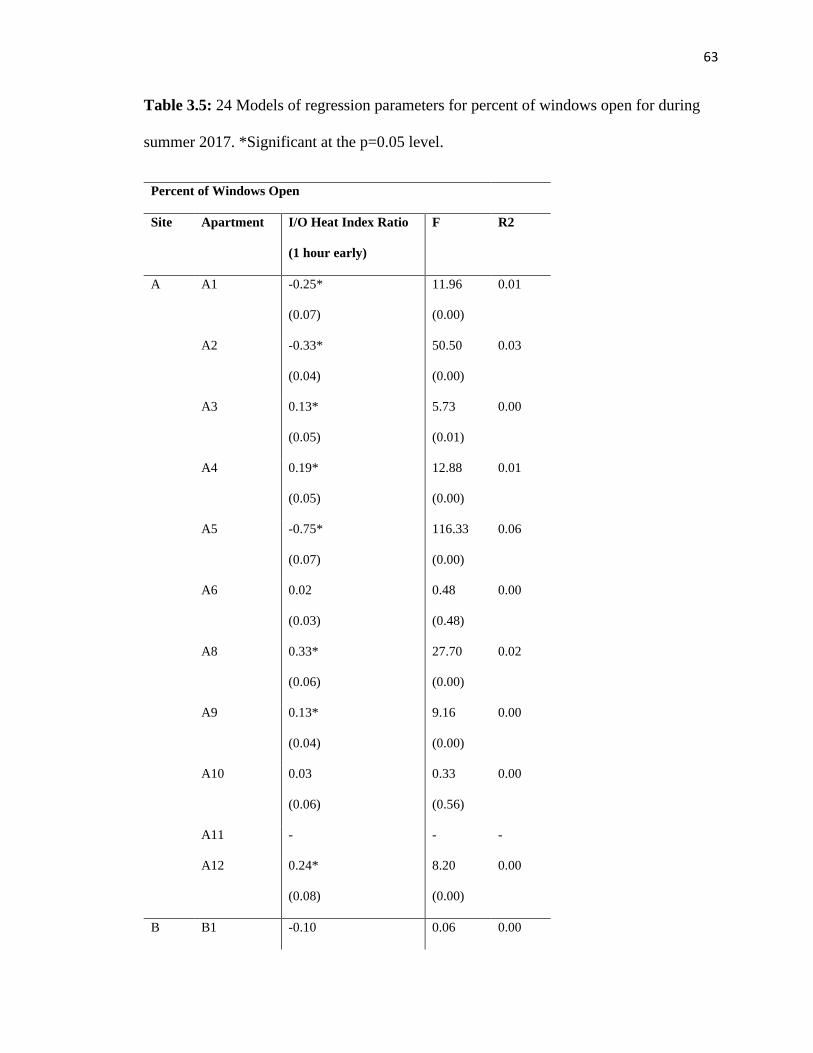
63
Table 3.5: 24 Models of regression parameters for percent of windows open for during
summer 2017. *Significant at the p=0.05 level.
Percent of Windows Open
Site Apartment I/O Heat Index Ratio
(1 hour early)
F R2
A A1 -0.25*
(0.07)
11.96
(0.00)
0.01
A2 -0.33*
(0.04)
50.50
(0.00)
0.03
A3 0.13*
(0.05)
5.73
(0.01)
0.00
A4 0.19*
(0.05)
12.88
(0.00)
0.01
A5 -0.75*
(0.07)
116.33
(0.00)
0.06
A6 0.02
(0.03)
0.48
(0.48)
0.00
A8 0.33*
(0.06)
27.70
(0.00)
0.02
A9 0.13*
(0.04)
9.16
(0.00)
0.00
A10 0.03
(0.06)
0.33
(0.56)
0.00
A11 - - -
A12 0.24*
(0.08)
8.20
(0.00)
0.00
B B1 -0.10 0.06 0.00
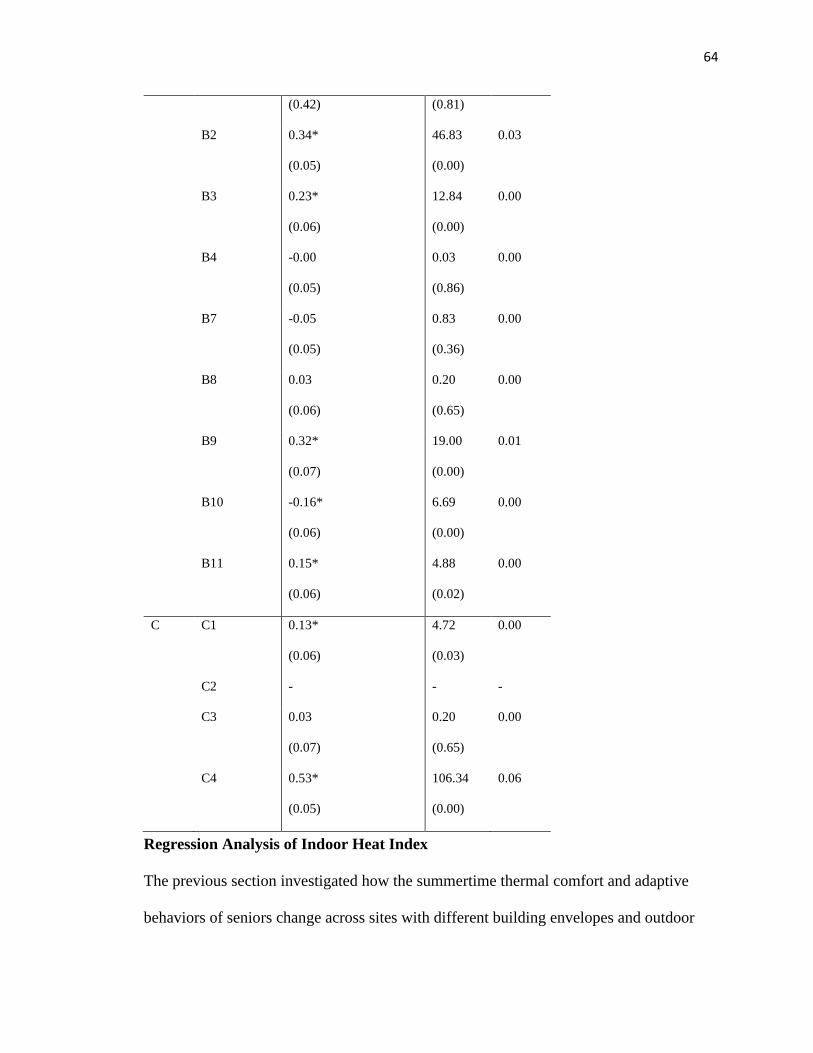
64
(0.42) (0.81)
B2 0.34*
(0.05)
46.83
(0.00)
0.03
B3 0.23*
(0.06)
12.84
(0.00)
0.00
B4 -0.00
(0.05)
0.03
(0.86)
0.00
B7 -0.05
(0.05)
0.83
(0.36)
0.00
B8 0.03
(0.06)
0.20
(0.65)
0.00
B9 0.32*
(0.07)
19.00
(0.00)
0.01
B10 -0.16*
(0.06)
6.69
(0.00)
0.00
B11 0.15*
(0.06)
4.88
(0.02)
0.00
C C1 0.13*
(0.06)
4.72
(0.03)
0.00
C2 - - -
C3 0.03
(0.07)
0.20
(0.65)
0.00
C4 0.53*
(0.05)
106.34
(0.00)
0.06
Regression Analysis of Indoor Heat Index
The previous section investigated how the summertime thermal comfort and adaptive
behaviors of seniors change across sites with different building envelopes and outdoor
65
amenities. This section examines statistical associations of the indoor heat index with 5
distinct groups of variables:
• Outdoor environment, through the time-variant, outdoor heat index,
• Site characteristics expressed through fixed effects for each site,
• Apartment characteristics that are fixed effects for orientation, floor number,
corner or middle etc.,
• The residents’ personal characteristics that include fixed effects for community
active, having pets, being an indoor smoker, and lighting candles or incense
indoors, and
• The residents’ adaptive behaviors, such as being present in the apartment, and
window and A/C opening that are binary and time-variant.
The time-variant variables are taken from the sensor database and the fixed effects are
constructed based on the interviews and the apartment plans.
Pearson Correlations of Indoor Heat Index
Table 3.6 shows Pearson correlations among the indoor heat index and selected variables
related to the outdoor climate, site and apartment characteristics, the residents’ behaviors
and the residents’ personal characteristics. More detailed correlations can be found in
Tables 2 - 6 of Appendix C, based on which, the final set of variables was selected for the
analysis.
First, there is a statistically significant correlation among the indoor and outdoor heat
indexes; as expected, with increases in the outdoor temperature and humidity, the indoor
heat index goes up. Then, there are significant correlations among all sites and the IHI;
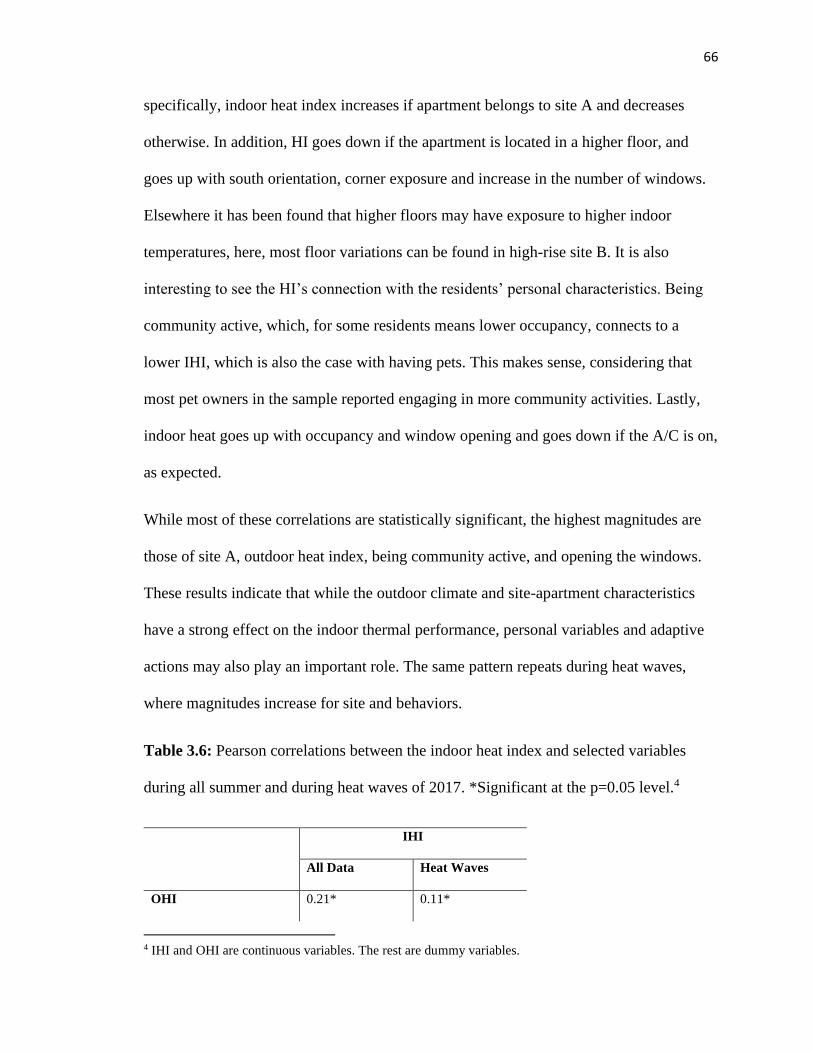
66
specifically, indoor heat index increases if apartment belongs to site A and decreases
otherwise. In addition, HI goes down if the apartment is located in a higher floor, and
goes up with south orientation, corner exposure and increase in the number of windows.
Elsewhere it has been found that higher floors may have exposure to higher indoor
temperatures, here, most floor variations can be found in high-rise site B. It is also
interesting to see the HI’s connection with the residents’ personal characteristics. Being
community active, which, for some residents means lower occupancy, connects to a
lower IHI, which is also the case with having pets. This makes sense, considering that
most pet owners in the sample reported engaging in more community activities. Lastly,
indoor heat goes up with occupancy and window opening and goes down if the A/C is on,
as expected.
While most of these correlations are statistically significant, the highest magnitudes are
those of site A, outdoor heat index, being community active, and opening the windows.
These results indicate that while the outdoor climate and site-apartment characteristics
have a strong effect on the indoor thermal performance, personal variables and adaptive
actions may also play an important role. The same pattern repeats during heat waves,
where magnitudes increase for site and behaviors.
Table 3.6: Pearson correlations between the indoor heat index and selected variables
during all summer and during heat waves of 2017. *Significant at the p=0.05 level.4
IHI
All Data Heat Waves
OHI 0.21* 0.11*
4 IHI and OHI are continuous variables. The rest are dummy variables.
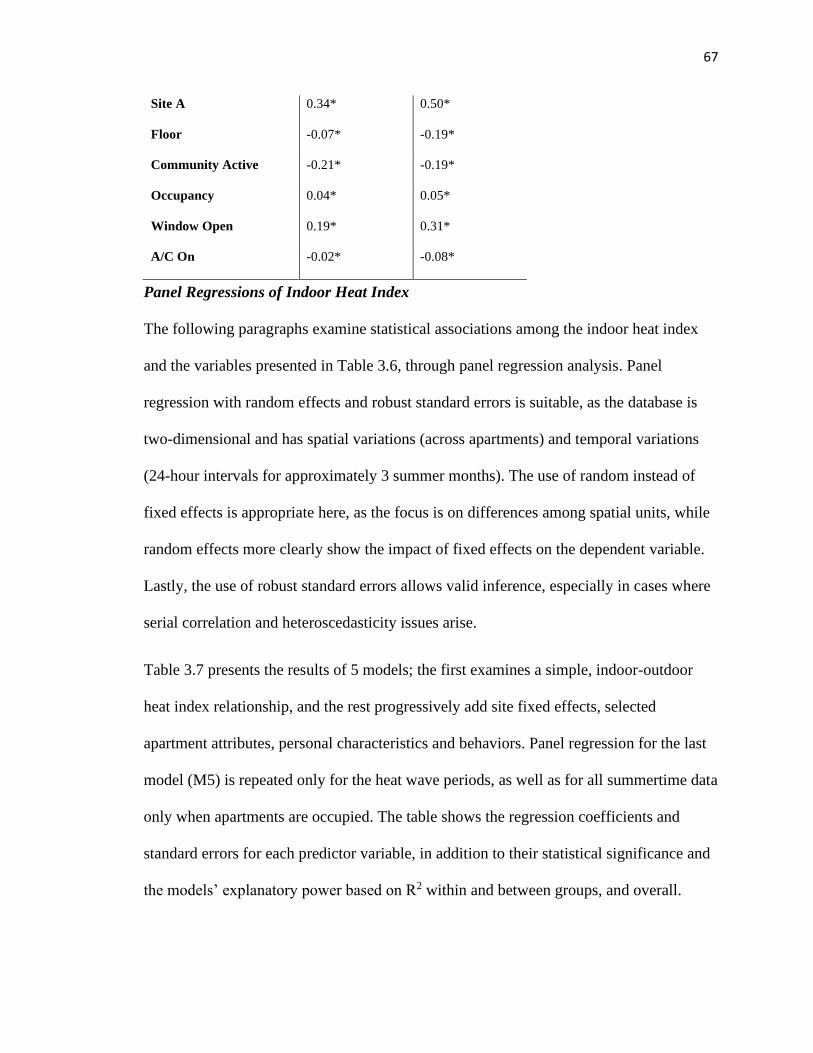
67
Site A 0.34* 0.50*
Floor -0.07* -0.19*
Community Active -0.21* -0.19*
Occupancy 0.04* 0.05*
Window Open 0.19* 0.31*
A/C On -0.02* -0.08*
Panel Regressions of Indoor Heat Index
The following paragraphs examine statistical associations among the indoor heat index
and the variables presented in Table 3.6, through panel regression analysis. Panel
regression with random effects and robust standard errors is suitable, as the database is
two-dimensional and has spatial variations (across apartments) and temporal variations
(24-hour intervals for approximately 3 summer months). The use of random instead of
fixed effects is appropriate here, as the focus is on differences among spatial units, while
random effects more clearly show the impact of fixed effects on the dependent variable.
Lastly, the use of robust standard errors allows valid inference, especially in cases where
serial correlation and heteroscedasticity issues arise.
Table 3.7 presents the results of 5 models; the first examines a simple, indoor-outdoor
heat index relationship, and the rest progressively add site fixed effects, selected
apartment attributes, personal characteristics and behaviors. Panel regression for the last
model (M5) is repeated only for the heat wave periods, as well as for all summertime data
only when apartments are occupied. The table shows the regression coefficients and
standard errors for each predictor variable, in addition to their statistical significance and
the models’ explanatory power based on R2 within and between groups, and overall.
68
In model 1 (M1), regression coefficients indicate that as the outdoor heat index goes up,
so does the indoor heat index. When the fixed effect for site A is added in model 2 (M2),
the OHI coefficient remains the same, but it clearly shown that the site has a stronger
effect; apartments in site A experience higher indoor heat indexes, which is expected
considering results from Figures 3.3 and 3.5. Model 3 (M3) adds the floor variable, which
shows an effect over the IHI, although this effect is weaker than this of site A. Here, the
floor’s direction indicates that IHI is higher for apartments located in higher floors, which
is expected, but contradicts with the results of Table 3.6. Since most floor variations are
found in site B, this finding mostly applies to its apartments. Moving forward, model 4
(M4) adds a fixed effect related to the residents’ personal characteristics. It shows that if
the residents engage in community activities several times per week, it is likely that their
apartment will have a lower heat index. This coefficient also has implications for
apartment occupancy, assuming that community active residents spend more time outside
of the apartment. The magnitude is not very strong, but it still higher than the OHI and
floor number.
The last model (M5) adds binary variables for occupant behaviors and interaction terms
related to the indoor heat index and those behaviors. Evident in the last model is that the
effect of the outdoor heat index becomes even smaller, although still statistically
significant. The same happens with the effect of site A, the floor and the community
active variables. Now, there are statistically significant and very strong effects of
occupancy, window and A/C opening on the indoor heat index. Specifically, when
apartment is occupied, with at least a window open and the A/C on, the indoor heat index
goes down. This is expected for A/C and to a certain extent for occupancy, considering
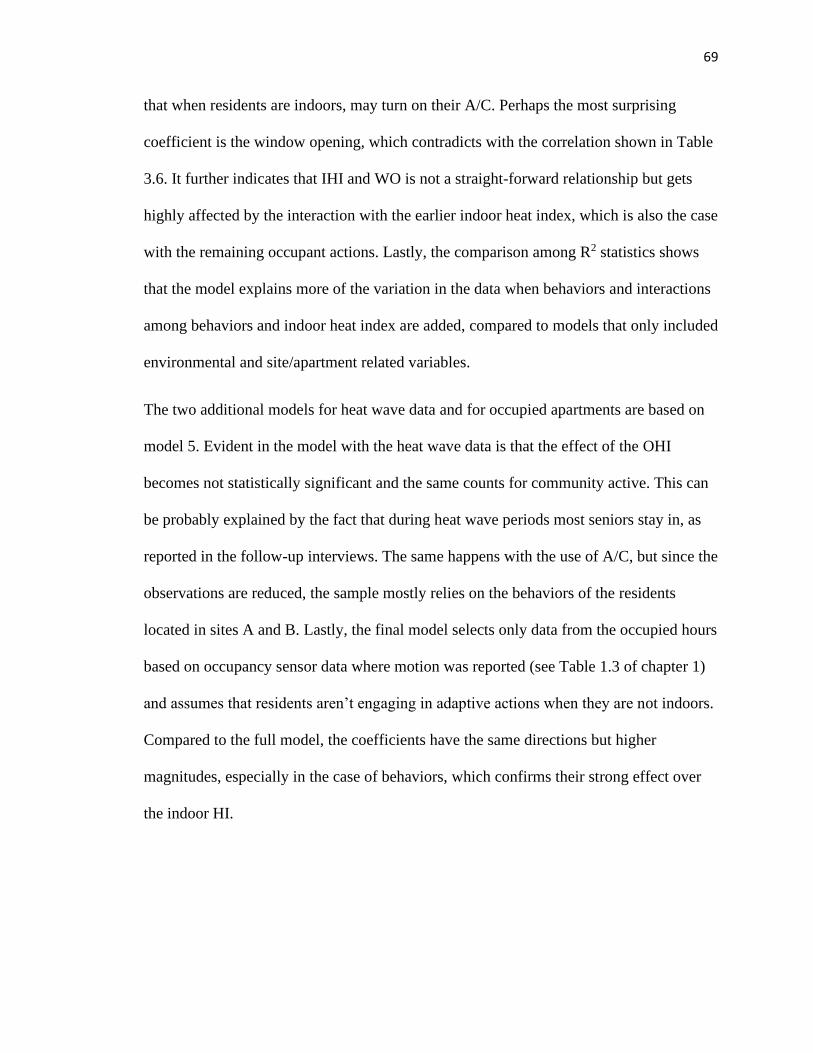
69
that when residents are indoors, may turn on their A/C. Perhaps the most surprising
coefficient is the window opening, which contradicts with the correlation shown in Table
3.6. It further indicates that IHI and WO is not a straight-forward relationship but gets
highly affected by the interaction with the earlier indoor heat index, which is also the case
with the remaining occupant actions. Lastly, the comparison among R2 statistics shows
that the model explains more of the variation in the data when behaviors and interactions
among behaviors and indoor heat index are added, compared to models that only included
environmental and site/apartment related variables.
The two additional models for heat wave data and for occupied apartments are based on
model 5. Evident in the model with the heat wave data is that the effect of the OHI
becomes not statistically significant and the same counts for community active. This can
be probably explained by the fact that during heat wave periods most seniors stay in, as
reported in the follow-up interviews. The same happens with the use of A/C, but since the
observations are reduced, the sample mostly relies on the behaviors of the residents
located in sites A and B. Lastly, the final model selects only data from the occupied hours
based on occupancy sensor data where motion was reported (see Table 1.3 of chapter 1)
and assumes that residents aren’t engaging in adaptive actions when they are not indoors.
Compared to the full model, the coefficients have the same directions but higher
magnitudes, especially in the case of behaviors, which confirms their strong effect over
the indoor HI.
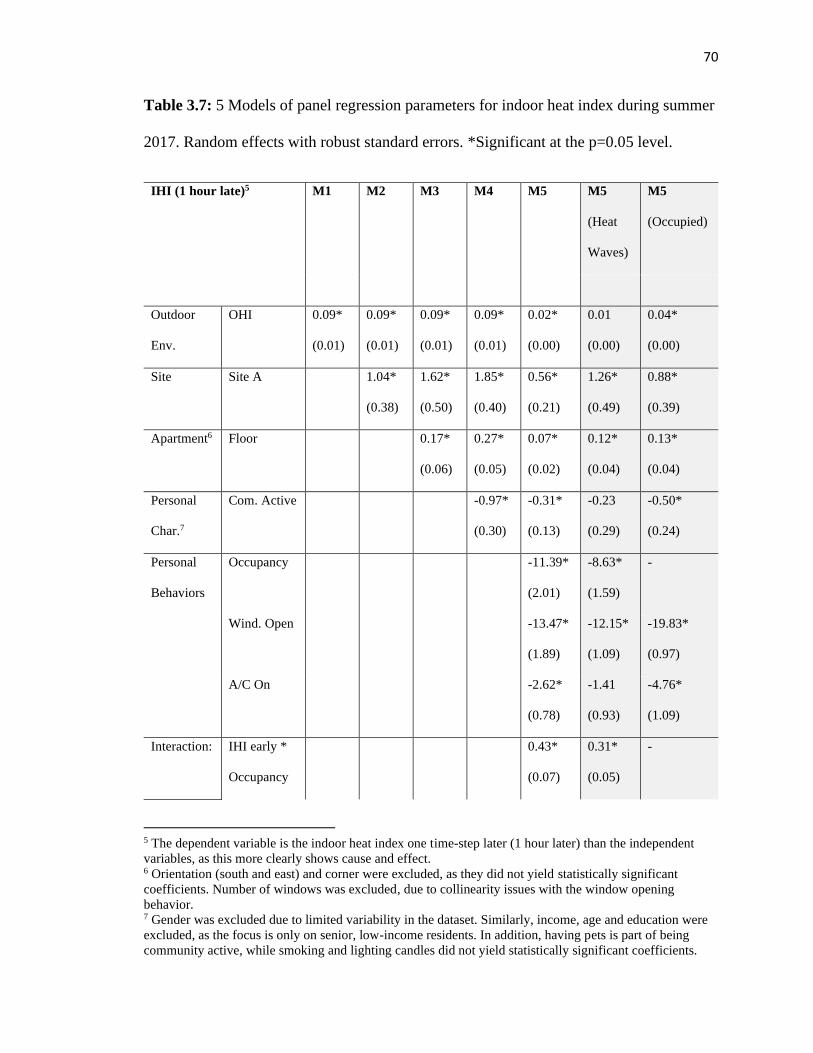
70
Table 3.7: 5 Models of panel regression parameters for indoor heat index during summer
2017. Random effects with robust standard errors. *Significant at the p=0.05 level.
IHI (1 hour late)5 M1 M2 M3 M4 M5 M5
(Heat
Waves)
M5
(Occupied)
Outdoor
Env.
OHI 0.09*
(0.01)
0.09*
(0.01)
0.09*
(0.01)
0.09*
(0.01)
0.02*
(0.00)
0.01
(0.00)
0.04*
(0.00)
Site Site A 1.04*
(0.38)
1.62*
(0.50)
1.85*
(0.40)
0.56*
(0.21)
1.26*
(0.49)
0.88*
(0.39)
Apartment6 Floor 0.17*
(0.06)
0.27*
(0.05)
0.07*
(0.02)
0.12*
(0.04)
0.13*
(0.04)
Personal
Char.7
Com. Active -0.97*
(0.30)
-0.31*
(0.13)
-0.23
(0.29)
-0.50*
(0.24)
Personal
Behaviors
Occupancy -11.39*
(2.01)
-8.63*
(1.59)
-
Wind. Open -13.47*
(1.89)
-12.15*
(1.09)
-19.83*
(0.97)
A/C On -2.62*
(0.78)
-1.41
(0.93)
-4.76*
(1.09)
Interaction: IHI early *
Occupancy
0.43*
(0.07)
0.31*
(0.05)
-
5 The dependent variable is the indoor heat index one time-step later (1 hour later) than the independent
variables, as this more clearly shows cause and effect. 6 Orientation (south and east) and corner were excluded, as they did not yield statistically significant
coefficients. Number of windows was excluded, due to collinearity issues with the window opening
behavior. 7 Gender was excluded due to limited variability in the dataset. Similarly, income, age and education were
excluded, as the focus is only on senior, low-income residents. In addition, having pets is part of being
community active, while smoking and lighting candles did not yield statistically significant coefficients.
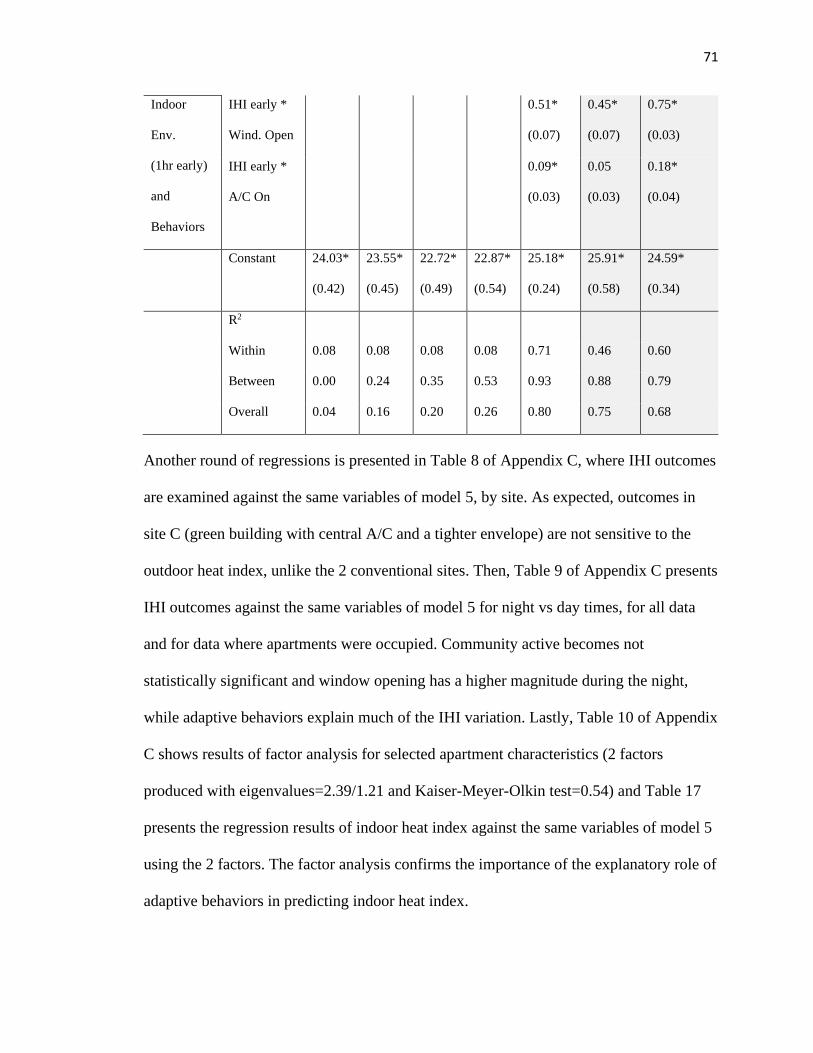
71
Indoor
Env.
(1hr early)
and
Behaviors
IHI early *
Wind. Open
0.51*
(0.07)
0.45*
(0.07)
0.75*
(0.03)
IHI early *
A/C On
0.09*
(0.03)
0.05
(0.03)
0.18*
(0.04)
Constant 24.03*
(0.42)
23.55*
(0.45)
22.72*
(0.49)
22.87*
(0.54)
25.18*
(0.24)
25.91*
(0.58)
24.59*
(0.34)
R2
Within 0.08 0.08 0.08 0.08 0.71 0.46 0.60
Between 0.00 0.24 0.35 0.53 0.93 0.88 0.79
Overall 0.04 0.16 0.20 0.26 0.80 0.75 0.68
Another round of regressions is presented in Table 8 of Appendix C, where IHI outcomes
are examined against the same variables of model 5, by site. As expected, outcomes in
site C (green building with central A/C and a tighter envelope) are not sensitive to the
outdoor heat index, unlike the 2 conventional sites. Then, Table 9 of Appendix C presents
IHI outcomes against the same variables of model 5 for night vs day times, for all data
and for data where apartments were occupied. Community active becomes not
statistically significant and window opening has a higher magnitude during the night,
while adaptive behaviors explain much of the IHI variation. Lastly, Table 10 of Appendix
C shows results of factor analysis for selected apartment characteristics (2 factors
produced with eigenvalues=2.39/1.21 and Kaiser-Meyer-Olkin test=0.54) and Table 17
presents the regression results of indoor heat index against the same variables of model 5
using the 2 factors. The factor analysis confirms the importance of the explanatory role of
adaptive behaviors in predicting indoor heat index.
72
3.4 Discussion
This chapter utilized a multi-level approach to identify the relative roles of sites,
buildings and the seniors’ actions in managing heat stress. It was observed that besides
apartment characteristics, occupant behaviors have a significant effect on indoor thermal
performance and that those behaviors vary significantly based on the resources available
to the residents. Indoor heat index distributions showed significant variations across sites
with different outdoor amenities and building envelopes, as well as across apartments
located within the same sites. The same pattern was also repeated in the residents’
behaviors. These findings, along with results from Pearson correlations and panel
regressions, suggest that heat adaptation is not only subject to built-environment
characteristics, but also depends on how people interact with their resources. This level of
agency should be part of heat adaptation strategies.
Considering that certain heat wave definitions that rely only on thresholds may ignore
significant findings from “non-heat wave” periods (Diaz et al., 2018), the approach was
based both on a whole summertime period and on selected heat wave periods. The
comparative analysis of three public housing sites with different characteristics indoors
and outdoors, further showed how built-environment variations can alter the residents’
behaviors and in turn, how those behaviors may significantly affect the indoor thermal
conditions.
Results from Tables 3.6 and 3.7 showed that selected variables related to the outdoor
environment, site and apartment attributes, personal characteristics and individual
behaviors all significantly affect the indoor thermal conditions, and should all be part of
regression analysis, considering improvements in the models’ explanatory power. More
73
specifically, the first hypothesis is supported, as an increase in the outdoor heat index
results in higher indoor heat index, and certain site and apartment characteristics
strengthen this relationship. However, the coefficient magnitudes are small, indicating
that other influences are more important in explaining indoor thermal variations. In
addition, the analysis approaches sites as bundles that include outdoor amenities and
buildings with certain envelope characteristics but does not distinguish between the two.
This is a ripe area for future work. Regarding the second hypothesis, it is confirmed that
individual behaviors have the strongest influence on the indoor heat index and their
coefficients show that they explain much of its variation, but this is not the case with the
occupants’ personal characteristics, although they may mediate occupant behaviors.
Furthermore, while it is shown that those behaviors vary by indoor/outdoor resources (by
site), only window and A/C opening can be considered adaptive behaviors, because
interviews indicate that non-occupancy/leaving the apartment is exogenous, that is, not
related to thermal conditions.
I find that the most interesting relationships are those of individual behaviors and the
effect of site on the IHI, since they are consistently stronger than the rest. Therefore, the 2
main findings are:
Site is a strong determinant of indoor thermal conditions, but there is still
substantial variation in IHI across apartments within each site.
Residents of site A do not have access to central air conditioning and some apartments
have 1-3 small window A/C units, which, as reported in the baseline interviews, became
available to them by Proceed, one local non-profit, identified in chapter 2. Their buildings
have mainly passive cooling options and are surrounded by shady yards with sitting. Site
74
B characteristics are quite similar, although the building is younger, and apartments are
not cross-ventilated. In contrast, residents of site C live in a LEED-rated building with a
tight envelope and central A/C that is included in the rent, but with limited outdoor
amenities. Overall, living in A translates to a higher indoor HI, while living in C means a
lower HI, however, this is not a one-to-one relationship. Upon a closer examination of the
indoor thermal performance by site, it is evident that within A and B, there are 2 different
groups of apartments; the first follow the same trends as the outdoor heat index and have
quite high values, which indicates that the indoor environments are inadequate in
providing shelter. The second have a less variant trend and do not follow the OHI peaks,
while having considerably lower values. Lastly, most of the C apartments belong to the
second group, except for one.
In the case of sites A and B, it is logical to assume that the apartments with a “good” HI
may have more window A/C units, better orientation or other apartment attributes that
contribute to thermal comfort. However, comparisons between HI and apartment
attributes show that while certain characteristics may partly explain those variations, they
cannot provide the full picture, as they don’t consider interactions among those attributes.
For example, in the case of A4, the IHI trend was very good, but the apartment has only 1
window A/C unit, south-east orientation, and is not located in the corner. Those
characteristics are similar to apartment A3 that had the worst HI of all A. Therefore, there
is a clear implication of behavioral contributions to the IHI. This is further confirmed,
when the seniors’ adaptive responses are shown in Figure 3.8; there were differences in
the use of windows, fans and clothing among residents of A, B and C. This makes
intuitive sense: C residents do not need to engage in a wide range of actions, since the
75
building envelopes can provide adequate support during heat, and when variations in the
IHI are observed, this may be attributed to the personal characteristics of the occupant.
Likewise, A residents don’t have as much access to A/C, which makes them more
adaptive. While convenient and affordable access to cooling is extremely important for
low-income seniors during heat waves, as shown in the literature, power outages often
coincide with heat waves, therefore, being adaptive and having nearby cooling options is
equally important.
Window opening serves multiple purposes, only one of which is heat management.
Among the residents’ behaviors examined in the regression analysis, window opening
coefficients had the highest magnitude. The strength of this relationship makes sense,
however, the direction may vary depending on the building type, the number and size of
windows and the temporal pattern. Model 5 of Table 3.7 showed that in general, when at
least one of the windows is open, the indoor heat index goes down, which was
unexpected considering the opposite direction shown in the correlations of Table 3.6.
First, the above considerations were not taken into account in the regression analysis and
in addition, interaction terms were present. The interaction term referring to WO
indicates that when the earlier IHI goes up, it significantly affects the occupant’s window
opening response, and when this interaction happens, it means an increase to the later
indoor heat index. Same as with the site, this is not a straight-forward relationship, and it
may better be examined along with other behavioral actions, such as A/C opening and
apartment characteristics. Further analysis indicated that window opening for cooling
purposes (proxied by increased opening when I/O ratio for HI is high) was only a
76
statistically significant behavior in 2/3 of apartments, and it explained very little of the
variance in window opening.
Figure 3.9 provided some additional insights for the WO patterns across and within sites,
especially when combined with Figure 3.8. In general, occupants in site A opened their
windows more than in site C. Within A, the apartment with the most WO variations was
A5, which is the only one in the sample without any A/C unit, while the least window
opening activity was seen in A4 that had the best IHI among all A. The same happened in
the case of C3; it had the highest daily averages of WO and the highest IHI among all C.
However, there were cases such as B11 and A1 with a medium WO activity and a
relatively good HI. In simplified terms, it can be assumed that if windows are
continuously open, this translates into a higher HI, but in some cases, if there is medium
WO, it can indeed benefit the indoor thermal conditions. In addition, while it is generally
recommended to close the windows during heat, some amount of daily ventilation is
required for improved indoor air quality. Therefore, the focus should not be on the total
percentage of WO, but on the particular time of day windows should remain open. To
that end, it is clear that based on their IHIs, certain apartments, such as A4, A1 and B11,
open their windows in an effective manner; however, it cannot be answered whether this
effectiveness also applies to thermal comfort, as this would require closer attention to
personal characteristics, such as the residents’ thermal preferences.
As seen in the previous paragraphs, the question of reducing indoor heat stress and
consequently improving health and well-being is complicated and includes multiple
dimensions, from outdoor amenities, to building envelopes and to the residents’
individual behaviors. Therefore, a multi-level approach is preferred. Overall, it is shown
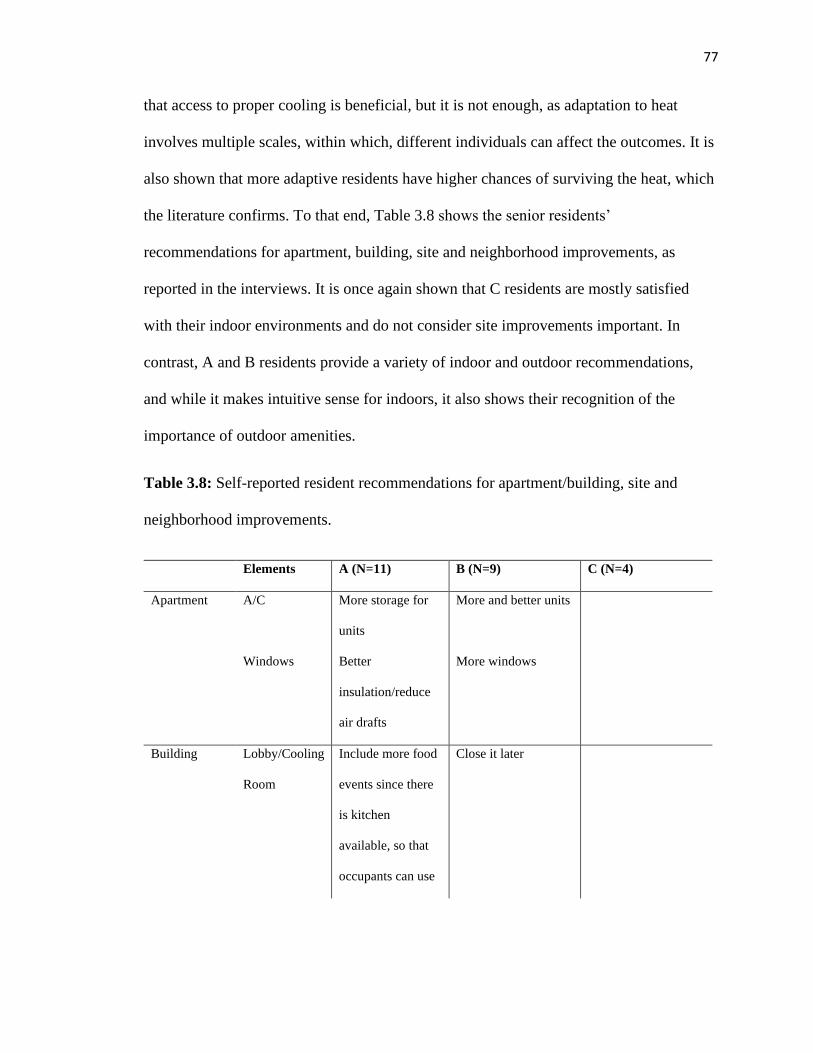
77
that access to proper cooling is beneficial, but it is not enough, as adaptation to heat
involves multiple scales, within which, different individuals can affect the outcomes. It is
also shown that more adaptive residents have higher chances of surviving the heat, which
the literature confirms. To that end, Table 3.8 shows the senior residents’
recommendations for apartment, building, site and neighborhood improvements, as
reported in the interviews. It is once again shown that C residents are mostly satisfied
with their indoor environments and do not consider site improvements important. In
contrast, A and B residents provide a variety of indoor and outdoor recommendations,
and while it makes intuitive sense for indoors, it also shows their recognition of the
importance of outdoor amenities.
Table 3.8: Self-reported resident recommendations for apartment/building, site and
neighborhood improvements.
Elements A (N=11) B (N=9) C (N=4)
Apartment A/C More storage for
units
More and better units
Windows Better
insulation/reduce
air drafts
More windows
Building Lobby/Cooling
Room
Include more food
events since there
is kitchen
available, so that
occupants can use
Close it later
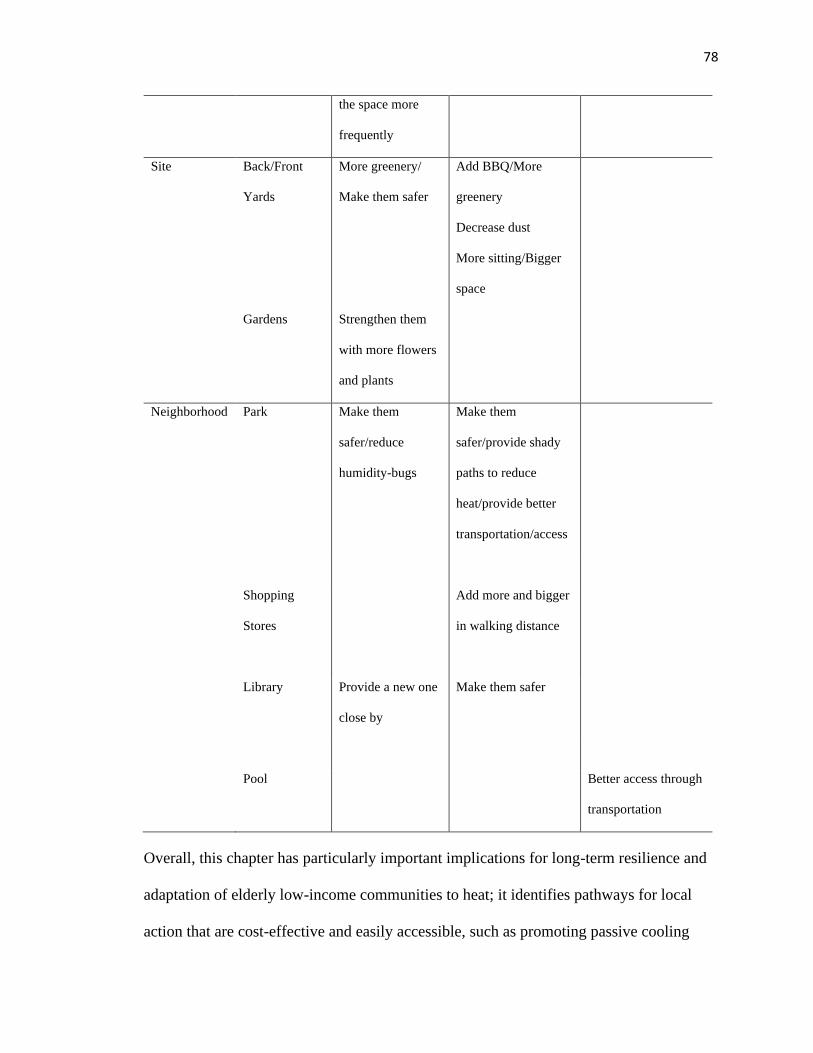
78
the space more
frequently
Site Back/Front
Yards
More greenery/
Make them safer
Add BBQ/More
greenery
Decrease dust
More sitting/Bigger
space
Gardens Strengthen them
with more flowers
and plants
Neighborhood Park Make them
safer/reduce
humidity-bugs
Make them
safer/provide shady
paths to reduce
heat/provide better
transportation/access
Shopping
Stores
Add more and bigger
in walking distance
Library Provide a new one
close by
Make them safer
Pool Better access through
transportation
Overall, this chapter has particularly important implications for long-term resilience and
adaptation of elderly low-income communities to heat; it identifies pathways for local
action that are cost-effective and easily accessible, such as promoting passive cooling
79
techniques through a combination of site landscaping and amenities and related
behavioral patterns. Further analysis should investigate the behavioral sequencing and its
effect on indoor thermal conditions during heat waves. Study of links to indoor air quality
would also be valuable, as it is also important for occupant health and well-being during
heat waves and it may affect occupant behaviors such as window opening.
80
4. Chapter 4 Indoor Environments: Behaviors and Indoor
Thermal and Air Quality Trade-offs
In response to the 2nd research question of this thesis, this chapter extends previous
analysis on indoor environments and the seniors’ summertime thermal experiences to
examine the effectiveness of natural ventilation and window operation on simultaneously
mitigating indoor heat while maintaining good indoor air quality8. The analysis is based
on environmental and behavioral monitoring data from all apartments within the 3 public
housing sites of Elizabeth, NJ, USA. Besides site characteristics and individual
behaviors, such as smoking, mixed linear models highlight window opening as an
important modifying factor of indoor thermal and air quality conditions. However,
comparisons across apartments reveal that within “smoking” apartments, there is a
thermal and air quality trade-off. The chapter concludes with a discussion of findings and
implications for the interdependencies among (1) technological and behavioral
dimensions of efforts to improve occupant comfort, and (2) thermal comfort and IAQ
outcomes.
4.1 Background
Heat, Pollution and Health in Urban Environments
While extreme heat events are among the deadliest environmental hazards (Habeeb,
Vargo and Stone, 2015; IPCC, 2014), degrading air quality is also a top threat to human
health and welfare (IEA, 2019; WHO, 2014), with a documented relationship to
8 The information presented in this chapter comes from a co-authored research paper that is submitted for
publication. The citation is: Tsoulou, I., Andrews, C. J., Senick, J., He, R., & Mainelis, G. (Under Review).
Summertime Thermal Comfort, Air Quality and Natural Ventilation in Senior Public Housing Residences.
81
increased temperatures. Much research has shown that ground-level ozone (O3),
particulate matter (PM) and nitrogen dioxide (NO2) increase with heat waves (HWs) (see
Analitis et al., 2018; Kalisa et al., 2018; Meehl et al., 2018; Papanastasiou, Melas and
Kambezidis, 2015; Patel et al., 2019; Yim et al., 2019). During the extreme European
HW of 2003, Tressol et al. (2008) identified O3 anomalies coinciding with higher
temperature and humidity levels, while Mues et al. (2012) showed correlations among
PM10 concentrations and high daily maximum temperatures all over Europe.
Furthermore, several studies have linked heat-related mortalities to elevated pollutants
(see Fischer, Brunekreef and Lebret, 2014; Patel et al., 2019; Scortichini et al., 2018).
The concurrent impacts of heat and air pollution on health and well-being are more
evident in urban areas and populations due to urban heat island effects and multiple
sources of pollutants (Habeeb, Stone and Vargo, 2015; Lenick et al., 2019; Sarrat et al.,
2006; Steeneveld et al., 2018). In a cross-country study, Sera et al. (2019) found that
heat-related mortality can be higher in cities with increased air pollution and limited
green spaces, but also in places with higher inequality levels and lower access to health
services. Neighborhoods with racial-ethnic minorities and socially isolated groups like
low-income older adults are at higher risk from overheating (see Analitis et al., 2018;
Bélanger et al., 2015; Kaiser et al., 2007; Semenza et al., 1996; Klinenberg, 2015) and are
also more likely to be close to pollution sources, like factories and highways (see Hajat,
Hsia and O’Neill, 2015; Miranda et al., 2011; Tessum et al., 2019).
City-level action plans in response to hot weather may include immediate responses, such
as community engagement and emergency preparedness for vulnerable groups or weather
advisories with warning alerts, but also long-term adaptation strategies, such as changes
82
in the built environment, including reduction of impervious surfaces and urban greening
(Harlan and Ruddell, 2011; He et al., 2019). Yet, urban-level strategies can only partly
assist in reducing heat and air pollution exposures, considering that people spend about
90% of their time indoors (ASHRAE, 2016; Klepeis et al., 2001; Spalt et al., 2016) and
that they may experience different conditions indoors from outdoors (Tsoulou et al.,
2020). In fact, findings from past heat wave disasters indicate that the majority of heat-
related deaths have occurred indoors (Quinn et al., 2014).
Determinants of Thermal Comfort and Air Quality in Indoor Environments
While there are close links between indoor and outdoor environmental conditions, (see
Challoner and Gill, 2014; Lundgren Kownacki et al., 2019; Srivastava and Jain, 2003;
Walikewitz et al., 2018), the strength of this relationship, and consequently much of
individual exposure to indoor heat and pollutants, depends heavily on building
characteristics and occupant activities. These factors are in turn, subject to social,
economic and demographic considerations in residential environments.
Building characteristics such as dwelling size, the type of heating, ventilating and air-
conditioning (HVAC), building tightness and insulation, floor, orientation, shading, and
the existence of carpets, can modify indoor environmental quality (IEQ) (Adamkiewicz et
al., 2011; Becher et al., 2018; Ben-David and Warling, 2018; Lundgren Kownacki et al.,
2019; Thomas et al., 2019). However, these features may be different for low-income
residents, who often live in less tight, naturally ventilated multi-family buildings with
lower construction standards and with more occupants/area (Baxter et al., 2007;
Challoner and Gill, 2014; Klepeis et al., 2017).
83
IEQ is also affected by occupant behaviors (OB) such as time spent at home (occupancy),
and operating windows, fans and air-conditioning (A/C) (Hong et al., 2017; Quinn et al.,
2014; Tsoulou et al., 2020). Cleaning practices, smoking, cooking with gas, lighting
candles/incense and having pets have further been linked to indoor pollutants (see Baxter
et al., 2007; Klepeis et al., 2017; Urso et al., 2015; Ye et al., 2017). But these activities
also depend on the availability of resources and the degree of problem conceptualization,
as well as on personal factors, such as habitual behaviors (Lundgren Kownacki et al.,
2019; O’Brien and Gunay, 2014).
Indoor-level strategies to reduce the risk of overheating range from a focus on
mechanical ventilation and the use of A/C to passive measures that emphasize the
importance of natural ventilation and the operation of windows (Jeong et al., 2016;
Nahlik et al., 2017). Along with other passive strategies, natural ventilation has been
shown to have a positive impact on reduced summer energy use and thermal comfort (see
Bayoumi, 2017; Du and Pan, 2019; Van Hoof et al., 2016). With regard to window
operation, Jeong et al. (2016) and Park and Kim (2012) have further shown that it may be
the most preferred way for residents to control thermal conditions even in mechanically
ventilated buildings. Lastly, it may be the only available option for households dealing
with affordability issues (Kingsborough et al., 2017; Tsoulou et al., 2020).
While the operation of windows for natural ventilation can be a potentially effective
indoor strategy to mitigate overheating, it is also an important determinant of indoor air
quality (IAQ) (Mavrogianni et al., 2015) and these relationships are often conflicting. In
some instances, it has been shown that window opening (WO) to improve thermal
comfort may increase indoor PM2.5 concentrations coming from outdoor sources (see
84
Taylor et al., 2014). Inversely, opening the windows to reduce pollutant concentrations
from indoor sources may also lead to increased heat coming from outdoors. Residential
activities, such as WO, may be driven by a range of environmental stimuli that happen at
the same time. Yet, most observational studies of IEQ focus on single and not multi-
domain influences on WO (Schweiker et al., 2020).
4.2 Methods
This chapter extends the analysis of chapter 3 on the seniors’ indoor thermal experiences,
to focus on the relationship between natural ventilation and indoor thermal and PM2.5
performance, and on the potential of WO in mitigating indoor heat while maintaining
good IAQ. The selection of PM2.5 as the pollutant of interest is due to its multiple adverse
health effects, as well as its documented connection to elevated temperatures (Analitis et
al., 2018; US EPA, 2020).
Based on hypothesis 3 of the 2nd research question, outlined in Table 1.5, this chapter’s
objective is to improve understanding about the relationship between thermal comfort, air
quality and the operation of windows. To this end, it seeks to:
• document and evaluate indoor thermal and PM2.5 levels experienced by low-
income seniors in parallel,
• observe variations across and within sites and identify indoor sources of
overheating and pollutants,
• examine closely the effect of natural ventilation and related WO behaviors on
these variations and identify thermal comfort and air quality trade-offs, and
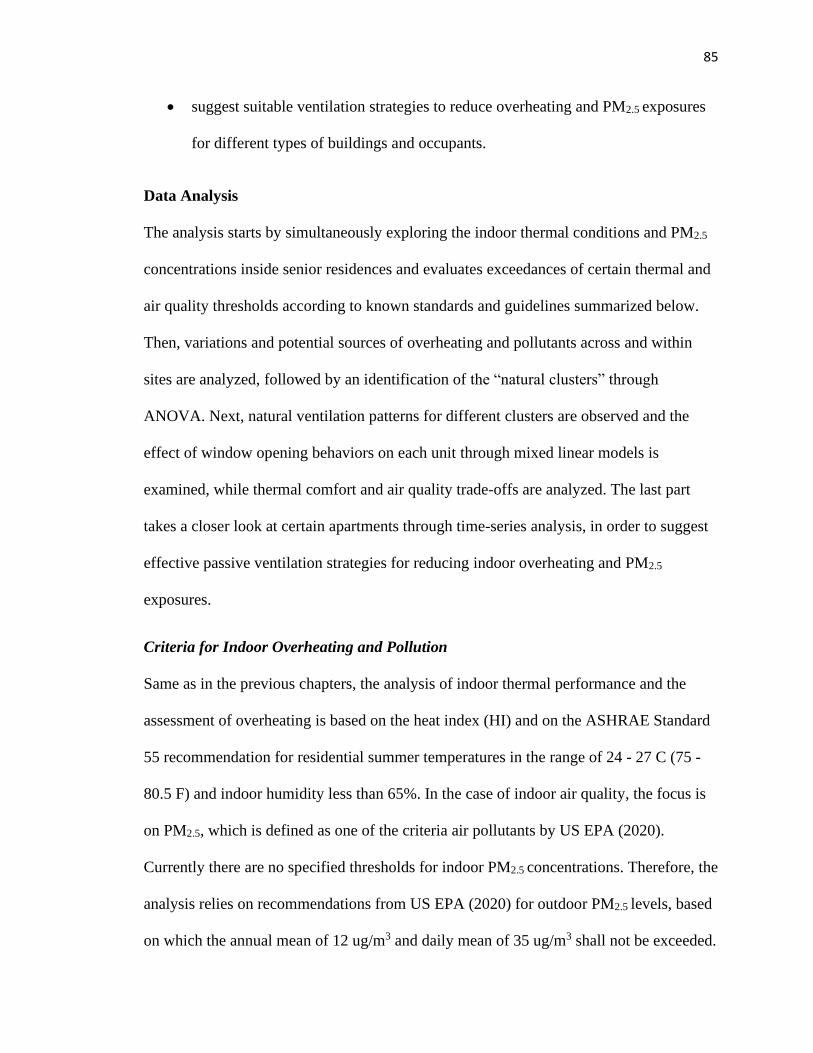
85
• suggest suitable ventilation strategies to reduce overheating and PM2.5 exposures
for different types of buildings and occupants.
Data Analysis
The analysis starts by simultaneously exploring the indoor thermal conditions and PM2.5
concentrations inside senior residences and evaluates exceedances of certain thermal and
air quality thresholds according to known standards and guidelines summarized below.
Then, variations and potential sources of overheating and pollutants across and within
sites are analyzed, followed by an identification of the “natural clusters” through
ANOVA. Next, natural ventilation patterns for different clusters are observed and the
effect of window opening behaviors on each unit through mixed linear models is
examined, while thermal comfort and air quality trade-offs are analyzed. The last part
takes a closer look at certain apartments through time-series analysis, in order to suggest
effective passive ventilation strategies for reducing indoor overheating and PM2.5
exposures.
Criteria for Indoor Overheating and Pollution
Same as in the previous chapters, the analysis of indoor thermal performance and the
assessment of overheating is based on the heat index (HI) and on the ASHRAE Standard
55 recommendation for residential summer temperatures in the range of 24 - 27 C (75 -
80.5 F) and indoor humidity less than 65%. In the case of indoor air quality, the focus is
on PM2.5, which is defined as one of the criteria air pollutants by US EPA (2020).
Currently there are no specified thresholds for indoor PM2.5 concentrations. Therefore, the
analysis relies on recommendations from US EPA (2020) for outdoor PM2.5 levels, based
on which the annual mean of 12 ug/m3 and daily mean of 35 ug/m3 shall not be exceeded.
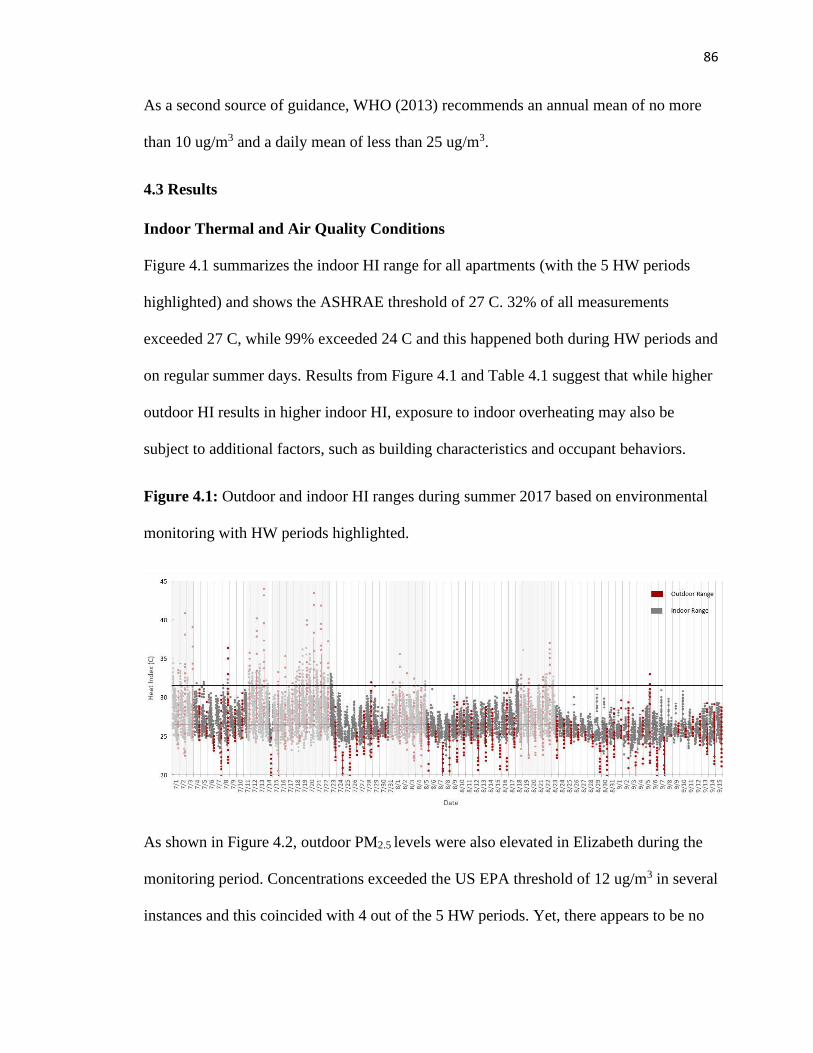
86
As a second source of guidance, WHO (2013) recommends an annual mean of no more
than 10 ug/m3 and a daily mean of less than 25 ug/m3.
4.3 Results
Indoor Thermal and Air Quality Conditions
Figure 4.1 summarizes the indoor HI range for all apartments (with the 5 HW periods
highlighted) and shows the ASHRAE threshold of 27 C. 32% of all measurements
exceeded 27 C, while 99% exceeded 24 C and this happened both during HW periods and
on regular summer days. Results from Figure 4.1 and Table 4.1 suggest that while higher
outdoor HI results in higher indoor HI, exposure to indoor overheating may also be
subject to additional factors, such as building characteristics and occupant behaviors.
Figure 4.1: Outdoor and indoor HI ranges during summer 2017 based on environmental
monitoring with HW periods highlighted.
As shown in Figure 4.2, outdoor PM2.5 levels were also elevated in Elizabeth during the
monitoring period. Concentrations exceeded the US EPA threshold of 12 ug/m3 in several
instances and this coincided with 4 out of the 5 HW periods. Yet, there appears to be no
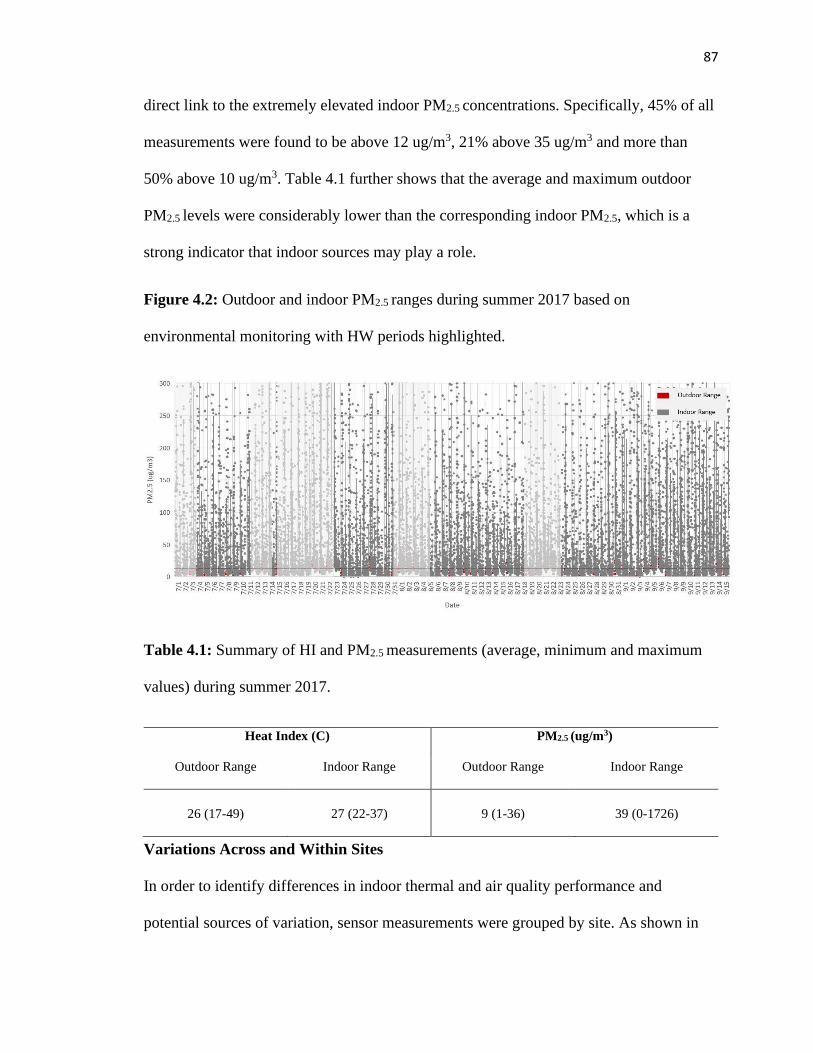
87
direct link to the extremely elevated indoor PM2.5 concentrations. Specifically, 45% of all
measurements were found to be above 12 ug/m3, 21% above 35 ug/m3 and more than
50% above 10 ug/m3. Table 4.1 further shows that the average and maximum outdoor
PM2.5 levels were considerably lower than the corresponding indoor PM2.5, which is a
strong indicator that indoor sources may play a role.
Figure 4.2: Outdoor and indoor PM2.5 ranges during summer 2017 based on
environmental monitoring with HW periods highlighted.
Table 4.1: Summary of HI and PM2.5 measurements (average, minimum and maximum
values) during summer 2017.
Heat Index (C) PM2.5 (ug/m3)
Outdoor Range Indoor Range Outdoor Range Indoor Range
26 (17-49) 27 (22-37) 9 (1-36) 39 (0-1726)
Variations Across and Within Sites
In order to identify differences in indoor thermal and air quality performance and
potential sources of variation, sensor measurements were grouped by site. As shown in
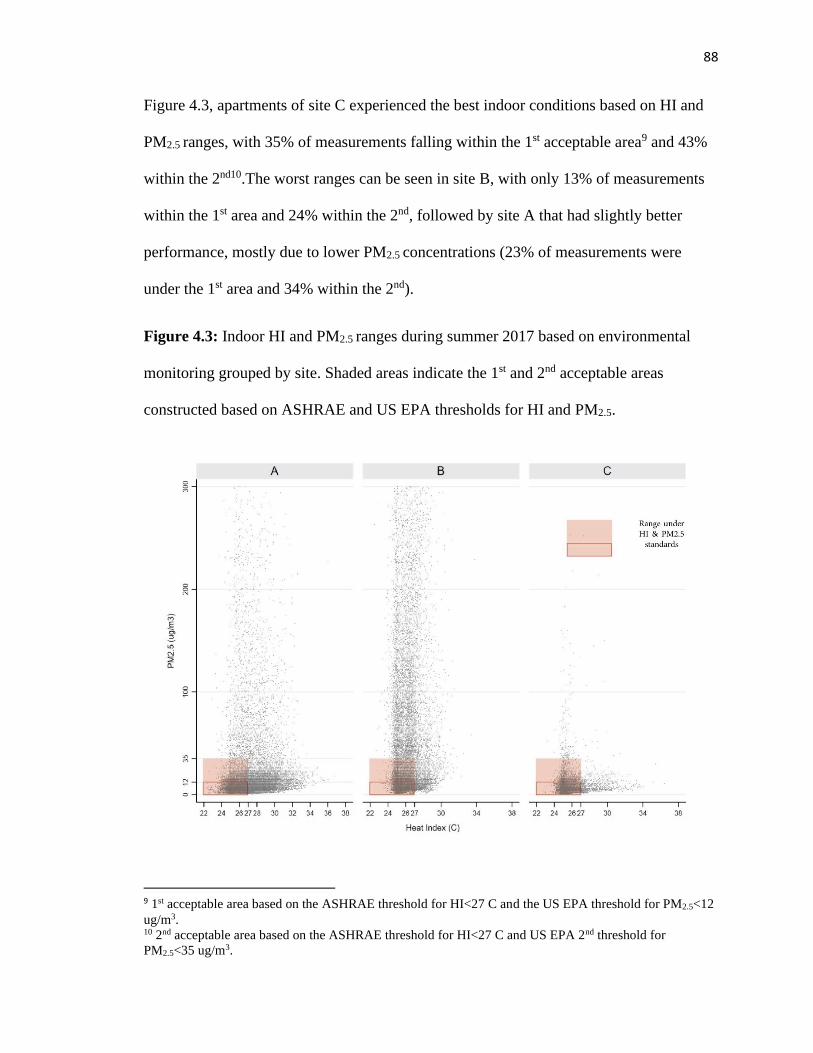
88
Figure 4.3, apartments of site C experienced the best indoor conditions based on HI and
PM2.5 ranges, with 35% of measurements falling within the 1st acceptable area9 and 43%
within the 2nd10.The worst ranges can be seen in site B, with only 13% of measurements
within the 1st area and 24% within the 2nd, followed by site A that had slightly better
performance, mostly due to lower PM2.5 concentrations (23% of measurements were
under the 1st area and 34% within the 2nd).
Figure 4.3: Indoor HI and PM2.5 ranges during summer 2017 based on environmental
monitoring grouped by site. Shaded areas indicate the 1st and 2nd acceptable areas
constructed based on ASHRAE and US EPA thresholds for HI and PM2.5.
9 1st acceptable area based on the ASHRAE threshold for HI<27 C and the US EPA threshold for PM2.5<12
ug/m3. 10 2nd acceptable area based on the ASHRAE threshold for HI<27 C and US EPA 2nd threshold for
PM2.5<35 ug/m3.
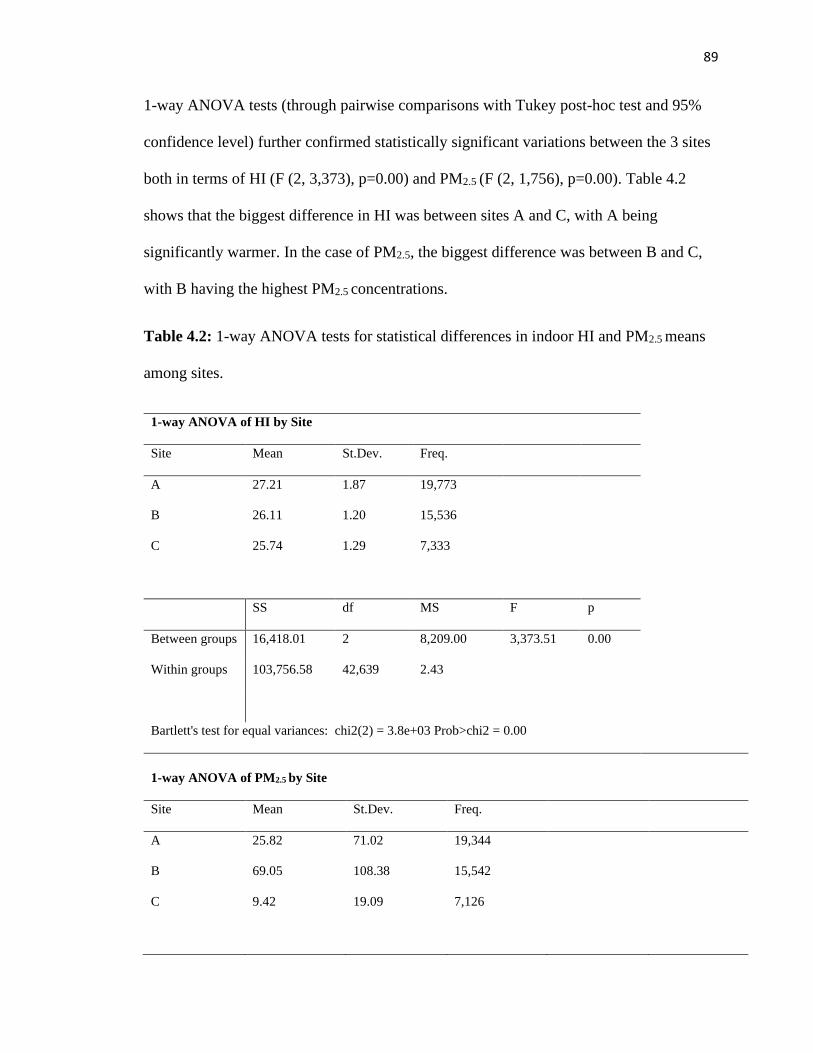
89
1-way ANOVA tests (through pairwise comparisons with Tukey post-hoc test and 95%
confidence level) further confirmed statistically significant variations between the 3 sites
both in terms of HI (F (2, 3,373), p=0.00) and PM2.5 (F (2, 1,756), p=0.00). Table 4.2
shows that the biggest difference in HI was between sites A and C, with A being
significantly warmer. In the case of PM2.5, the biggest difference was between B and C,
with B having the highest PM2.5 concentrations.
Table 4.2: 1-way ANOVA tests for statistical differences in indoor HI and PM2.5 means
among sites.
1-way ANOVA of HI by Site
Site Mean St.Dev. Freq.
A 27.21 1.87 19,773
B 26.11 1.20 15,536
C 25.74 1.29 7,333
SS df MS F p
Between groups 16,418.01 2 8,209.00 3,373.51 0.00
Within groups 103,756.58 42,639 2.43
Bartlett's test for equal variances: chi2(2) = 3.8e+03 Prob>chi2 = 0.00
1-way ANOVA of PM2.5 by Site
Site Mean St.Dev. Freq.
A 25.82 71.02 19,344
B 69.05 108.38 15,542
C 9.42 19.09 7,126
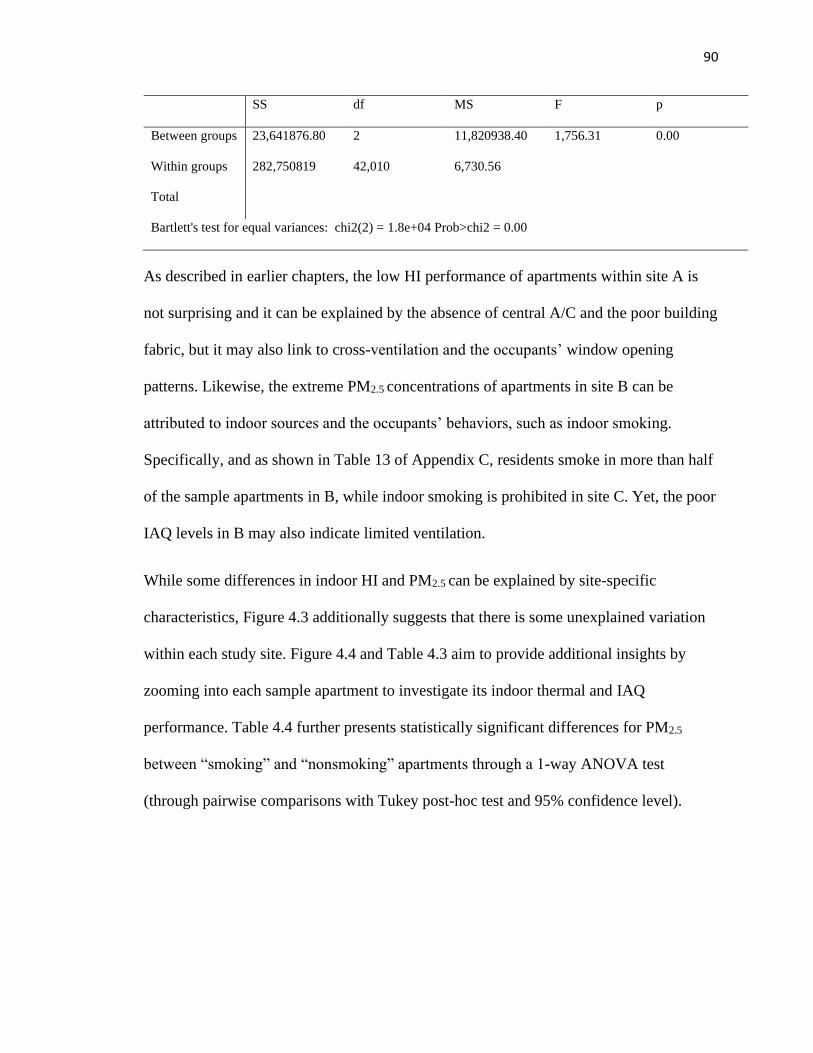
90
SS df MS F p
Between groups 23,641876.80 2 11,820938.40 1,756.31 0.00
Within groups 282,750819 42,010 6,730.56
Total
Bartlett's test for equal variances: chi2(2) = 1.8e+04 Prob>chi2 = 0.00
As described in earlier chapters, the low HI performance of apartments within site A is
not surprising and it can be explained by the absence of central A/C and the poor building
fabric, but it may also link to cross-ventilation and the occupants’ window opening
patterns. Likewise, the extreme PM2.5 concentrations of apartments in site B can be
attributed to indoor sources and the occupants’ behaviors, such as indoor smoking.
Specifically, and as shown in Table 13 of Appendix C, residents smoke in more than half
of the sample apartments in B, while indoor smoking is prohibited in site C. Yet, the poor
IAQ levels in B may also indicate limited ventilation.
While some differences in indoor HI and PM2.5 can be explained by site-specific
characteristics, Figure 4.3 additionally suggests that there is some unexplained variation
within each study site. Figure 4.4 and Table 4.3 aim to provide additional insights by
zooming into each sample apartment to investigate its indoor thermal and IAQ
performance. Table 4.4 further presents statistically significant differences for PM2.5
between “smoking” and “nonsmoking” apartments through a 1-way ANOVA test
(through pairwise comparisons with Tukey post-hoc test and 95% confidence level).
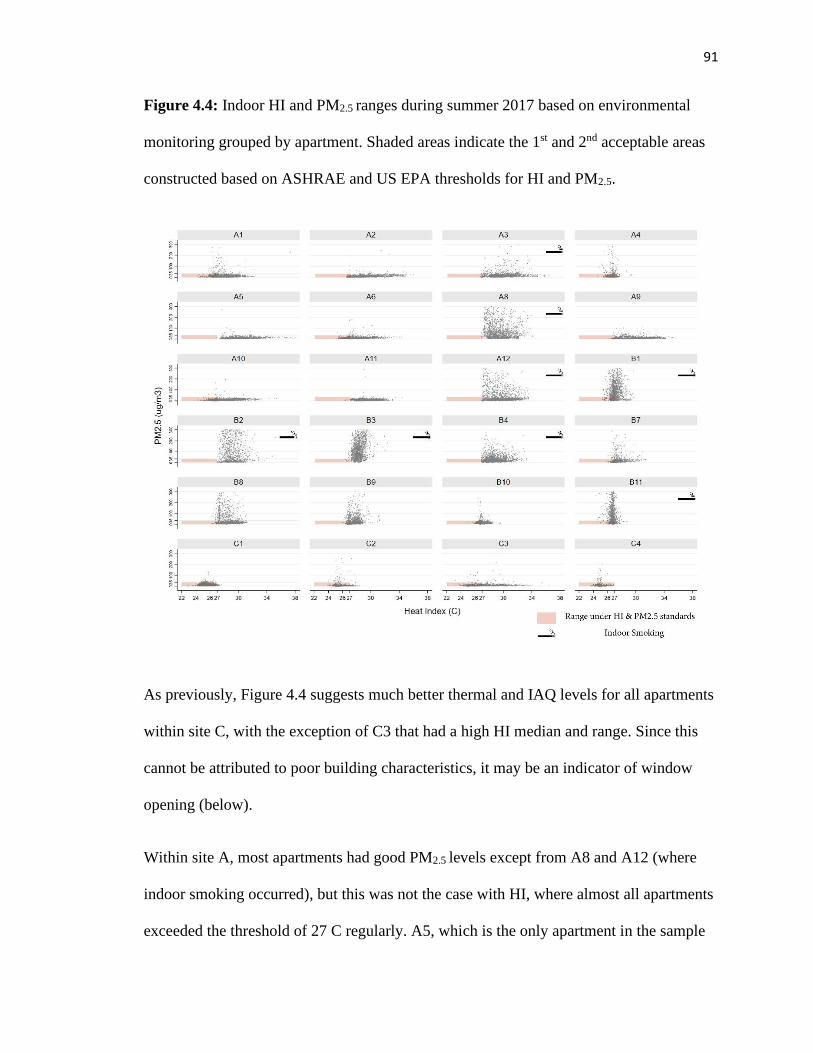
91
Figure 4.4: Indoor HI and PM2.5 ranges during summer 2017 based on environmental
monitoring grouped by apartment. Shaded areas indicate the 1st and 2nd acceptable areas
constructed based on ASHRAE and US EPA thresholds for HI and PM2.5.
As previously, Figure 4.4 suggests much better thermal and IAQ levels for all apartments
within site C, with the exception of C3 that had a high HI median and range. Since this
cannot be attributed to poor building characteristics, it may be an indicator of window
opening (below).
Within site A, most apartments had good PM2.5 levels except from A8 and A12 (where
indoor smoking occurred), but this was not the case with HI, where almost all apartments
exceeded the threshold of 27 C regularly. A5, which is the only apartment in the sample
92
without an A/C unit (see Table 14 of Appendix C), had a median HI of 28 C and, along
with apartment A3, experienced the hottest conditions of all 24 units. Yet, A4 is an
exception to these findings (although, based on Table 14 of Appendix C, apartment
characteristics such as orientation and number of A/C units are similar to A3 and A5),
with the percentage of measurements within the 1st and 2nd acceptable areas being close
to those of apartments within C. Another interesting observation concerns units A3 and
A12, whose PM2.5 levels were lower than other “smoking” apartments (with medians of
15 and 16 ug/m3 respectively). For A3, this may be partly attributed to passive smoking
as was indicated from the resident in the interviews.
A reverse trend can be observed in apartments of site B. Most apartments had a better HI
(except B2, which is located on the 11th floor) but considerably worse PM2.5 levels
compared to apartments in A. While this can be explained by indoor smoking in B1, B2,
B3, B4 and B11, this is not the case with B8 and B9 that had relatively small medians but
a wide range of PM2.5 concentrations. This is an interesting finding and it may relate to
additional indoor sources and/or the units’ ventilation patterns. Lastly, an exception is
apartment B10, which had the best HI and PM2.5 performance among all Bs, based on the
percentage of measurements within the 1st and 2nd acceptable areas.
Table 4.3: Descriptive statistics and percentage of HI and PM2.5 measurements by
apartment during summer 2017 that fall within the 1st and 2nd acceptable areas.
Combined HI and PM2.5 Performance HI (C) PM2.5 (ug/m3)
1st acceptable area (%) 2nd acceptable area (%) Median (Min-Max) Median (Min-Max)
A1 25 36 26 (22-36) 9 (1-866)
A2 21 25 27 (24-35) 8 (0-246)
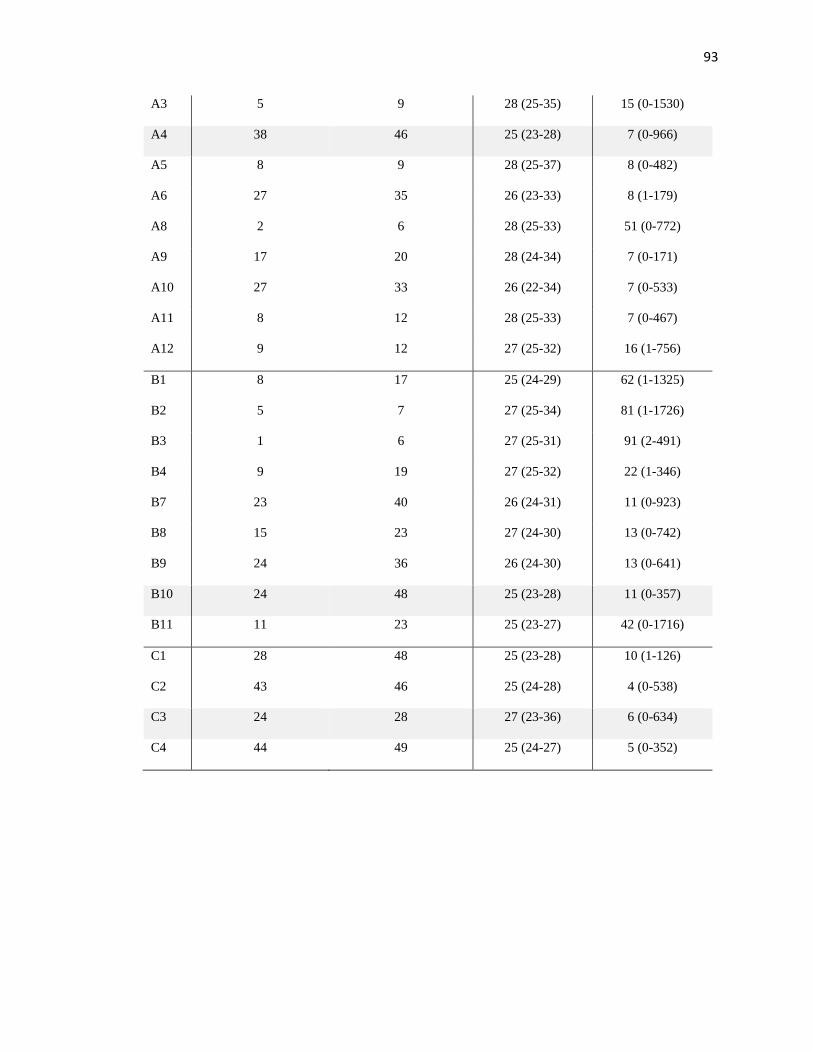
93
A3 5 9 28 (25-35) 15 (0-1530)
A4 38 46 25 (23-28) 7 (0-966)
A5 8 9 28 (25-37) 8 (0-482)
A6 27 35 26 (23-33) 8 (1-179)
A8 2 6 28 (25-33) 51 (0-772)
A9 17 20 28 (24-34) 7 (0-171)
A10 27 33 26 (22-34) 7 (0-533)
A11 8 12 28 (25-33) 7 (0-467)
A12 9 12 27 (25-32) 16 (1-756)
B1 8 17 25 (24-29) 62 (1-1325)
B2 5 7 27 (25-34) 81 (1-1726)
B3 1 6 27 (25-31) 91 (2-491)
B4 9 19 27 (25-32) 22 (1-346)
B7 23 40 26 (24-31) 11 (0-923)
B8 15 23 27 (24-30) 13 (0-742)
B9 24 36 26 (24-30) 13 (0-641)
B10 24 48 25 (23-28) 11 (0-357)
B11 11 23 25 (23-27) 42 (0-1716)
C1 28 48 25 (23-28) 10 (1-126)
C2 43 46 25 (24-28) 4 (0-538)
C3 24 28 27 (23-36) 6 (0-634)
C4 44 49 25 (24-27) 5 (0-352)
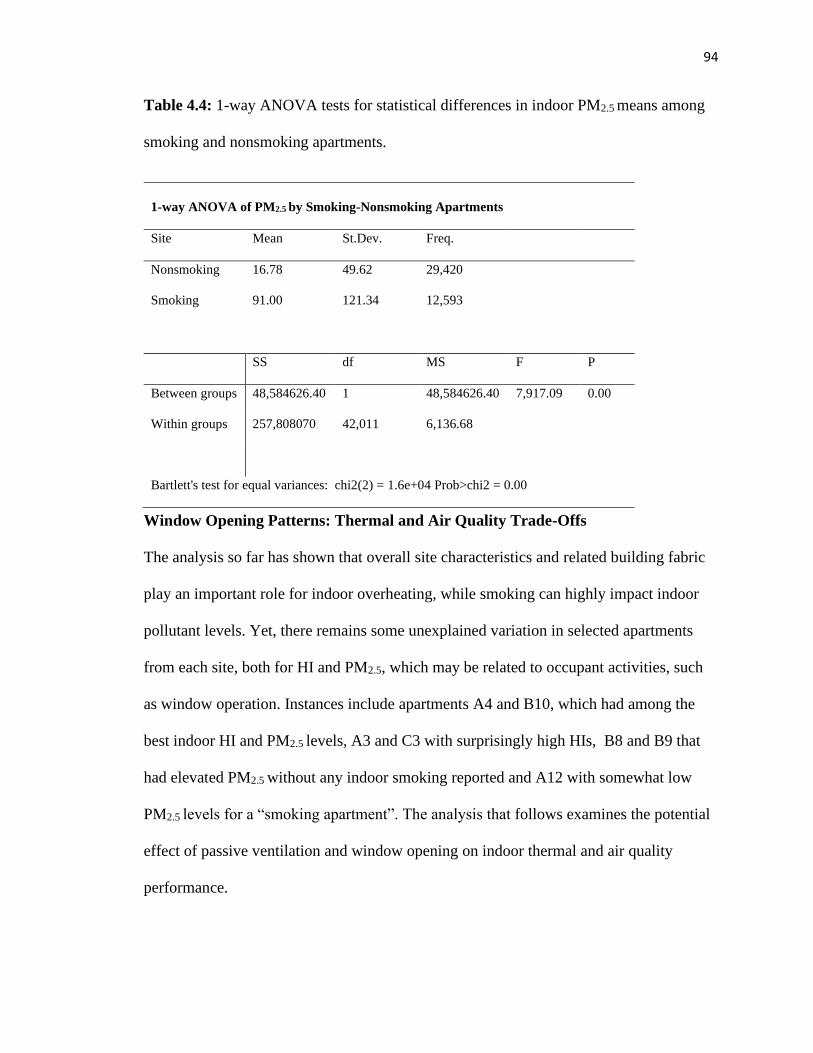
94
Table 4.4: 1-way ANOVA tests for statistical differences in indoor PM2.5 means among
smoking and nonsmoking apartments.
1-way ANOVA of PM2.5 by Smoking-Nonsmoking Apartments
Site Mean St.Dev. Freq.
Nonsmoking 16.78 49.62 29,420
Smoking 91.00 121.34 12,593
SS df MS F P
Between groups 48,584626.40 1 48,584626.40 7,917.09 0.00
Within groups 257,808070 42,011 6,136.68
Bartlett's test for equal variances: chi2(2) = 1.6e+04 Prob>chi2 = 0.00
Window Opening Patterns: Thermal and Air Quality Trade-Offs
The analysis so far has shown that overall site characteristics and related building fabric
play an important role for indoor overheating, while smoking can highly impact indoor
pollutant levels. Yet, there remains some unexplained variation in selected apartments
from each site, both for HI and PM2.5, which may be related to occupant activities, such
as window operation. Instances include apartments A4 and B10, which had among the
best indoor HI and PM2.5 levels, A3 and C3 with surprisingly high HIs, B8 and B9 that
had elevated PM2.5 without any indoor smoking reported and A12 with somewhat low
PM2.5 levels for a “smoking apartment”. The analysis that follows examines the potential
effect of passive ventilation and window opening on indoor thermal and air quality
performance.
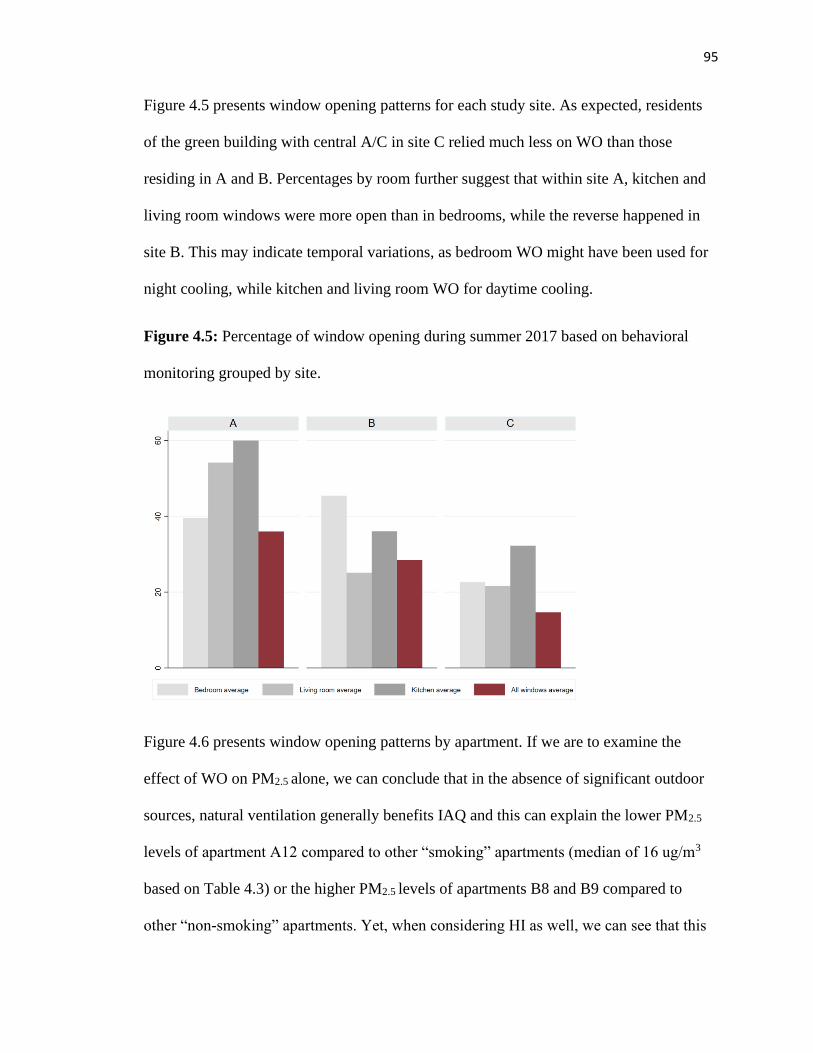
95
Figure 4.5 presents window opening patterns for each study site. As expected, residents
of the green building with central A/C in site C relied much less on WO than those
residing in A and B. Percentages by room further suggest that within site A, kitchen and
living room windows were more open than in bedrooms, while the reverse happened in
site B. This may indicate temporal variations, as bedroom WO might have been used for
night cooling, while kitchen and living room WO for daytime cooling.
Figure 4.5: Percentage of window opening during summer 2017 based on behavioral
monitoring grouped by site.
Figure 4.6 presents window opening patterns by apartment. If we are to examine the
effect of WO on PM2.5 alone, we can conclude that in the absence of significant outdoor
sources, natural ventilation generally benefits IAQ and this can explain the lower PM2.5
levels of apartment A12 compared to other “smoking” apartments (median of 16 ug/m3
based on Table 4.3) or the higher PM2.5 levels of apartments B8 and B9 compared to
other “non-smoking” apartments. Yet, when considering HI as well, we can see that this
96
is a not straight-forward relationship. In some cases, frequent WO can benefit indoor HI,
such as in apartments A6 and A10 (with a median of 26 C based on Table 4.3) or limited
WO can result in a higher HI, such as in A3. However, in some other cases, a reverse
trend is observed; more WO means a higher HI for apartment C3, and less WO means a
better HI for apartment A4. Therefore, for selected units, there is a thermal and air quality
trade-off with natural ventilation and the way residents operate their windows that needs
to be examined more closely.
Figure 4.6: Percentage of window opening during summer 2017 based on behavioral
monitoring grouped by apartment.
To explore further the relationship between window opening, thermal comfort and IAQ, a
3-level mixed model with random effects was fitted (with level 3 the site and level 2 the
apartment, since apartments are nested within sites). The model shows the effect of WO
on indoor HI and PM2.5, while accounting for the outdoor HI, as well as the effect of WO
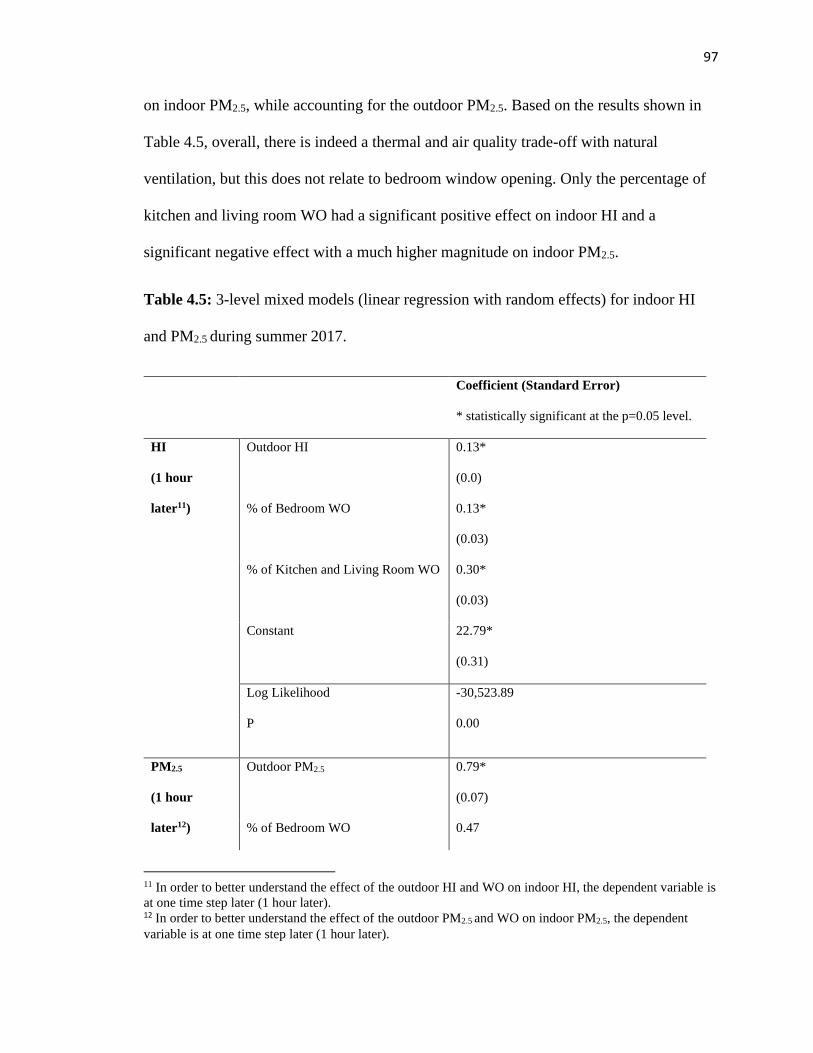
97
on indoor PM2.5, while accounting for the outdoor PM2.5. Based on the results shown in
Table 4.5, overall, there is indeed a thermal and air quality trade-off with natural
ventilation, but this does not relate to bedroom window opening. Only the percentage of
kitchen and living room WO had a significant positive effect on indoor HI and a
significant negative effect with a much higher magnitude on indoor PM2.5.
Table 4.5: 3-level mixed models (linear regression with random effects) for indoor HI
and PM2.5 during summer 2017.
Coefficient (Standard Error)
* statistically significant at the p=0.05 level.
HI
(1 hour
later11)
Outdoor HI 0.13*
(0.0)
% of Bedroom WO 0.13*
(0.03)
% of Kitchen and Living Room WO 0.30*
(0.03)
Constant 22.79*
(0.31)
Log Likelihood -30,523.89
P
0.00
PM2.5
(1 hour
later12)
Outdoor PM2.5 0.79*
(0.07)
% of Bedroom WO 0.47
11 In order to better understand the effect of the outdoor HI and WO on indoor HI, the dependent variable is
at one time step later (1 hour later). 12 In order to better understand the effect of the outdoor PM2.5 and WO on indoor PM2.5, the dependent
variable is at one time step later (1 hour later).
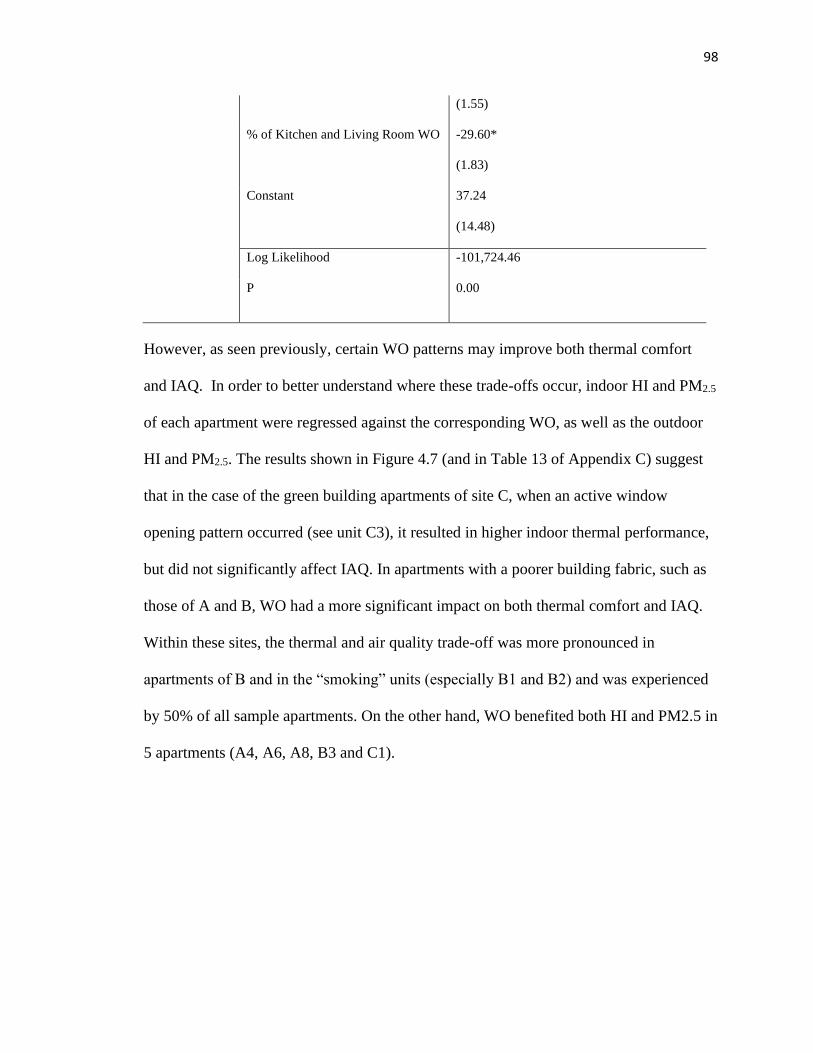
98
(1.55)
% of Kitchen and Living Room WO -29.60*
(1.83)
Constant 37.24
(14.48)
Log Likelihood -101,724.46
P
0.00
However, as seen previously, certain WO patterns may improve both thermal comfort
and IAQ. In order to better understand where these trade-offs occur, indoor HI and PM2.5
of each apartment were regressed against the corresponding WO, as well as the outdoor
HI and PM2.5. The results shown in Figure 4.7 (and in Table 13 of Appendix C) suggest
that in the case of the green building apartments of site C, when an active window
opening pattern occurred (see unit C3), it resulted in higher indoor thermal performance,
but did not significantly affect IAQ. In apartments with a poorer building fabric, such as
those of A and B, WO had a more significant impact on both thermal comfort and IAQ.
Within these sites, the thermal and air quality trade-off was more pronounced in
apartments of B and in the “smoking” units (especially B1 and B2) and was experienced
by 50% of all sample apartments. On the other hand, WO benefited both HI and PM2.5 in
5 apartments (A4, A6, A8, B3 and C1).
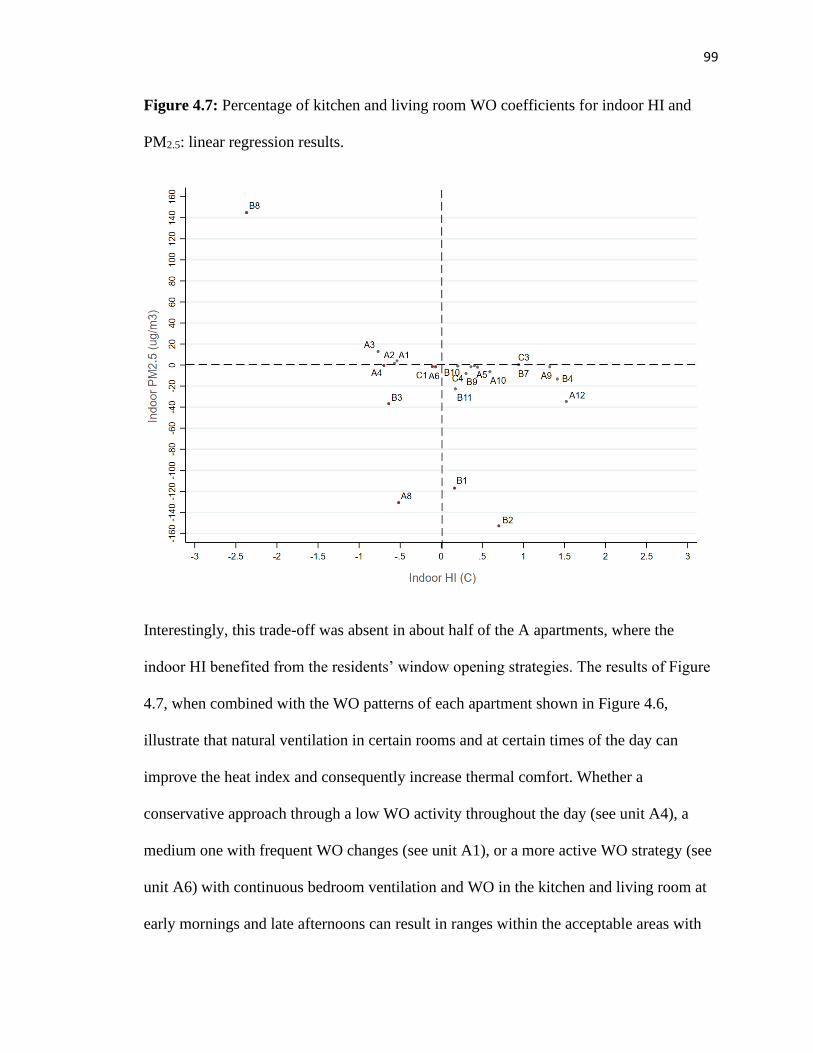
99
Figure 4.7: Percentage of kitchen and living room WO coefficients for indoor HI and
PM2.5: linear regression results.
Interestingly, this trade-off was absent in about half of the A apartments, where the
indoor HI benefited from the residents’ window opening strategies. The results of Figure
4.7, when combined with the WO patterns of each apartment shown in Figure 4.6,
illustrate that natural ventilation in certain rooms and at certain times of the day can
improve the heat index and consequently increase thermal comfort. Whether a
conservative approach through a low WO activity throughout the day (see unit A4), a
medium one with frequent WO changes (see unit A1), or a more active WO strategy (see
unit A6) with continuous bedroom ventilation and WO in the kitchen and living room at
early mornings and late afternoons can result in ranges within the acceptable areas with
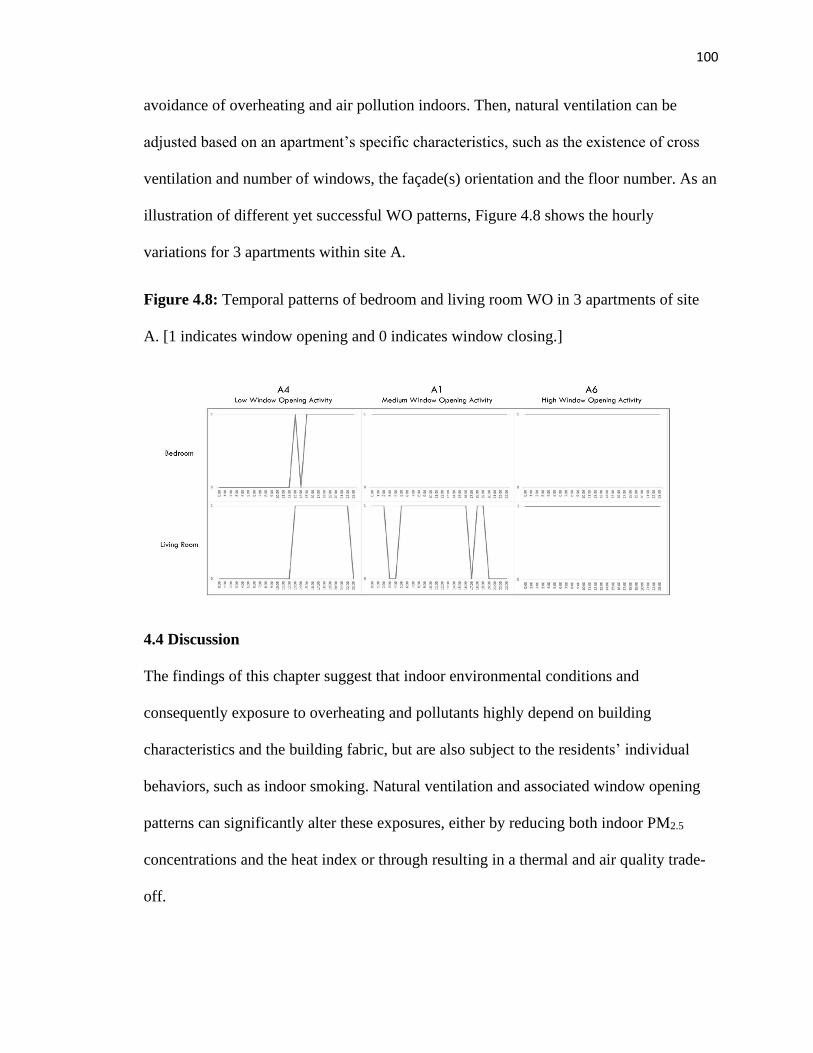
100
avoidance of overheating and air pollution indoors. Then, natural ventilation can be
adjusted based on an apartment’s specific characteristics, such as the existence of cross
ventilation and number of windows, the façade(s) orientation and the floor number. As an
illustration of different yet successful WO patterns, Figure 4.8 shows the hourly
variations for 3 apartments within site A.
Figure 4.8: Temporal patterns of bedroom and living room WO in 3 apartments of site
A. [1 indicates window opening and 0 indicates window closing.]
4.4 Discussion
The findings of this chapter suggest that indoor environmental conditions and
consequently exposure to overheating and pollutants highly depend on building
characteristics and the building fabric, but are also subject to the residents’ individual
behaviors, such as indoor smoking. Natural ventilation and associated window opening
patterns can significantly alter these exposures, either by reducing both indoor PM2.5
concentrations and the heat index or through resulting in a thermal and air quality trade-
off.
101
In the case of IAQ, the results, specifically Figures 4.2, 4.4 and Tables 4.1, 4.4, showed
that when certain indoor sources are present, such as smoking, they drive elevated PM2.5
concentrations, while outdoor sources and the associated role of building fabric are of
secondary importance. As shown in Table 4.5 and Figure 4.7, overall, opening the
windows has a positive impact on PM2.5 exposures, and this effect becomes much higher
in magnitude within “smoking” apartments. Therefore, there is a clear distinction
between smokers and non-smokers, and based on Table 4.3 and Figures 4.4 and 4.6, for
“smoking” apartments, a high WO activity is recommended, while in the absence of
indoor smoking, a medium WO activity, such as kitchen ventilation in the afternoon,
which may coincide with cooking activities, can result in lower indoor PM2.5 levels.
With regard to indoor thermal comfort, results from Figures 4.1, 4.3 and Tables 4.2, 4.3
showed that outdoor heat and the role of building fabric as a protective measure are of
primary importance, which suggests a distinction of the sample apartments by site (older
versus newer buildings). Overall, natural ventilation has a significant impact on the
indoor HI (see Table 4.5 and Figure 4.6), but the WO time of day and the selection of
particular windows to be opened are key considerations. Based on the results shown in
Table 4.3 and Figures 4.4-4.8, for a newer building and given that the residents can afford
to operate the A/C, a lower WO activity in the common spaces (kitchen and living room)
is recommended for improved thermal comfort, complemented by medium bedroom WO
for night ventilation. For older buildings with a poorer building fabric without central
A/C, an effective WO strategy may depend on additional considerations, such as the
existence of cross ventilation and the number of windows, the floor number and the
façade(s) orientation; either a low WO activity with bedroom ventilation in the night time
102
or a more active WO strategy with ventilation in the bedroom and common spaces (with
avoidance during the hottest hours - noon) can be effective.
When examining natural ventilation in the context of both thermal comfort and IAQ,
results from Figure 4.7 showed that often there is a thermal and air quality trade-off that
needs to be considered. The type, amount and timing of window opening and the extent
to which it can be effective in simultaneously reducing overheating and pollutant
concentrations heavily depend on the existence of indoor pollutant sources, the outdoor
environment and building characteristics. In the absence of significant indoor pollutant
sources, a medium WO strategy can be beneficial for both indoor HI and PM2.5 in older
buildings, while limited WO is recommended for newer buildings with advanced building
standards and mechanical ventilation options. However, when indoor sources such as
smoking cannot be avoided either in new or older buildings, a very active WO strategy
appears to be necessary for reducing PM2.5 concentrations, even if this translates into a
higher indoor HI.
Overall, this chapter stresses the importance of exploring cost-effective interventions
such as natural ventilation, but also presents associated complexities when examining
effects on more than one IEQ domain. Additionally, results support the position that city-
level policy making for housing should incorporate indoor strategies to reduce
environmental exposures. This emphasis on residential environments and on ventilation
strategies also comes in response to the global COVID-19 pandemic, which requires
immediate action for the protection of vulnerable groups and especially older adults.
This work suggests that natural ventilation for improved IEQ should be part of a
spectrum of policies that can be addressed by municipal and state officials, as well as by
103
building code professionals. Undoubtedly building homes with sufficient ventilation
should be a requirement, since window opening can work well as a means to cool off and
clean the indoor air for a regular “non-smoking” dwelling on a regular summer day. It is
also very suitable in an affordable residential housing context.
Yet, as this chapter illustrated, there are limitations in the effectiveness of window
opening during extreme heat conditions and when there are significant indoor pollutant
sources, such as smoking. It is therefore best when it is coupled with educational and
technological interventions. For example, while it is intuitive to operate the windows in
response to heat, this is not necessarily the case with indoor pollutants. Educating
residents about the importance of indoor air quality and effective ways to open their
windows has minimal cost and can be useful in the long term. Then, WO can be coupled
with technological interventions, such as using air purifiers and installing high-efficiency
filters, which can also work well in the long term and have faster results, however, they
may require higher capital and electricity costs.
104
5. Chapter 5 Outdoor Environments: Site Amenities and
Senior Activities
Already from the preliminary findings of chapter 2, it is established that both indoor and
outdoor resources are important in assisting low-income seniors cope with heat. The
exploration of indoor environments in chapters 3 and 4 further highlighted that among
other factors, site characteristics, such as landscaping and other nearby affordances may
affect indoor environmental conditions, through altering the residents’ activities, such as
indoor occupancy patterns. This chapter grasps on these findings and extends outdoors to
investigate the role of adjacent amenities for heat adaptation in the 3 public housing sites
of Elizabeth, NJ, USA, which corresponds to the 3rd research question of this
dissertation13. The analysis examines how and why residents interact with their
immediate outdoor environments, through documenting outdoor destinations and
associated temporal patterns. Pearson correlations and logistic regressions illustrate the
relative effect of outdoor and indoor thermal conditions and site characteristics on indoor
occupancy. The chapter concludes with a discussion of findings.
5.1 Background
Outdoor Environments: Landscape Design and Amenities
The literature, analysis and findings presented in previous chapters of this work have
already established the importance of indoor environments and household characteristics
for older adults coping with high summertime temperatures. The availability of
functioning air-conditioning has been deemed essential; yet, in the case of low-resource
13 The analysis presented in this chapter is prepared for a journal submission.
105
communities, it was shown that A/C is neither an accessible affordance nor enough to
ensure seniors’ thermal comfort, considering cost and effectiveness constraints, as well as
possible power outages during heat waves. Towards that end, more accessible alternative
building adaptations have been examined, such as passive cooling and natural ventilation,
which further highlighted that importance of occupant behaviors in heat adaptation.
Besides indoor-level approaches, researchers and practitioners have also turned their
efforts to less traditional, outdoor-level modifications and the effectiveness of features
related to landscaping and greening to improve thermal comfort at local spatial scales. A
vast body of literature focuses on the effects of urban green spaces on microclimate
conditions, including the reduction of ambient temperatures, UHI effects and urban
energy, and the improvement of ambient air quality. It has been shown that trees, grass,
shrubs and vegetation can be effective cooling strategies particularly at local scales, and
yield energy savings for residential buildings through shading (see Akbari et al., 2001;
Bowler et al., 2010). High tree coverage can further contribute to lower ambient PM
levels in urban settings (see Chen et al., 2016; Chen et al., 2019; Nowak, Crane and
Stevens, 2006). Similar outcomes have been shown for additional urban green strategies,
such as parks, green walls and green roofs, which have been linked to lower levels of
pollutants and summer temperatures (see Currie and Bass, 2008; Qin et al., 2019; Yin et
al., 2011).
Epidemiological research has further examined health benefits of urban greening, ranging
from recreation and physical activity to social cohesion and reduced heat-related
mortality. Hartig et al. (2014) discussed pathways to link nature-based solutions with
human health, including stress recovery, physical activity and social contacts. Likewise,
106
Fong et al. (2018) summarized literature on the relationship between greenness and
health in general and found strong evidence of associations for higher greenness with
improvements in physical activity and lower depressive symptoms and mortality rates.
Some studies have also focused on the extent to which urban green spaces and an overall
supportive neighborhood environment can improve health outcomes specifically for older
adults, including how to cope with elevated summer temperatures and reduce heat stress.
These studies have repeatedly underlined the importance of additional features for seniors
compared to younger adults, such as providing a variety of destinations in addition to
green spaces that are safe, within walking distance, well-connected to the street and with
social cohesion (see Arnberger and Eder, 2011; Carlson et al., 2012; Engel et al., 2016;
Klinenberg, 2015; Sugiyama and Thompson, 2007; Van Holle, 2014). Van Holle et al.
(2014) highlighted the need to provide a variety of outdoor options within walking
distance from the seniors’ residences and Arnberger et al. (2017) emphasized sitting
options, like benches along routes to destinations such as green spaces.
In sum, a diverse body of literature has demonstrated the benefits of outdoor landscape
design and green spaces for improved environmental conditions, but also for better health
outcomes. Welcoming neighborhood environments with trees, parks and a variety of
destinations can also function as shelters from heat, when indoor environments are
inadequate in doing so (Arnberger et al., 2017; Kabisch, 2017). Research in the use of
such spaces has shown that besides traditional urban design features, personal factors,
such as sociodemographics and health, as well as additional considerations, such as safety
and social cohesion are important (Gehl and Svarre, 2013; Whyte, 1980). Yet, there is a
107
dearth of literature on the summertime use of outdoor spaces by low-income older adults
and on the value of outdoor environments in assisting them to cope with heat.
5.2 Methods
After the exploration of indoor environments in chapters 3 and 4, this chapter focuses on
the seniors’ outdoor environments and examines the role of landscape design and
adjacent amenities for heat adaptation in the 3 public housing sites in Elizabeth, NJ,
USA.
Based on hypotheses 1 and 2 of the 3rd research question, outlined in Table 1.5 of chapter
1, the objectives of this chapter are:
• To map the outdoor preferences and destinations of seniors within and outside the
site boundaries.
• To observe variations in the temporal patterns of those activities across sites and
apartments.
• To examine the relative effect of site characteristics, and indoor and outdoor heat
on indoor occupancy, and consequently, the degree to which they may affect
outdoor activities.
• To identify whether adjacent outdoor amenities can provide additional heat
adaptation possibilities.
Data Analysis
The analysis is based on the premise that seniors who live in sites with poor indoor
environments but rich outdoor amenities in close proximity, may spend less time in their
apartments and more time in outdoor spaces, especially during prolonged periods of heat.
108
When summer temperatures are up, the focus is on indoor and outdoor heat stress, which,
here, are approximated by the indoor and outdoor heat index respectively. Therefore,
guided by the conceptual framework presented in Figure 3.1, indoor occupancy outcomes
are examined against site characteristics, IHI and OHI, while accounting for a number of
key personal variables.
5.3 Results
Outdoor Activities and Temporal Patterns
Table 2.3 of chapter 2 briefly presented outdoor activities of seniors during the heat wave
periods of 2017, within and outside the sites’ boundaries. To some extent, these activities
and associated variations across the three study sites may relate to differences in outdoor
amenities and landscaping, such as the existence of yards and gardens. For instance, as it
is shown in Table 1.1 of chapter 1, sites A and B may have poor building envelopes
compared to site C, but are richer in outdoor amenities, within and outside the site
boundaries, further explained in the site plans of Figures 5.1 - 5.3.
Specifically, site A has 3 playground areas with plenty of benches and trees for shading.
The community center provides good thermal comfort and sitting options but is not
always open and accessible to the residents, which may explain why it is not used during
heat waves. In the surrounding area, a public pool and a park are within about a 3-4-
minute walk. Limited grocery stores exist in the area, but there are numerous houses of
worship. Then, B incorporates a front yard with plenty of shading and sitting options and
a back yard with community gardens, both of which, are accessible 24/7 and may explain
why residents use them during heat waves. Within a 3-minute walk, there is a church and
a pharmacy, and within a 10-minute walk, there exist two grocery stores, a senior center,
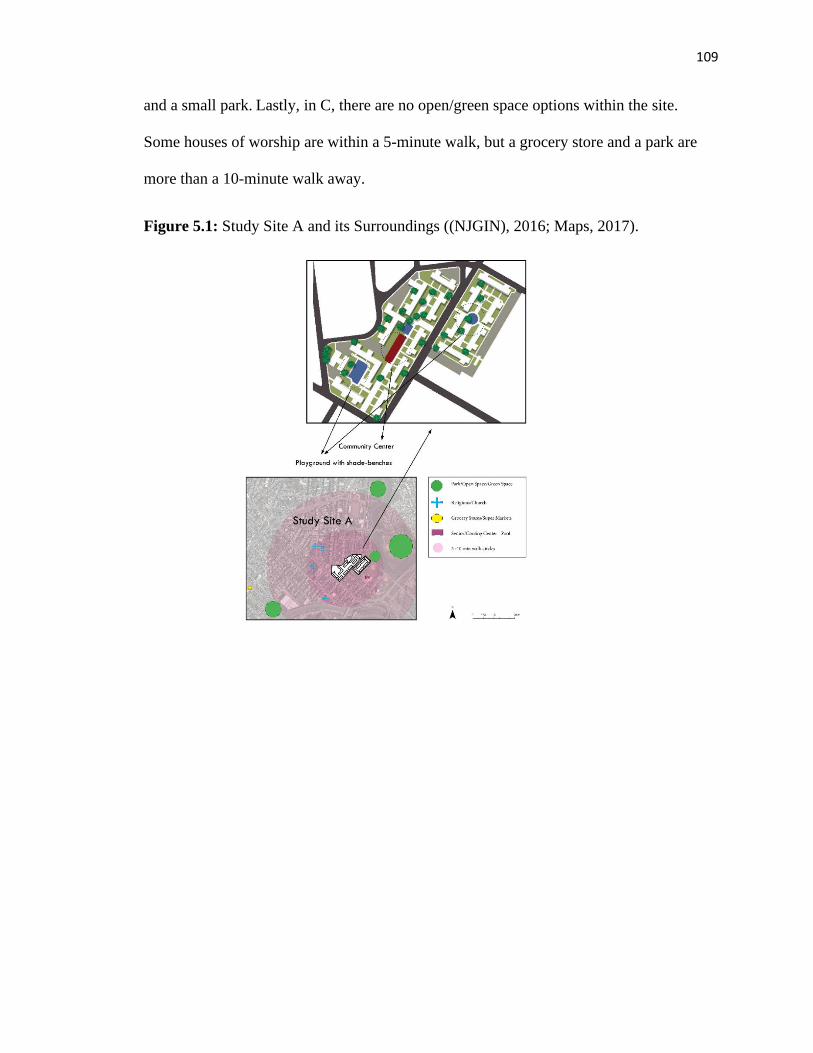
109
and a small park. Lastly, in C, there are no open/green space options within the site.
Some houses of worship are within a 5-minute walk, but a grocery store and a park are
more than a 10-minute walk away.
Figure 5.1: Study Site A and its Surroundings ((NJGIN), 2016; Maps, 2017).
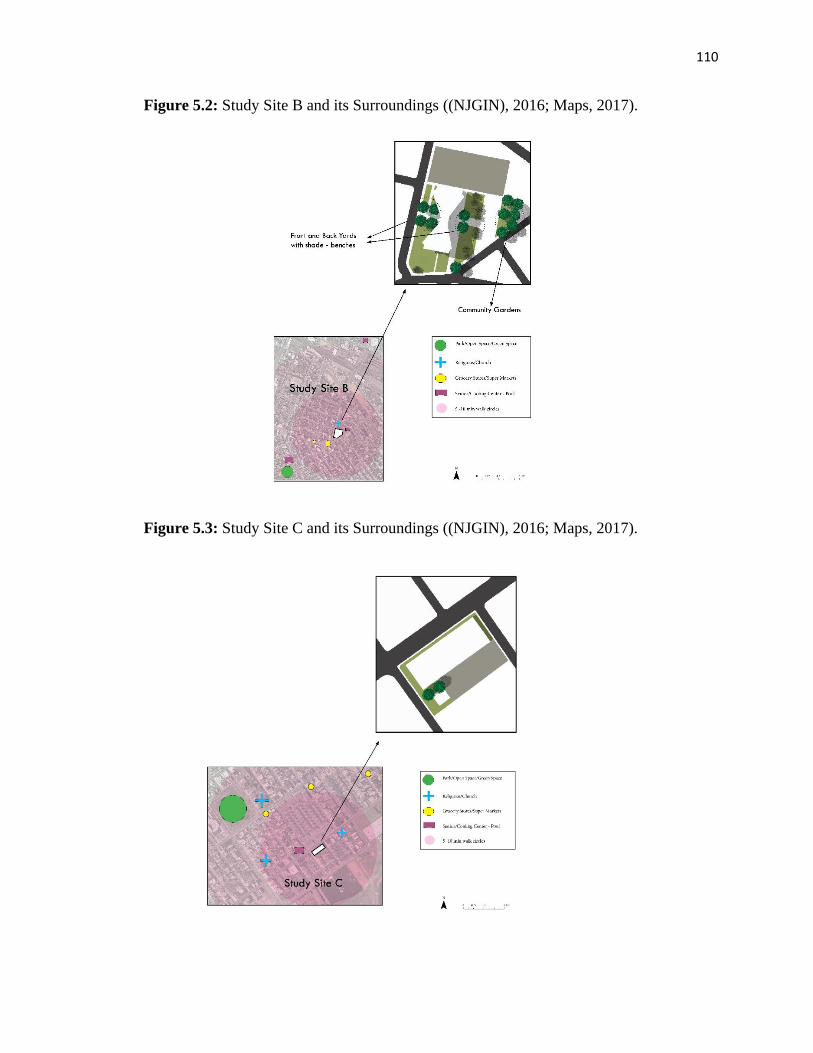
110
Figure 5.2: Study Site B and its Surroundings ((NJGIN), 2016; Maps, 2017).
Figure 5.3: Study Site C and its Surroundings ((NJGIN), 2016; Maps, 2017).
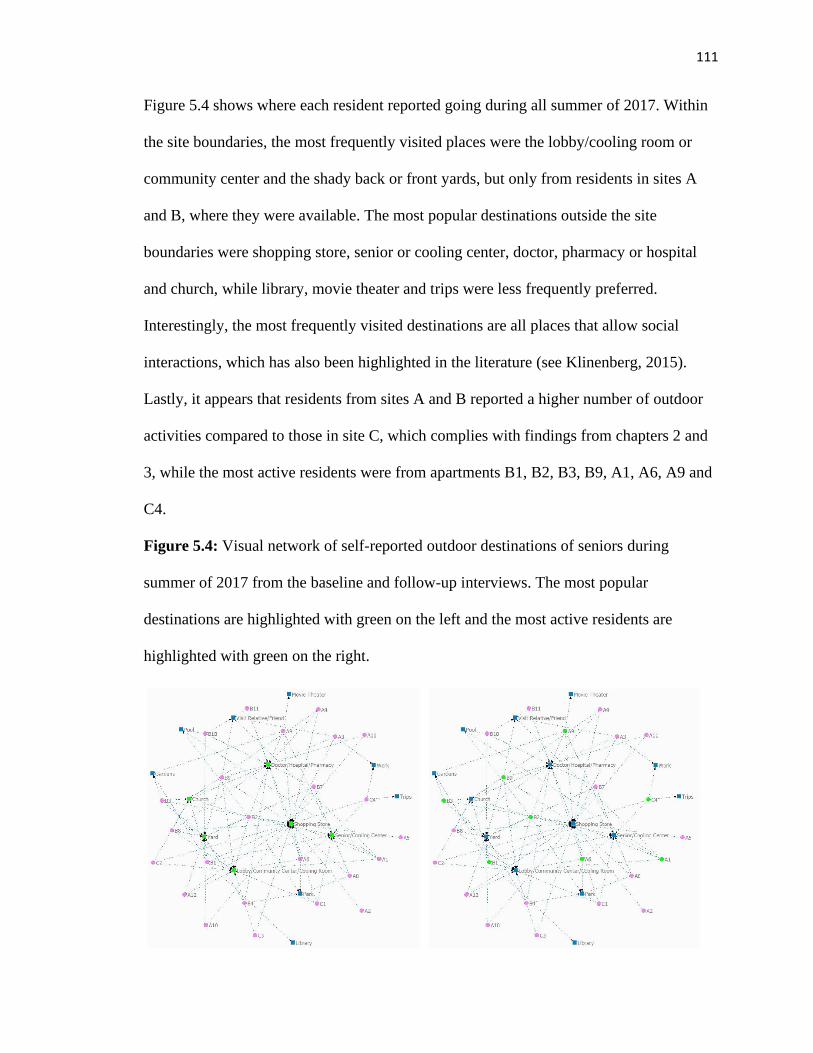
111
Figure 5.4 shows where each resident reported going during all summer of 2017. Within
the site boundaries, the most frequently visited places were the lobby/cooling room or
community center and the shady back or front yards, but only from residents in sites A
and B, where they were available. The most popular destinations outside the site
boundaries were shopping store, senior or cooling center, doctor, pharmacy or hospital
and church, while library, movie theater and trips were less frequently preferred.
Interestingly, the most frequently visited destinations are all places that allow social
interactions, which has also been highlighted in the literature (see Klinenberg, 2015).
Lastly, it appears that residents from sites A and B reported a higher number of outdoor
activities compared to those in site C, which complies with findings from chapters 2 and
3, while the most active residents were from apartments B1, B2, B3, B9, A1, A6, A9 and
C4.
Figure 5.4: Visual network of self-reported outdoor destinations of seniors during
summer of 2017 from the baseline and follow-up interviews. The most popular
destinations are highlighted with green on the left and the most active residents are
highlighted with green on the right.
112
Figure 5.5 compares visits to outdoor destinations across the three sites, which confirms
previous findings that A and B residents had a higher percentage of visits and more
outdoor activities reported than those in C. Furthermore, five destinations were reported
by residents from all sites: lobby, cooling room or community center, senior or cooling
center, church, shopping store, and visit to relative or friend.
Variations were also observed between all summer and the heat wave periods. Within the
site boundaries, residents in A reduced their outdoor visits during heat waves, residents in
B increased their visits in the lobby and yard, and residents in C only visited the lobby.
This, to some extent, may relate to the common perception that outdoor spaces are always
hotter than the apartment (Arnberger et al., 2017), regardless of whether this is accurate.
In fact, as it is shown in Figure 3.2 of chapter 3, many apartments in sites A and B were
warmer than outdoors.
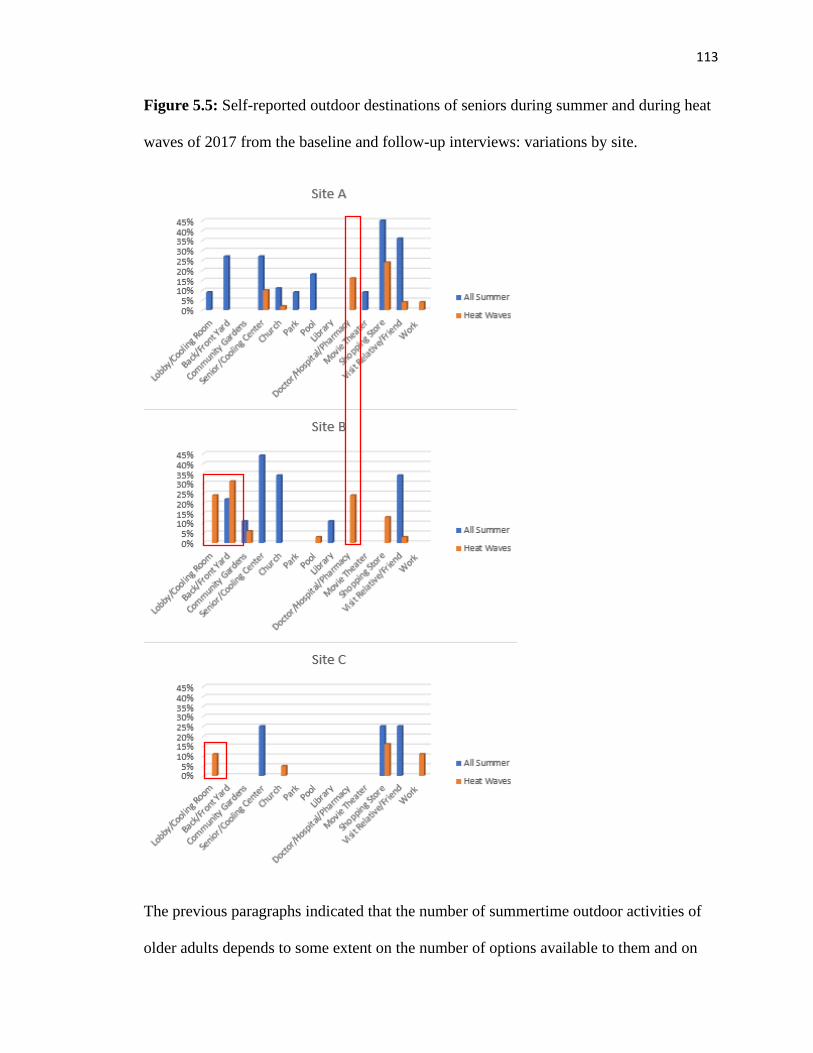
113
Figure 5.5: Self-reported outdoor destinations of seniors during summer and during heat
waves of 2017 from the baseline and follow-up interviews: variations by site.
The previous paragraphs indicated that the number of summertime outdoor activities of
older adults depends to some extent on the number of options available to them and on
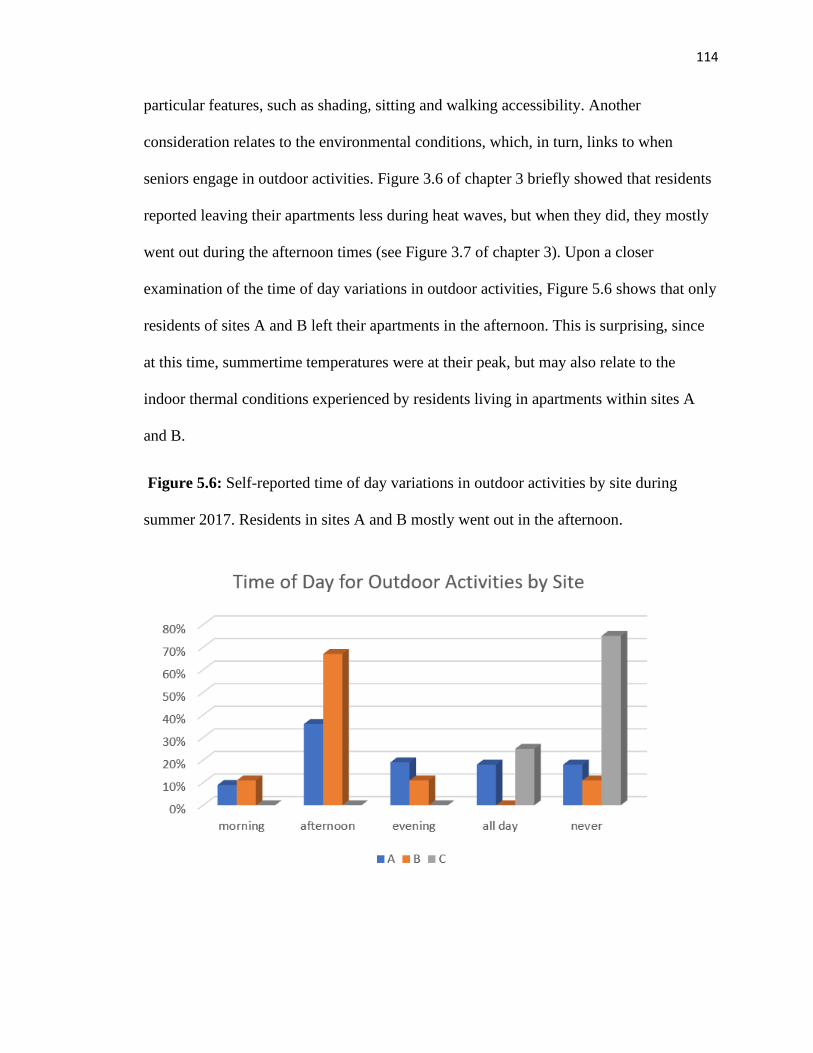
114
particular features, such as shading, sitting and walking accessibility. Another
consideration relates to the environmental conditions, which, in turn, links to when
seniors engage in outdoor activities. Figure 3.6 of chapter 3 briefly showed that residents
reported leaving their apartments less during heat waves, but when they did, they mostly
went out during the afternoon times (see Figure 3.7 of chapter 3). Upon a closer
examination of the time of day variations in outdoor activities, Figure 5.6 shows that only
residents of sites A and B left their apartments in the afternoon. This is surprising, since
at this time, summertime temperatures were at their peak, but may also relate to the
indoor thermal conditions experienced by residents living in apartments within sites A
and B.
Figure 5.6: Self-reported time of day variations in outdoor activities by site during
summer 2017. Residents in sites A and B mostly went out in the afternoon.
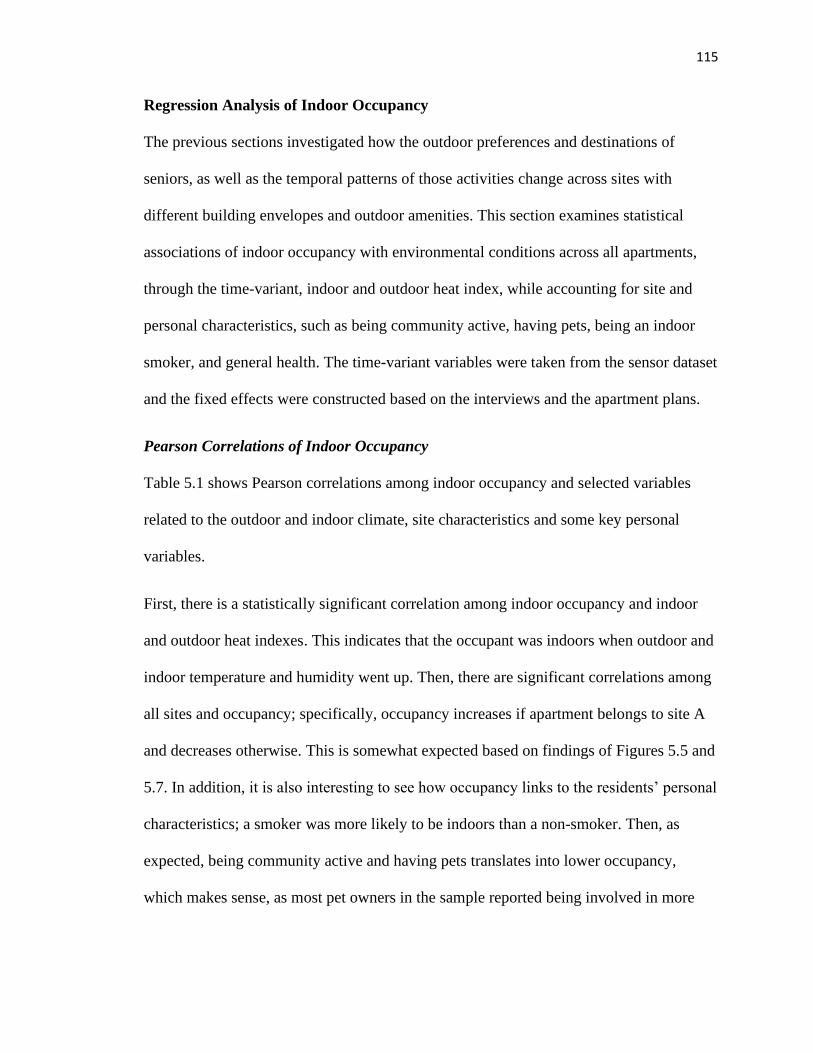
115
Regression Analysis of Indoor Occupancy
The previous sections investigated how the outdoor preferences and destinations of
seniors, as well as the temporal patterns of those activities change across sites with
different building envelopes and outdoor amenities. This section examines statistical
associations of indoor occupancy with environmental conditions across all apartments,
through the time-variant, indoor and outdoor heat index, while accounting for site and
personal characteristics, such as being community active, having pets, being an indoor
smoker, and general health. The time-variant variables were taken from the sensor dataset
and the fixed effects were constructed based on the interviews and the apartment plans.
Pearson Correlations of Indoor Occupancy
Table 5.1 shows Pearson correlations among indoor occupancy and selected variables
related to the outdoor and indoor climate, site characteristics and some key personal
variables.
First, there is a statistically significant correlation among indoor occupancy and indoor
and outdoor heat indexes. This indicates that the occupant was indoors when outdoor and
indoor temperature and humidity went up. Then, there are significant correlations among
all sites and occupancy; specifically, occupancy increases if apartment belongs to site A
and decreases otherwise. This is somewhat expected based on findings of Figures 5.5 and
5.7. In addition, it is also interesting to see how occupancy links to the residents’ personal
characteristics; a smoker was more likely to be indoors than a non-smoker. Then, as
expected, being community active and having pets translates into lower occupancy,
which makes sense, as most pet owners in the sample reported being involved in more
116
community-based activities. Finally, a more healthy resident is more likely to be
outdoors, which is also expected, since it relates to senior mobility.
The highest magnitudes are those of site A, general health and indoor and outdoor heat
index, which indicates that the decision of leaving (or not) the apartment can be affected
by the indoor and outdoor environmental conditions, site characteristics and personal
constraints. The same patterns repeat during daytime and during heat waves, where
coefficient magnitudes remaining similar.
Table 5.1: Pearson correlations between indoor occupancy and selected variables during
all summer 2017, daytime only and heat waves only. *Significant at the p=0.05 level.14
Indoor Occupancy
All Data Daytime Heat Waves
OHI 0.04* -0.03* 0.05*
IHI 0.04* 0.07* 0.08*
Site A 0.10* 0.12* 0.10*
Site B -0.03* -0.04* -0.02*
Site C -0.09* -0.10* -0.10*
Having Pets -0.03* -0.02* -0.02
Smoking 0.09* 0.07* 0.10*
Community Active -0.05* -0.08* -0.04*
General Health -0.10* -0.08* -0.11*
Logistic Regressions of Indoor Occupancy
The following paragraphs examine statistical associations among indoor occupancy and
selected variables of Table 5.1, through panel logistic regression analysis. Same as in
14 IHI and OHI are continuous variables. The rest are dummy variables.
117
previous chapters, panel regression with random effects and robust standard errors is
suitable, due to the two-dimensional database (spatio-temporal variations).
Table 5.2 presents the results of 3 models; the first examines a simple, heat-occupancy
relationship, the next adds the effect of site characteristics, and the last examines the
influence of personal attributes, such as the occupant’s general health. The last model
(M3) is repeated only for daytime data and for the heat wave periods. The table shows the
odds ratios and standard errors for each predictor variable, as well as their statistical
significance and the models’ explanatory power based on Log Likelihood.
In model 1 (M1), regression coefficients indicate that indoor occupancy is 9% less likely
if the indoor heat index goes up, which contradicts to the correlation shown in Table 5.1.
Then, it is 3% more likely as the outdoor heat index goes up. In other words, if outdoor
heat increases, the occupant remains indoors and if indoor heat increases, the occupant
leaves the apartment. Both coefficients make sense, however, their magnitudes are small.
When the fixed effect for site A is added in model 2 (M2), IHI and OHI coefficients
remain the same, and it becomes clear that the site characteristics have a stronger effect;
occupants in site A are 103% more likely to remain indoors. Lastly, model 3 (M3) adds
the health variable, which shows a significant effect over indoor occupancy and indicates
that if the occupant’s health goes down, the occupant is about 31% less likely to leave the
apartment. The magnitude is somewhat strong and still higher than the influence of IHI
and OHI.
The two additional models for daytime and heat wave data are based on model 3. The
model with the heat wave data follows the odds of M3, both in terms of directions and
magnitudes. In the model with the daytime data, it is shown that the site’s effect becomes
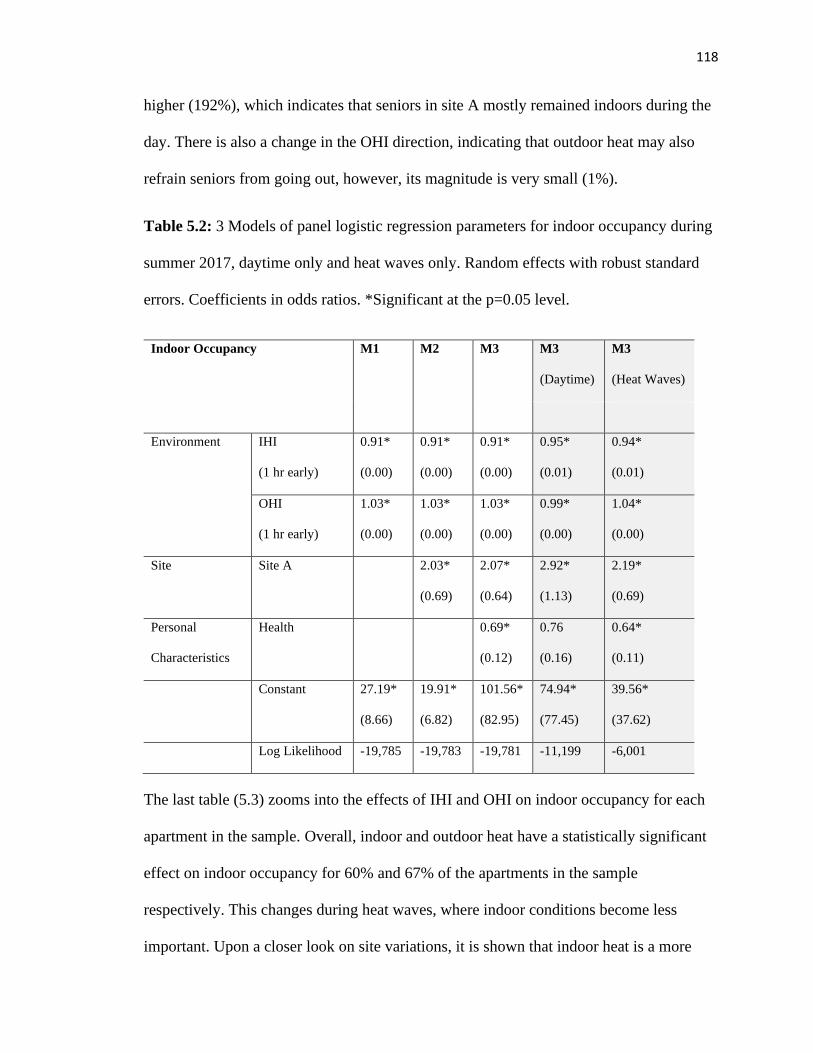
118
higher (192%), which indicates that seniors in site A mostly remained indoors during the
day. There is also a change in the OHI direction, indicating that outdoor heat may also
refrain seniors from going out, however, its magnitude is very small (1%).
Table 5.2: 3 Models of panel logistic regression parameters for indoor occupancy during
summer 2017, daytime only and heat waves only. Random effects with robust standard
errors. Coefficients in odds ratios. *Significant at the p=0.05 level.
Indoor Occupancy M1 M2 M3 M3
(Daytime)
M3
(Heat Waves)
Environment IHI
(1 hr early)
0.91*
(0.00)
0.91*
(0.00)
0.91*
(0.00)
0.95*
(0.01)
0.94*
(0.01)
OHI
(1 hr early)
1.03*
(0.00)
1.03*
(0.00)
1.03*
(0.00)
0.99*
(0.00)
1.04*
(0.00)
Site Site A 2.03*
(0.69)
2.07*
(0.64)
2.92*
(1.13)
2.19*
(0.69)
Personal
Characteristics
Health 0.69*
(0.12)
0.76
(0.16)
0.64*
(0.11)
Constant 27.19*
(8.66)
19.91*
(6.82)
101.56*
(82.95)
74.94*
(77.45)
39.56*
(37.62)
Log Likelihood -19,785 -19,783 -19,781 -11,199 -6,001
The last table (5.3) zooms into the effects of IHI and OHI on indoor occupancy for each
apartment in the sample. Overall, indoor and outdoor heat have a statistically significant
effect on indoor occupancy for 60% and 67% of the apartments in the sample
respectively. This changes during heat waves, where indoor conditions become less
important. Upon a closer look on site variations, it is shown that indoor heat is a more
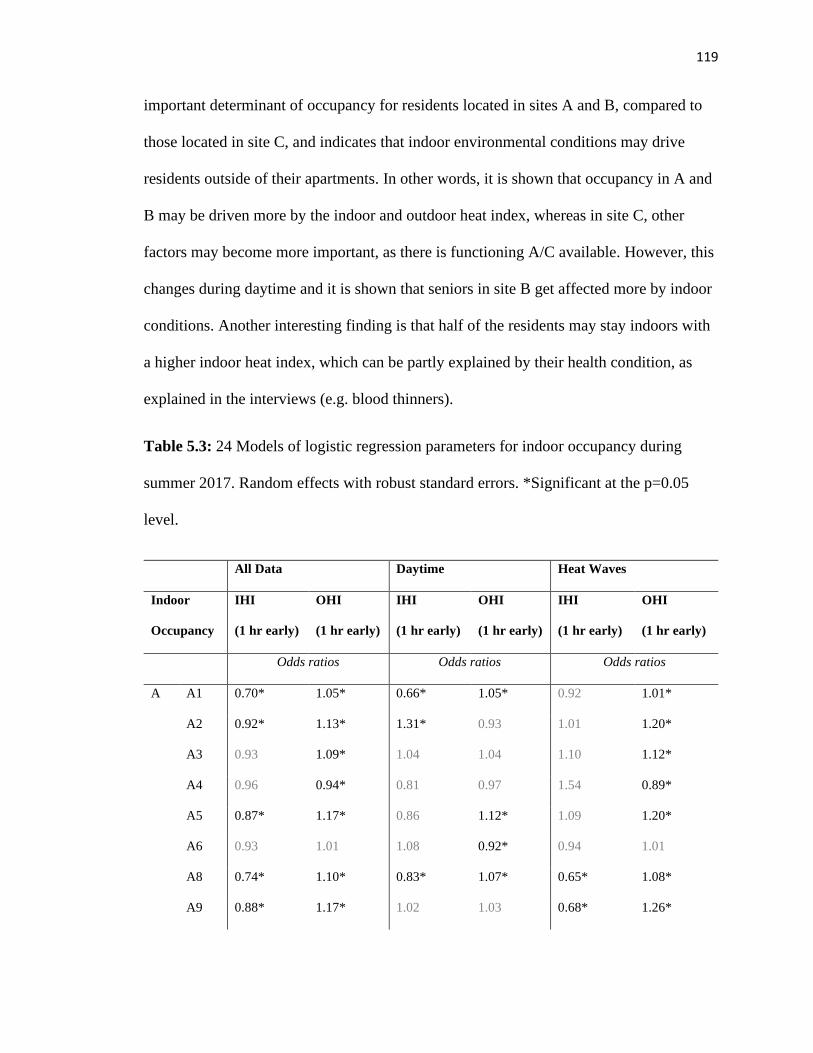
119
important determinant of occupancy for residents located in sites A and B, compared to
those located in site C, and indicates that indoor environmental conditions may drive
residents outside of their apartments. In other words, it is shown that occupancy in A and
B may be driven more by the indoor and outdoor heat index, whereas in site C, other
factors may become more important, as there is functioning A/C available. However, this
changes during daytime and it is shown that seniors in site B get affected more by indoor
conditions. Another interesting finding is that half of the residents may stay indoors with
a higher indoor heat index, which can be partly explained by their health condition, as
explained in the interviews (e.g. blood thinners).
Table 5.3: 24 Models of logistic regression parameters for indoor occupancy during
summer 2017. Random effects with robust standard errors. *Significant at the p=0.05
level.
All Data Daytime Heat Waves
Indoor
Occupancy
IHI
(1 hr early)
OHI
(1 hr early)
IHI
(1 hr early)
OHI
(1 hr early)
IHI
(1 hr early)
OHI
(1 hr early)
Odds ratios Odds ratios Odds ratios
A A1 0.70* 1.05* 0.66* 1.05* 0.92 1.01*
A2 0.92* 1.13* 1.31* 0.93 1.01 1.20*
A3 0.93 1.09* 1.04 1.04 1.10 1.12*
A4 0.96 0.94* 0.81 0.97 1.54 0.89*
A5 0.87* 1.17* 0.86 1.12* 1.09 1.20*
A6 0.93 1.01 1.08 0.92* 0.94 1.01
A8 0.74* 1.10* 0.83* 1.07* 0.65* 1.08*
A9 0.88* 1.17* 1.02 1.03 0.68* 1.26*
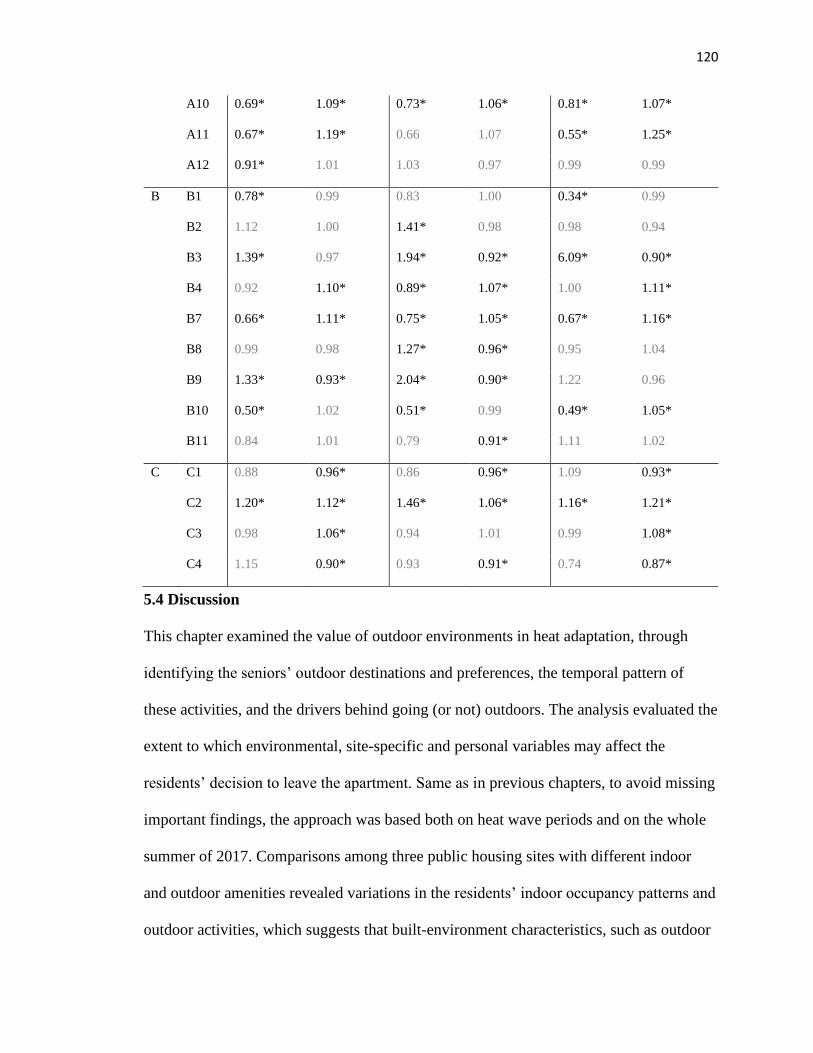
120
A10 0.69* 1.09* 0.73* 1.06* 0.81* 1.07*
A11 0.67* 1.19* 0.66 1.07 0.55* 1.25*
A12 0.91* 1.01 1.03 0.97 0.99 0.99
B B1 0.78* 0.99 0.83 1.00 0.34* 0.99
B2 1.12 1.00 1.41* 0.98 0.98 0.94
B3 1.39* 0.97 1.94* 0.92* 6.09* 0.90*
B4 0.92 1.10* 0.89* 1.07* 1.00 1.11*
B7 0.66* 1.11* 0.75* 1.05* 0.67* 1.16*
B8 0.99 0.98 1.27* 0.96* 0.95 1.04
B9 1.33* 0.93* 2.04* 0.90* 1.22 0.96
B10 0.50* 1.02 0.51* 0.99 0.49* 1.05*
B11 0.84 1.01 0.79 0.91* 1.11 1.02
C C1 0.88 0.96* 0.86 0.96* 1.09 0.93*
C2 1.20* 1.12* 1.46* 1.06* 1.16* 1.21*
C3 0.98 1.06* 0.94 1.01 0.99 1.08*
C4 1.15 0.90* 0.93 0.91* 0.74 0.87*
5.4 Discussion
This chapter examined the value of outdoor environments in heat adaptation, through
identifying the seniors’ outdoor destinations and preferences, the temporal pattern of
these activities, and the drivers behind going (or not) outdoors. The analysis evaluated the
extent to which environmental, site-specific and personal variables may affect the
residents’ decision to leave the apartment. Same as in previous chapters, to avoid missing
important findings, the approach was based both on heat wave periods and on the whole
summer of 2017. Comparisons among three public housing sites with different indoor
and outdoor amenities revealed variations in the residents’ indoor occupancy patterns and
outdoor activities, which suggests that built-environment characteristics, such as outdoor
121
landscape design and amenities may alter occupant behaviors and offer additional heat
adaptation options.
Specifically, results from Figures 5.4 and 5.5 combined with Table 2.3 of chapter 2
support the first hypothesis that seniors indeed use outdoor spaces, assuming they are
available in close proximity. As shown in Figures 5.1 - 5.3, in contrast to C, sites A and B
have gardens and shady yards with sitting, and are surrounded by numerous additional
amenities, such as shopping stores, pharmacies, religious places and senior centers,
within walking distance. The existence of these options explains to some extent why the
number of outdoor activities is higher among A and B residents. This is further supported
by Table 3.8 of chapter 3, where it is shown that seniors from these two sites provided a
variety of recommendations for outdoor space improvements, which additionally
indicates their recognition of the importance of outdoor amenities. Yet, besides walking
accessibility, a number of additional considerations are highlighted; safety, more
greenery, shading, and sitting options, as well as better transportation access, all are
considered important features that may increase outdoor activities of older adults and
their use of outdoor spaces, which the literature confirms.
Moving forward, results from Figure 5.6 show that residents from sites A and B mostly
engaged in outdoor activities in the afternoon, and this increased during heat wave
periods. Since summer temperatures were at their peak during this time (see Figure 2.8 of
chapter 2), this finding supports the second hypothesis that outdoor spaces may serve as
alternatives in sites where indoor environments are inadequate in providing shelter from
heat. Tables 5.1 – 5.3 further show a statistically significant relationship between indoor
heat and occupancy. Specifically, as the indoor heat index increased, the occupant was
122
more likely to leave the apartment, especially if he/she was in good health. Yet, the
coefficient magnitude is small, which indicates that the relationship between indoor heat
and occupancy is not straight-forward and is likely influenced by additional factors, such
as the outdoor climate and individual preferences or constraints. Somewhat contradictory
results come from the overall effect of site A on indoor occupancy, which means that A
residents were more likely to stay indoors. However, this result was overturned in a
zoomed-in investigation of individual apartments, through logistic regressions of
occupancy-heat (Table 5.3); coefficients show that most A residents were more likely to
leave the apartment when the indoor heat index went up.
Overall, findings confirm the value of outdoor affordances in assisting low-income
seniors coping with heat. A multi-level approach examining the relative roles of social,
physical and environmental factors in heat adaptation is beneficial, as it highlights
pathways for local action that extend beyond access to air-conditioning. A poor indoor
environment with high levels of temperature and humidity pushes older adults to seek
outdoor alternatives, assuming they are in good health and/or have some social network
supporting their decision to go out. An adjacent neighborhood environment that is safe,
cooler, attractive, with social ties and with green spaces, shading, and sitting can function
as a refuge during heat periods. The above suggest that housing policies for heat
adaptation can highly benefit from the users’ perspectives and that investing in outdoor
amenities and landscape design interventions can be valuable and cost-effective,
especially when complemented by indoor-level modifications.
123
6. Chapter 6 Heat Adaptation Policy through a Social-
Ecological Framework
This dissertation has tested the idea that urban sites can be conceptualized as social-
ecological systems, aiming to understand the relative roles of social, physical and
environmental factors in heat adaptation. Drawing from a study of a senior public
housing community in Elizabeth, NJ, USA, a heat-wave SES framework was empirically
derived that links indoor to outdoor environments and to social actors and organizations.
Subsequently, the role of indoor environments was examined, followed by the
exploration of the value of outdoor environments in assisting older adults coping with
heat. This chapter concludes the work by synthesizing an inventory of integrated policy
for heat adaptation through a social-ecological systems lens, which corresponds to the
last question of the dissertation. It starts with a summary of the thesis’ key outcomes, and
critically reflects on the usefulness of the SES approach. It then translates the thesis
findings into a set of cost-effective and easily accessible interventions to assist older
adults and low-income communities in adapting to heat. The final section provides an
overall discussion of the thesis contributions with suggestions for future development of
the work.
6.1 Summary of Findings
The starting point of inquiry for this work was the view of urban sites as social-ecological
systems, where actors interact with infrastructure during heat waves and produce
outcomes related to heat adaptation. With this premise as guidance, the first research
question asked, “what social and ecological components become relevant in the case of
senior low-income sites suffering from heat waves.” Chapter 2 addressed this question by
124
extending the SES framing to the study community in Elizabeth, NJ and by assembling a
descriptive SES framework for heat waves to guide subsequent analysis. The framework,
shown in Figure 2.3, organizes the indoor and outdoor scales in which seniors move, and
identifies the infrastructure characteristics that influence environmental conditions, as
well as the social actors that become important at each scale.
Chapter 2 further tested the first question associated hypotheses. Specifically, in regard to
the first hypothesis, which states that “heat waves require actors to adapt and change key
behaviors,” preliminary analysis showed that indeed, when summer temperatures went
up, the primary actors of the study community - senior residents - engaged in a range of
adaptive actions, including operating windows and A/C and leaving the apartment
(indoor occupancy); yet, these actions varied based on the indoor and outdoor resources
available to them and the potential of receiving support from the community. To that end,
the role of additional policy actors was proactive. A local non-profit had previously
installed window A/C units and covered the associated bills in some apartments.
Similarly, facility staff of the managing authority monitored the operations and
maintenance of the sites and the residents’ well-being during heat waves. Therefore, the
above suggests that there is merit in the first hypothesis, yet, further analysis is needed to
assess the extent to which some behaviors can be fully attributed to heat waves.
Another important finding of chapter 2 relates to the second hypothesis, which states that
“some SES parts give sites an advantage in increasing the chances of heat adaptation.”
Preliminary results indicated that the outdoor climate and infrastructure characteristics
(indoor affordances, outdoor amenities) highly affected the indoor environmental
conditions experienced by low-income seniors, yet, the influence of resident activities
125
was also deemed important. This finding suggests a stronger focus on the interactions
among resident activities and dwelling characteristics, followed by an examination of the
role of outdoor environments. Given this analysis, the hypothesis was well supported and
revealed that the focus should be on behavior-infrastructure synergies to be further
explored in subsequent chapters.
In response to findings from chapter 2, the second research question asked “what is the
role of indoor environments in mediating heat and which social and ecological factors
influence indoor environmental conditions.” Chapter 3 addressed this question by taking
a multi-level regression approach to identify the relative roles of site and apartment
characteristics, environmental and personal variables and the seniors’ actions on indoor
heat, diagrammatically represented in the framework of Figure 3.1. The framework
shows how occupant actions are subject to personal characteristics and the
indoor/outdoor resources available to the residents, which are highly varied across the
three study sites. Since the focus was on indoor environments, the main occupant
behaviors investigated here were operation of windows and A/C.
Results from chapter 3 partly supported the first hypothesis and showed that an increase
in outdoor heat resulted in higher indoor heat, while certain site and apartment attributes
strengthened this relationship. However, the small magnitude of regression coefficients
indicated that additional influences could be more important in explaining indoor thermal
conditions. Indeed, occupant actions had the strongest influence on indoor heat, which
confirms the second hypothesis. In fact, some apartments located in sites with poor
building envelopes had similar indoor thermal performance with apartments from the
green building that had central air-conditioning, which was due to the way residents
126
operated windows and the small A/C units. Specifically, it was shown that when there
was medium WO activity and at certain times of day, it reduced indoor heat. Therefore, it
became clear that the operation of windows, which relates to the operation of A/C, was
directly related to indoor environmental conditions. This finding is very important
because it establishes window opening as an effective adaptive action and shows that
passive cooling can be valuable in mediating indoor heat. Furthermore, in accordance
with the findings of chapter 2, it was shown that the residents’ actions varied by
indoor/outdoor resources, and specifically by site. A zoomed-in investigation of
behavioral variations revealed that the absence of proper A/C systems combined with the
existence of rich outdoor amenities promoted a wide range of additional heat coping
behaviors, such as leaving the apartment (indoor occupancy), further explored in
subsequent analysis.
Chapter 4 grasped on the first finding of chapter 3 to focus on another aspect of the 2nd
research question and explore further indoor environmental conditions by examining
thermal comfort in parallel to indoor air quality. Analysis zoomed into the concurrent
impact of natural ventilation and window opening on mitigating indoor heat and pollutant
concentrations through mixed linear models and time series.
Results from chapter 4 confirmed chapter’s 2 findings and showed that building
characteristics played an important role for indoor heat exposure, but not for indoor PM2.5
pollution, which was mostly driven by indoor sources related to occupant behaviors, such
as smoking, while WO was an important modifying factor for both aspects. A deeper
investigation of the effect of WO on thermal and air quality performance supported the
third hypothesis based on which, “certain occupant actions have a trade-off on indoor
127
thermal and air quality performance.” Yet, it was found that this trade-off was not
evident in all apartments, but mostly within those with indoor smokers. This finding is
important, as it suggests that overall, while a low-to-medium window opening activity of
certain windows and at certain times per day is effective for both cooling and improved
IAQ, the interdependencies among IEQ aspects need to be considered in housing policies
for improved health outcomes.
Moving forward, in response to the last finding of chapter 3, chapter 5 investigated the
third research question that asks about “the value of outdoor environments in heat
adaptation.” Given variations in outdoor amenities and landscaping among the three
study sites, the chapter focused on answering where do seniors go when they leave the
apartment, what time of day do they take these actions and what are the drivers behind
going outdoors. Since the focus was on outdoor environments, the main occupant
behavior investigated here was indoor occupancy/leaving the apartment, and the analysis
was guided by the framework presented in Figure 3.1.
Results of chapter 5 supported the first hypothesis, which stated that “if outdoor spaces
are provided to them, seniors use them, assuming they are in close proximity.”
Specifically, it was shown that residents in sites and neighborhoods with rich outdoor
landscaping and a variety of possible destinations for seniors reported a higher number of
outdoor activities. However, besides walking accessibility, a number of additional criteria
were highlighted by the residents in regard to the use of outdoor spaces, such as adequate
transportation options, safety, sitting, shading and greenery.
128
Further analysis in the temporal pattern of those activities as well as in regressions,
revealed that indoor heat can drive seniors outdoors, which supports the second
hypothesis of chapter 4 that “outdoor spaces may serve as alternatives in sites where
indoor environments are inadequate in providing shelter from heat.” This finding was
more pronounced for seniors residing in sites with poor building envelopes, which was
further established by those residents’ interest and recommendations for outdoor space
improvements. However, in explaining indoor occupancy, additional considerations were
found to be important, such as the outdoor climate and individual constraints, especially
health and mobility, as well as the residents’ everyday routine. In other words, the extent
to which the decision to leave the apartment/indoor occupancy is driven by heat waves
seems to hold true, but it deems further investigation.
In sum, findings from the previous chapters highlighted two areas for further discussion,
which are explored in the following sections. The first area concerns the view of urban
sites as social-ecological systems, which is the theoretical umbrella of this work. Section
6.2 critically reflects upon the SES approach and offers recommendations for
improvement. The second area concerns the last research question of the dissertation,
which asks “how can we empirically inform policy towards heat adaptation through a
social-ecological systems lens.” Its aim is to organize and translate the thesis findings
into a set of cost-effective and easily accessible interventions to assist elderly low-income
communities in adapting to heat, which is the conclusive goal of this work. This effort is
presented in Section 6.3.
129
6.2 Revisiting the Social-Ecological Systems Approach
As argued in earlier chapters, the social-ecological systems approach utilized in this
dissertation addresses the challenge of bringing together the key social (human) and
ecological (non-human) dimensions that shape urban landscapes as equally important
considerations into a coherent framework. This framework successfully connects
interdisciplinary knowledge needed to describe the complex, dynamic and multi-scalar
interactions among these dimensions, out of which, heat adaptation pathways emerge.
Certainly, the SES approach has been useful in identifying and quantifying the relative
contributions of humans, infrastructure and the climate in the heat coping processes and
in expanding knowledge for related disciplines. It has further revealed that the long
causal chain, which contributes to heat vulnerability can reversely lead to successful heat
adaptation outcomes. Exposure to elevated ambient temperatures is higher for low-
income seniors living in sites with poor landscaping and few outdoor amenities; this is
further aggravated when combined with poor building envelopes and the absence of
support from community services and social networks, as residents are left without
enough options to improve their thermal experience. However, empirical analysis guided
by the SES framework has shown that the seniors’ options are increased if one or more of
these components are advanced. Older adults living in sites with good building
envelopes, but few outdoor amenities mostly rely on indoor environments and the
operation of A/C to improve comfort. Contrariwise, residents living in sites with rich
outdoor amenities, but poor building envelopes consider both indoor and outdoor
environments and rely on the operation of windows and the alteration of occupancy
patterns. In both cases, support from community actors (e.g. managing authority,
130
supportive organizations and social networks) is necessary for infrastructure operations,
maintenance and improvement, and to ensure the residents’ well-being.
The above findings suggest one important take-away from the application of the SES
approach to the empirical study of Elizabeth, NJ and an area for further inquiry, which is
the realization of the importance of human agency in heat adaptation. Rather than an
explanatory theory, the SES framework is better thought of as a descriptive, and often
diagnostic, theory-free tool that guides study design, data collection and modeling;
therefore, it could benefit from incorporating a theory of adaptive behavior. In its current
form, the framework does not clearly problematize the production of human behaviors
linked to built-environment characteristics, which is central in characterizing heat coping
processes. Thus, a behavioral theory could provide guidance on how organization-level
actions facilitate infrastructure alterations, which in turn, influence individual-level
actions and eventually adaptation outcomes. This is critical because it can improve our
understanding of the multiple spatial and institutional levels of agency that shape
residents' choices within urban landscapes.
6.3 Synthesizing an Inventory of Integrated Policy for Heat Adaptation
Already from the first chapter of this dissertation, a recurring notion is that the heat-
waves problem requires integrated solutions across indoor-to-outdoor scales that link to
local actors and institutions. The idea behind this integration lies in the fact that although
indoor environments are critical in assisting seniors coping with heat, they are not
isolated entities and therefore, they cannot be separated from the wider urban context
they belong to. This has been repeatedly demonstrated in earlier literature and in the
outcomes of the previous chapters. In response to the last research question of this
131
dissertation, the following paragraphs conclude this work by attempting to expand the
SES framework beyond its diagnostic capability in guiding analysis and facilitate policy
development.
Translating modeling outcomes into sets of policies is unarguably challenging, as social-
ecological systems are characterized by non-linear dynamics, feedback loops between
social and ecological processes and emergence of behavior that changes across space and
time. However, a part that stands out in this dissertation is the importance of the
institutional dimension in policy making, which is well-established in the SES
framework. In particular, the focus is on local actors and institutions and it is shown that
their involvement is critical for successful heat adaptation policy development and
implementation. Yet, missing is an in-depth identification of each actor’s and institution’s
role at specific scales and the likely effects of their actions for different policy
interventions.
In response to the above and drawing from the heat waves SES framework presented in
Figure 2.3, Tables 6.1and 6.2 translate findings from the previous chapters as outlined in
section 6.1 into two different groups of heat adaptation policies; each group is linked to
the spatial scale (indoors and outdoors) and the associated sub-scale, as well as the
actor(s) involved, further explained below.
Implications for Heat Adaptation Policy Addressing Behavioral Alterations
The importance of emphasis on behaviors is already evident from the outcomes of
chapter 2, also listed as findings one and two in Table 6.1. Related to that are two
strategies that the current study highlights, both of which address changes in the
132
residents’ behavioral habits and can assist older adults cope with extended periods of hot
and humid weather.
The first strategy concerns the operation of certain windows at certain times of day, as
demonstrated in the third finding of Table 6.1, and encourages investment in efficient
cooling, such as effective natural ventilation. Due to its focus on the real indoor
environmental exposures experienced by seniors inside public housing, an important
consideration that this study stresses is that thermal-comfort decision-making should not
be done in isolation, but within the context of indoor environmental quality. This is
directly relevant to behavioral interventions, such as window operation, given the
associated complexities when examining effects on more than one IEQ domain. This
emphasis on ventilation also comes in response to the global COVID-19 pandemic,
which requires immediate action for the protection of vulnerable groups and especially
older adults. Therefore, the main take-away is that sufficient natural ventilation for
improved IEQ should be enforced, since window opening can work well as a means to
cool off and clean the indoor air at the same time. Yet, it is best when it is coupled with
educational and technological interventions. For example, while it is intuitive to operate
the windows in response to an indoor environmental stimulus, it is not easy to weight
multiple criteria simultaneously (e.g. decide on the optimal window opening based on
both thermal and air quality conditions). Educating residents about the importance of
indoor air quality and effective ways to open their windows can be very valuable in the
long term. Then, WO can be coupled with technological interventions, such as using air
purifiers and installing high-efficiency filters, which can also work well in the long term
and have faster results (see physical alteration policy 1 of Table 6.1).
133
The second strategy relates to reduced indoor occupancy and the opportunity to leave the
apartment at certain times of day, which is related to the fourth finding of Table 6.1.
When combined with outdoor landscape design to provide adequate amount of shading,
as well as a variety of adjacent amenities based on seniors’ preferences (see physical
alteration policies three and four of Table 6.1), these strategies can be important
protective factors from indoor heat-related discomfort, especially for those not having
access to A/C or not being able to afford running it. These features also help maintain
well-being during power outages, which often coincide with heat waves. Leaving the
apartment and visiting outdoor destinations further responds to the need for achieving
additional health goals, such as mobility and socializing for older populations.
Heat adaptation policy that goes beyond access to air-conditioning and re-examines cost-
effective options at the apartment-level is urgently needed. In addition, the above
protective strategies integrate human agency into the heat-wave stories, which is not
clearly established in the literature. While a large body of studies focus on indoor
strategies to improve thermal performance and many incorporate occupant behaviors,
such as window opening, most often occupants are treated as powerless actors without
ownership of their own actions. Therefore, empowering key actors is an additional aim of
this group of policies, which present the potential for long-term adaptation to heat waves.
Lastly, an additional benefit includes the non-existent cost of implementation; however,
there is a knowledge barrier that needs to be overcome, which can be achieved through
educating residents. This requires attention on collaboration among residents and
organizations (see Table 6.2), such as the managing authority and additional supportive
134
institutions, which can be time consuming and complicated, as it involves several human
entities.
Implications for Heat Adaptation Policy Addressing Physical Alterations
Chapter 2 outcomes, and findings one and two of Table 6.1 respectively, have further
demonstrated the critical role of infrastructure, especially the extent to which it may
affect the residents’ adaptive options. Chapters 3, 4 and 5 revealed how the physical
characteristics of indoor environments may drive certain occupant actions, and the extent
to which outdoor environments can enhance such activities.
Starting with physical alterations of indoor environments, and in relation to finding three
from Table 6.1, an important policy implication that emerges from this study is that all
renters should have access to cooling and rental housing regulations should include that
as a requirement. Therefore, the two related interventions concern investing in 1) optimal
size, location and type windows for better passive ventilation performance coupled with
high-efficiency filters and air purifiers, and in 2) central air-conditioning. In general, the
more comfortable indoor environments are, the less action is needed by occupants to
improve their comfort. Outcomes from chapters 3 and 4 clearly show that residents who
either live in air-conditioned apartments or follow a “smart” window opening routine,
overall enjoy heat index ranges that fall within the ASHRAE standards. The above
strategies aim to enhance these findings. Cooling options should not be a luxury, but a
necessity that could significantly reduce morbidity and mortality rates during heat
disasters, especially among socially isolated and physically frail low-income seniors.
135
Incorporating apartment and building-level retrofits is critical for heat adaptation policy,
since indoor spaces are the first protective environments for aged occupants. The notion
of investing on envelopes is not new and is well-established in the literature, for both
existing and new building stock. But the cost involved may be a significant barrier for
low-income communities, who often struggle to distribute a small annual budget across
several different sites. Collaboration among human entities is again vital here, as
collective efforts to spread associated costs between several institutions (e.g. between
managing authority and local non-profits) could overcome this barrier (see Table 6.2).
The last group of interventions corresponds to the fourth finding of Table 6.1 and relates
to physical alterations of outdoor environments. The first related strategy concerns
investing in site landscape design and greening, such as sitting, vegetation and increased
tree canopy for shading. Besides creating additional protection from heat for indoor
environments, these features are frequently used by seniors, as shown in the outcomes of
chapter 5. In addition, literature focusing on nature-based solutions, has repeatedly
demonstrated links to physical activity, social contact and stress recovery, all of which
are particularly important considerations for older adults. Related to that is also the final
strategy to invest in connections to adjacent neighborhood amenities, such as community
and cooling centers, shopping stores, places of worship, and swimming pools, whose
importance is addressed by limited studies.
Chapter 5 showed the value of investing in outdoor environments, especially because
certain outdoor features may provide alternative options for older adults during extended
periods of hot weather and this can be particularly helpful in cases where indoor
environments cause thermal discomfort. Same as with indoor physical alterations, cost
136
presents a significant barrier here. When it comes to site landscaping, in a large-scale
implementation, the cost may be higher, but greening the immediate building
surroundings with small trees and shrubs can still be cost-effective, assuming close
collaboration among local institutions and organizations (see Table 6.2). Such
collaborations are also essential in the case of promoting connections to neighborhood
amenities. The existence of such spaces and their proximity to existing public housing
communities moves beyond local organizations to city authorities. Yet, related
interventions should invest in safety, free transportation options and providing walkable
and shady paths to these destinations.
Besides managing authorities and local institutions, the spectrum of strategies guiding
heat adaptation policy for senior public housing can be addressed by municipal and state
officials, as well as building code professionals and highlight four key take-outs. First,
both knowledge and cost barriers present significant challenges. In response to that, the
empirical study of Elizabeth, NJ presented in this thesis suggests filling the knowledge
gap through education and addressing financial limitations through the involvement of
and distributions across several local actors and institutions. Second, there are important
trade-offs when it comes to the implementation of policies; interventions that are zero or
low-cost, require attention on the scale and time of implementation, and on the
complexities of involving several human entities. Third, while one thing is to enforce
behavioral and physical interventions, the other is to maintain them and ensure proper
operations, which is especially important for long-term heat adaptation. Fourth, the last
and perhaps most high-level theme established in this work, is that an integrated set of
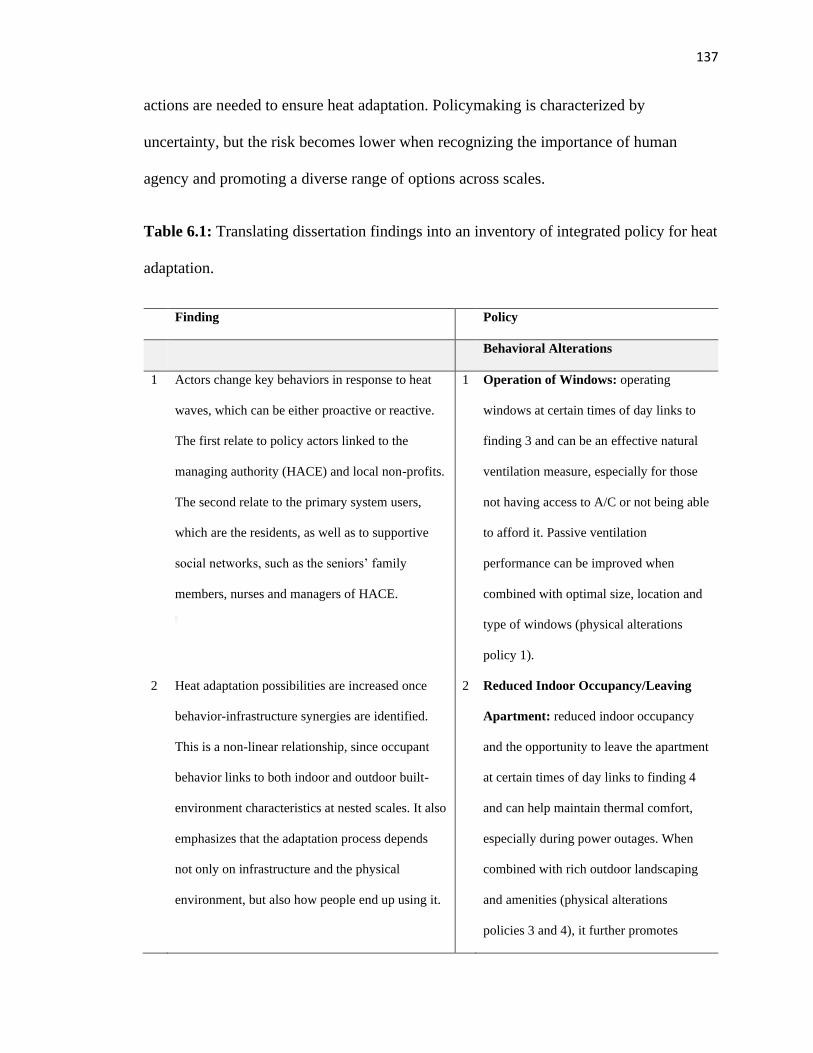
137
actions are needed to ensure heat adaptation. Policymaking is characterized by
uncertainty, but the risk becomes lower when recognizing the importance of human
agency and promoting a diverse range of options across scales.
Table 6.1: Translating dissertation findings into an inventory of integrated policy for heat
adaptation.
Finding Policy
Behavioral Alterations
1 Actors change key behaviors in response to heat
waves, which can be either proactive or reactive.
The first relate to policy actors linked to the
managing authority (HACE) and local non-profits.
The second relate to the primary system users,
which are the residents, as well as to supportive
social networks, such as the seniors’ family
members, nurses and managers of HACE.
a
1 Operation of Windows: operating
windows at certain times of day links to
finding 3 and can be an effective natural
ventilation measure, especially for those
not having access to A/C or not being able
to afford it. Passive ventilation
performance can be improved when
combined with optimal size, location and
type of windows (physical alterations
policy 1).
2 Heat adaptation possibilities are increased once
behavior-infrastructure synergies are identified.
This is a non-linear relationship, since occupant
behavior links to both indoor and outdoor built-
environment characteristics at nested scales. It also
emphasizes that the adaptation process depends
not only on infrastructure and the physical
environment, but also how people end up using it.
2 Reduced Indoor Occupancy/Leaving
Apartment: reduced indoor occupancy
and the opportunity to leave the apartment
at certain times of day links to finding 4
and can help maintain thermal comfort,
especially during power outages. When
combined with rich outdoor landscaping
and amenities (physical alterations
policies 3 and 4), it further promotes
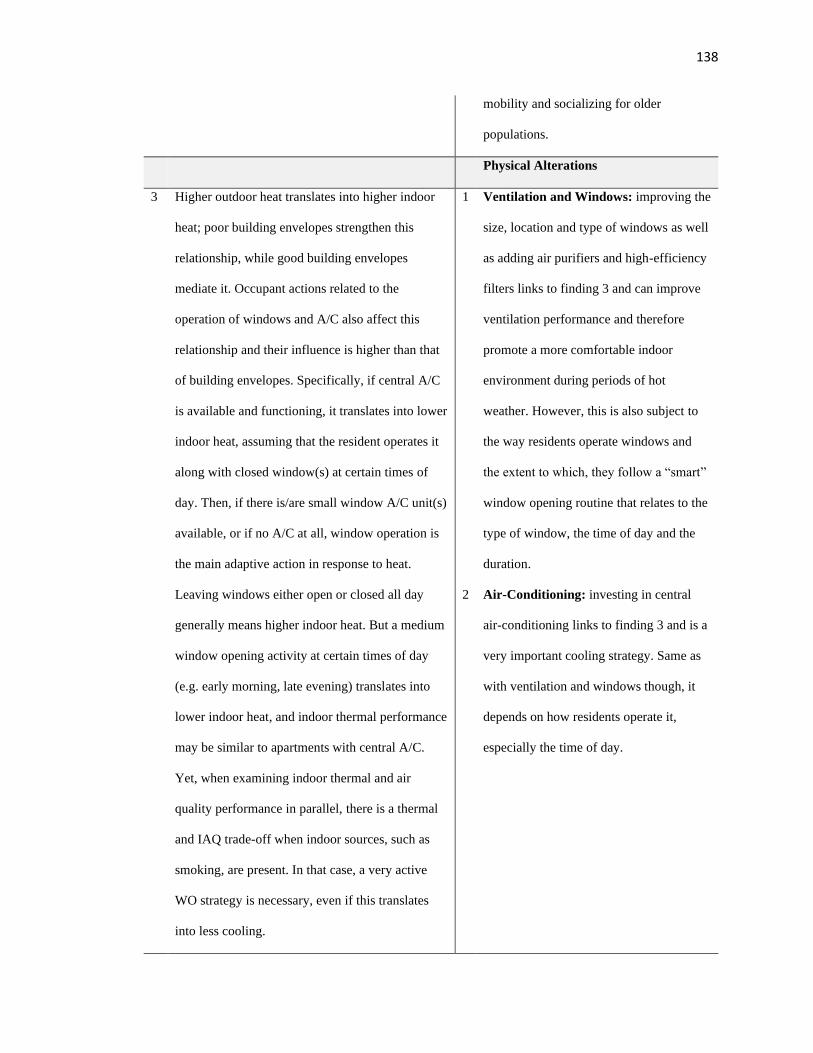
138
mobility and socializing for older
populations.
Physical Alterations
3 Higher outdoor heat translates into higher indoor
heat; poor building envelopes strengthen this
relationship, while good building envelopes
mediate it. Occupant actions related to the
operation of windows and A/C also affect this
relationship and their influence is higher than that
of building envelopes. Specifically, if central A/C
is available and functioning, it translates into lower
indoor heat, assuming that the resident operates it
along with closed window(s) at certain times of
day. Then, if there is/are small window A/C unit(s)
available, or if no A/C at all, window operation is
the main adaptive action in response to heat.
Leaving windows either open or closed all day
generally means higher indoor heat. But a medium
window opening activity at certain times of day
(e.g. early morning, late evening) translates into
lower indoor heat, and indoor thermal performance
may be similar to apartments with central A/C.
Yet, when examining indoor thermal and air
quality performance in parallel, there is a thermal
and IAQ trade-off when indoor sources, such as
smoking, are present. In that case, a very active
WO strategy is necessary, even if this translates
into less cooling.
1 Ventilation and Windows: improving the
size, location and type of windows as well
as adding air purifiers and high-efficiency
filters links to finding 3 and can improve
ventilation performance and therefore
promote a more comfortable indoor
environment during periods of hot
weather. However, this is also subject to
the way residents operate windows and
the extent to which, they follow a “smart”
window opening routine that relates to the
type of window, the time of day and the
duration.
2 Air-Conditioning: investing in central
air-conditioning links to finding 3 and is a
very important cooling strategy. Same as
with ventilation and windows though, it
depends on how residents operate it,
especially the time of day.
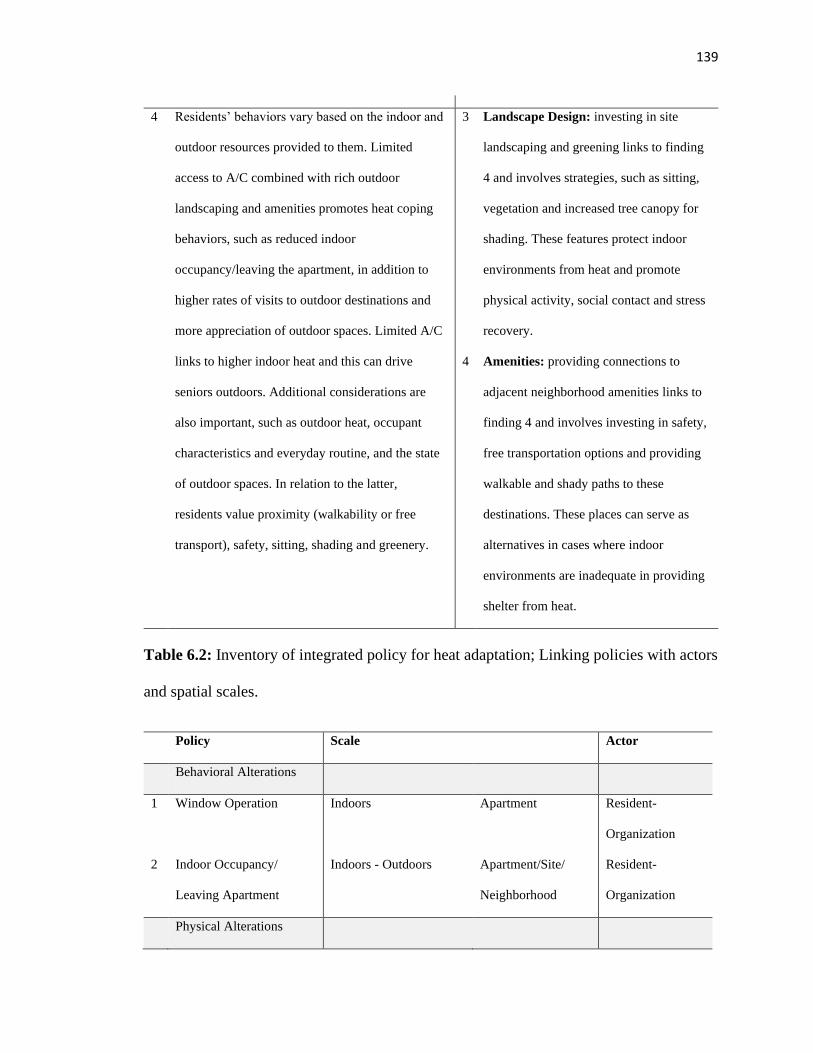
139
4 Residents’ behaviors vary based on the indoor and
outdoor resources provided to them. Limited
access to A/C combined with rich outdoor
landscaping and amenities promotes heat coping
behaviors, such as reduced indoor
occupancy/leaving the apartment, in addition to
higher rates of visits to outdoor destinations and
more appreciation of outdoor spaces. Limited A/C
links to higher indoor heat and this can drive
seniors outdoors. Additional considerations are
also important, such as outdoor heat, occupant
characteristics and everyday routine, and the state
of outdoor spaces. In relation to the latter,
residents value proximity (walkability or free
transport), safety, sitting, shading and greenery.
3 Landscape Design: investing in site
landscaping and greening links to finding
4 and involves strategies, such as sitting,
vegetation and increased tree canopy for
shading. These features protect indoor
environments from heat and promote
physical activity, social contact and stress
recovery.
4 Amenities: providing connections to
adjacent neighborhood amenities links to
finding 4 and involves investing in safety,
free transportation options and providing
walkable and shady paths to these
destinations. These places can serve as
alternatives in cases where indoor
environments are inadequate in providing
shelter from heat.
Table 6.2: Inventory of integrated policy for heat adaptation; Linking policies with actors
and spatial scales.
Policy Scale Actor
Behavioral Alterations
1 Window Operation Indoors Apartment Resident-
Organization
2 Indoor Occupancy/
Leaving Apartment
Indoors - Outdoors Apartment/Site/
Neighborhood
Resident-
Organization
Physical Alterations
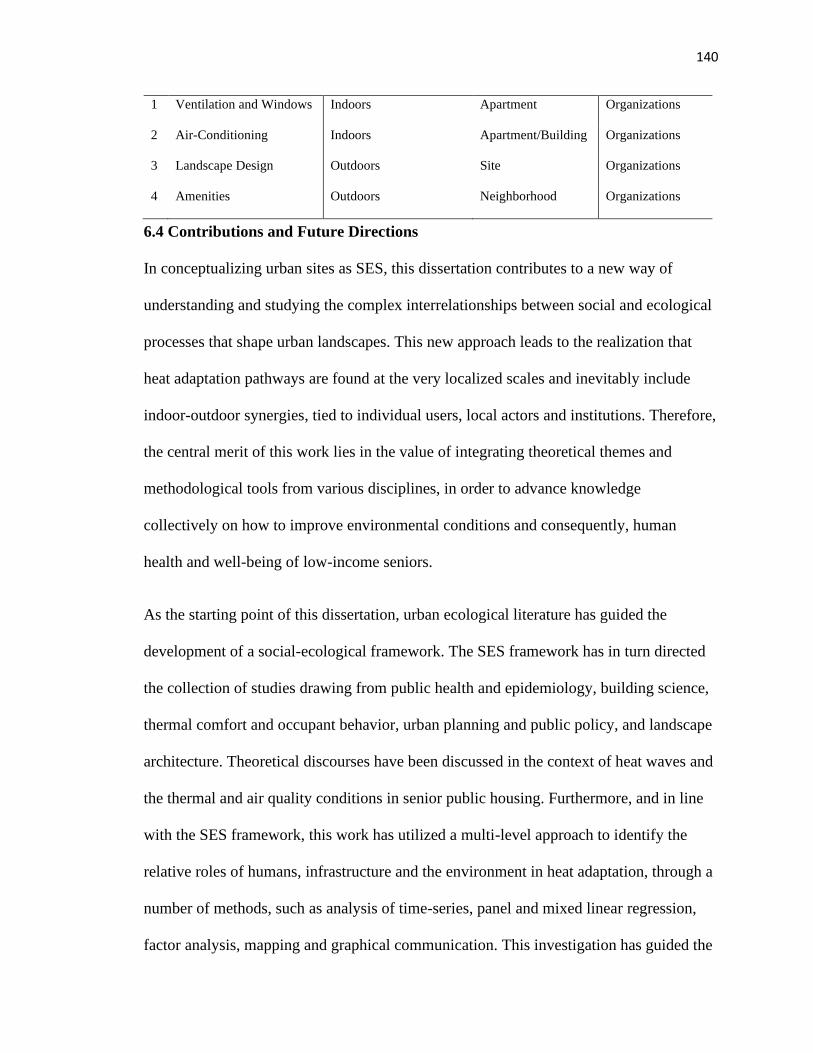
140
1 Ventilation and Windows Indoors Apartment Organizations
2 Air-Conditioning Indoors Apartment/Building Organizations
3 Landscape Design Outdoors Site Organizations
4 Amenities Outdoors Neighborhood Organizations
6.4 Contributions and Future Directions
In conceptualizing urban sites as SES, this dissertation contributes to a new way of
understanding and studying the complex interrelationships between social and ecological
processes that shape urban landscapes. This new approach leads to the realization that
heat adaptation pathways are found at the very localized scales and inevitably include
indoor-outdoor synergies, tied to individual users, local actors and institutions. Therefore,
the central merit of this work lies in the value of integrating theoretical themes and
methodological tools from various disciplines, in order to advance knowledge
collectively on how to improve environmental conditions and consequently, human
health and well-being of low-income seniors.
As the starting point of this dissertation, urban ecological literature has guided the
development of a social-ecological framework. The SES framework has in turn directed
the collection of studies drawing from public health and epidemiology, building science,
thermal comfort and occupant behavior, urban planning and public policy, and landscape
architecture. Theoretical discourses have been discussed in the context of heat waves and
the thermal and air quality conditions in senior public housing. Furthermore, and in line
with the SES framework, this work has utilized a multi-level approach to identify the
relative roles of humans, infrastructure and the environment in heat adaptation, through a
number of methods, such as analysis of time-series, panel and mixed linear regression,
factor analysis, mapping and graphical communication. This investigation has guided the
141
bridging of human behavior within buildings to outside of buildings, which has been
further useful for policy communication. In attempting to take the SES framework one
step further, this thesis has lastly derived integrated strategies for heat adaptation of low-
income seniors, by translating modeling findings into policy outcomes.
The view of urban sites as SES has been well-established in this work through literature
and related empirical analysis, various aspects of which, may be extended to similar
urban settings beyond Elizabeth and NJ. There are several public housing projects
federally managed throughout the Northeast United States, who struggle with funding
and have similar resident profiles and building stock as in NJ; those could benefit directly
from this research project. Then, as the impacts of a warming climate accelerate
throughout the world, more and more urban communities seek for integrated strategies
linking indoor to outdoor scales; this is an area that could offer indirect benefits to those
communities and the central idea behind this research.
An investigation of additional applications from real urban settings with larger sample
sizes and exploring alternative data collection and modeling techniques can be proven
useful. First, additional sources of IEQ variations can be captured in larger samples,
which may be helpful in offering more concrete policy recommendations. Then,
collecting data from consumer-grade sensors inevitably presents several limitations, such
as resolution biases, despite calibration. In addition, behavioral sensors that are
stationary, only partly capture the range of human activities, especially as they relate to
indoor occupancy patterns, and outdoor visits and preferences. Additional uncertainty in
the study relates to the selection of criteria for assessing indoor overheating and pollution.
For both the HI and PM2.5, the study relied on thresholds from ASHRAE and the US

142
EPA respectively, which have relatively conservative standards compared to guidelines
from the OSHA and WHO, which recommend lower thresholds. Therefore, a suggestion
for future research is to assess the sensitivity of recommendations to selected thresholds.
Lastly, approaching the heat wave problem through a multi-level analysis is definitely
complicated, as it connects inherently different phenomena, each with its own logic and
dimensions. Regression analysis is practically useful, as it enables combining diverse
variables and showing direct effects of predictors on the dependent variable. However, it
is also a reductionist approach that does not capture the nested hierarchy among many
variables of interest. More empirical studies on heat waves in senior, low-income housing
can address these methodological challenges and offer new explorations to extend this
work.
143
APPENDIX A INTERVIEWS
Baseline Interview Protocol
DATE__ Interviewer___ CODE__
Baseline survey: Subjects will participate in 1 60-minute session during which a baseline
questionnaire will be administered in-person and during which time air quality sensors
and power meters will be installed in the apartment by other members of the research
team. The function of this equipment will be explained to the subject also during this
time.
1/ Use of apartment/occupancy
The next few questions ask about how the apartment is used.
1.1 When did you first move to this apartment?
Please fill approximate month and year: __ __/__ __
1.2 How many people including yourself live or stay in your apartment on a
regular basis (more than 2-3 days/week, including family, roommates)?
Starting from the youngest, can you tell us their ages, gender, and an identifying name
(for future reference-we may ask about them again later on)?
Person Age Gender (M/F) Identifier
(1stt or middle name)
Interviewee
Person 2
144
Person 3
Person 4
Person 5
Person 6
1.3 On an average weekday, your apartment is unoccupied (no one at home)…
1. <1 hour/day
2. 1-3 hours/day
3. 3-6 hours/day
4. 6-12 hours/day
5. >12 hours/day
1.4 On an average Saturday or Sunday your apartment is unoccupied (no one at
home)…
1. <1 hour/day
2. 1-3 hours/day
3. 3-6 hours/day
4. 6-12 hours/day
5. >12 hours/day
1.5 Approximately how many weeks in the past year was this apartment unoccupied
(no one was there including sleeping somewhere else)?
1. 0-2
2. 3-5
3. 4-6
145
4. 7-9
5. >9
2.A/ Environmental Conditions/Comfort
The next few questions are about how comfortable the conditions are in the apartment
during the typically warmer months (May-October).
2.A.1 How frequently do you feel uncomfortably warm in the apartment?
1. Never
2. Rarely (1-3 days/month)
3. Sometimes (1 day/week)
4. Often (>1 days/week)
5. Daily
2.A.2 How frequently do you feel uncomfortably cold in the apartment?
1. Never
2. Rarely (1-3 days/month)
3. Sometimes (1 day/week)
4. Often (>1 days/week)
5. Daily
2.A.3 How frequently do you experience air drafts in the apartment?
1. Never
2. Rarely (1-3 days/month)
3. Sometimes (1 day/week)
4. Often (>1 days/week)
5. Daily
146
2.A.4 How frequently do you experience stuffiness in the apartment?
1. Never
2. Rarely (1-3 days/month)
3. Sometimes (1 day/week)
4. Often (>1 days/week)
5. Daily
2.A.5 How frequently do you experience extreme humidity in the apartment?
1. Never
2. Rarely (1-3 days/month)
3. Sometimes (1 day/week)
4. Often (>1 days/week)
5. Daily
2.A.6 How frequently do you experience extreme dryness in the apartment?
1. Never
2. Rarely (1-3 days/month)
3. Sometimes (1day/week)
4. Often (>1 days/week)
5. Daily
2.A.7 How you would rate the overall air quality in the apartment?
1. Extremely bad
2. Somewhat bad
3. Neither bad nor good
4. Somewhat good
147
5. Extremely good
2.A.8 Have you ever experienced any bad odors in the apartment (e.g. chemical or
garbage smells from hallway?
1. Yes
2. No
9. Don’t know/refuse
2.A.8.a If yes, how often?
1. Never
2. Rarely (1-3 days/month)
3. Sometimes (1day/week)
4. Often (>1 days/week)
5. Daily
2.A.9 Have you ever noticed any mold in the apartment?
1. Yes
2. No
9. Don’t know/refuse
2.A.9.a If yes, how often?
1. Never
2. Rarely (1-3 days/month)
3. Sometimes (1day/week)
4. Often (>1 days/week)
5. Daily
___In what circumstances? ______________________________________
148
2.A.10 Have you ever noticed rodents, cockroaches or other insects in the
apartment?
1. Yes
2. No
9. Don’t know/refuse
2.A.10.a If yes, how often?
1. Never
2. Rarely (1-3 days/month)
3. Sometimes (1day/week)
4. Often (>1 days/week)
5. Daily
___In what circumstances? ______________________________________
2.A.11 How would you rate the temperature of the hallway compared to the
temperature in the apartment?
1. Much colder
2. Somewhat colder
3. Neutral (no noticeable difference)
4. Somewhat warmer
5. Much warmer
2.A.12 On a scale of 1-7 on the hottest day of the year, what are the conditions in
your apartment? (1=completely comfortable; 7= completely unbearable)
• 1
• 2
149
• 3
• 4
• 5
• 6
• 7
2.A.13 How do you find air quality outside between May-October?
1. Very polluted
2. Somewhat polluted
3. Neutral (not particularly polluted or clean)
4. Somewhat clean
5. Very clean
2.A.13.a Does it vary by season? If yes, how?
1. Yes
2. No
9. Don’t know/refuse
If yes: ___________________________________________
2.A.14 Is your breathing different when you are outside?
1. Made better
2. Made worse
3. Made neither better or worse
9. Don’t know/refuse
2.A.15 How often are you outside between May-October (hours/per day)?
1. 1-2 hours
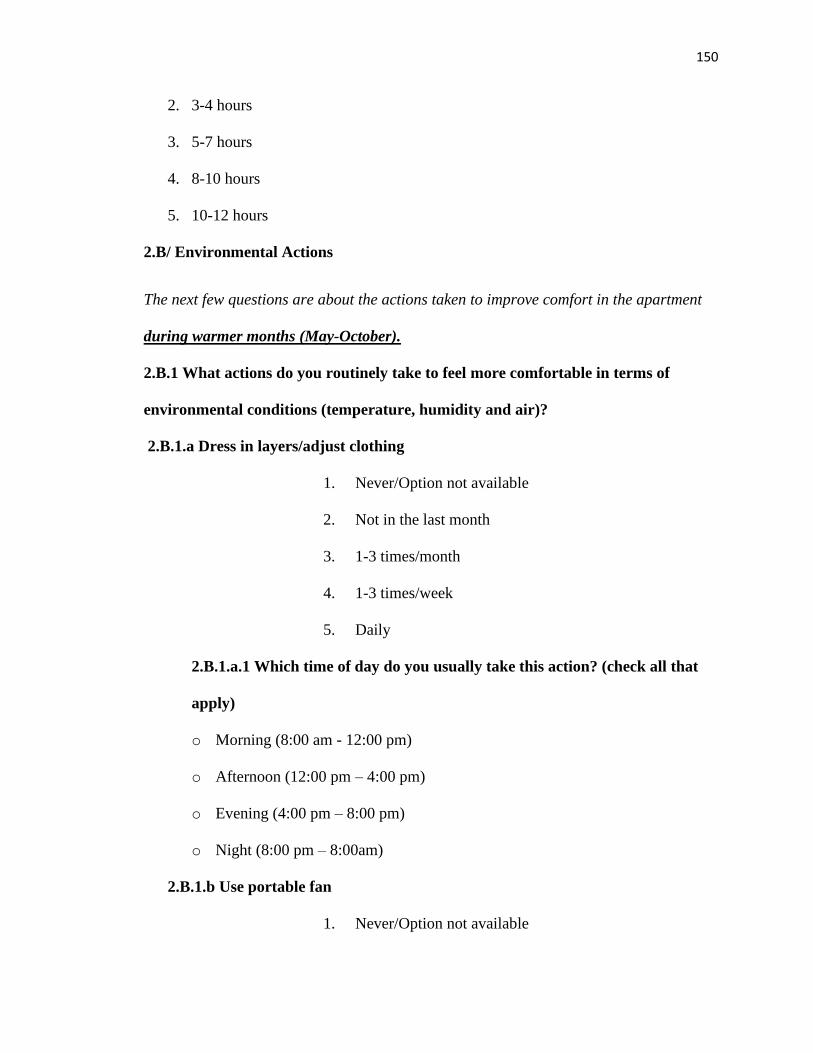
150
2. 3-4 hours
3. 5-7 hours
4. 8-10 hours
5. 10-12 hours
2.B/ Environmental Actions
The next few questions are about the actions taken to improve comfort in the apartment
during warmer months (May-October).
2.B.1 What actions do you routinely take to feel more comfortable in terms of
environmental conditions (temperature, humidity and air)?
2.B.1.a Dress in layers/adjust clothing
1. Never/Option not available
2. Not in the last month
3. 1-3 times/month
4. 1-3 times/week
5. Daily
2.B.1.a.1 Which time of day do you usually take this action? (check all that
apply)
o Morning (8:00 am - 12:00 pm)
o Afternoon (12:00 pm – 4:00 pm)
o Evening (4:00 pm – 8:00 pm)
o Night (8:00 pm – 8:00am)
2.B.1.b Use portable fan
1. Never/Option not available
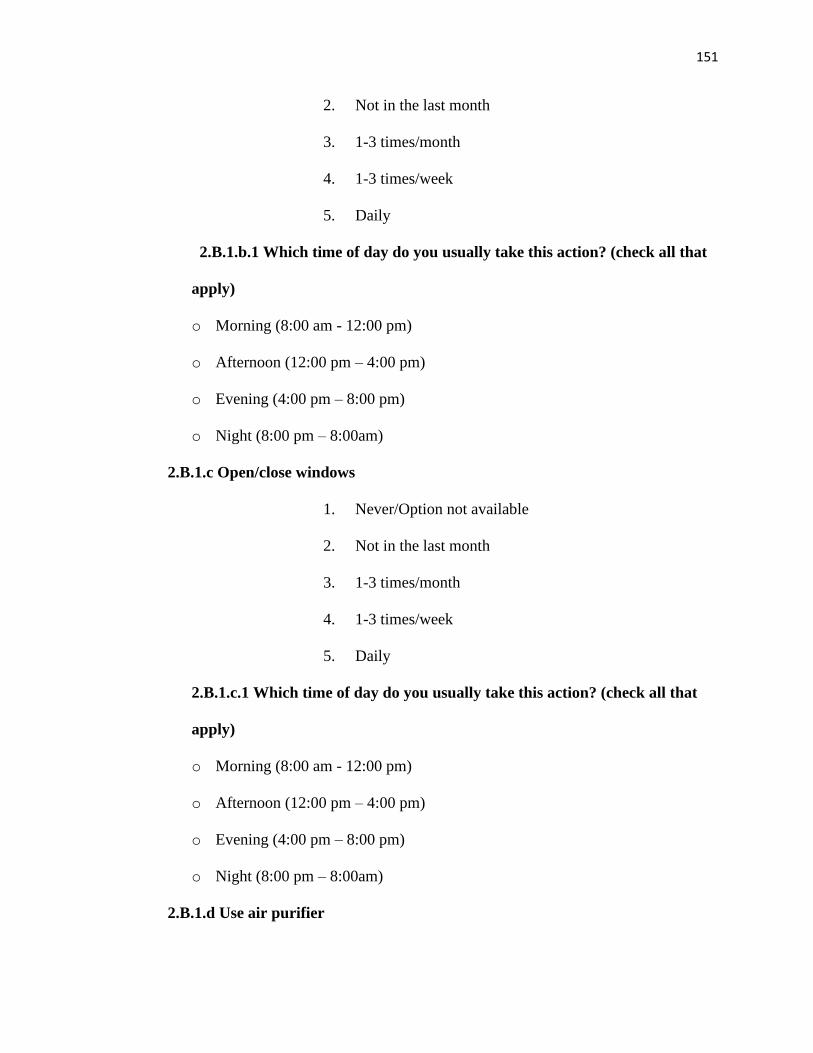
151
2. Not in the last month
3. 1-3 times/month
4. 1-3 times/week
5. Daily
2.B.1.b.1 Which time of day do you usually take this action? (check all that
apply)
o Morning (8:00 am - 12:00 pm)
o Afternoon (12:00 pm – 4:00 pm)
o Evening (4:00 pm – 8:00 pm)
o Night (8:00 pm – 8:00am)
2.B.1.c Open/close windows
1. Never/Option not available
2. Not in the last month
3. 1-3 times/month
4. 1-3 times/week
5. Daily
2.B.1.c.1 Which time of day do you usually take this action? (check all that
apply)
o Morning (8:00 am - 12:00 pm)
o Afternoon (12:00 pm – 4:00 pm)
o Evening (4:00 pm – 8:00 pm)
o Night (8:00 pm – 8:00am)
2.B.1.d Use air purifier
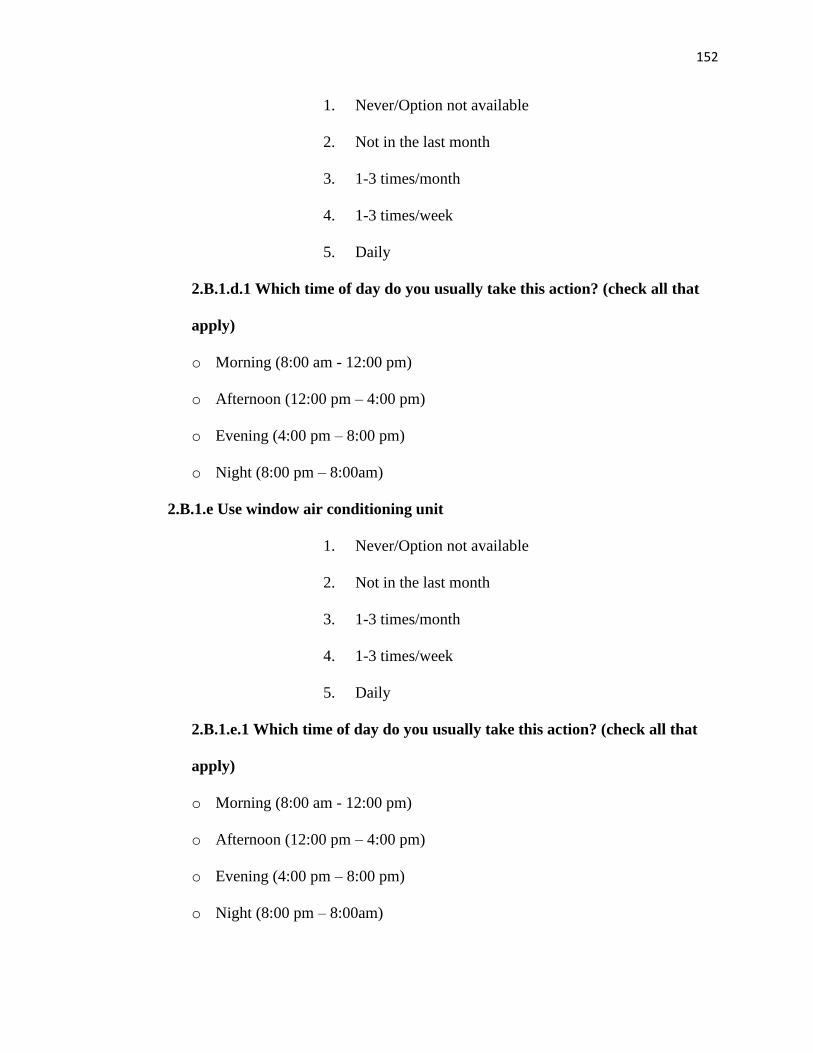
152
1. Never/Option not available
2. Not in the last month
3. 1-3 times/month
4. 1-3 times/week
5. Daily
2.B.1.d.1 Which time of day do you usually take this action? (check all that
apply)
o Morning (8:00 am - 12:00 pm)
o Afternoon (12:00 pm – 4:00 pm)
o Evening (4:00 pm – 8:00 pm)
o Night (8:00 pm – 8:00am)
2.B.1.e Use window air conditioning unit
1. Never/Option not available
2. Not in the last month
3. 1-3 times/month
4. 1-3 times/week
5. Daily
2.B.1.e.1 Which time of day do you usually take this action? (check all that
apply)
o Morning (8:00 am - 12:00 pm)
o Afternoon (12:00 pm – 4:00 pm)
o Evening (4:00 pm – 8:00 pm)
o Night (8:00 pm – 8:00am)
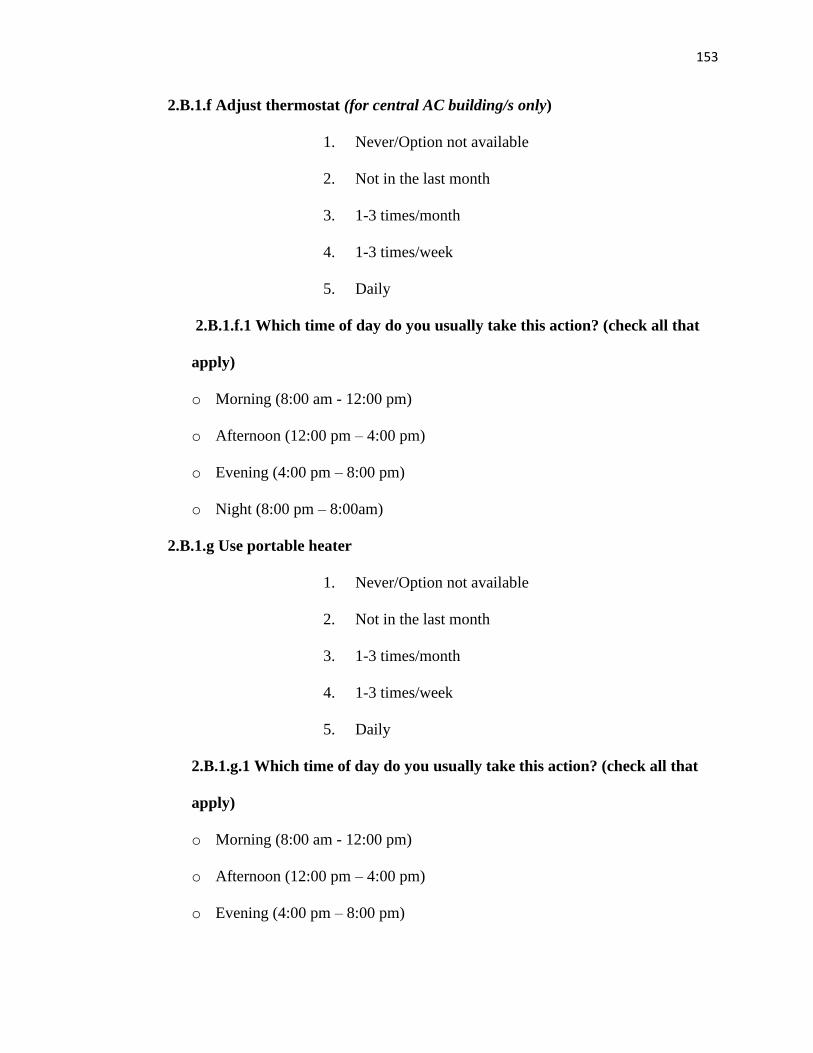
153
2.B.1.f Adjust thermostat (for central AC building/s only)
1. Never/Option not available
2. Not in the last month
3. 1-3 times/month
4. 1-3 times/week
5. Daily
2.B.1.f.1 Which time of day do you usually take this action? (check all that
apply)
o Morning (8:00 am - 12:00 pm)
o Afternoon (12:00 pm – 4:00 pm)
o Evening (4:00 pm – 8:00 pm)
o Night (8:00 pm – 8:00am)
2.B.1.g Use portable heater
1. Never/Option not available
2. Not in the last month
3. 1-3 times/month
4. 1-3 times/week
5. Daily
2.B.1.g.1 Which time of day do you usually take this action? (check all that
apply)
o Morning (8:00 am - 12:00 pm)
o Afternoon (12:00 pm – 4:00 pm)
o Evening (4:00 pm – 8:00 pm)
154
o Night (8:00 pm – 8:00am)
2.B.1.h Use dehumidifier
1. Never/Option not available
2. Not in the last month
3. 1-3 times/month
4. 1-3 times/week
5. Daily
2.B.1.h.1 Which time of day do you usually take this action? (check all that
apply)
o Morning (8:00 am - 12:00 pm)
o Afternoon (12:00 pm – 4:00 pm)
o Evening (4:00 pm – 8:00 pm)
o Night (8:00 pm – 8:00am)
2.B.1.i Notify landlord/supervisor
1. Never/Option not available
2. Not in the last month
3. 1-3 times/month
4. 1-3 times/week
5. Daily
2.B.1.i.1 Which time of day do you usually take this action? (check all that
apply)
o Morning (8:00 am - 12:00 pm)
o Afternoon (12:00 pm – 4:00 pm)
155
o Evening (4:00 pm – 8:00 pm)
o Night (8:00 pm – 8:00am)
2.B.2 Does anyone ever smoke in the apartment (cigarette, cigar, or pipe)?
1. Yes
2. No
9. Don’t know/refuse
2.B.2.a If yes, how often is there someone in the apartment smoking?
1. Never
2. Rarely (1-3 days/month)
3. Sometimes (1day/week)
4. Often (>1 days/week)
5. Daily
2.B.3 Do you use candles, air fresheners, or incense?
1. Yes
2. No
9. Don’t know/refuse
2.B.3.a If yes, how often are any of these used?
1. Never
2. Rarely (1-3 days/month)
3. Sometimes (1day/week)
4. Often (>1 days/week)
5. Daily
2.B.4 Does anyone in the apartment have any pets?
156
1. Yes
2. No
9. Don’t know/refuse
2.B.5 How do you clean carpets in the apartment (if any)?
1. Vacuum cleaner
2. Broom
3. Washing machine
4. Other. Please specify: ______
9. Don’t know/refuse
2.B.6 How do you clean the floors that have hard surfaces-no carpets in the
apartment (if any)?
1. Vacuum cleaner
2. Broom
3. Mop
4. Dusters or dusting wipes, such as Swiffer
5. Other. Please specify: _________________________________________
9. Don’t know/refuse
2.B.7 What cleaning products do you use for kitchen, bathrooms, floors (these can
be liquids or powders)?
3/ Response to Heat Waves-Electricity Use
The next few questions ask about the electricity use in the apartment and the specific
actions taken during heat waves that is extended periods of excessively hot weather,
which may be accompanied by high humidity from May to October.
157
3.1 How many times have you experienced extreme heat waves while living in this
apartment?
1. 0-2
2. 3-5
3. 6-8
4. >8
3.2 What actions would/do you take during heat waves to feel more comfortable
(check all that apply)?
3.2.a Use adjustable fan
1. Yes
2. No
9. Don’t know/refuse
3.2.a.1 If yes, which time of day do you usually take this action? (check all
that apply)
o Morning (8:00 am - 12:00 pm)
o Afternoon (12:00 pm – 4:00 pm)
o Evening (4:00 pm – 8:00 pm)
o Night (8:00 pm – 8:00am)
3.2.b Use window air conditioning unit
1. Yes
2. No
9. Don’t know/refuse
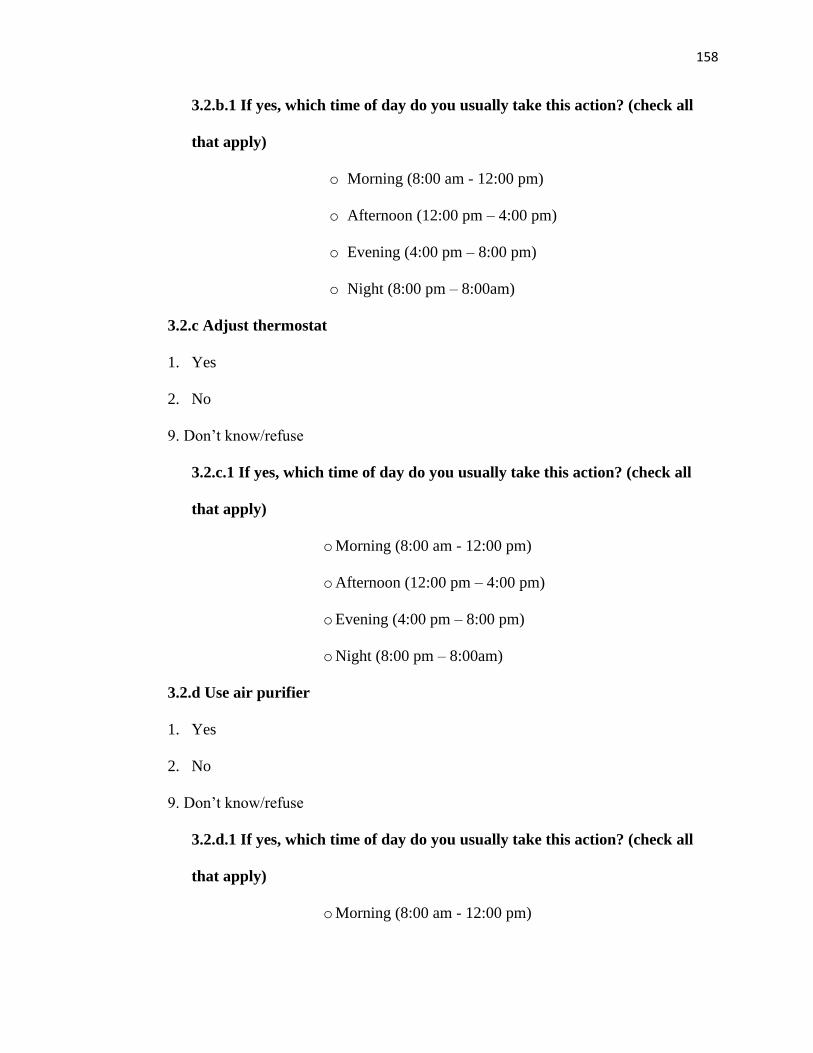
158
3.2.b.1 If yes, which time of day do you usually take this action? (check all
that apply)
o Morning (8:00 am - 12:00 pm)
o Afternoon (12:00 pm – 4:00 pm)
o Evening (4:00 pm – 8:00 pm)
o Night (8:00 pm – 8:00am)
3.2.c Adjust thermostat
1. Yes
2. No
9. Don’t know/refuse
3.2.c.1 If yes, which time of day do you usually take this action? (check all
that apply)
o Morning (8:00 am - 12:00 pm)
o Afternoon (12:00 pm – 4:00 pm)
o Evening (4:00 pm – 8:00 pm)
o Night (8:00 pm – 8:00am)
3.2.d Use air purifier
1. Yes
2. No
9. Don’t know/refuse
3.2.d.1 If yes, which time of day do you usually take this action? (check all
that apply)
o Morning (8:00 am - 12:00 pm)
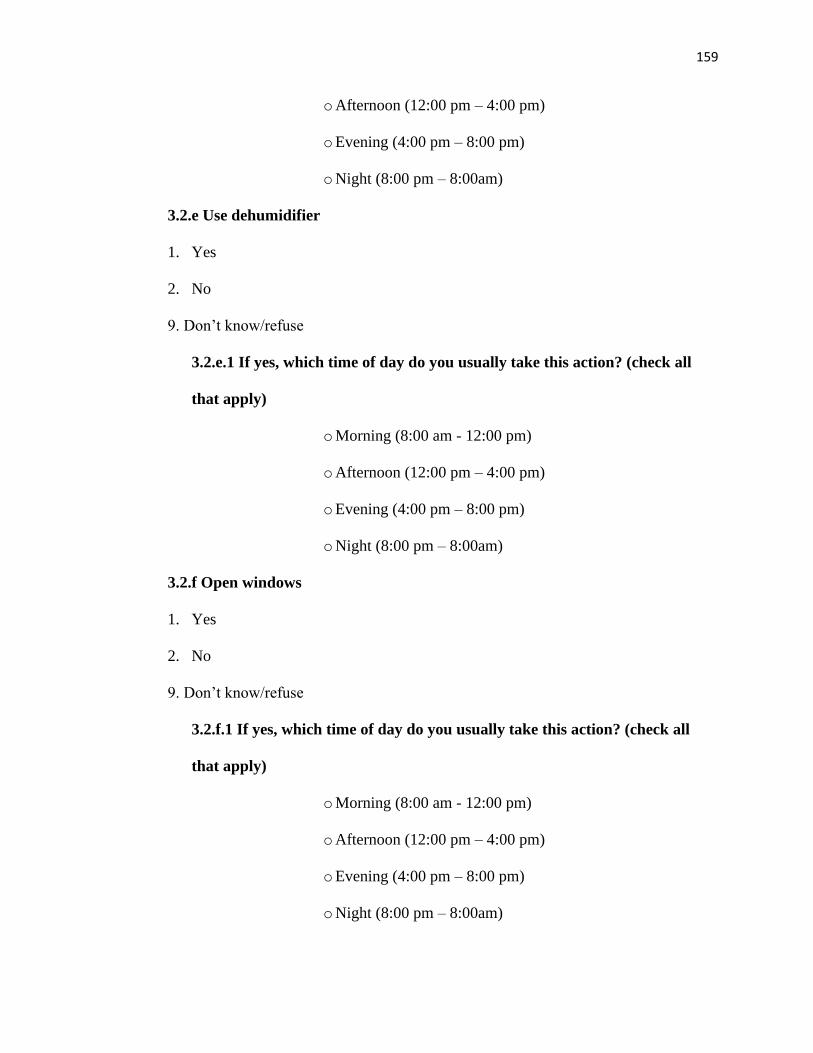
159
o Afternoon (12:00 pm – 4:00 pm)
o Evening (4:00 pm – 8:00 pm)
o Night (8:00 pm – 8:00am)
3.2.e Use dehumidifier
1. Yes
2. No
9. Don’t know/refuse
3.2.e.1 If yes, which time of day do you usually take this action? (check all
that apply)
o Morning (8:00 am - 12:00 pm)
o Afternoon (12:00 pm – 4:00 pm)
o Evening (4:00 pm – 8:00 pm)
o Night (8:00 pm – 8:00am)
3.2.f Open windows
1. Yes
2. No
9. Don’t know/refuse
3.2.f.1 If yes, which time of day do you usually take this action? (check all
that apply)
o Morning (8:00 am - 12:00 pm)
o Afternoon (12:00 pm – 4:00 pm)
o Evening (4:00 pm – 8:00 pm)
o Night (8:00 pm – 8:00am)
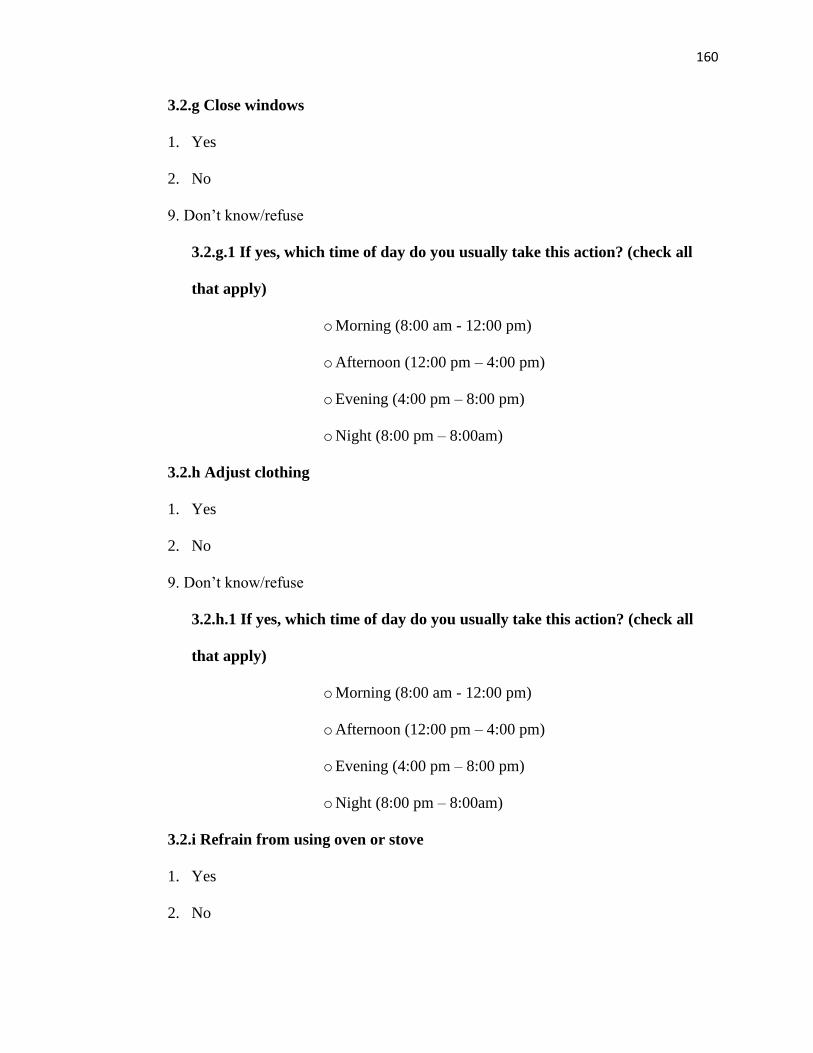
160
3.2.g Close windows
1. Yes
2. No
9. Don’t know/refuse
3.2.g.1 If yes, which time of day do you usually take this action? (check all
that apply)
o Morning (8:00 am - 12:00 pm)
o Afternoon (12:00 pm – 4:00 pm)
o Evening (4:00 pm – 8:00 pm)
o Night (8:00 pm – 8:00am)
3.2.h Adjust clothing
1. Yes
2. No
9. Don’t know/refuse
3.2.h.1 If yes, which time of day do you usually take this action? (check all
that apply)
o Morning (8:00 am - 12:00 pm)
o Afternoon (12:00 pm – 4:00 pm)
o Evening (4:00 pm – 8:00 pm)
o Night (8:00 pm – 8:00am)
3.2.i Refrain from using oven or stove
1. Yes
2. No
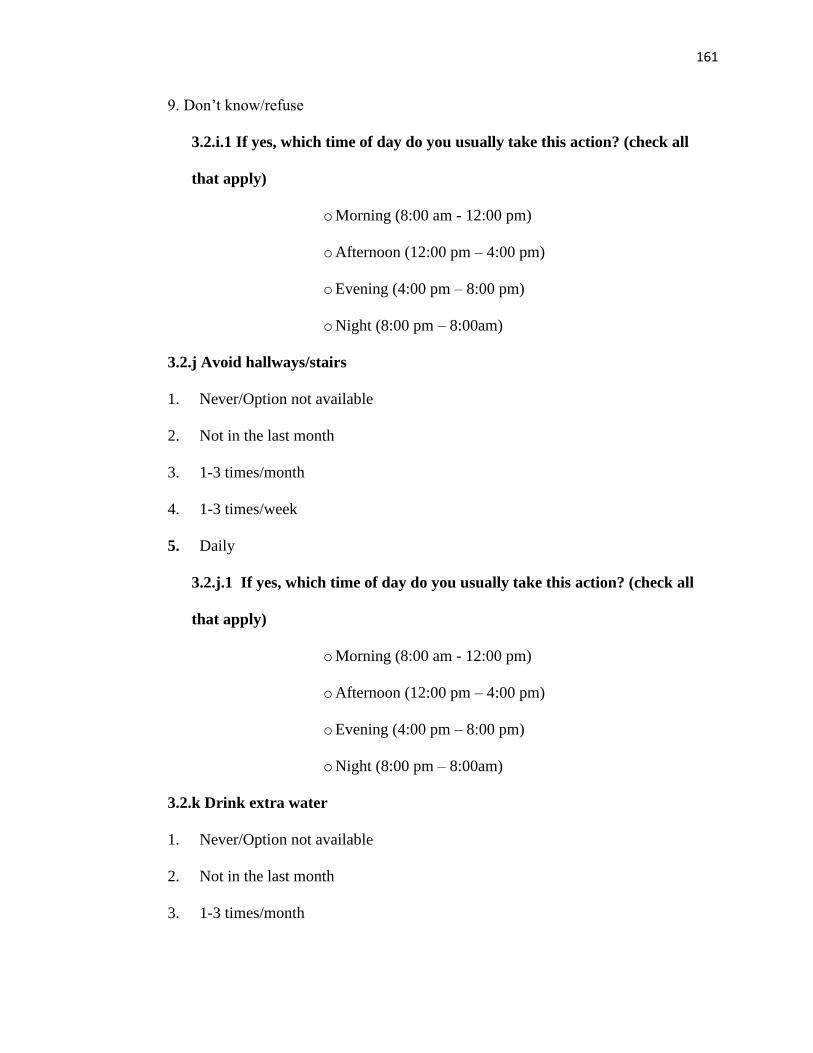
161
9. Don’t know/refuse
3.2.i.1 If yes, which time of day do you usually take this action? (check all
that apply)
o Morning (8:00 am - 12:00 pm)
o Afternoon (12:00 pm – 4:00 pm)
o Evening (4:00 pm – 8:00 pm)
o Night (8:00 pm – 8:00am)
3.2.j Avoid hallways/stairs
1. Never/Option not available
2. Not in the last month
3. 1-3 times/month
4. 1-3 times/week
5. Daily
3.2.j.1 If yes, which time of day do you usually take this action? (check all
that apply)
o Morning (8:00 am - 12:00 pm)
o Afternoon (12:00 pm – 4:00 pm)
o Evening (4:00 pm – 8:00 pm)
o Night (8:00 pm – 8:00am)
3.2.k Drink extra water
1. Never/Option not available
2. Not in the last month
3. 1-3 times/month
162
4. 1-3 times/week
5. Daily
3.2.k.1 Which time of day do you usually take this action? (check all that
apply)
o Morning (8:00 am - 12:00 pm)
o Afternoon (12:00 pm – 4:00 pm)
o Evening (4:00 pm – 8:00 pm)
o Night (8:00 pm – 8:00am)
3.2.l If you leave your apartment in search of a cooler place, where do you go?
(Check all that apply, and apply the following question to each affirmative action.
Then have respondent indicate locations on a map.)
1. Cooling center
2. Sit in the shade (where?)
3. Movie theatre
4. Shopping mall
5. Visit relative or friend
6. Library
7. Community center
8. Public pool
9. Other: please describe
3.2.l.1 If yes, which time of day do you usually take this action? (check all
that apply)
o Morning (8:00 am - 12:00 pm)
163
o Afternoon (12:00 pm – 4:00 pm)
o Evening (4:00 pm – 8:00 pm)
o Night (8:00 pm – 8:00am)
3.3 Are there any places you would prefer to go to cool down, but you cannot get
there?
1. Yes
2. No
9. Don’t know/refuse
3.3.a What prevents you from accessing these cooler destinations? (e.g., physical
constraints, lack of affordable transportation, other)
_____________________________________________________________________
___
3.4 What other actions do you take to make yourself feel more comfortable when
room temperatures are not desirable?
________________________________________________________________________
___
________________________________________________________________________
___
3.4.a Which time of day do you usually take this action? (check all that apply)
o Morning (8:00 am - 12:00 pm)
o Afternoon (12:00 pm – 4:00 pm)
o Evening (4:00 pm – 8:00 pm)
164
o Night (8:00 pm – 8:00am)
3.5 Have you experienced a power outage during a period of extreme heat?
1. Yes
2. No
9. Don’t know/refuse
3.5.1 If yes, how did you cope?
________________________________________________________________________
_
________________________________________________________________________
_
3.6 Do you participate in any programs that assist you with paying your utility bills?
1. Yes
2. No
9. Don’t know/refuse
4/ Demographics and Health
The next few questions are about some basic demographics and health.
4.1 What is your age?
1. 55-64
2. 65-74
3. 75-84
4. 85+
(check Census & PH categories)
4.2 What is your gender?
165
1. Female
2. Male
4.3 What is your educational level?
1. Elementary school
2. Secondary school
3. High school
4. Bachelor’s degree
5. Graduate degree
4.4 What was the total household income for the past year (in $)?
1. < 10,000
2. 10,000-19,999
3. 20,000-39,999
4. 40,000-49,999
5. =>50,000
4.5 In general, how would you characterize your health?
1. Very poor
2. Somewhat poor
3. Poor
4. Fair
5. Good
6. Somewhat good
7. Very good
9. Don’t know/refuse
166
4.5.1 What about other household members and their overall health?
1. Very poor
2. Somewhat poor
3. Poor
4. Fair
5. Good
6. Somewhat good
7. Very good
9. Don’t know/refuse
4.6 Do you have a chronic medical condition that is exasperated by heat? (asthma,
diabetes, COPD, emphysema, hypertension, etc.)
1. Yes
2. No
9. Don’t know/refuse
4.7 Does anybody else in this household have a pulmonary or cardiovascular disease
that is exasperated by heat?
1. Yes
2. No
9. Don’t know/refuse
4.8 Have you ever sought out medical care because of the heat?
1. Yes
2. No
9. Don’t know/ refuse
167
4.9 Do you have any relatives or friends nearby that you can call when in need?
1. Yes
2. No
9. Don’t know/refuse
4.9.1 In general, how often do you see your friends/relatives?
1. Never
2. Rarely (1-3 days/month)
3. Sometimes (1day/week)
4. Often (>1 days/week)
5. Daily
4.10 Do you participate regularly in any community groups, religious groups, clubs,
or other social groups?
1. Yes
2. No
9. Don’t know/refuse
4.10.1 How often do you participate in these groups or clubs?
1. Never
2. Rarely (1-3 days/month)
3. Sometimes (1day/week)
4. Often (>1 days/week)
5. Daily
4.11 How often do you interact with your neighbors (in person, by phone, other)?
1. Never
168
2. Rarely (1-3 days/month)
3. Sometimes (1day/week)
4. Often (>1 days/week)
5. Daily
5/ Catch All
5.1 Is there anything else you would like to add?
________________________________________________________________________
______
________________________________________________________________________
______
Follow-up Interview Protocol
DATE__ Interviewer___ CODE__
Brief follow-up interviews: Subjects will be engaged in brief follow-up interviews on
days when heat wave advisories are in effect. These interviews most likely will be
conducted by phone but it is possible that they will be conducted in person if
circumstances permit (e.g., they are home and willing to meet us in person and if we can
get there in a timely fashion to meet with multiple participants on the same day). The
number of these interviews will depend on incidence of heat wave advisories and success
rate in reaching the participant by phone or in person. Each brief follow-up interview
will last approximately 10 minutes.
1/ Response to Heat Waves-Electricity Use
169
The next few questions ask about the electricity use in the apartment and the specific
actions taken during heat waves that is extended periods of excessively hot weather,
which may be accompanied by high humidity from May to October.
1.1 What actions did/do you take during the heat wave to feel more comfortable
while in the apartment (check all that apply)?
1.1.a Use adjustable fan
1. Yes
2. No
9. Don’t know/refuse
1.1.a.1 If yes, which time of day did/do you take this action? (check all that
apply)
o Morning (8:00 am - 12:00 pm)
o Afternoon (12:00 pm – 4:00 pm)
o Evening (4:00 pm – 8:00 pm)
o Night (8:00 pm – 8:00am)
1.1.b Use window air conditioning unit
1. Yes
2. No
9. Don’t know/refuse
1.1.b.1 If yes, which time of day did/do you take this action? (check all that
apply)
o Morning (8:00 am - 12:00 pm)
o Afternoon (12:00 pm – 4:00 pm)
170
o Evening (4:00 pm – 8:00 pm)
o Night (8:00 pm – 8:00am)
1.1.c Adjust thermostat
1. Yes
2. No
9. Don’t know/refuse
1.1.c.1 If yes, which time of day did/do you take this action? (check all that
apply)
o Morning (8:00 am - 12:00 pm)
o Afternoon (12:00 pm – 4:00 pm)
o Evening (4:00 pm – 8:00 pm)
o Night (8:00 pm – 8:00am)
1.1.d Use air purifier
1. Yes
2. No
9. Don’t know/refuse
1.1.d.1 If yes, which time of day did/do you take this action? (check all
that apply)
o Morning (8:00 am - 12:00 pm)
o Afternoon (12:00 pm – 4:00 pm)
o Evening (4:00 pm – 8:00 pm)
o Night (8:00 pm – 8:00am)
1.1.e Use dehumidifier
171
1. Yes
2. No
9. Don’t know/refuse
1.1.e.1 If yes, which time of day did/do you take this action? (check all
that apply)
o Morning (8:00 am - 12:00 pm)
o Afternoon (12:00 pm – 4:00 pm)
o Evening (4:00 pm – 8:00 pm)
o Night (8:00 pm – 8:00am)
1.1.f Open windows
1. Yes
2. No
9. Don’t know/refuse
1.1.f.1 If yes, which time of day did/do you take this action? (check all
that apply)
o Morning (8:00 am - 12:00 pm)
o Afternoon (12:00 pm – 4:00 pm)
o Evening (4:00 pm – 8:00 pm)
o Night (8:00 pm – 8:00am)
1.1.g Close windows
1. Yes
2. No
9. Don’t know/refuse
172
1.1.g.1 If yes, which time of day did/do you take this action? (check all that
apply)
o Morning (8:00 am - 12:00 pm)
o Afternoon (12:00 pm – 4:00 pm)
o Evening (4:00 pm – 8:00 pm)
o Night (8:00 pm – 8:00am)
1.1.h Adjust clothing
1. Yes
2. No
9. Don’t know/refuse
1.1.h.1 If yes, which time of day did/do you take this action? (check all that
apply)
o Morning (8:00 am - 12:00 pm)
o Afternoon (12:00 pm – 4:00 pm)
o Evening (4:00 pm – 8:00 pm)
o Night (8:00 pm – 8:00am)
1.1.i Refrain from using oven
1. Yes
2. No
9. Don’t know/refuse
1.1.i.1 If yes, which time of day did/do you take this action? (check all that
apply)
o Morning (8:00 am - 12:00 pm)
173
o Afternoon (12:00 pm – 4:00 pm)
o Evening (4:00 pm – 8:00 pm)
o Night (8:00 pm – 8:00am)
1.1.j Refrain from using stove
1. Yes
2. No
9. Don’t know/refuse
1.1.j.1 If yes, which time of day did/do you take this action? (check all that
apply)
o Morning (8:00 am - 12:00 pm)
o Afternoon (12:00 pm – 4:00 pm)
o Evening (4:00 pm – 8:00 pm)
o Night (8:00 pm – 8:00am)
1.1.k. Refrain from burning candles or incense?
1. Yes
2. No
9. Don’t know/refuse
1.1.k.1 If yes, which time of day did/do you take this action? (check all that
apply)
o Morning (8:00 am - 12:00 pm)
o Afternoon (12:00 pm – 4:00 pm)
o Evening (4:00 pm – 8:00 pm)
o Night (8:00 pm – 8:00am)
174
1.1.l Refrain from smoking inside
1. Yes
2. No non smoker
9. Don’t know/refuse
1.1.l.1 If yes, which time of day did/do you take this action? (check all that
apply)
o Morning (8:00 am - 12:00 pm)
o Afternoon (12:00 pm – 4:00 pm)
o Evening (4:00 pm – 8:00 pm)
o Night (8:00 pm – 8:00am)
1.2. Did you leave your apartment during the heat wave?
1. Yes
2. No
9. Don’t know/refuse
1.2.a If yes, where did you go?____________________________
1.3 Did you leave your apartment specifically in search for a cooler place?
1. Yes
2. No
9. Don’t know/refuse
1.3.a If yes, where did/do you go? (Check all that apply, and apply the following
question to each affirmative action. Also, indicate relevant locations on the
provided map.)
1. Cooling center
175
2. Sit in the shade
3. Movie theatre
4. Shopping mall
5. Visit relative or friend
6. Library
7. Community center
8. Swimming pool
9. Other: please describe
1.3.b If yes, which time of day did/do you take this action? (check all that apply)
o Morning (8:00 am - 12:00 pm)
o Afternoon (12:00 pm – 4:00 pm)
o Evening (4:00 pm – 8:00 pm)
o Night (8:00 pm – 8:00am)
1.4 Are there any places you would prefer to go to cool down, but you
couldn’t/cannot get there?
1. Yes
2. No
9. Don’t know/refuse
1.5 What prevented/prevents you from accessing these cooler destinations? (e.g.,
physical constraints, lack of affordable transportation, other)
______________________________________________________________________
1.6 Did/do you experience a power outage during the period of extreme heat?
176
1. Yes
2. No
9. Don’t know/refuse
1.6.a If yes, how did/do you
cope?____________________________________________
_____________________________________________________________________
____
1.6.a.1 Called a friend, relative, neighbor or community organization for help
(circle all which apply)
1. Yes
2. No
9. Don’t know/refuse
1.6.a.1.a If yes, which time of day did/do you take this action? (check all
that apply)
o Morning (8:00 am - 12:00 pm)
o Afternoon (12:00 pm – 4:00 pm)
o Evening (4:00 pm – 8:00 pm)
o Night (8:00 pm – 8:00am)
1.6.a.2 Left the apartment
1. Yes
2. No
9. Don’t know/refuse
177
1.6.a.2.a If yes, which time of day did/do you take this action? (check all
that apply)
o Morning (8:00 am - 12:00 pm)
o Afternoon (12:00 pm – 4:00 pm)
o Evening (4:00 pm – 8:00 pm)
o Night (8:00 pm – 8:00am)
1.6.a.3 Other-Specify
what:______________________________________________
__________________________________________________________________
_____
1.6.a.3.a If yes, which time of day did/do you take this action? (check all
that apply)
o Morning (8:00 am - 12:00 pm)
o Afternoon (12:00 pm – 4:00 pm)
o Evening (4:00 pm – 8:00 pm)
o Night (8:00 pm – 8:00am)
2/ Health
The next few questions are about your health today.
2.1 How would you characterize your health today?
1. Very poor
2. Somewhat poor
3. Poor
4. Fair
178
5. Good
6. Somewhat good
7. Very good
9. Don’t know/refuse
2.1.1 What about other household members and their health today?
1. Very poor
3. Somewhat poor
4. Poor
5. Fair
6. Good
7. Somewhat good
8. Very good
9. Don’t know/refuse
2.2 Did the heat today affect any specific health conditions such as diabetes,
hypertension, asthma or any other cardiovascular or pulmonary disease?
1. Yes
2. No
9. Don’t know/refuse
3/ Catch All
3.1 Would you like to add anything?
Thank you for your time.
179
Closing-up Interview Protocol
DATE____________________ Interviewer________________
CODE__________
Brief closing-up interviews: Subjects will be engaged in one-time closing-up interviews
on the day equipment gets uninstalled from their apartment. These interviews most likely
will be conducted in person but it is possible that they will be conducted by phone if
circumstances do not permit (e.g., they are not willing to meet us in person). Each brief
closing-up interview will last approximately 10 minutes.
1. How would you compare the heat waves you experienced this summer (2017)
to previous summers’ heat waves while living here? (mainly in terms of
temperature)
_______________________________________________________________________
_______________________________________________________________________
_______________________________________________________________________
_______________________________________________________________________
2. Actions:
2a) What did you do differently during the heat waves of this summer compared to
in previous years?
● In terms of air conditioning use?
● In terms of window activity?
● In terms of fan use?
● Other?
_______________________________________________________________________
180
_______________________________________________________________________
2b) Did you take advantage of community cooling centers or other neighborhood
places more or less this summer than in previous ones? (e.g. church, grocery store,
movie theatre) [indicate in map]
_______________________________________________________________________
_______________________________________________________________________
2c) Did you go out to friends or relatives to escape the heat more / less this summer
than in previous ones?
_______________________________________________________________________
_______________________________________________________________________
3. Here, there will (or not) be a question based on data anomalies detected in
the sensors (mainly WEMO for apartments in M and F).
_______________________________________________________________________
_______________________________________________________________________
4. Devices:
4a) Did you notice a colored-light in one of the devices installed in your apartment?
(here show them the Air Visual-if respondent says yes, explain to them what it was
and what the color classification means)
1 = Yes
0 = No
9 = Don't know/refuse
_______________________________________________________________________
181
_______________________________________________________________________
4b) If yes,
Did you use the Air Visual to help you make decisions about closing or opening
windows, going outside? or other actions?
1 = Never
2 = Rarely (1-3 days/month)
3 = Sometimes (1day/week)
4 = Often (>1 days/week)
5 = Daily
_______________________________________________________________________
_______________________________________________________________________
5. In the next spring (spring 2018), we will have some results from our study
and we intend to visit the community and share them. Would you like to be
informed of the presentation date? If yes, how would you like to be contacted?
_______________________________________________________________________
_______________________________________________________________________
6. Would you like to add anything? Is there something we should have asked
you about heat waves but didn’t?
_______________________________________________________________________
_______________________________________________________________________
7. Would you like to comment on any other aspect of your experience with this
project?
e.g. better apartments, better outdoor areas, both of them? And if so, why?

182
______________________________________________________________________
______________________________________________________________________
Thank you for your time.
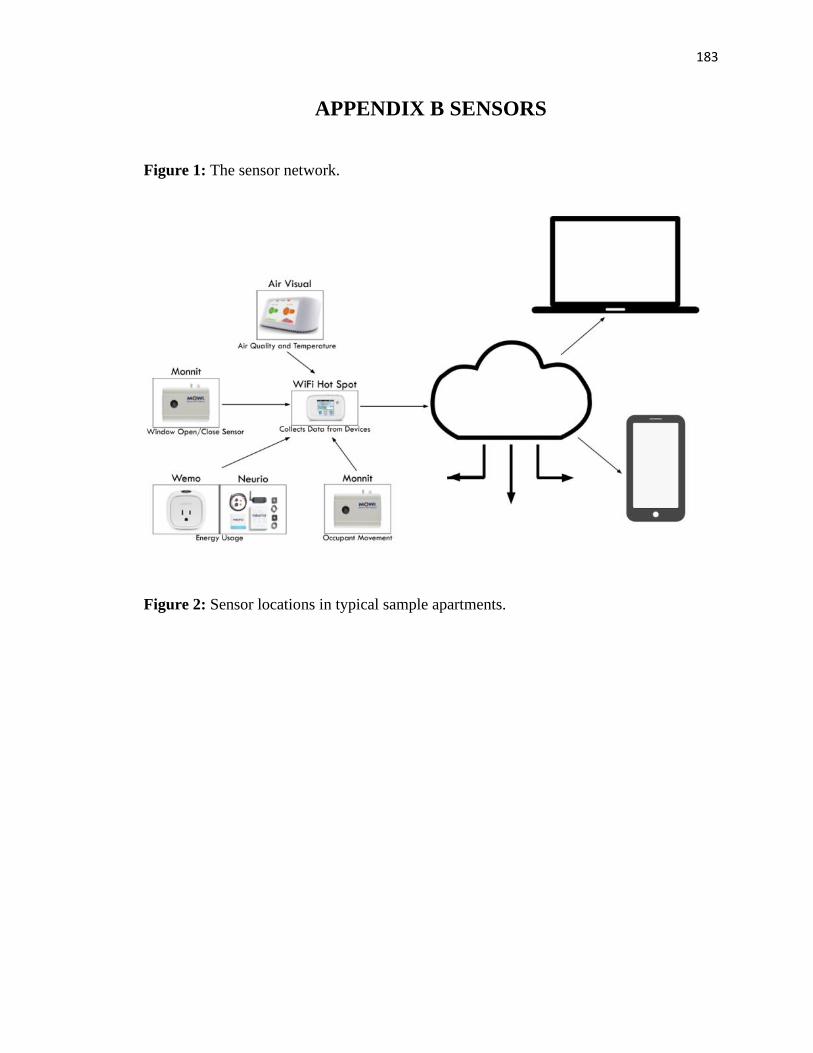
183
APPENDIX B SENSORS
Figure 1: The sensor network.
Figure 2: Sensor locations in typical sample apartments.
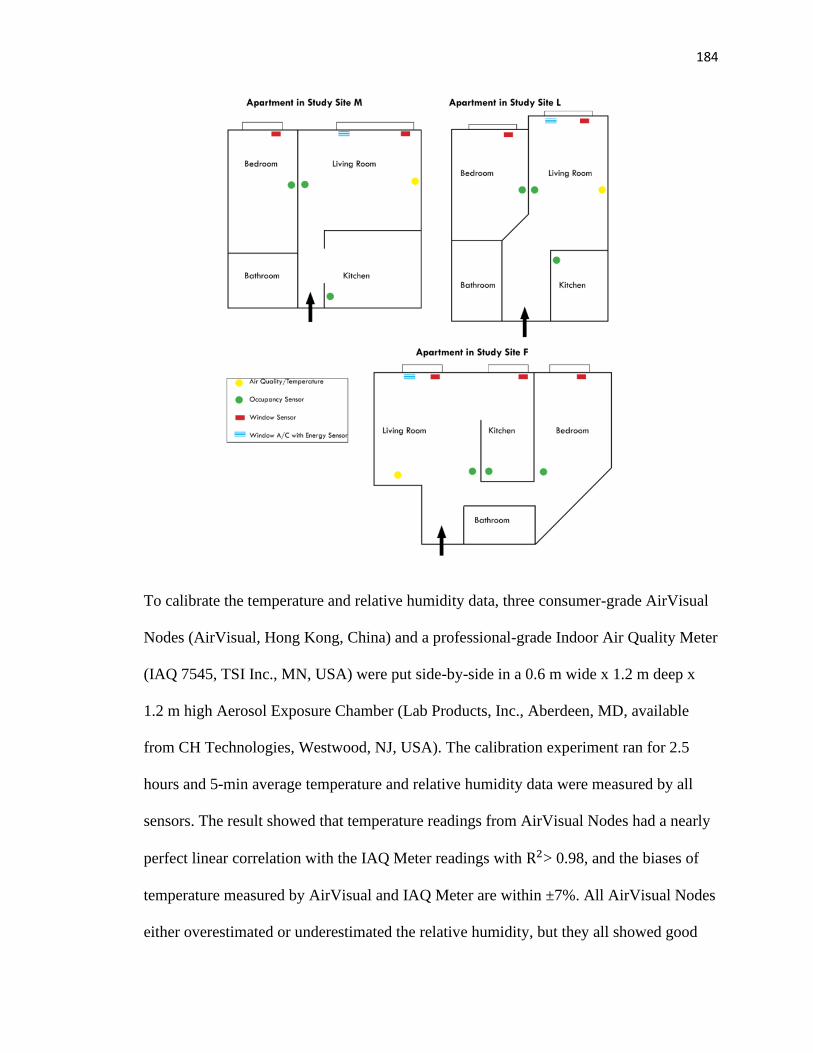
184
To calibrate the temperature and relative humidity data, three consumer-grade AirVisual
Nodes (AirVisual, Hong Kong, China) and a professional-grade Indoor Air Quality Meter
(IAQ 7545, TSI Inc., MN, USA) were put side-by-side in a 0.6 m wide x 1.2 m deep x
1.2 m high Aerosol Exposure Chamber (Lab Products, Inc., Aberdeen, MD, available
from CH Technologies, Westwood, NJ, USA). The calibration experiment ran for 2.5
hours and 5-min average temperature and relative humidity data were measured by all
sensors. The result showed that temperature readings from AirVisual Nodes had a nearly
perfect linear correlation with the IAQ Meter readings with R2> 0.98, and the biases of
temperature measured by AirVisual and IAQ Meter are within ±7%. All AirVisual Nodes
either overestimated or underestimated the relative humidity, but they all showed good
185
correlation with the IAQ Meter with R2 > 0.74, and the bias of the relative humidity by
AirVisual and IAQ Meter are within ±7%. More information can be found at: Ruikang
He, Daniel Bachman, Dominick J Carluccio, Rudolph Jaeger, Jie Zhang, Sanjeevi
Thirumurugesan, Clinton Andrews, and Gediminas Mainelis (2019). Evaluation of two
low-cost sensors under different laboratory and indoor conditions. Submitted to Aerosol
Science & Technology. Several calibration tests were also conducted for the occupancy,
window opening and A/C use data for two days (3 hours/day), where the Monnit
(Monnit, Midvale, Utah, USA), WEMO (Belkin International, Los Angeles, CA, USA)
and Neurio (Neurio Technology Inc., Vancouver, BC, Canada) devices were placed in an
empty apartment and were compared with Ubisense SmartSpace (Cambridge, UK) to
ensure they operated properly.
Table 1: Sensors’ environmental and behavioral variables.
Group Variable Data Period
(2017)
N
(Sensors/Apt)
Measure
Interval
Data
Acquisition
Outdoor
Environment
Ambient Temp. (C) 6/30 – 10/6 - 1 h Device
Relative Hum. (%) 6/30 – 10/6 - 1 h Device
PM2.5 (ug/m3) 6/30 – 10/6 - 1 h Device
CO2 (ug/m3) 6/30 – 10/6 - 1 h Device
O3 (ppb) 7/1 – 9/30 - 30 min Device
Indoor
Environment
Ambient Temp. (C) 6/30 – 10/6 1 1 h Device
Relative Hum. (%) 6/30 – 10/6 1 1 h Device
PM2.5 (ug/m3) 6/30 – 10/6 1 1 h Device
PM10 (ug/m3) 6/30 – 10/6 1 1 h Device
CO2 (ug/m3) 6/30 – 10/6 1 1 h Device

186
Behaviors Occupancy
(motion/no motion)
7/1 – 9/15 2 - 4 On state
change
Cloud
Window State
(open/closed)
7/1 – 9/15 1 - 8 On state
change
Cloud
A/C Use (kwh) 7/1 – 9/30 1 30 min/1 h Cloud/Device
A/C State
(open/closed)
7/1 – 9/30 1 30 min/1 h Cloud/Device
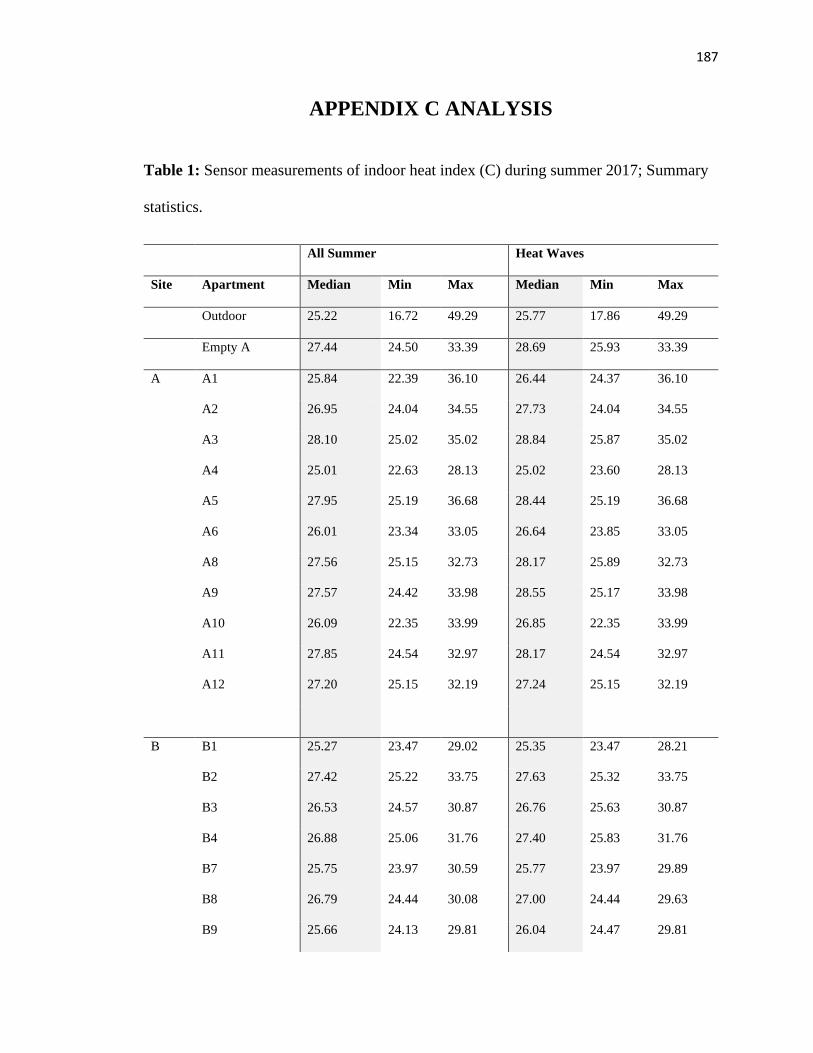
187
APPENDIX C ANALYSIS
Table 1: Sensor measurements of indoor heat index (C) during summer 2017; Summary
statistics.
All Summer Heat Waves
Site Apartment Median Min Max Median Min Max
Outdoor 25.22 16.72 49.29 25.77 17.86 49.29
Empty A 27.44 24.50 33.39 28.69 25.93 33.39
A A1 25.84 22.39 36.10 26.44 24.37 36.10
A2 26.95 24.04 34.55 27.73 24.04 34.55
A3 28.10 25.02 35.02 28.84 25.87 35.02
A4 25.01 22.63 28.13 25.02 23.60 28.13
A5 27.95 25.19 36.68 28.44 25.19 36.68
A6 26.01 23.34 33.05 26.64 23.85 33.05
A8 27.56 25.15 32.73 28.17 25.89 32.73
A9 27.57 24.42 33.98 28.55 25.17 33.98
A10 26.09 22.35 33.99 26.85 22.35 33.99
A11 27.85 24.54 32.97 28.17 24.54 32.97
A12 27.20 25.15 32.19 27.24 25.15 32.19
B B1 25.27 23.47 29.02 25.35 23.47 28.21
B2 27.42 25.22 33.75 27.63 25.32 33.75
B3 26.53 24.57 30.87 26.76 25.63 30.87
B4 26.88 25.06 31.76 27.40 25.83 31.76
B7 25.75 23.97 30.59 25.77 23.97 29.89
B8 26.79 24.44 30.08 27.00 24.44 29.63
B9 25.66 24.13 29.81 26.04 24.47 29.81
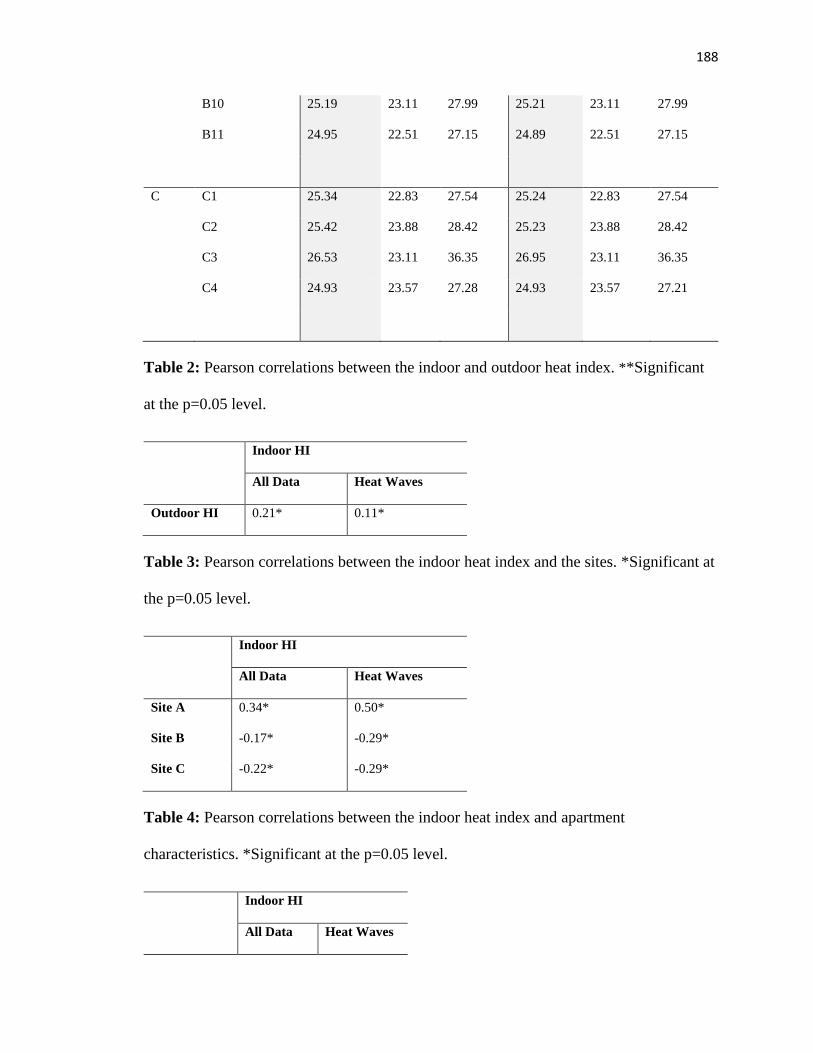
188
B10 25.19 23.11 27.99 25.21 23.11 27.99
B11 24.95 22.51 27.15 24.89 22.51 27.15
C C1 25.34 22.83 27.54 25.24 22.83 27.54
C2 25.42 23.88 28.42 25.23 23.88 28.42
C3 26.53 23.11 36.35 26.95 23.11 36.35
C4 24.93 23.57 27.28 24.93 23.57 27.21
Table 2: Pearson correlations between the indoor and outdoor heat index. **Significant
at the p=0.05 level.
Indoor HI
All Data Heat Waves
Outdoor HI 0.21* 0.11*
Table 3: Pearson correlations between the indoor heat index and the sites. *Significant at
the p=0.05 level.
Indoor HI
All Data Heat Waves
Site A 0.34* 0.50*
Site B -0.17* -0.29*
Site C -0.22* -0.29*
Table 4: Pearson correlations between the indoor heat index and apartment
characteristics. *Significant at the p=0.05 level.
Indoor HI
All Data Heat Waves
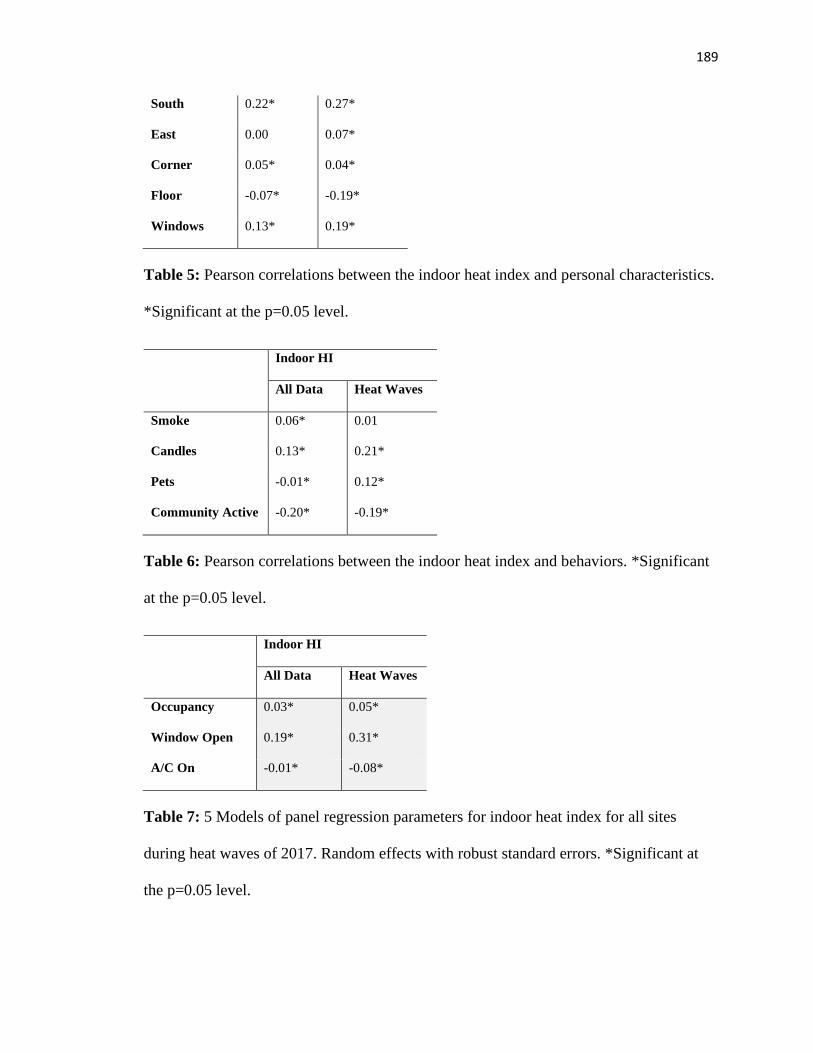
189
South 0.22* 0.27*
East 0.00 0.07*
Corner 0.05* 0.04*
Floor -0.07* -0.19*
Windows 0.13* 0.19*
Table 5: Pearson correlations between the indoor heat index and personal characteristics.
*Significant at the p=0.05 level.
Indoor HI
All Data Heat Waves
Smoke 0.06* 0.01
Candles 0.13* 0.21*
Pets -0.01* 0.12*
Community Active -0.20* -0.19*
Table 6: Pearson correlations between the indoor heat index and behaviors. *Significant
at the p=0.05 level.
Indoor HI
All Data Heat Waves
Occupancy 0.03* 0.05*
Window Open 0.19* 0.31*
A/C On -0.01* -0.08*
Table 7: 5 Models of panel regression parameters for indoor heat index for all sites
during heat waves of 2017. Random effects with robust standard errors. *Significant at
the p=0.05 level.
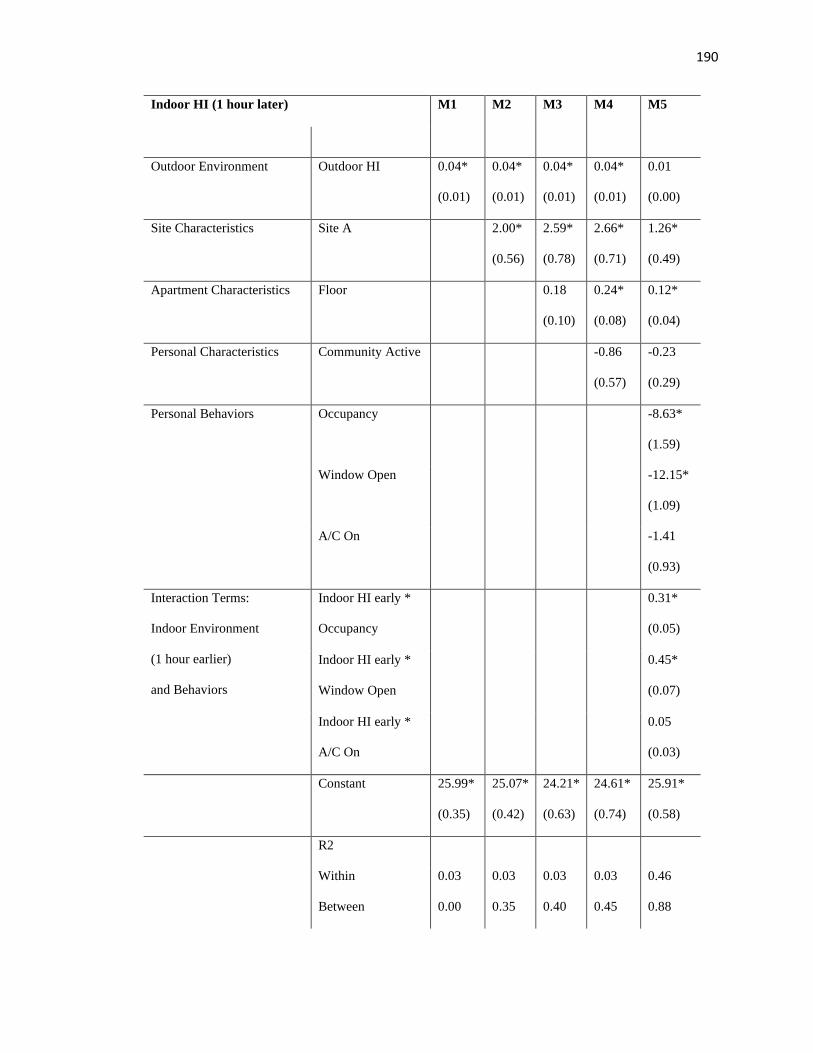
190
Indoor HI (1 hour later) M1 M2 M3 M4 M5
Outdoor Environment Outdoor HI 0.04*
(0.01)
0.04*
(0.01)
0.04*
(0.01)
0.04*
(0.01)
0.01
(0.00)
Site Characteristics Site A 2.00*
(0.56)
2.59*
(0.78)
2.66*
(0.71)
1.26*
(0.49)
Apartment Characteristics Floor 0.18
(0.10)
0.24*
(0.08)
0.12*
(0.04)
Personal Characteristics Community Active -0.86
(0.57)
-0.23
(0.29)
Personal Behaviors Occupancy -8.63*
(1.59)
Window Open -12.15*
(1.09)
A/C On -1.41
(0.93)
Interaction Terms:
Indoor Environment
(1 hour earlier)
and Behaviors
Indoor HI early *
Occupancy
0.31*
(0.05)
Indoor HI early *
Window Open
0.45*
(0.07)
Indoor HI early *
A/C On
0.05
(0.03)
Constant 25.99*
(0.35)
25.07*
(0.42)
24.21*
(0.63)
24.61*
(0.74)
25.91*
(0.58)
R2
Within 0.03 0.03 0.03 0.03 0.46
Between 0.00 0.35 0.40 0.45 0.88
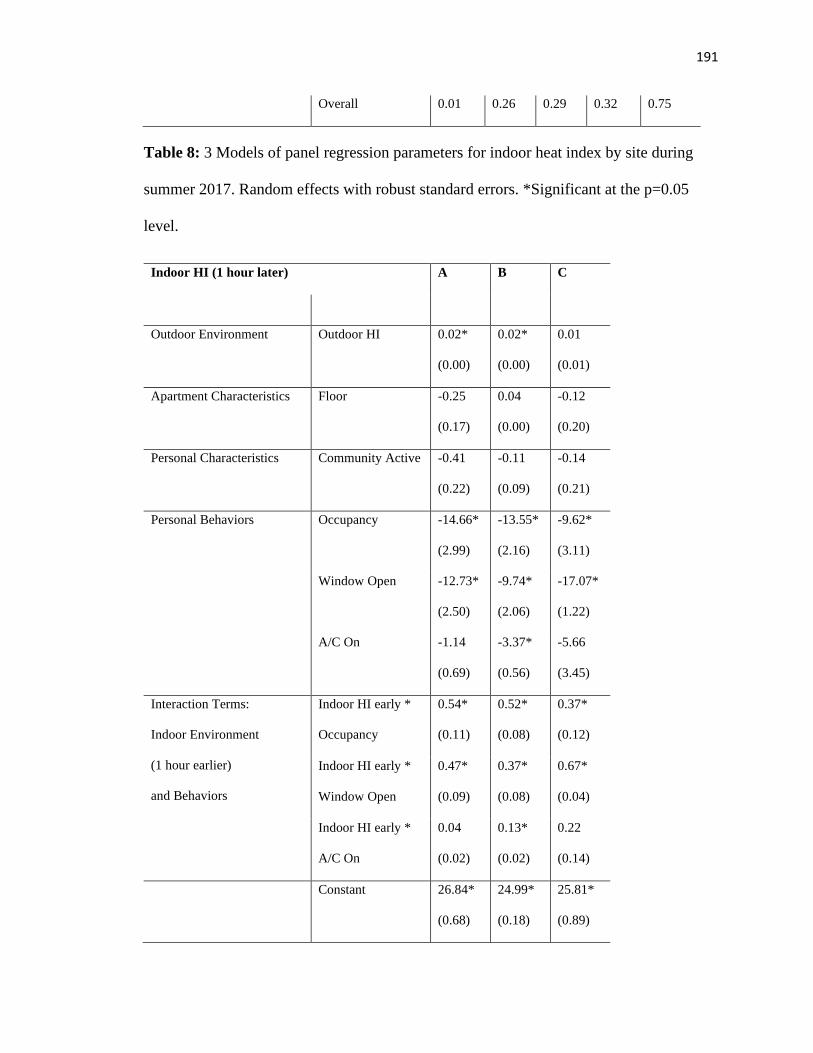
191
Overall 0.01 0.26 0.29 0.32 0.75
Table 8: 3 Models of panel regression parameters for indoor heat index by site during
summer 2017. Random effects with robust standard errors. *Significant at the p=0.05
level.
Indoor HI (1 hour later) A B C
Outdoor Environment Outdoor HI 0.02*
(0.00)
0.02*
(0.00)
0.01
(0.01)
Apartment Characteristics Floor -0.25
(0.17)
0.04
(0.00)
-0.12
(0.20)
Personal Characteristics Community Active -0.41
(0.22)
-0.11
(0.09)
-0.14
(0.21)
Personal Behaviors Occupancy -14.66*
(2.99)
-13.55*
(2.16)
-9.62*
(3.11)
Window Open -12.73*
(2.50)
-9.74*
(2.06)
-17.07*
(1.22)
A/C On -1.14
(0.69)
-3.37*
(0.56)
-5.66
(3.45)
Interaction Terms:
Indoor Environment
(1 hour earlier)
and Behaviors
Indoor HI early *
Occupancy
0.54*
(0.11)
0.52*
(0.08)
0.37*
(0.12)
Indoor HI early *
Window Open
0.47*
(0.09)
0.37*
(0.08)
0.67*
(0.04)
Indoor HI early *
A/C On
0.04
(0.02)
0.13*
(0.02)
0.22
(0.14)
Constant 26.84*
(0.68)
24.99*
(0.18)
25.81*
(0.89)
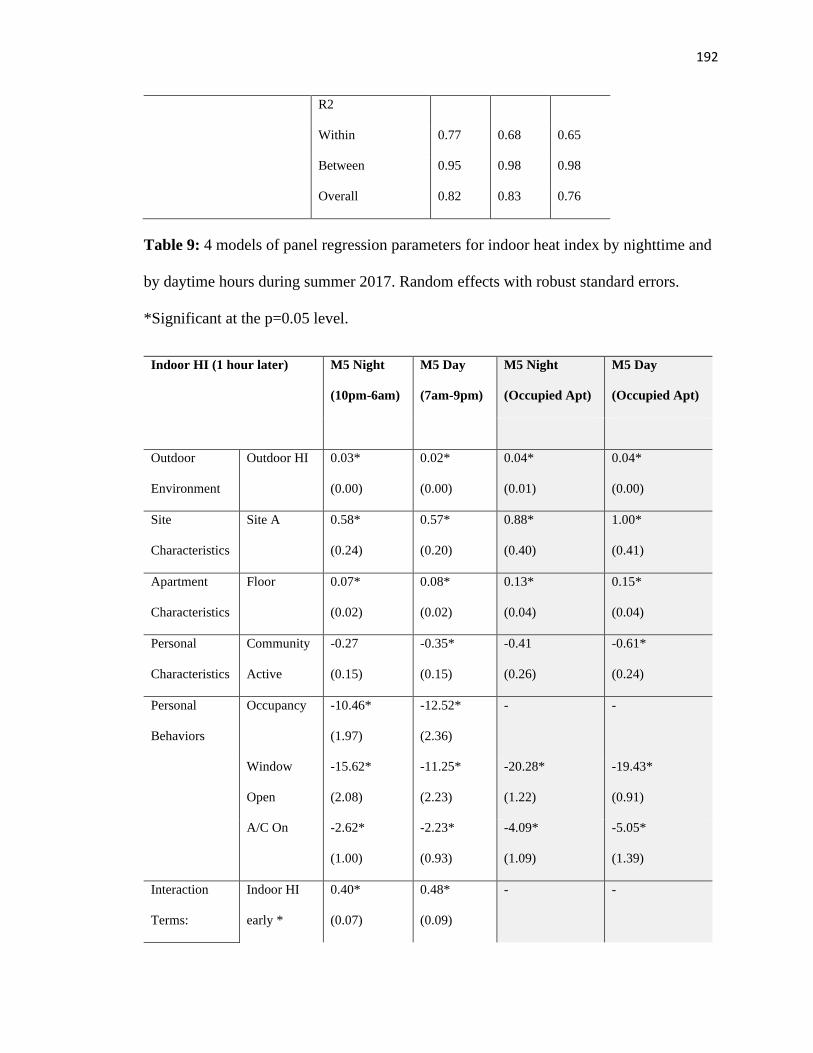
192
R2
Within 0.77 0.68 0.65
Between 0.95 0.98 0.98
Overall 0.82 0.83 0.76
Table 9: 4 models of panel regression parameters for indoor heat index by nighttime and
by daytime hours during summer 2017. Random effects with robust standard errors.
*Significant at the p=0.05 level.
Indoor HI (1 hour later) M5 Night
(10pm-6am)
M5 Day
(7am-9pm)
M5 Night
(Occupied Apt)
M5 Day
(Occupied Apt)
Outdoor
Environment
Outdoor HI 0.03*
(0.00)
0.02*
(0.00)
0.04*
(0.01)
0.04*
(0.00)
Site
Characteristics
Site A 0.58*
(0.24)
0.57*
(0.20)
0.88*
(0.40)
1.00*
(0.41)
Apartment
Characteristics
Floor 0.07*
(0.02)
0.08*
(0.02)
0.13*
(0.04)
0.15*
(0.04)
Personal
Characteristics
Community
Active
-0.27
(0.15)
-0.35*
(0.15)
-0.41
(0.26)
-0.61*
(0.24)
Personal
Behaviors
Occupancy -10.46*
(1.97)
-12.52*
(2.36)
- -
Window
Open
-15.62*
(2.08)
-11.25*
(2.23)
-20.28*
(1.22)
-19.43*
(0.91)
A/C On -2.62*
(1.00)
-2.23*
(0.93)
-4.09*
(1.09)
-5.05*
(1.39)
Interaction
Terms:
Indoor HI
early *
0.40*
(0.07)
0.48*
(0.09)
- -
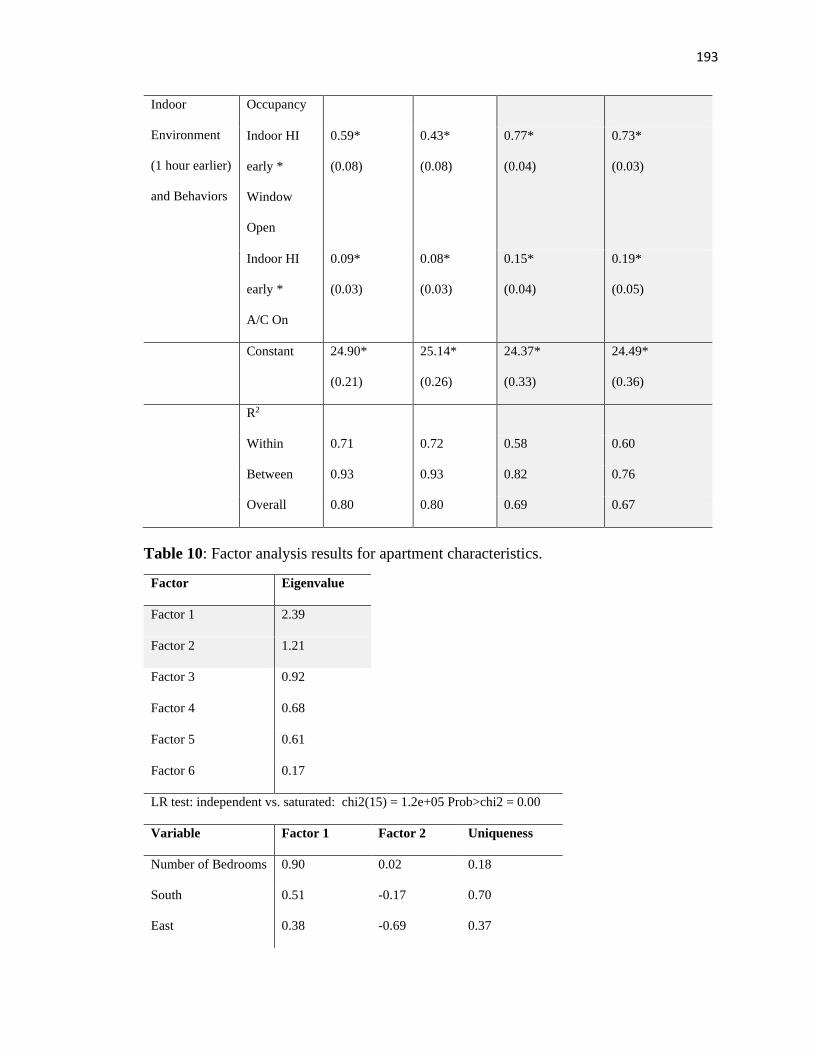
193
Indoor
Environment
(1 hour earlier)
and Behaviors
Occupancy
Indoor HI
early *
Window
Open
0.59*
(0.08)
0.43*
(0.08)
0.77*
(0.04)
0.73*
(0.03)
Indoor HI
early *
A/C On
0.09*
(0.03)
0.08*
(0.03)
0.15*
(0.04)
0.19*
(0.05)
Constant 24.90*
(0.21)
25.14*
(0.26)
24.37*
(0.33)
24.49*
(0.36)
R2
Within 0.71 0.72 0.58 0.60
Between 0.93 0.93 0.82 0.76
Overall 0.80 0.80 0.69 0.67
Table 10: Factor analysis results for apartment characteristics.
Factor Eigenvalue
Factor 1 2.39
Factor 2 1.21
Factor 3 0.92
Factor 4 0.68
Factor 5 0.61
Factor 6 0.17
LR test: independent vs. saturated: chi2(15) = 1.2e+05 Prob>chi2 = 0.00
Variable Factor 1 Factor 2 Uniqueness
Number of Bedrooms 0.90 0.02 0.18
South 0.51 -0.17 0.70
East 0.38 -0.69 0.37
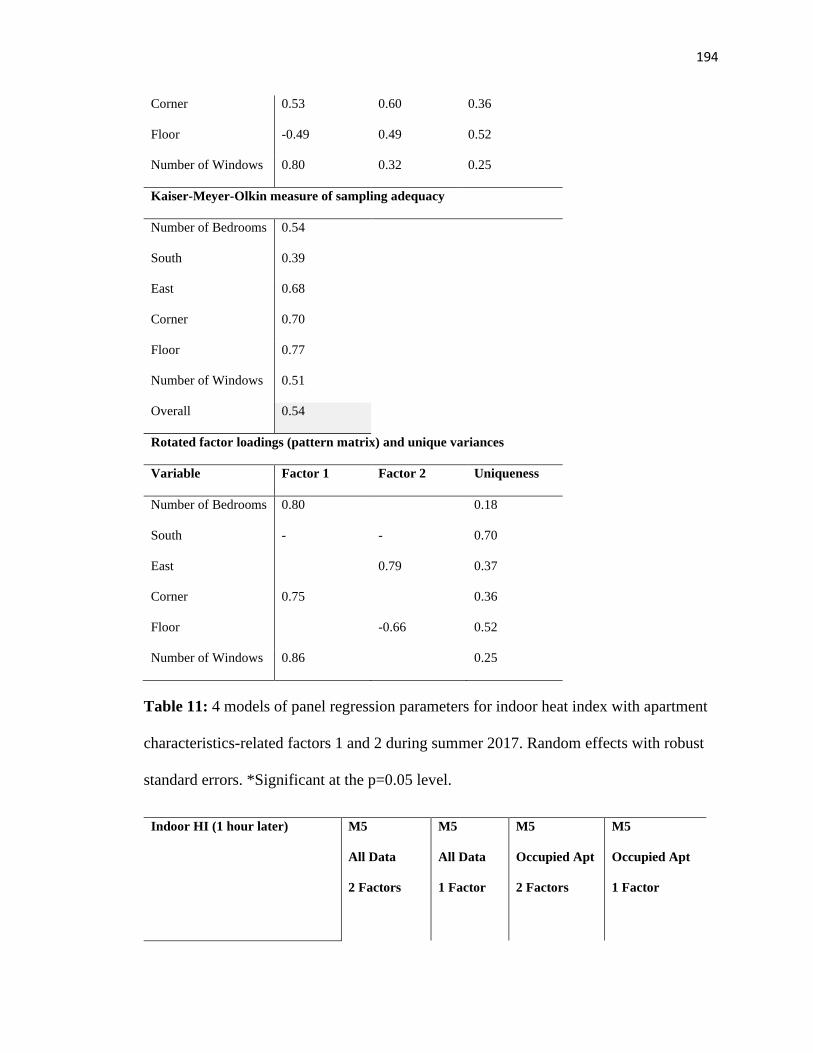
194
Corner 0.53 0.60 0.36
Floor -0.49 0.49 0.52
Number of Windows 0.80 0.32 0.25
Kaiser-Meyer-Olkin measure of sampling adequacy
Number of Bedrooms 0.54
South 0.39
East 0.68
Corner 0.70
Floor 0.77
Number of Windows 0.51
Overall 0.54
Rotated factor loadings (pattern matrix) and unique variances
Variable Factor 1 Factor 2 Uniqueness
Number of Bedrooms 0.80 0.18
South - - 0.70
East 0.79 0.37
Corner 0.75 0.36
Floor -0.66 0.52
Number of Windows 0.86 0.25
Table 11: 4 models of panel regression parameters for indoor heat index with apartment
characteristics-related factors 1 and 2 during summer 2017. Random effects with robust
standard errors. *Significant at the p=0.05 level.
Indoor HI (1 hour later) M5
All Data
2 Factors
M5
All Data
1 Factor
M5
Occupied Apt
2 Factors
M5
Occupied Apt
1 Factor
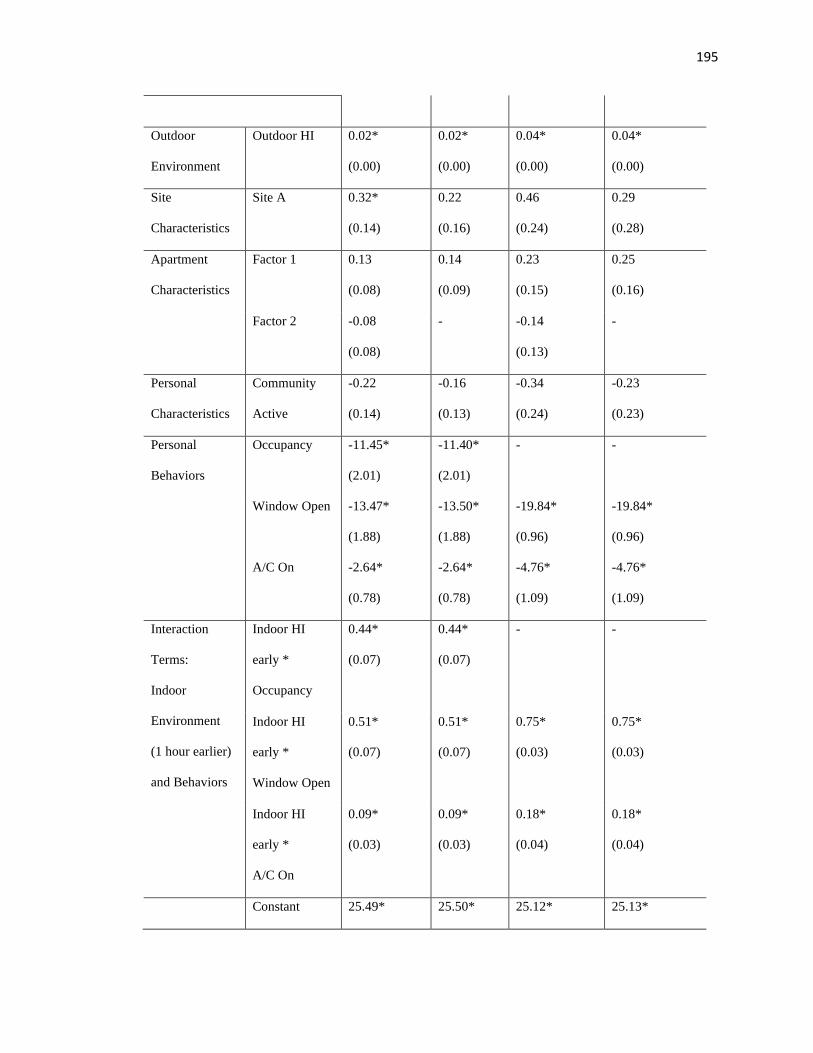
195
Outdoor
Environment
Outdoor HI 0.02*
(0.00)
0.02*
(0.00)
0.04*
(0.00)
0.04*
(0.00)
Site
Characteristics
Site A 0.32*
(0.14)
0.22
(0.16)
0.46
(0.24)
0.29
(0.28)
Apartment
Characteristics
Factor 1 0.13
(0.08)
0.14
(0.09)
0.23
(0.15)
0.25
(0.16)
Factor 2 -0.08
(0.08)
- -0.14
(0.13)
-
Personal
Characteristics
Community
Active
-0.22
(0.14)
-0.16
(0.13)
-0.34
(0.24)
-0.23
(0.23)
Personal
Behaviors
Occupancy -11.45*
(2.01)
-11.40*
(2.01)
- -
Window Open -13.47*
(1.88)
-13.50*
(1.88)
-19.84*
(0.96)
-19.84*
(0.96)
A/C On -2.64*
(0.78)
-2.64*
(0.78)
-4.76*
(1.09)
-4.76*
(1.09)
Interaction
Terms:
Indoor
Environment
(1 hour earlier)
and Behaviors
Indoor HI
early *
Occupancy
0.44*
(0.07)
0.44*
(0.07)
- -
Indoor HI
early *
Window Open
0.51*
(0.07)
0.51*
(0.07)
0.75*
(0.03)
0.75*
(0.03)
Indoor HI
early *
A/C On
0.09*
(0.03)
0.09*
(0.03)
0.18*
(0.04)
0.18*
(0.04)
Constant 25.49* 25.50* 25.12* 25.13*
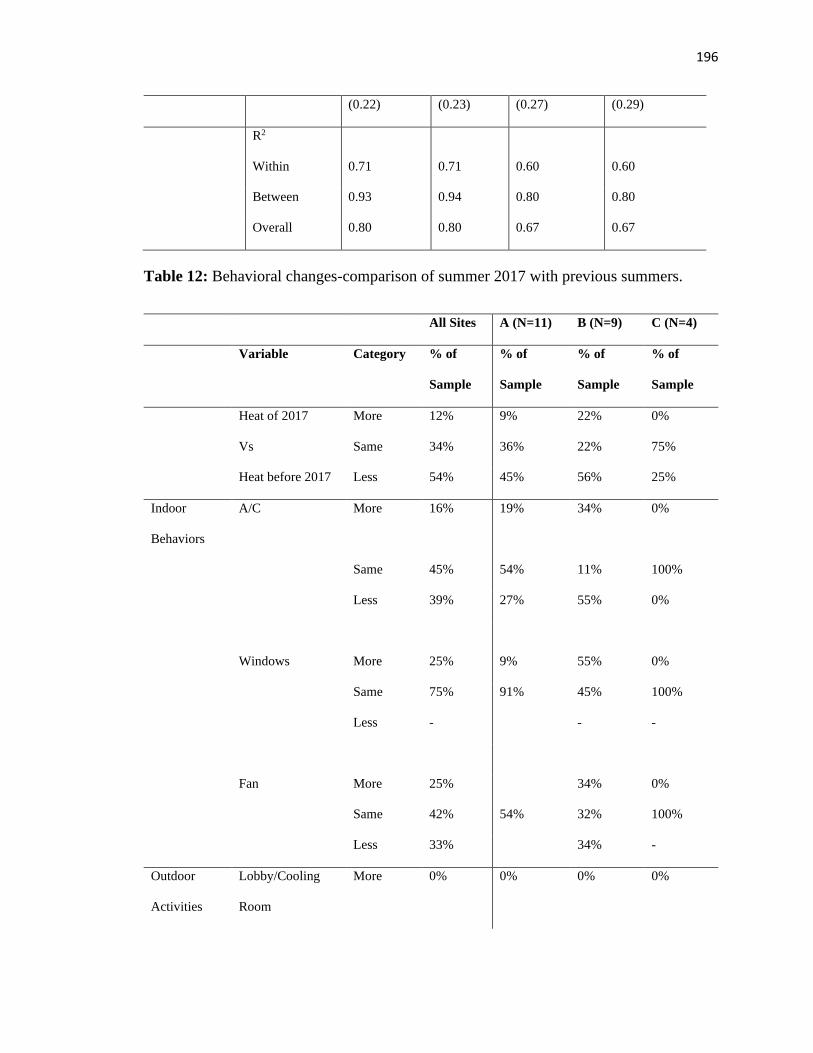
196
(0.22) (0.23) (0.27) (0.29)
R2
Within 0.71 0.71 0.60 0.60
Between 0.93 0.94 0.80 0.80
Overall 0.80 0.80 0.67 0.67
Table 12: Behavioral changes-comparison of summer 2017 with previous summers.
All Sites A (N=11) B (N=9) C (N=4)
Variable Category % of
Sample
% of
Sample
% of
Sample
% of
Sample
Heat of 2017 More 12% 9% 22% 0%
Vs Same 34% 36% 22% 75%
Heat before 2017 Less 54% 45% 56% 25%
Indoor
Behaviors
A/C More 16% 19% 34% 0%
Same 45% 54% 11% 100%
Less 39% 27% 55% 0%
Windows More 25% 9% 55% 0%
Same 75% 91% 45% 100%
Less - - -
Fan More 25% 34% 0%
Same 42% 54% 32% 100%
Less 33% 34% -
Outdoor
Activities
Lobby/Cooling
Room
More 0% 0% 0% 0%
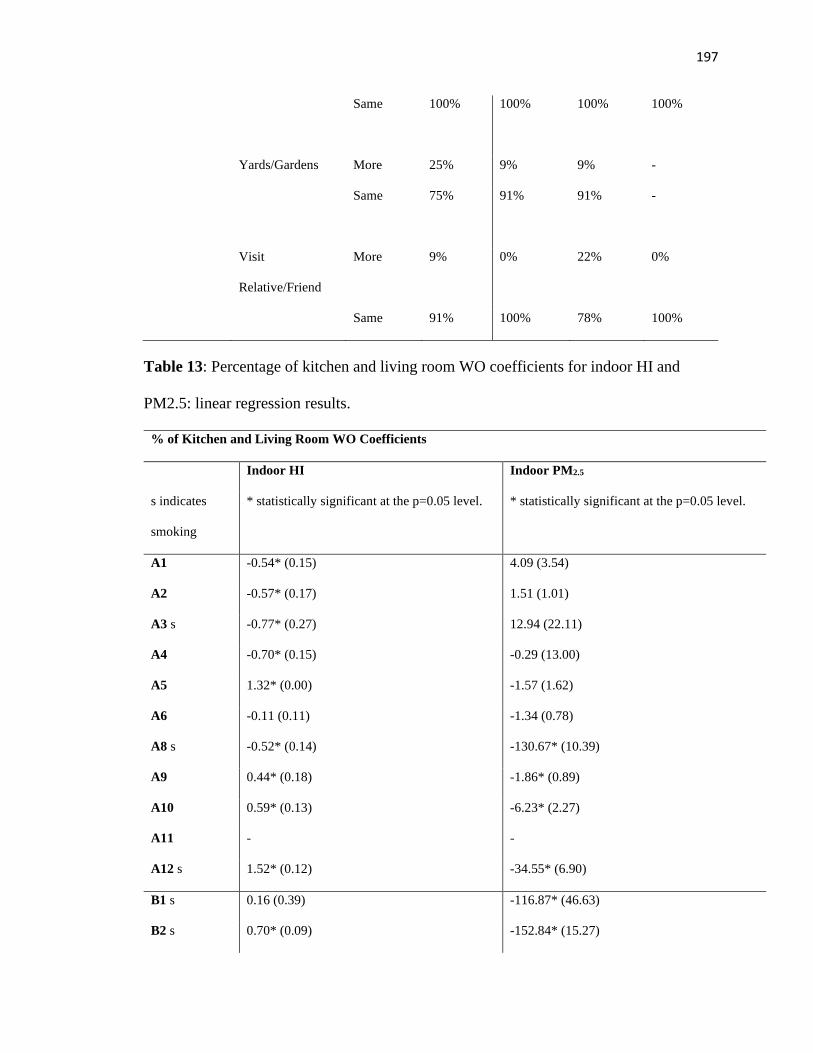
197
Same 100% 100% 100% 100%
Yards/Gardens More 25% 9% 9% -
Same 75% 91% 91% -
Visit
Relative/Friend
More 9% 0% 22% 0%
Same 91% 100% 78% 100%
Table 13: Percentage of kitchen and living room WO coefficients for indoor HI and
PM2.5: linear regression results.
% of Kitchen and Living Room WO Coefficients
Indoor HI Indoor PM2.5
s indicates
smoking
* statistically significant at the p=0.05 level. * statistically significant at the p=0.05 level.
A1 -0.54* (0.15) 4.09 (3.54)
A2 -0.57* (0.17) 1.51 (1.01)
A3 s -0.77* (0.27) 12.94 (22.11)
A4 -0.70* (0.15) -0.29 (13.00)
A5 1.32* (0.00) -1.57 (1.62)
A6 -0.11 (0.11) -1.34 (0.78)
A8 s -0.52* (0.14) -130.67* (10.39)
A9 0.44* (0.18) -1.86* (0.89)
A10 0.59* (0.13) -6.23* (2.27)
A11 - -
A12 s 1.52* (0.12) -34.55* (6.90)
B1 s 0.16 (0.39) -116.87* (46.63)
B2 s 0.70* (0.09) -152.84* (15.27)
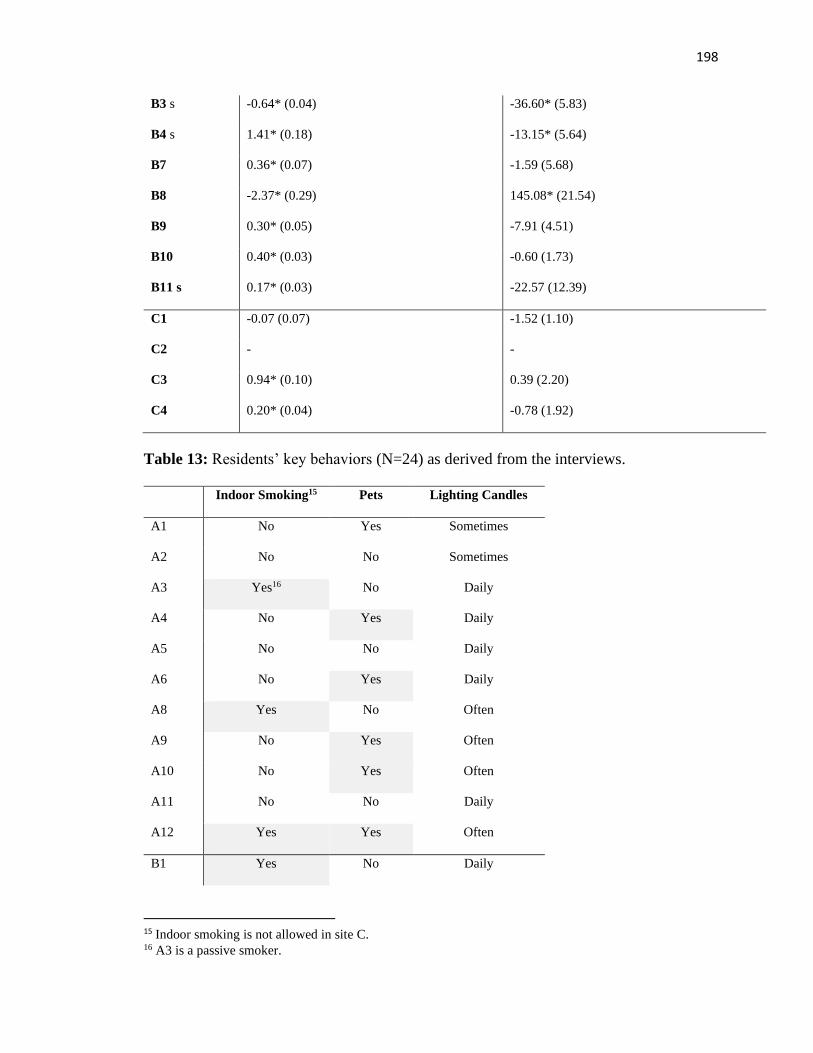
198
B3 s -0.64* (0.04) -36.60* (5.83)
B4 s 1.41* (0.18) -13.15* (5.64)
B7 0.36* (0.07) -1.59 (5.68)
B8 -2.37* (0.29) 145.08* (21.54)
B9 0.30* (0.05) -7.91 (4.51)
B10 0.40* (0.03) -0.60 (1.73)
B11 s 0.17* (0.03) -22.57 (12.39)
C1 -0.07 (0.07) -1.52 (1.10)
C2 - -
C3 0.94* (0.10) 0.39 (2.20)
C4 0.20* (0.04) -0.78 (1.92)
Table 13: Residents’ key behaviors (N=24) as derived from the interviews.
Indoor Smoking15 Pets Lighting Candles
A1 No Yes Sometimes
A2 No No Sometimes
A3 Yes16 No Daily
A4 No Yes Daily
A5 No No Daily
A6 No Yes Daily
A8 Yes No Often
A9 No Yes Often
A10 No Yes Often
A11 No No Daily
A12 Yes Yes Often
B1 Yes No Daily
15 Indoor smoking is not allowed in site C. 16 A3 is a passive smoker.
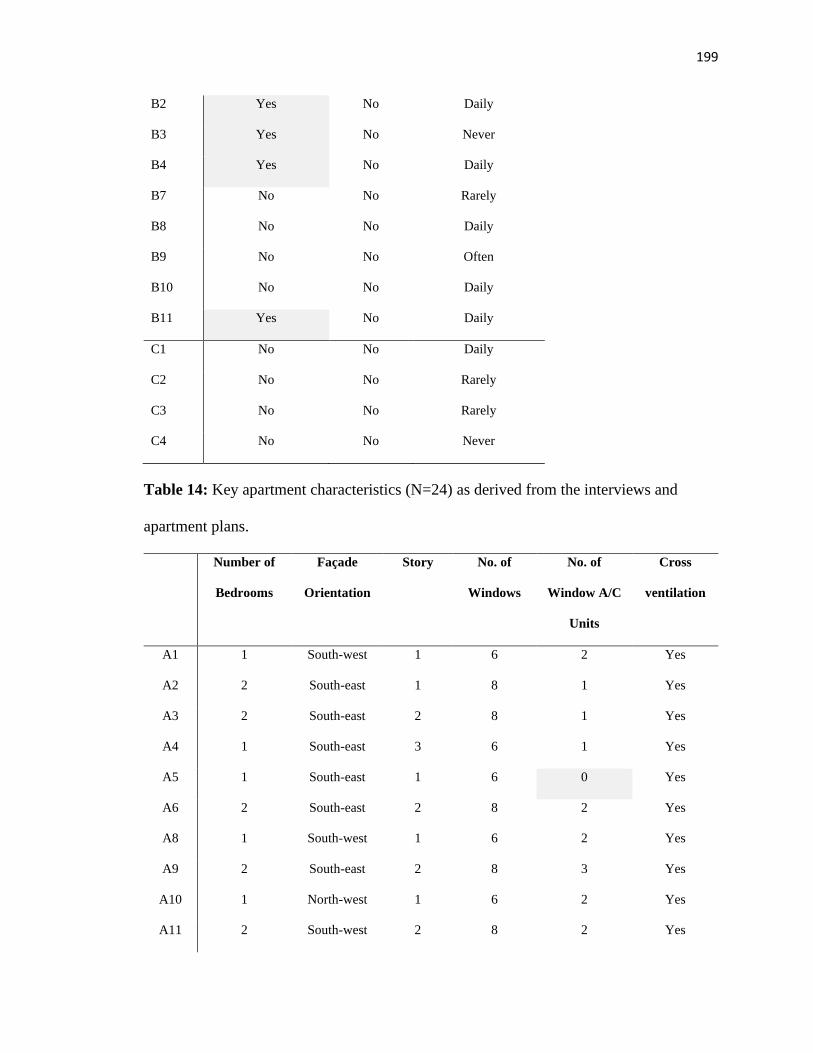
199
B2 Yes No Daily
B3 Yes No Never
B4 Yes No Daily
B7 No No Rarely
B8 No No Daily
B9 No No Often
B10 No No Daily
B11 Yes No Daily
C1 No No Daily
C2 No No Rarely
C3 No No Rarely
C4 No No Never
Table 14: Key apartment characteristics (N=24) as derived from the interviews and
apartment plans.
Number of
Bedrooms
Façade
Orientation
Story No. of
Windows
No. of
Window A/C
Units
Cross
ventilation
A1 1 South-west 1 6 2 Yes
A2 2 South-east 1 8 1 Yes
A3 2 South-east 2 8 1 Yes
A4 1 South-east 3 6 1 Yes
A5 1 South-east 1 6 0 Yes
A6 2 South-east 2 8 2 Yes
A8 1 South-west 1 6 2 Yes
A9 2 South-east 2 8 3 Yes
A10 1 North-west 1 6 2 Yes
A11 2 South-west 2 8 2 Yes
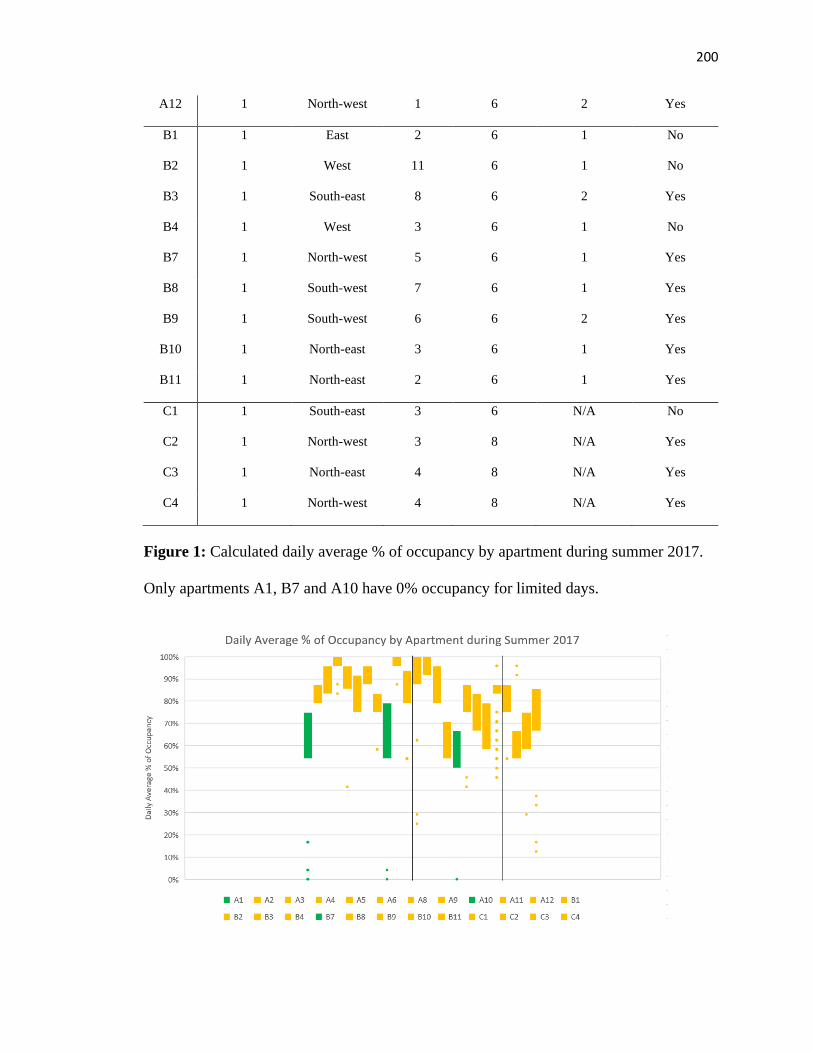
200
A12 1 North-west 1 6 2 Yes
B1 1 East 2 6 1 No
B2 1 West 11 6 1 No
B3 1 South-east 8 6 2 Yes
B4 1 West 3 6 1 No
B7 1 North-west 5 6 1 Yes
B8 1 South-west 7 6 1 Yes
B9 1 South-west 6 6 2 Yes
B10 1 North-east 3 6 1 Yes
B11 1 North-east 2 6 1 Yes
C1 1 South-east 3 6 N/A No
C2 1 North-west 3 8 N/A Yes
C3 1 North-east 4 8 N/A Yes
C4 1 North-west 4 8 N/A Yes
Figure 1: Calculated daily average % of occupancy by apartment during summer 2017.
Only apartments A1, B7 and A10 have 0% occupancy for limited days.
201
REFERENCES
Adamkiewicz, G., Zota, A. R., Fabian, M. P., Chahine, T., Julien, R., Spengler, J. D., &
Levy, J. I. (2011). Moving environmental justice indoors: understanding structural
influences on residential exposure patterns in low-income communities. American
journal of public health, 101(S1), S238-S245.
AirNow (2016). from https://airnow.gov/
Akbari, H., Pomerantz, M., & Taha, H. (2001). Cool surfaces and shade trees to reduce
energy use and improve air quality in urban areas. Solar energy, 70(3), 295-310.
Alberti, M., Asbjornsen, H., Baker, L. A., Brozovic, N., Drinkwater, L. E., Drzyzga, S.
A., ... & Liu, J. J. (2011). Research on coupled human and natural systems
(CHANS): approach, challenges, and strategies. The Bulletin of the Ecological
Society of America, 92(2), 218-228.
American Society of Heating, Refrigerating and Air-Conditioning Engineers (ASHRAE)
(2011). ASHRAE Guideline 10-2011, Interactions Affecting the Achievement of
Acceptable Indoor Environments. ASHRAE.
Analitis, A., De’Donato, F., Scortichini, M., Lanki, T., Basagana, X., Ballester, F., ... &
Michelozzi, P. (2018). Synergistic effects of ambient temperature and air
pollution on health in Europe: results from the PHASE project. International
journal of environmental research and public health, 15(9), 1856.
Andrews, C. J., Allacci, M. S., Senick, J., Putra, H. C., & Tsoulou, I. (2016). Using
synthetic population data for prospective modeling of occupant behavior during
design. Energy and Buildings, 126, 415-423.
ASHRAE, S. (2016). Standard 62.1-2016. Ventilation for acceptable indoor air quality.
American Society of Heating, Refrigerating, and Air-Conditioning Engineers,
Inc.: Atlanta, GA.
ANSI/ASHRAE 55 (2013). Thermal Environmental Conditions for Human Occupancy,
American Society of Heating, Refrigerating and Air-Conditioning Engineers,
Atlanta, GA, US
Arif, M., Katafygiotou, M., Mazroei, A., Kaushik, A., & Elsarrag, E. (2016). Impact of
indoor environmental quality on occupant well-being and comfort: A review of
the literature. International Journal of Sustainable Built Environment, 5(1), 1-11.
Arnberger, A., Allex, B., Eder, R., Ebenberger, M., Wanka, A., Kolland, F., ... & Hutter,
H. P. (2017). Elderly resident’s uses of and preferences for urban green spaces
during heat periods. Urban Forestry & Urban Greening, 21, 102-115.
Arnberger, A., & Eder, R. (2011). The influence of age on recreational trail preferences
202
of urban green-space visitors: a discrete choice experiment with digitally
calibrated images. Journal of Environmental Planning and Management, 54(7),
891-908.
Azar, E., & Menassa, C. C. (2012). A comprehensive analysis of the impact of occupancy
parameters in energy simulation of office buildings. Energy and Buildings, 55,
841-853.
Bauwens, G., & Roels, S. (2013). Characterizing Thermal Performance of Buildings
Using Dynamic Model Identification. In Proceedings of the Thermal Performance
of the Exterior Envelopes of Whole Buildings XII International Conference,
ASHRAE (pp. 1-14).
Bayoumi, M. (2017). Impacts of window opening grade on improving the energy
efficiency of a façade in hot climates. Building and Environment, 119, 31-43.
Baxter, L. K., Clougherty, J. E., Laden, F., & Levy, J. I. (2007). Predictors of
concentrations of nitrogen dioxide, fine particulate matter, and particle
constituents inside of lower socioeconomic status urban homes. Journal of
Exposure Science and Environmental Epidemiology, 17(5), 433.
Becher, R., Øvrevik, J., Schwarze, P., Nilsen, S., Hongslo, J., & Bakke, J. (2018). Do
carpets impair indoor air quality and cause adverse health outcomes: a review.
International journal of environmental research and public health, 15(2), 184.
Bélanger, D., Abdous, B., Gosselin, P., & Valois, P. (2015). An adaptation index to high
summer heat associated with adverse health impacts in deprived neighborhoods.
Climatic Change, 132(2), 279-293.
Bélanger, D., Gosselin, P., Valois, P., & Abdous, B. (2015). Neighbourhood and dwelling
characteristics associated with the self-reported adverse health effects of heat in
most deprived urban areas: A cross-sectional study in 9 cities. Health & place, 32,
8-18.
Belkin International. WEMO smart plug. Retrieved from:
https://www.belkin.com/us/c/wemo/
Ben-David, T., & Waring, M. S. (2018). Interplay of ventilation and filtration:
Differential analysis of cost function combining energy use and indoor exposure
to PM2. 5 and ozone. Building and Environment, 128, 320-335.
Berkes, F., Colding, J., & Folke, C. (2003). 2003, Navigating Social-Ecological Systems:
Building Resilience For Complexity And Change.
Bouchama, A., Dehbi, M., Mohamed, G., Matthies, F., Shoukri, M., & Menne, B. (2007).
Prognostic factors in heat wave–related deaths: a meta-analysis. Archives of
internal medicine, 167(20), 2170-2176.
Bowler, D. E., Buyung-Ali, L., Knight, T. M., & Pullin, A. S. (2010). Urban greening to
203
cool towns and cities: A systematic review of the empirical evidence. Landscape
and urban planning, 97(3), 147-155.
Campbell, L. K., & Gabriel, N. (2016). Power in urban social-ecological systems:
Processes and practices of governance and marginalization. Urban Forestry &
Urban Greening, 19, 253-254.
Carlson, J. A., Sallis, J. F., Conway, T. L., Saelens, B. E., Frank, L. D., Kerr, J., ... &
King, A. C. (2012). Interactions between psychosocial and built environment
factors in explaining older adults' physical activity. Preventive medicine, 54(1),
68-73.
Carmin, J., Nadkarni, N., & Rhie, C. (2012). Progress and Challenges in Urban Climate
Adaptation Planning: Results of a Global. In Progress and Challenges in Urban
Climate Adaptation Planning: Results of a Global. Massachusetts Institute of
Technology (MIT).
Challoner, A., & Gill, L. (2014). Indoor/outdoor air pollution relationships in ten
commercial buildings: PM2. 5 and NO2. Building and Environment, 80, 159-173.
Chen, L., Liu, C., Zou, R., Yang, M., & Zhang, Z. (2016). Experimental examination of
effectiveness of vegetation as bio-filter of particulate matters in the urban
environment. Environmental pollution, 208, 198-208.
Chen, M., Dai, F., Yang, B., & Zhu, S. (2019). Effects of neighborhood green space on
PM2. 5 mitigation: Evidence from five megacities in China. Building and
Environment.
Clarke, P., & Nieuwenhuijsen, E. R. (2009). Environments for healthy ageing: A critical
review. Maturitas, 64(1), 14-19.
Currie, B. A., & Bass, B. (2008). Estimates of air pollution mitigation with green plants
and green roofs using the UFORE model. Urban Ecosystems, 11(4), 409-422.
Díaz, J., Carmona, R., Mirón, I. J., Luna, M. Y., & Linares, C. J. E. I. (2018). Time trend
in the impact of heat waves on daily mortality in Spain for a period of over thirty
years (1983–2013). Environment international, 116, 10-17.
D’Oca, S., Chen, C. F., Hong, T., & Belafi, Z. (2017). Synthesizing building physics with
social psychology: An interdisciplinary framework for context and occupant
behavior in office buildings. Energy research & social science, 34, 240-251.
Du, J., & Pan, W. (2019). Impact of Window Operation Behaviours on Cooling Load of
High-rise Residential Buildings in Hong Kong. In Proceedings of the 16th
International IBPSA Building Simulation Conference, Rome, Italy.
Engel, L., Chudyk, A. M., Ashe, M. C., McKay, H. A., Whitehurst, D. G. T., & Bryan, S.
(2016). Older adults' quality of life–Exploring the role of the built environment
and social cohesion in community-dwelling seniors on low income. Social
Science & Medicine, 164, 1-11.
204
Environmental Protection Agency (EPA) (2012). Particulate Matter (PM) Pollution. from
https://www.epa.gov/pm-pollution
Environmental Protection Agency (EPA) (2013). National Ambient Air Quality
Standards for Particulate Matter: Final Rule. Fed. Regist, 78, 3086-3286.
Environmental Protection Agency (EPA) (2015). National Ambient Air Quality
Standards for Ozone Final Rule. from https://www.gpo.gov/fdsys/pkg/FR-2015-
10-26/pdf/2015-26594.pdf
Epstein, G., J. M. Vogt, S. K. Mincey, M. Cox, and B.C. Fischer. 2013. Missing ecology:
integrating ecological perspectives with the social-ecological system framework.
International Journal of the Commons 7(2):432-453.
Escandón, R., Suárez, R., & Sendra, J. J. (2019). Field assessment of thermal comfort
conditions and energy performance of social housing: The case of hot summers in
the Mediterranean climate. Energy policy, 128, 377-392.
Fabi, V., Andersen, R. V., Corgnati, S., & Olesen, B. W. (2012). Occupants' window
opening behaviour: A literature review of factors influencing occupant behaviour
and models. Building and Environment, 58, 188-198.
Fanger, P. O. (1970). Thermal comfort. Analysis and applications in environmental
engineering. Thermal comfort. Analysis and applications in environmental
engineering.
Fischer, P. H., Brunekreef, B., & Lebret, E. (2004). Air pollution related deaths during
the 2003 heat wave in the Netherlands. Atmospheric environment, 38(8), 1083-
1085.
Folke, C. (2006). Resilience: The emergence of a perspective for social–ecological
systems analyses. Global environmental change, 16(3), 253-267.
Fong, K. C., Hart, J. E., & James, P. (2018). A review of epidemiologic studies on
greenness and health: Updated literature through 2017. Current environmental
health reports, 5(1), 77-87.
Fraser, A. M., Chester, M. V., Eisenman, D., Hondula, D. M., Pincetl, S. S., English, P.,
& Bondank, E. (2017). Household accessibility to heat refuges: Residential air
conditioning, public cooled space, and walkability. Environment and Planning B:
Urban Analytics and City Science, 44(6), 1036-1055.
Gadgil, M., Olsson, P., Berkes, F., Folke, C., Berkes, F., Colding, J., & Folk, C. (2003).
Navigating social-ecological systems: Building resilience for complexity and
change. Exploring the Role of Local Ecological Knowledge in Ecosystem
Management: Three Case Studies, 189-209.
Gasparrini, A., Guo, Y., Hashizume, M., Kinney, P. L., Petkova, E. P., Lavigne, E., ... &
Tong, S. (2015). Temporal variation in heat–mortality associations: a
multicountry study. Environmental health perspectives, 123(11), 1200-1207.
205
Gehl, J., & Svarre, B. (2013). How to study public life. Island press.
Giamalaki, M., & Kolokotsa, D. (2019). Understanding the thermal experience of elderly
people in their residences: Study on thermal comfort and adaptive behaviors of
senior citizens in Crete, Greece. Energy and Buildings, 185, 76-87.
Green, H., Bailey, J., Schwarz, L., Vanos, J., Ebi, K., & Benmarhnia, T. (2019). Impact
of heat on mortality and morbidity in low and middle income countries: A review
of the epidemiological evidence and considerations for future research.
Environmental research.
Habeeb, D., Vargo, J., & Stone, B. (2015). Rising heat wave trends in large US cities.
Natural Hazards, 76(3), 1651-1665.
Hajat, A., Hsia, C., & O’Neill, M. S. (2015). Socioeconomic disparities and air pollution
exposure: a global review. Current environmental health reports, 2(4), 440-450.
Halliday, A., & Glaser, M. (2011). A Management Perspective on Social Ecological
Systems: A generic system model and its application to a case study from Peru.
Human Ecology Review, 1-18.
Handbook, A. S. H. R. A. E. (2017). Fundamentals, ASHRAE–American Society of
Heating. Ventilating and Air-Conditioning Engineers.
Harlan, S. L., & Ruddell, D. M. (2011). Climate change and health in cities: impacts of
heat and air pollution and potential co-benefits from mitigation and adaptation.
Current Opinion in Environmental Sustainability, 3(3), 126-134.
Hartig, T., Mitchell, R., De Vries, S., & Frumkin, H. (2014). Nature and health. Annual
review of public health, 35, 207-228.
Hass, A. L., Ellis, K. N., Reyes Mason, L., Hathaway, J. M., & Howe, D. A. (2016). Heat
and humidity in the city: neighborhood heat index variability in a mid-sized city
in the southeastern United States. International journal of environmental research
and public health, 13(1), 117.
He, C., Ma, L., Zhou, L., Kan, H., Zhang, Y., Ma, W., & Chen, B. (2019). Exploring the
mechanisms of heat wave vulnerability at the urban scale based on the application
of big data and artificial societies. Environment international, 127, 573-583.
He, Y., Ma, R., Ren, M., Liao, W., Zhang, N., Su, Y., ... & Huang, C. (2019). Public
Health Adaptation to Heat Waves in Response to Climate Change in China. In
Ambient Temperature and Health in China (pp. 171-190). Springer, Singapore.
Hondula, D. M., Balling, R. C., Vanos, J. K., & Georgescu, M. (2015). Rising
temperatures, human health, and the role of adaptation. Current Climate Change
Reports, 1(3), 144-154.
Hondula, D. M., Georgescu, M., & Balling Jr, R. C. (2014). Challenges associated with
projecting urbanization-induced heat-related mortality. Science of the Total
Environment, 490, 538-544.
206
Hong, T., & Lin, H. W. (2013). Occupant behavior: impact on energy use of private
offices (No. LBNL-6128E). Lawrence Berkeley National Lab.(LBNL), Berkeley,
CA (United States).
Hong, T., Yan, D., D'Oca, S., & Chen, C. F. (2017). Ten questions concerning occupant
behavior in buildings: The big picture. Building and Environment, 114, 518-530.
Horton, R., Yohe, G., Easterling, W., Kates, R., Ruth, M., Sussman, E., ... & Lipschultz,
F. (2014). Ch. 16: northeast. Climate change impacts in the United States: The
third national climate assessment, 371-395.
Housing Authority of the City of Elizabeth (HACE) (2017). From
http://www.hacenj.com/
IQAir Corporation. AirVisual air quality monitor. Retrieved from:
https://www.iqair.com/air-quality-monitors/airvisual-pro
IEA. (2019). World Energy Outlook Special Report: Energy and Air Pollution. Retrieved
4 June 2019. Retrieved from:
https://www.iea.org/publications/freepublications/publication/WorldEnergyOutlo
okSpecialReport2016EnergyandAirPollution.pdf
Intergovernmental Panel on Climate Change. (2014). Emergent Risks and Key
Vulnerabilities. In Climate Change 2014 – Impacts, Adaptation and Vulnerability:
Part A: Global and Sectoral Aspects: Working Group II Contribution to the IPCC
Fifth Assessment Report (pp. 1039-1100). Cambridge: Cambridge University
Press. doi:10.1017/CBO9781107415379.024
ISO, E. (2005). 7730. Ergonomics of the thermal environment—analytical determination
and interpretation of thermal comfort using calculation of the PMV and PPD
indices and local thermal comfort criteria, Standards Norway, Oslo, Norway.
Issa, A., Ramadugu, K., Mulay, P., Hamilton, J., Siegel, V., Harrison, C., ... & Boehmer,
T. (2018). Deaths related to Hurricane Irma—Florida, Georgia, and North
Carolina, September 4–October 10, 2017. Morbidity and Mortality Weekly
Report, 67(30), 829.
Jacob, D. J., & Winner, D. A. (2009). Effect of climate change on air quality.
Atmospheric environment, 43(1), 51-63.
Jeong, B., Jeong, J. W., & Park, J. S. (2016). Occupant behavior regarding the manual
control of windows in residential buildings. Energy and buildings, 127, 206-216.
Joint Center for Housing Studies of Harvard University. (2016). Projections &
Implications for Housing a Growing Population: Older Households 2015–2035.
4–5
Kabisch, N., & Van Den Bosch, M. A. (2017). Urban Green Spaces and the Potential for
Health Improvement and Environmental Justice in a Changing Climate. In
Nature-Based Solutions to Climate Change Adaptation in Urban Areas (pp. 207-
220). Springer, Cham.
207
Kaiser, R., Le Tertre, A., Schwartz, J., Gotway, C. A., Daley, W. R., & Rubin, C. H.
(2007). The effect of the 1995 heat wave in Chicago on all-cause and cause-
specific mortality. American journal of public health, 97(Supplement_1), S158-
S162.
Kalisa, E., Fadlallah, S., Amani, M., Nahayo, L., & Habiyaremye, G. (2018).
Temperature and air pollution relationship during heatwaves in Birmingham, UK.
Sustainable cities and society, 43, 111-120.
Karjalainen, S. (2012). Thermal comfort and gender: a literature review. Indoor air,
22(2), 96-109.
Kenny, G. P., Yardley, J., Brown, C., Sigal, R. J., & Jay, O. (2010). Heat stress in older
individuals and patients with common chronic diseases. Cmaj, 182(10), 1053-
1060.
Kim, J., Schiavon, S., & Brager, G. (2018). Personal comfort models–A new paradigm in
thermal comfort for occupant-centric environmental control. Building and
Environment, 132, 114-124.
Kingsborough, A., Jenkins, K., & Hall, J. W. (2017). Development and appraisal of long
term adaptation pathways for managing heat-risk in London. Climate Risk
Management, 16, 73-92.
Klepeis, N. E., Bellettiere, J., Hughes, S. C., Nguyen, B., Berardi, V., Liles, S., ... &
Hovell, M. F. (2017). Fine particles in homes of predominantly low-income
families with children and smokers: Key physical and behavioral determinants to
inform indoor-air-quality interventions. PloS one, 12(5), e0177718.
Klepeis, N. E., Nelson, W. C., Ott, W. R., Robinson, J. P., Tsang, A. M., Switzer, P., ... &
Engelmann, W. H. (2001). The National Human Activity Pattern Survey
(NHAPS): a resource for assessing exposure to environmental pollutants. Journal
of Exposure Science and Environmental Epidemiology, 11(3), 231.
Klinenberg, E. (2015). Heat wave: A social autopsy of disaster in Chicago. University of
Chicago Press.
Knowlton, K., Lynn, B., Goldberg, R.A., Rosenzweig, C., Hogrefe, C., Rosenthal, J.K.,
& Kinney, P.L. (2007). Projecting heat-related mortality impacts under a
changing climate in the New York City Region. American Journal of Public
Health, 97(11), 2028-2034.
Kovats, R. S., & Hajat, S. (2008). Heat stress and public health: a critical review. Annu.
Rev. Public Health, 29, 41-55.
Kuras, E. R., Richardson, M. B., Calkins, M. M., Ebi, K. L., Hess, J. J., Kintziger, K. W.,
... & Uejio, C. K. (2017). Opportunities and challenges for personal heat exposure
research. Environmental health perspectives, 125(8), 085001.
Lam, C. K. C. (2014). Air pollution, heat and mortality in urban populations. Reinvention
Int J Undergrad Res, 7.
208
Langevin, J., Wen, J., & Gurian, P. L. (2016). Quantifying the human–building
interaction: Considering the active, adaptive occupant in building performance
simulation. Energy and Buildings, 117, 372-386.
Li, C., Hong, T., & Yan, D. (2014). An insight into actual energy use and its drivers in
high-performance buildings. Applied energy, 131, 394-410.
Liu, J., Dietz, T., Carpenter, S. R., Alberti, M., Folke, C., Moran, E., ... & Ostrom, E.
(2007). Complexity of coupled human and natural systems. science, 317(5844),
1513-1516.
Luber, G., & McGeehin, M. (2008). Climate change and extreme heat events. American
journal of preventive medicine, 35(5), 429-435.
Lundgren Kownacki, K., Gao, C., Kuklane, K., & Wierzbicka, A. (2019). Heat stress in
Indoor environments of Scandinavian urban areas: A literature review.
International journal of environmental research and public health, 16(4), 560.
Marinakis, V., Doukas, H., Karakosta, C., & Psarras, J. (2013). An integrated system for
buildings’ energy-efficient automation: Application in the tertiary sector. Applied
energy, 101, 6-14.
Mavrogianni, A., Taylor, J., Davies, M., Thoua, C., & Kolm-Murray, J. (2015). Urban
social housing resilience to excess summer heat. Building Research &
Information, 43(3), 316-333.
McGinnis, M., & Ostrom, E. (2014). Social-ecological system framework: initial changes
and continuing challenges. Ecology and Society, 19(2).
McPhearson, T., Pickett, S. T., Grimm, N. B., Niemelä, J., Alberti, M., Elmqvist, T., ... &
Qureshi, S. (2016). Advancing urban ecology toward a science of cities.
BioScience, 66(3), 198-212. ISO 690
Meehl, G. A., Tebaldi, C., Tilmes, S., Lamarque, J. F., Bates, S., Pendergrass, A., &
Lombardozzi, D. (2018). Future heat waves and surface ozone. Environmental
Research Letters, 13(6), 064004.
Mendes, A., Bonassi, S., Aguiar, L., Pereira, C., Neves, P., Silva, S., ... & Teixeira, J. P.
(2015). Indoor air quality and thermal comfort in elderly care centers. Urban
Climate, 14, 486-501.
Merlier, L., Frayssinet, L., Johannes, K., & Kuznik, F. (2019). On the impact of local
microclimate on building performance simulation. Part II: Effect of external
conditions on the dynamic thermal behavior of buildings. In Building Simulation
(pp. 1-11). Tsinghua University Press.
Miranda, M. L., Edwards, S. E., Keating, M. H., & Paul, C. J. (2011). Making the
209
environmental justice grade: the relative burden of air pollution exposure in the
United States. International journal of environmental research and public health,
8(6), 1755-1771.
Mohammad, S., & Shea, A. (2013). Performance evaluation of modern building thermal
envelope designs in the semi-arid continental climate of Tehran. Buildings, 3(4),
674-688.
Monnit Corporation. Monnit wireless infrared motion sensor. Retrieved from:
https://www.monnit.com/Products/Sensor/
Mues, A., Manders, A., Schaap, M., Kerschbaumer, A., Stern, R., & Builtjes, P. (2012).
Impact of the extreme meteorological conditions during the summer 2003 in
Europe on particulate matter concentrations. Atmospheric environment, 55, 377-
391.
Nahlik, M. J., Chester, M. V., Pincetl, S. S., Eisenman, D., Sivaraman, D., & English, P.
(2017). Building thermal performance, extreme heat, and climate change. Journal
of Infrastructure Systems, 23(3), 04016043.
National Oceanic and Atmospheric Administration (NOAA) (2009). National Weather
Service Glossary.
Neurio Technology. Neurio energy monitor. Retrieved from:
https://www.neur.io/energy-monitor/
New Jersey Department of Environmental Protection (NJDEP) (2017). NJ Air Quality
Report. Retrieved from:
http://njaqinow.net/App_Files/2017/2017%20NJ%20Air%20Monitoring%20Rep
ort.pdf
New Jersey Geographic Information Network (NJGIN) (2016). From
https://njgin.state.nj.us/NJ_NJGINExplorer/DataDownloads.jsp
New Jersey Health Initiatives (2017). from
https://www.njhi.org/projects/shaping-elizabeth-communityhealth-initiative/
Nowak, D. J., Crane, D. E., & Stevens, J. C. (2006). Air pollution removal by urban trees
and shrubs in the United States. Urban forestry & urban greening, 4(3-4), 115-
123.
O'Brien, W., & Gunay, H. B. (2014). The contextual factors contributing to occupants'
adaptive comfort behaviors in offices–A review and proposed modeling
framework. Building and Environment, 77, 77-87.
Occupational Safety and Health Administration (OSHA) (2017). Technical Manual
(OTM). From https://www.osha.gov/dts/osta/otm/otm_iii/otm_iii_2.html#1
O'Lenick, C. R., Wilhelmi, O. V., Michael, R., Hayden, M. H., Baniassadi, A.,
210
Wiedinmyer, C., ... & Sailor, D. J. (2019). Urban heat and air pollution: A
framework for integrating population vulnerability and indoor exposure in health
risk analyses. Science of The Total Environment, 660, 715-723.
Ostrom, E. (2009). A general framework for analyzing sustainability of social-ecological
systems. Science, 325(5939), 419-422.
Papanastasiou, D. K., Melas, D., & Kambezidis, H. D. (2015). Air quality and thermal
comfort levels under extreme hot weather. Atmospheric research, 152, 4-13.
Park, J. S., & Kim, H. J. (2012). A field study of occupant behavior and energy
consumption in apartments with mechanical ventilation. Energy and buildings, 50,
19-25.
Park, J. Y., & Nagy, Z. (2018). Comprehensive analysis of the relationship between
thermal comfort and building control research-A data-driven literature review.
Renewable and Sustainable Energy Reviews, 82, 2664-2679.
Parsaee, M., Joybari, M. M., Mirzaei, P. A., & Haghighat, F. (2019). Urban heat island,
urban climate maps and urban development policies and action plans.
Environmental technology & innovation, 100341.
Patel, D., Jian, L., Xiao, J., Jansz, J., Yun, G., & Robertson, A. (2019). Joint effect of
heatwaves and air quality on emergency department attendances for vulnerable
population in Perth, Western Australia, 2006 to 2015. Environmental research,
174, 80-87.
Peng, Y., Nagy, Z., & Schlüter, A. (2019). Temperature-preference learning with neural
networks for occupant-centric building indoor climate controls. Building and
Environment, 154, 296-308.
Peterson, T. C., Karl, T. R., Kossin, J. P., Kunkel, K. E., Lawrimore, J. H., McMahon, J.
R., ... & Yin, X. (2014). Changes in weather and climate extremes: state of
knowledge relevant to air and water quality in the United States. Journal of the
Air & Waste Management Association, 64(2), 184-197.
Phadke, R., Manning, C., & Burlager, S. (2015). Making it personal: Diversity and
deliberation in climate adaptation planning. Climate Risk Management, 9, 62-76.
Qin, H., Hong, B., Jiang, R., Yan, S., & Zhou, Y. (2019). The Effect of Vegetation
Enhancement on Particulate Pollution Reduction: CFD Simulations in an Urban
Park. Forests, 10(5), 373.
Quinn, A., Kinney, P., & Shaman, J. (2017). Predictors of summertime heat index levels
in New York City apartments. Indoor air, 27(4), 840-851.
Quinn, A., Tamerius, J. D., Perzanowski, M., Jacobson, J. S., Goldstein, I., Acosta, L., &
Shaman, J. (2014). Predicting indoor heat exposure risk during extreme heat
events. Science of the total environment, 490, 686-693.
211
Rainham, D. G., & Smoyer-Tomic, K. E. (2003). The role of air pollution in the
relationship between a heat stress index and human mortality in Toronto.
Environmental research, 93(1), 9-19.
Ramaswami, A., Weible, C., Main, D., Heikkila, T., Siddiki, S., Duvall, A., Bernard, M. .
(2012). A Social‐Ecological‐Infrastructural Systems Framework for
Interdisciplinary Study of Sustainable City Systems. Journal of Industrial
Ecology, 16(6), 801-813.
Reid, C. E., O’neill, M. S., Gronlund, C. J., Brines, S. J., Brown, D. G., Diez-Roux, A.
V., & Schwartz, J. (2009). Mapping community determinants of heat
vulnerability. Environmental health perspectives, 117(11), 1730-1736.
Robinson, P. J. (2001). On the definition of a heat wave. Journal of applied Meteorology,
40(4), 762-775.
Robinson, D. A. (2009). Cool and Stormy: July 2009 Overview.
Rosenthal, J. K. (2010). Evaluating the impact of the urban heat island on public health:
Spatial and social determinants of heat-related mortality in New York City
Columbia University, New York, NY.
Rothfusz, L. P. (1990). The heat index equation. National Weather Service Technical
Attachment (SR 90–23).
Sailor, D. J., Baniassadi, A., O’Lenick, C. R., & Wilhelmi, O. V. (2019). The growing
threat of heat disasters. Environmental Research Letters, 14(5), 054006.
Sarrat, C., Lemonsu, A., Masson, V., & Guedalia, D. (2006). Impact of urban heat island
on regional atmospheric pollution. Atmospheric Environment, 40(10), 1743-1758.
Scortichini, M., De Sario, M., de’Donato, F., Davoli, M., Michelozzi, P., & Stafoggia, M.
(2018). Short-Term Effects of Heat on Mortality and Effect Modification by Air
Pollution in 25 Italian Cities. International journal of environmental research and
public health, 15(8), 1771.
Schweiker, M., Ampatzi, E., Andargie, M. S., Andersen, R. K., Azar, E., Barthelmes, V.
M., ... & Edappilly, L. P. (2020). Review of multi‐domain approaches to indoor
environmental perception and behaviour. Building and Environment, 106804.
Semenza, J. C., Rubin, C. H., Falter, K. H., Selanikio, J. D., Flanders, W. D., Howe, H.
L., & Wilhelm, J. L. (1996). Heat-related deaths during the July 1995 heat wave
in Chicago. New England journal of medicine, 335(2), 84-90.
Sera, F., Armstrong, B., Tobias, A., Vicedo-Cabrera, A. M., Åström, C., Bell, M. L., ... &
Dang, T. N. (2019). How urban characteristics affect vulnerability to heat and
cold: a multi-country analysis. International journal of epidemiology.
Spalt, E. W., Curl, C. L., Allen, R. W., Cohen, M., Adar, S. D., Stukovsky, K. H., ... &
212
Kaufman, J. D. (2016). Time–location patterns of a diverse population of older
adults: the Multi-Ethnic Study of Atherosclerosis and Air Pollution (MESA Air).
Journal of Exposure Science and Environmental Epidemiology, 26(4), 349.
Srivastava, A., & Jain, V. K. (2003). Relationships between indoor and outdoor air
quality in Delhi. Indoor and Built Environment, 12(3), 159-165.
State of NJ v. US Environmental Protection, 626 F.2d 1038 (D.C. Cir. 1980).
Steeneveld, G. J., Klompmaker, J. O., Groen, R. J., & Holtslag, A. A. (2018). An urban
climate assessment and management tool for combined heat and air quality
judgements at neighbourhood scales. Resources, Conservation And Recycling,
132, 204-217.
Stojanovic, T., McNae, H., Tett, P., Reis, J., Smith, H. D., & Dillingham, I. (2016). The
“social” aspect of social-ecological systems: a critique of analytical frameworks
and findings from a multisite study of coastal sustainability. Ecology and Society.
Stone, B., Vargo, J., & Habeeb, D. . (2012). Managing climate change in cities: will
climate action plans work? Landscape and Urban Planning, 107(3), 263-271.
Stone Jr, B., Vargo, J., Liu, P., Habeeb, D., DeLucia, A., Trail, M., ... & Russell, A.
(2014). Avoided heat-related mortality through climate adaptation strategies in
three US cities. PloS one, 9(6), e100852.
Sugiyama, T., & Thompson, C. W. (2007). Outdoor environments, activity and the well
being of older people: conceptualising environmental support. Environment and
Planning A, 39(8), 1943-1960.
Sundell, J. (2017). Reflections on the history of indoor air science, focusing on the last 50
years. Indoor Air, 27(4), 708-724.
Taylor, J., Shrubsole, C., Davies, M., Biddulph, P., Das, P., Hamilton, I., ... &
Oikonomou, E. (2014). The modifying effect of the building envelope on
population exposure to PM 2.5 from outdoor sources. Indoor Air, 24(6), 639-651.
Terés-Zubiaga, J., Martín, K., Erkoreka, A., & Sala, J. M. (2013). Field assessment of
thermal behaviour of social housing apartments in Bilbao, Northern Spain. Energy
and Buildings, 67, 118-135.
Tessum, C. W., Apte, J. S., Goodkind, A. L., Muller, N. Z., Mullins, K. A., Paolella, D.
A., ... & Hill, J. D. (2019). Inequity in consumption of goods and services adds to
racial–ethnic disparities in air pollution exposure. Proceedings of the National
Academy of Sciences, 116(13), 6001-6006.
Thomas, N., Calderόn, L., Senick, J., Sorensen Allacci, M., Plotnik, D., Guo, M., ... &
Mainelis, G. (2019). Application of three different data streams to study building
deficiencies, indoor air quality, and residents’ health.
Tressol, M., Ordonez, C., Zbinden, R., Brioude, J., Thouret, V., Mari, C., ... & Volz
213
Thomas, A. (2008). Air pollution during the 2003 European heat wave as seen by
MOZAIC airliners. Atmospheric Chemistry and Physics, 8(8), 2133-2150.
TSI Inc. IAQ 7545. Retrieved from:
https://tsi.com/products/indoor-air-quality-meters-instruments/indoor-air-quality-
meters/
Tsoulou, I., Andrews, C. J., He, R., Mainelis, G., & Senick, J. (2020). Summertime
thermal conditions and senior resident behaviors in public housing: A case study
in Elizabeth, NJ, USA. Building and Environment, 168, 106411.
Ubisense. SmartSpace. Retrieved from: https://ubisense.com/smartspace/
Urso, P., Cattaneo, A., Garramone, G., Peruzzo, C., Cavallo, D. M., & Carrer, P. (2015).
Identification of particulate matter determinants in residential homes. Building
and Environment, 86, 61-69.
US Energy Information Administration (EIA) (2015). Residential Energy Consumption
Survey (RECS). From https://www.eia.gov/consumption/residential/data/2015/
US Census Bureau, 2015. From
https://factfinder.census.gov/faces/nav/jsf/pages/index.xhtml.
Vandentorren, S., Bretin, P., Zeghnoun, A., Mandereau-Bruno, L., Croisier, A., Cochet,
C., ... & Ledrans, M. (2006). August 2003 heat wave in France: risk factors for
death of elderly people living at home. The European Journal of Public Health,
16(6), 583-591.
van Hooff, T., Blocken, B., Timmermans, H. J. P., & Hensen, J. L. M. (2016). Analysis
of the predicted effect of passive climate adaptation measures on energy demand
for cooling and heating in a residential building. Energy, 94, 811-820.
Van Holle, V., Van Cauwenberg, J., Van Dyck, D., Deforche, B., Van de Weghe, N., &
De Bourdeaudhuij, I. (2014). Relationship between neighborhood walkability and
older adults’ physical activity: results from the Belgian Environmental Physical
Activity Study in Seniors (BEPAS Seniors). International journal of behavioral
nutrition and physical activity, 11(1), 110.
Veselý, M., & Zeiler, W. (2014). Personalized conditioning and its impact on thermal
comfort and energy performance–A review. Renewable and Sustainable Energy
Reviews, 34, 401-408.
Vogt, J. M., Epstein, G. B., Mincey, S. K., Fischer, B. C., & McCord, P. (2015). Putting
the" E" in SES: unpacking the ecology in the Ostrom social-ecological system
framework. Ecology and Society, 20(1).
Walikewitz, N., Jänicke, B., Langner, M., & Endlicher, W. (2018). Assessment of indoor
heat stress variability in summer and during heat warnings: a case study using the
UTCI in Berlin, Germany. International journal of biometeorology, 62(1), 29-42.
214
Whyte, W. H. (1980). The social life of small urban spaces.
Wilkinson, C. (2012). Social-ecological resilience: Insights and issues for planning
theory. Planning Theory, 11(2), 148-169.
World Health Organization (WHO) (2014). Ambient (outdoor) Air Quality and Health.
Retrieved from: http://www.who.int/mediacentre/factsheets/fs313/en
World Health Organization (WHO) (2013). Health effects of particulate matter. Policy
implications for countries in Eastern Europe, Caucasus and Central Asia.
Copenhagen, Denmark: WHO, Regional Office for Europe. Retrieved from:
http://www.euro.who.int/__data/assets/pdf_file/0006/189051/Health-effects-of-
particulatematter-final-Eng.pdf
Yardley, J., Sigal, R. J., & Kenny, G. P. (2011). Heat health planning: The importance of
social and community factors. Global Environmental Change, 21(2), 670-679.
Ye, W., Zhang, X., Gao, J., Cao, G., Zhou, X., & Su, X. (2017). Indoor air pollutants,
ventilation rate determinants and potential control strategies in Chinese dwellings:
A literature review. Science of the Total Environment, 586, 696-729.
Yim, S. H. L., Hou, X., Guo, J., & Yang, Y. (2019). Contribution of local emissions and
transboundary air pollution to air quality in Hong Kong during El Niño-Southern
Oscillation and heatwaves. Atmospheric Research, 218, 50-58.
Yin, S., Shen, Z., Zhou, P., Zou, X., Che, S., & Wang, W. (2011). Quantifying air
pollution attenuation within urban parks: An experimental approach in Shanghai,
China. Environmental pollution, 159(8-9), 2155-2163.
Zanobetti, A., O'neill, M. S., Gronlund, C. J., & Schwartz, J. D. (2012). Summer
temperature variability and long-term survival among elderly people with chronic
disease. Proceedings of the National Academy of Sciences, 109(17), 6608-6613.
Ziter, C. D., Pedersen, E. J., Kucharik, C. J., & Turner, M. G. (2019). Scale-dependent
interactions between tree canopy cover and impervious surfaces reduce daytime
urban heat during summer. Proceedings of the National Academy of Sciences,
116(15), 7575-7580.