2021 Interim Daksh Gupta Results Presentation Chief ...
30
2021 Interim Results Presentation Daksh Gupta Chief Executive Officer Richard Blumberger Chief Financial Officer 10 th August 2021 RECOGNISING THAT PEOPLE ARE AT THE HEART OF OUR SUCCESS PUTTING OUR CUSTOMERS ABOVE ALL ELSE SINCE 1909
Transcript of 2021 Interim Daksh Gupta Results Presentation Chief ...

2021 Interim Results Presentation
Daksh GuptaChief Executive Officer
Richard BlumbergerChief Financial Officer10th August 2021
RECOGNISING THAT PEOPLE ARE AT THE HEART OF OUR SUCCESS
PUTTING OUR CUSTOMERS ABOVE ALL ELSE SINCE 1909
2
ProfessorRichard Parry-Jones CBE
1951 - 2021

3
Agenda• H1 key operational and financial metrics, market overview, business initiatives and strategic growth
– Daksh Gupta
• Financial review
– Richard Blumberger
• Current trading and outlook, and summary
– Daksh Gupta
• Q&A
RECOGNISING THAT PEOPLE ARE AT THE HEART OF OUR SUCCESS
PUTTING OUR CUSTOMERS ABOVE ALL ELSE SINCE 1909
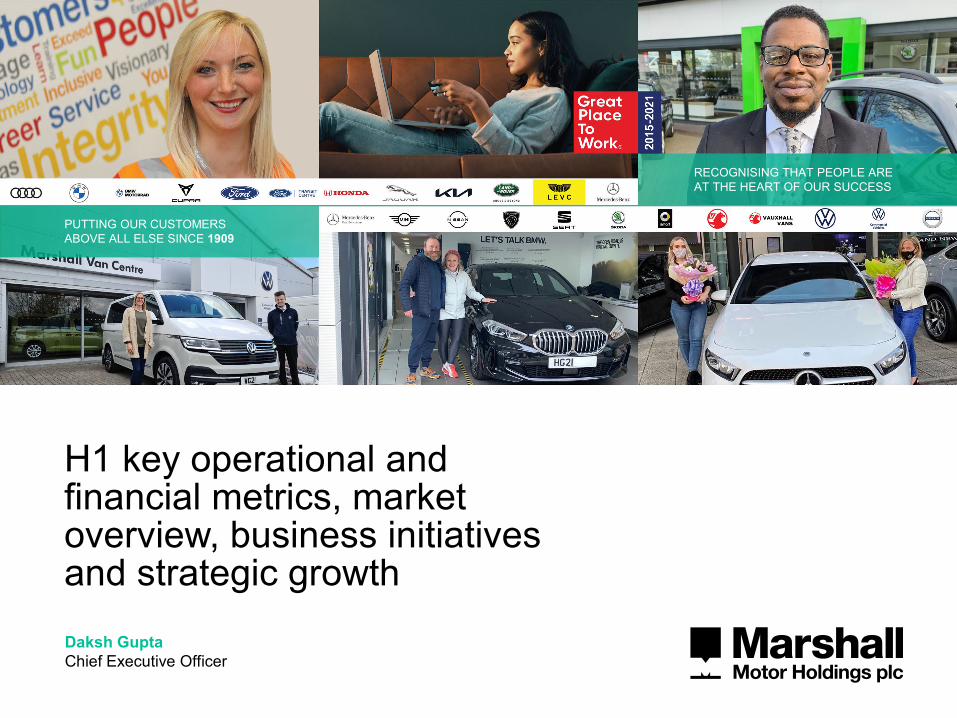
H1 key operational and financial metrics, market overview, business initiatives and strategic growthDaksh GuptaChief Executive Officer

5
Exceptional market dynamics, strong outperformance and dividend restored
(1) Reported underlying; (2) Non GAAP measure that excludes IFRS 16-related lease liabilities; (3) Like-for-like (includes group businesses or activities that have been active or trading for a period of 12 consecutive months and excludes businesses or activities that do not have 12 months trading activity); (4) SMMT registrations which includes impact of dealer self-registration activity; (5) Auto Trader ‘Proxy Sold’ used car transactions which estimates number of cars sold on their platform based on timing of when adverts are removed
REPORTEDREVENUE
£1,334.1m
H1 20: £895.3m 49%
H1 19: £1,183.3m 13%
GROSSPROFIT % (1)
11.8%H1 20: 10.6%H1 19: 11.4%
PROFIT / (LOSS) BEFORE TAX (1)
£38.4mH1 20: (£11.8m)H1 19: £15.2m
LFL NEW RETAIL UNITS(3)
+36.0%
LFL FLEET UNITS(3)
+64.5%
LFL USED UNITS(3)
+51.7%
LFL AFTERSALES REVENUE(3)
+34.8%vs market +30.6%(4) vs market +47.3%(4) vs market +31.1%(5)
A D J U S T E DN E T
C A S H ( 2 )
£57.2m
L E V E R A G E
Nil
H1 20: £27.4m H1 20: Nil
H1 19: £5.8m H1 19: Nil
+46.1%vs market +39.2%(4)
LFL TOTAL NEW UNITS(3)
N E T A S S E T S
£239.3m
H1 20: £190.5m
H1 19: £200.7m
D I V I D E N D
8.86p
H1 20: Nil
H1 19: 2.85p
6
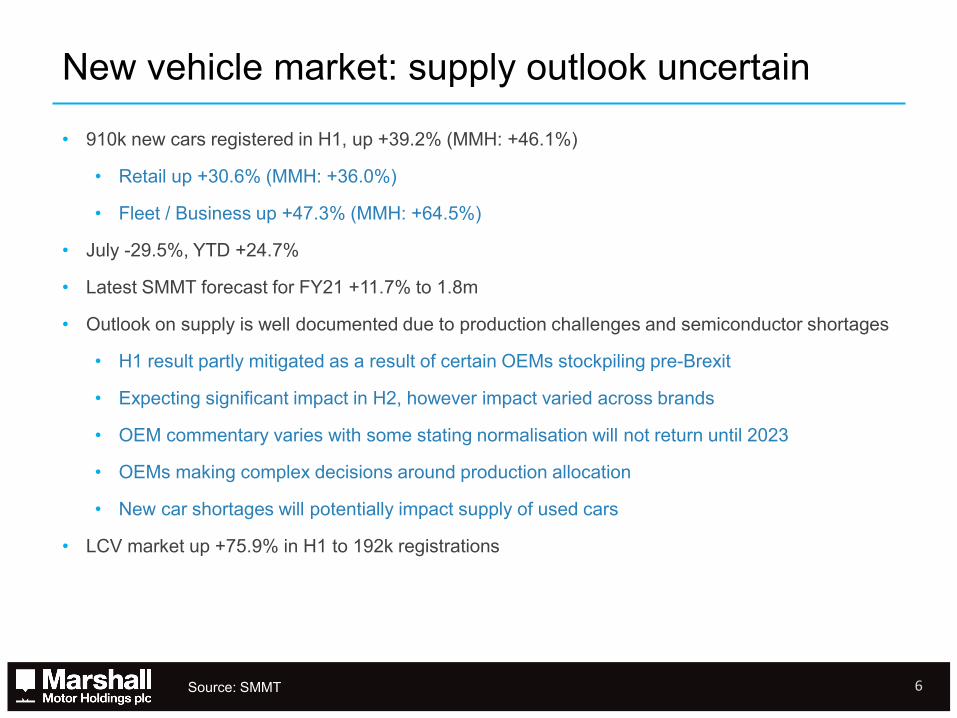
New vehicle market: supply outlook uncertain
• 910k new cars registered in H1, up +39.2% (MMH: +46.1%)
• Retail up +30.6% (MMH: +36.0%)
• Fleet / Business up +47.3% (MMH: +64.5%)
• July -29.5%, YTD +24.7%
• Latest SMMT forecast for FY21 +11.7% to 1.8m
• Outlook on supply is well documented due to production challenges and semiconductor shortages
• H1 result partly mitigated as a result of certain OEMs stockpiling pre-Brexit
• Expecting significant impact in H2, however impact varied across brands
• OEM commentary varies with some stating normalisation will not return until 2023
• OEMs making complex decisions around production allocation
• New car shortages will potentially impact supply of used cars
• LCV market up +75.9% in H1 to 192k registrations
Source: SMMT
7
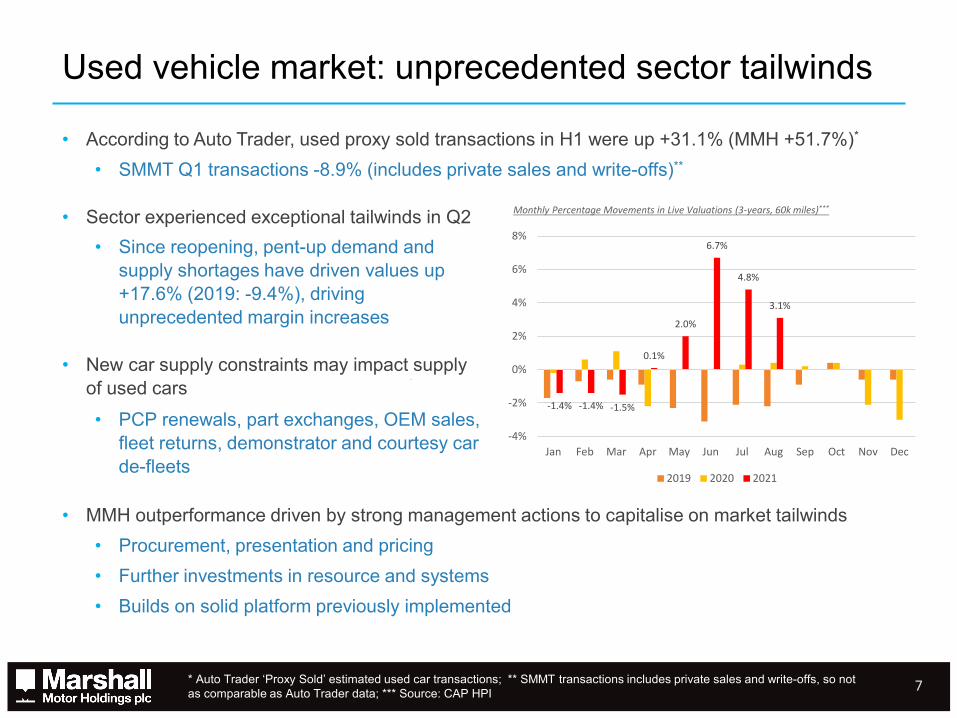
Used vehicle market: unprecedented sector tailwinds
* Auto Trader ‘Proxy Sold’ estimated used car transactions; ** SMMT transactions includes private sales and write-offs, so not as comparable as Auto Trader data; *** Source: CAP HPI
• According to Auto Trader, used proxy sold transactions in H1 were up +31.1% (MMH +51.7%)*
• SMMT Q1 transactions -8.9% (includes private sales and write-offs)**
• MMH outperformance driven by strong management actions to capitalise on market tailwinds• Procurement, presentation and pricing• Further investments in resource and systems• Builds on solid platform previously implemented
-1.4% -1.4% -1.5%
0.1%
2.0%
6.7%
4.8%
3.1%
-4%
-2%
0%
2%
4%
6%
8%
Jan Feb Mar Apr May Jun Jul Aug Sep Oct Nov Dec
2019 2020 2021
Monthly Percentage Movements in Live Valuations (3-years, 60k miles)***
• Sector experienced exceptional tailwinds in Q2• Since reopening, pent-up demand and
supply shortages have driven values up +17.6% (2019: -9.4%), driving unprecedented margin increases
• New car supply constraints may impact supply of used cars• PCP renewals, part exchanges, OEM sales,
fleet returns, demonstrator and courtesy car de-fleets

8
Continual strengthening of our digital assets
Market share growth fuelled by MMH’s unique positioning
Marshall well placed to capitalise from omni-channel retailing due to strong digital and physical assets
Competitive advantage from existing physical infrastructure
• Marshall.co.uk – 5.3m visitors (FY 20: 6m), with 17.3m page views (FY 20: 24.3m)
• Increased functionality and usability supported by 24/7 Live Chat
• Click and collect services
• Reserve online for only £99
• Nationwide delivery or collect from brand centre
• Contactless experience and purchase
• Enhanced photo imaging and video presentation
• Online service booking facilities
• Service plan buy-online feature
• Marshall.co.uk/Buy-Your-Car
• Strong social media presence
• Strength of the Marshall brand – 111 years of trading
• 14 Day Money Back Guarantee – enhanced customer experience, trust and transparency
• Nationwide presence – 29 counties, with over 83% of the country within an hour of a Marshall business
• 116 brand centres representing 22 key partners
• Access to new car sales, which generate used car stock and contributes 27.2% of gross profit
• c.16,000 vehicles in stock, competitively priced as a result of M Control in Phoenix, our in-house developed system
• Manufacturer approved used cars
• Genuine parts fitted by manufacturer trained technicians
• Minimum 12 month warranty and breakdown cover
• Marshall 24/7 accident aftercare
• Fixed-rate, haggle-free finance options, often sub-vented by Brand partners
• PCPs effectively act as a subscription model
• Many with free service plans enabling aftersales retention
• Aftersales accounts for 40.1% of gross profit
New website will provide full omni-channel experience as well as customer personalisation

9
Continual investment in our brand Marshall.co.uk30 Premier
League matches on Sky TV (feat.
top 6 clubs)
12 cup games on ITV and BBC
Every home game for 11
selected Championship
clubs
Minimum 86 live televised matches
Investment continues in premiership football, EFL, FA cup, darts, with an expected viewing audience of over 100m+ people

10
UK used car market – MMH’s unique positioning
• Number of new entrants
• Marketplace worth over £100bn* with c.8m transactions per year**
• MMH already has a strong platform in place
• Strong online digital assets
• Existing well-invested physical infrastructure to support our online proposition
• Nationwide presence and brand awareness
• Excellent reputation for customer service
• OEM relationships key
• MMH continues to increase market share; from 2017 to 2020 MMH has outperformed the used car market on a like-for-like basis by 17.2%** and 20.6%*** in the first half of 2021
• Margin performance enhanced by our unique in-house system capability
• Data and technology at the heart of MMH business
• Confidence for the future
* OC&C estimate for UK retail used car market in 2019; ** SMMT used car transaction data; *** Auto Trader market data 10

11
Long track record of successful M&A in the core business
*Start-up
EXIT
S
EXIT OF 46 NON-CORE, SUBSCALE OR LOSS MAKING OPERATIONS
2010 2011 2012 2013 2014 2015 2016 2017
CO
RPO
RAT
E
2009
ACQ
UIS
ITIO
NS
/ STA
RTU
PS
2018 2019
2 TRANSACTIONS& 4 START-UPS
2 TRANSACTIONS & 1 START-UP
2 TRANSACTIONS
2 TRANSACTIONS
2 TRANSACTIONS
3 TRANSACTIONS & 1 START-UP
1TRANSACTION
1TRANSACTION
1TRANSACTION & 1 START-UP
5 TRANSACTIONS & 3 START-UPS
1TRANSACTION& 2 START-UPS
1ST
GERMAN BRANDADDED
MERCEDES-BENZ
2020
2ND
GERMAN BRANDADDED
VOLKSWAGEN
3RD
GERMAN BRANDADDED
AUDI
4TH
GERMAN BRANDADDED
BMW MMH LISTSON THE LSE
STRATEGICEXIT FROMMARSHALLLEASING
Ridgeway integration
£75m capex investment
Leasing disposal
Balance sheet strengthened
*
*
*
**
*
*
*
*
*
*
2 TRANSACTIONS
2021

12
Strategic growth: Jaguar Land Rover acquisition
• Completed acquisition of Cheltenham & Gloucester Jaguar Land Rover at the end of May
• Opportunity sponsored by the brand
• In line with stated strategy to grow scale with existing brand partners and extend geographic footprint
• Acquisition extends MMH national coverage to 29 counties
• MMH strong relationship and track record with Jaguar Land Rover. In 2020 ranked number 1 and 2 retailer for Jaguar and Land Rover respectively
• Now representing 9 Land Rover and 7 Jaguar retail centres
• MMH top 3 volume for Jaguar Land Rover
• Historically very significantly loss making
• New site will undergo redevelopment to a new ‘arch’ concept facility in due course
• Currently located in leasehold premises in Cheltenham
• Freehold land purchased for £4.5m
• Entire Jaguar Land Rover portfolio is owned on freehold / long leasehold basis
Lincoln
Melton
Peterborough
Cambridge
Ipswich
Cheltenham& Gloucester
Oxford
Newbury
Bedford

13
Strategic growth: Nissan Leicester acquisition
• Completed acquisition of Nissan Leicester at the end of June
• Opportunity sponsored by the brand
• In line with stated strategy to grow scale with existing brand partners and extend geographic footprint
• Now representing 3 Nissan retail centres
• Contiguous to existing dealerships in Grantham and Lincoln
• A territory we know very well as already represented there
• Historically significantly loss making
• Group performs strongly with brand, Marshall ranked top 3 dealer group
• The acquisition includes the purchase of a three-acre freehold site for £3m
Lincoln
Grantham
Leicester

14
Strategic growth: Further portfolio investmentSouth East London Audi consolidation• 3 sites currently covering territory
• New sales in Beckenham, used sales in Sydenham, aftersales in Bromley
• Off-market transaction to acquire former Vauxhall freehold site for £4.7m
• Combination unlocks significant operational efficiencies, increases capacity, drives synergies and enhances customer experience
• Will dispose of 2 freeholds in prime South East London territories
Other investments• Acquired freehold bodyshop in Swavesey, north of Cambridge, for
£1.8m, to combine existing operations in Cambridge and Peterborough
• New freehold replaces two leasehold properties and removes existing lease liabilities of £105k per annum
• Combination will unlock significant operational efficiencies, increase capacity and drive synergies
• Protects prime land in Cambridge for future retail operations
• Exchanged to acquire freehold for South Lakes Mercedes Benz for purchase price of £1.3m
• Removes existing lease liability of £96k per annum
Beckenham Audi
Bromley Audiservice centre
Sydenham AudiApproved used cars
New site location
14

15
Business initiatives: investment in LCV strategy
• LCV market up +75.9% in H1 to 192k registrations
• MMH represents 12 standalone CV franchises
• 6 Volkswagen, 4 Mercedes Benz, 2 Ford
• MMH also sells CV from 7 passenger car operations
• 3 Peugeot, 2 Nissan, 2 Vauxhall
• Combined market share of MMH’s 6 CV brands is 73.8%
• A number of key appointments made including Group CV Director
• Whilst strategy still early, focus has driven positive year-on-year growth
• Opportunity to leverage existing infrastructure

16
7th year running ranked as a UK best workplace
MMH score79%
vs benchmark
65%
12thBest UK
workplace
11 YearsRunning
GPTW status
7 YearsRunning ranked
UK best workplaces
No.1Automotive
employer and retailer employer across all sectors
11th consecutive year of Great Place to Work status 7th year running ranked as a UK best workplace
Strong culture of doing the right thing
Commitment to voluntarily paying back CJRS and retail grants (c.£4m)
Awarded backdated pay increases of up to 4% in the lower earning brackets
‘Thank you’ bonuses paid to all colleagues except Directors
Board and Executive Committee took pay cuts through 2020
Executive Committee declined 2020 bonuses
Strong focus on health and safety and ESG (see appendix)
Over £1m invested in PPE since start of pandemic. COVID-19 secure guidelines to remain in place in order to protect our people and customers
Update on strategic initiatives Our in-house recruitment team has received 30,936
applications and generated over £1m saving in recruitment fees

RECOGNISING THAT PEOPLE ARE AT THE HEART OF OUR SUCCESS
PUTTING OUR CUSTOMERS ABOVE ALL ELSE SINCE 1909
Financial reviewRichard BlumbergerChief Financial Officer
18
Record H1 2021
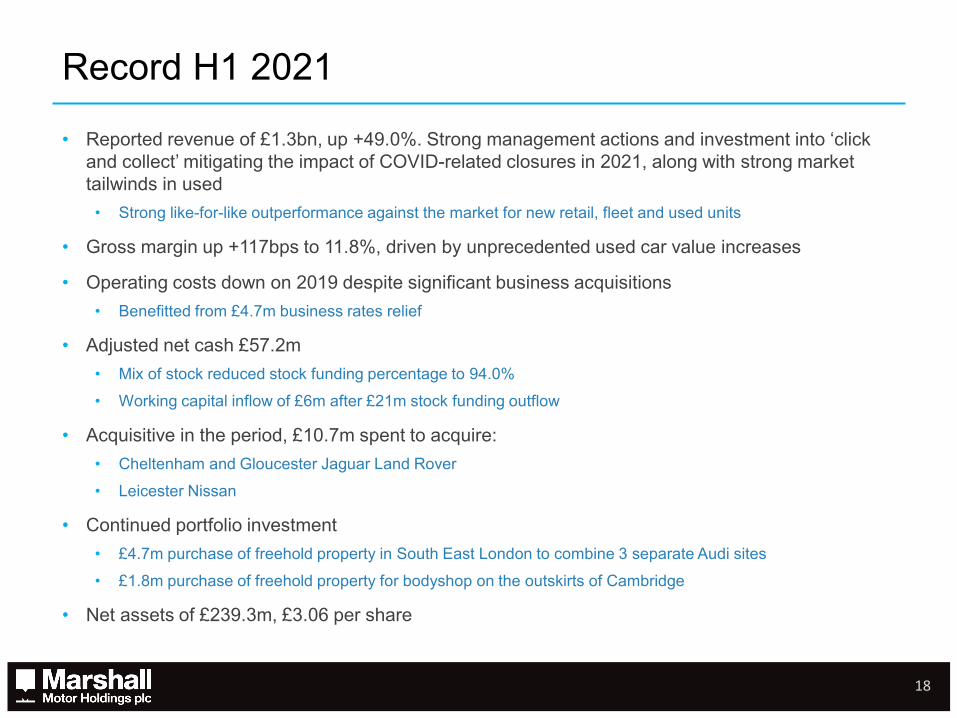
• Reported revenue of £1.3bn, up +49.0%. Strong management actions and investment into ‘click and collect’ mitigating the impact of COVID-related closures in 2021, along with strong market tailwinds in used• Strong like-for-like outperformance against the market for new retail, fleet and used units
• Gross margin up +117bps to 11.8%, driven by unprecedented used car value increases
• Operating costs down on 2019 despite significant business acquisitions• Benefitted from £4.7m business rates relief
• Adjusted net cash £57.2m• Mix of stock reduced stock funding percentage to 94.0%• Working capital inflow of £6m after £21m stock funding outflow
• Acquisitive in the period, £10.7m spent to acquire:• Cheltenham and Gloucester Jaguar Land Rover• Leicester Nissan
• Continued portfolio investment• £4.7m purchase of freehold property in South East London to combine 3 separate Audi sites• £1.8m purchase of freehold property for bodyshop on the outskirts of Cambridge
• Net assets of £239.3m, £3.06 per share
19
H1 2021 financial summary
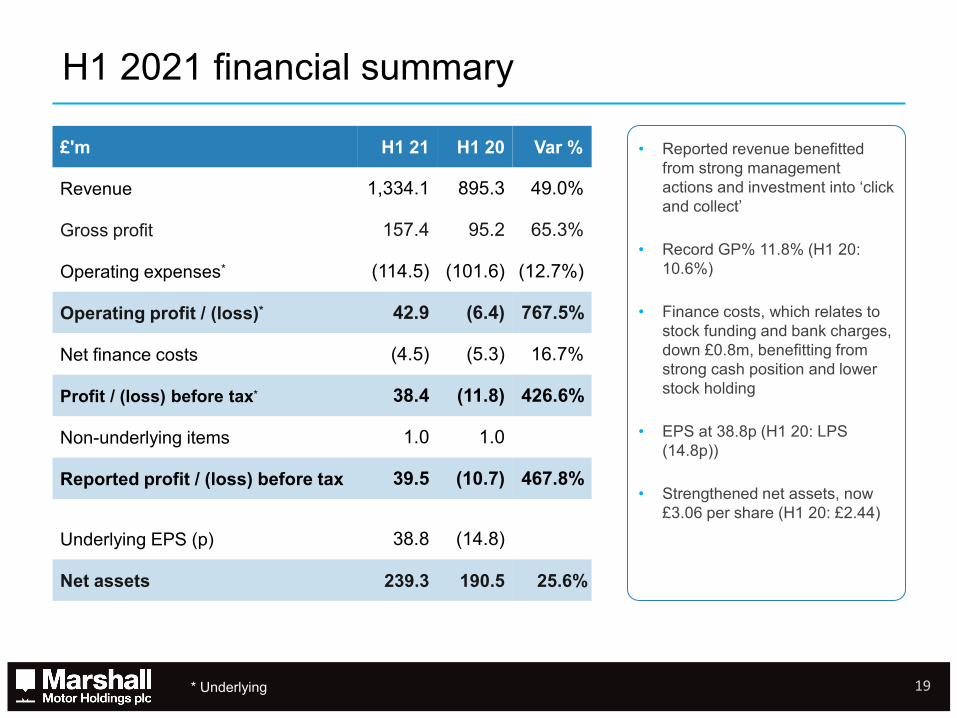
• Reported revenue benefitted from strong management actions and investment into ‘click and collect’
• Record GP% 11.8% (H1 20: 10.6%)
• Finance costs, which relates to stock funding and bank charges, down £0.8m, benefitting from strong cash position and lower stock holding
• EPS at 38.8p (H1 20: LPS (14.8p))
• Strengthened net assets, now £3.06 per share (H1 20: £2.44)
£'m H1 21 H1 20 Var %
Revenue 1,334.1 895.3 49.0%
Gross profit 157.4 95.2 65.3%
Operating expenses* (114.5) (101.6) (12.7%)
Operating profit / (loss)* 42.9 (6.4) 767.5%
Net finance costs (4.5) (5.3) 16.7%
Profit / (loss) before tax* 38.4 (11.8) 426.6%
Non-underlying items 1.0 1.0
Reported profit / (loss) before tax 39.5 (10.7) 467.8%
Underlying EPS (p) 38.8 (14.8)
Net assets 239.3 190.5 25.6%
* Underlying

20
Like-for-like unit sales H1 21 H1 20 Var
New retail 15,315 11,262 36.0%
Fleet 10,225 6,214 64.5%
New 25,540 17,476 46.1%
Used 27,467 18,106 51.7%
Total 53,007 35,582 49.0%
Market outperformance
Like-for-like revenue (£m)
H1 21 mix * H1 20 mix * Var
New 604.8 45% 410.2 46% 47.4%
Used 607.3 45% 388.4 43% 56.3%
AFS 130.6 10% 96.9 11% 34.8%
Other (27.3) (17.9)
Total 1,315.3 877.6 49.9%
• Strong market tailwinds, but new retail unit sales not returned to 2019 levels
• Market outperformance in both new and used vehicle sales
• Increased used to new retail car ratio of 1.8 (H1 20: 1.6)
Market YoY var Outperformance
New retail 30.6% 5.4%
New fleet 47.3% 17.2%
New total 39.2% 6.9%
Used 31.1% 20.6%
* Excludes internal sales

21
Like-for-likegross profit (£m) H1 21 mix * H1 20 mix * Var
New 41.6 27% 25.2 27% 64.8%
Used 52.4 34% 24.1 26% 117.8%
AFS 61.0 39% 43.9 47% 38.9%
Other 0.2 0.5
Total 155.3 93.7 65.7%
Gross profit% H1 21 H1 20 Var
New 6.9% 6.0% 85 bps
Used 8.6% 6.1% 246 bps
AFS 46.8% 45.0% 171 bps
Total 11.8% 10.6% 116 bps
Record margins
• New margins year on year benefiting from reduced manufacturer bonuses in 2020 due to lockdown
• Record used car margins benefitting from strong market tailwinds
• Aftersales increased mix of service revenue
* Excludes internal sales

22
H1 benefitted from large one-off items

23
£m H1 21 FY 20 H1 20New stock 116.3 205.5 264.8Used stock 176.0 153.5 128.8
Continued strengthening balance sheet
• Continued investment resulting in strong freehold and building of £139.6m
• Total inventory down £91.0m versus H1 20
• Good used car stock availability
• Used inventory up £23.7m versus H1 20 on like-for-like basis
• Total vehicle funding £291.5m (stock funding at 94.0%), of which £129.9m relates to used cars
• Continued improvement of used car stock turn 9.6* (H1 20: 9.3)
• Net assets of £239.3m, £3.06 per share
* Stock turn calculated based on cost of sales
£m H1 21 FY 20 H1 20Goodwill and intangibles 120.3 119.5 119.2Freehold land and buildings 139.2 125.8 123.9Right-of-use assets 93.1 98.8 104.2Other 32.2 35.3 38.8Fixed assets 384.9 379.5 386.1Inventory 310.2 362.9 401.2Trade / other receivables 98.7 65.8 96.8Cash & equivalents 61.9 33.8 32.7Other assets - 1.0 0.3Current assets 470.8 463.5 531.0Vehicle funding (291.5) (364.9) (398.6)Trade / other payables (189.5) (132.4) (193.5)Lease liabilities (92.4) (99.3) (104.8)Bank / other debt (4.7) (5.0) (5.3)Other liabilities (38.3) (25.4) (24.3)Total liabilities (616.4) (627.1) (726.6)Net assets 239.3 215.9 190.5

24
Adjusted net cash of £57.2m, an increase of £28.4m
* Excluding IFRS 16; Reported underlying EBITDA is £53.8m
Investing andfinancing activities
Net cash inflow fromoperating activities

25
Full year 2021 guidance items
• Expecting full year 2021 underlying profit before tax will be no less than £40.0m, after repaying c.£4m of CJRS payments and retail grants
• Continued new car supply disruption expected for the remainder of the year and at least into 2022, which could impact used car supply
• Used car margins expected to normalise during Q4
• Interim dividend 8.86p
• Full year dividend split 2/3rd interim and 1/3rd final, recognising heavily biased first half profit
• Dividend policy has been progressive since IPO, however disrupted by the pandemic. The Board intends to reset and reinstate the policy from 2022
• Dividend cover will remain between 2.5 to 3.5 underlying earnings
• 2021 finance costs, principally relating to stock funding and bank charges £9m - £11m
• 2021 capital expenditure (excluding freehold purchases at H1) £15m - £17m
• 2021 effective tax rate around 21 - 22%
• Rates benefit capped at £2.0m for H2 (H1 2021: £4.7m)

RECOGNISING THAT PEOPLE ARE AT THE HEART OF OUR SUCCESS
PUTTING OUR CUSTOMERS ABOVE ALL ELSE SINCE 1909
Current trading and outlook, and summaryDaksh GuptaChief Executive Officer

27
Current trading and outlook
• 2021 new car market forecast to grow +11.7% to 1.82m*, down -21.2% versus 2019
• 2021 used car market forecast to grow 0.2%**, down -14.7% versus 2019
• Continued new car supply disruption expected for the remainder of the year and at least into 2022,which could impact used car supply:
• September market expected to be significantly down
• H2 will see decline in like-for-like volumes
• Potential realignment of used vehicle values
• A range of possible outcomes, however expecting full year 2021 underlying profit before tax will benot less than £40.0m, after repaying c.£4m of CJRS payments and retail grants
* Source: SMMT, ** Source: Cox Automotive

28
Summary
• Exceptionally strong H1 performance
• Benefited from pent-up demand and unprecedented market dynamics
• Strong market outperformance across all key operational metrics
• Strong balance sheet with £239.3m of net assets, equating to £3.06 per share
• Cash position* strong, £57.2m
• Reinstatement of dividends with an interim payment of 8.86p
• Expecting full year 2021 underlying profit before tax will be not less than £40.0m, after repaying c.£4m of CJRS payments and retail grants
• Strong platform in place with significant firepower to take advantage of future opportunities, pipeline busy
* Adjusted net cash excludes IFRS 16 lease liabilities

RECOGNISING THAT PEOPLE ARE AT THE HEART OF OUR SUCCESS
PUTTING OUR CUSTOMERS ABOVE ALL ELSE SINCE 1909
Appendix

30
ESG: The journey so far
• ESG committee sponsored by Executive Committee with oversight by main PLC Board
• Corporate environmental strategy roadmap and targets being finalised by Q4
• Leading on the Carbon Literacy Project workshop, with a bottom up approach
• Increase MI and visibility
• New MI portal with strategic partner being implemented by the end of Q3: full visibility onenergy usage across our portfolio, with alerts if there is any abnormal activity. Targets to be setper building by the end of the year
• Energy usage league tables by location to enhance focus
• Supporting the Woodland project to support the government’s 11m tree planting target by 2022
• Supply chain sustainability is a key part of our RFP’s and supplier selection
• Long-standing culture towards diversity
• CEO patron of the Automotive 30% Club, as well as patron of Menable (men’s mental health)
• MMH is also part of the IMI’s diversity taskforce
• Excellent engagement from top down
• Industry award winning female talent
• Sponsoring Automotive inspiring women day in November