2021 First Calendar Quarter Report
17
2021 First Calendar Quarter Report January 1 – March 31, 2021 Released: June 24, 2021
Transcript of 2021 First Calendar Quarter Report

2021 First Calendar Quarter Report
January 1 – March 31, 2021
Released: June 24, 2021

1 | P a g e
OP IOID OP ERATIONAL COMMAND CENTER
CONTENTS
Message from the Executive Director .............................................................................................. 2
Executive Summary ...................................................................................................................................... 3
Opioid-Related Overdose Statistics .................................................................................................. 4
Opioid Intervention Teams Update ................................................................................................. 12

2 | P a g e
OP IOID OP ERATIONAL COMMAND CENTER
MESSAGE FROM THE EXECUTIVE DIRECTOR Thank you for your interest in the Opioid Operational Command Center’s report for the first calendar quarter of 2021. This report provides important updates on the opioid crisis in Maryland and our state’s response efforts from January through March of this year. The rate of fatal overdoses in Maryland increased in the first three months of 2021 as compared to the same time in 2020. There were 682 unintentional intoxication fatalities involving all substances during this time, a 5.7 percent increase from this time last year. Of these deaths, nearly 90 percent (612) involved opioids. This report compares the first quarter of 2020, predating the pandemic, and the first quarter of 2021. According to data from the Maryland Department of Health’s Coronavirus Dashboard, the number of COVID-related cases, hospitalizations, and deaths were at or near historic highs throughout the month of January 2021. In 2020, the number of fatal overdoses involving all substances increased by 17.7 percent annually, increasing from 2,379 deaths reported in 2019 to 2,799. This stark increase was very likely influenced by the pandemic which had a tremendous impact on us all but especially on vulnerable populations, such as people who use drugs. Despite these increases, our office remains hopeful and optimistic about our future. With the pandemic now nearly behind us and with vaccines available for anyone who wants one, we are beginning to see life return to normal. We have a chance now to redouble our efforts on addressing the opioid crisis in our state and to reduce the rate of fatal overdoses once again. Our office has remained steadfast in our commitment to this work, and we humbly ask for your partnership as we move into the next phase of this fight, together. Robin E. Rickard Acting Executive Director Opioid Operational Command Center Office of the Governor

3 | P a g e
OP IOID OP ERATIONAL COMMAND CENTER
EXECUTIVE SUMMARY Based on preliminary data provided by the Vital Statistics Administration (VSA) of the Maryland Department of Health (MDH), there were 682 unintentional intoxication deaths involving all types of drugs and alcohol in Maryland in the first calendar quarter of 2021. This represents a 5.7 percent increase from 2020, when there were 645 such fatalities. There were 612 opioid-related fatal overdoses in this time frame, an increase of 6.3 percent from the first three months of 2020. Opioids were involved in 89.7 percent of all fatal overdoses. 564 deaths involved fentanyl, an increase of 5.2 percent. Fentanyl was involved in 92.2 percent of all opioid-related deaths. There were 136 prescription opioid-related deaths, an increase of 37.4 percent. Heroin-related deaths decreased by 27.7 percent, falling from 148 in the first three months of 2020 to 107 in the first three months of this year. All 24 local jurisdictions in Maryland reported opioid-related intoxication fatalities in the first quarter of 2021. Baltimore City (227 deaths), Baltimore County (89 deaths), and Anne Arundel County (57 deaths) experienced the highest number of fatalities, collectively accounting for 60.9 percent of all opioid-related deaths in Maryland. Other jurisdictions that reported large numbers of opioid-related fatalities included Prince George’s County (35 deaths), Montgomery County (29 deaths), Washington County (25 deaths), Harford County (24 deaths), and Cecil County (23 deaths). The Opioid Operational Command Center (OOCC) consults regularly with Opioid Intervention Teams (OITs) in each of Maryland’s 24 local jurisdictions to coordinate local actions taken to combat the opioid crisis. OITs are multiagency coordinating bodies that seek to enhance collaboration to fight the opioid crisis at the local level. OITs are also responsible for administering OOCC Block Grant funding to support programs that align with the Inter-Agency Opioid Coordination Plan. In our efforts to highlight and share best practices, the OOCC tracks 143 high-priority programs and initiatives being implemented by OITs across the state. These programs are detailed beginning on page 12 of this report. Note: The fatalities data presented herein are preliminary and subject to change.
*2020 and 2021 data are preliminary.

4 | P a g e
OP IOID OP ERATIONAL COMMAND CENTER
OPIOID-RELATED OVERDOSE STATISTICS This section provides various statistics related to fatal and non-fatal opioid- and substance-related overdose events in Maryland in the first calendar quarter of 2021. This includes information regarding the number of unintentional intoxication deaths related to opioids, alcohol, and various licit and illicit substances according to data provided by the Vital Statistics Administration (VSA) and the Office of the Chief Medical Examiner (OCME). This section also includes data on non-fatal, opioid-related emergency department (ED) visits and naloxone administrations by emergency medical services (EMS) personnel. Unintentional intoxication deaths (i.e., fatal overdoses not including suicides) are fatalities resulting from the recent ingestion of or exposure to alcohol and other types of drugs. The substances included in this report are heroin, fentanyl, prescription opioids, cocaine, benzodiazepine, methamphetamine, and phencyclidine (PCP). Most fatalities involve the simultaneous use of more than one substance. Accordingly, the sum total of deaths related to specific substance categories does not equal the total number of fatalities in the reporting period. Please note that the fatalities data for 2021 are preliminary at the time of this writing and are subject to change. All Substances At the time of this writing, there were 682 confirmed unintentional intoxication deaths involving all types of drugs and alcohol reported in Maryland through the first calendar quarter of 2021. This represents a 5.7 percent increase from the 645 fatal overdoses in the first calendar quarter of 2020.
For context, the first quarter of 2021 also coincides with the end of the third wave of the COVID-19 pandemic in Maryland, with COVID case, hospitalization, and death rates at or near historic highs throughout the month of January. As such, the societal effects of the pandemic could still very well have been influencing the rate of fatal overdoses during this time frame. To be sure, further research is needed to determine the full extent to which COVID-19 exacerbated the opioid crisis. What is clear, though, is that the burdens associated with COVID-19, such as social isolation and economic hardship, disproportionately impacted vulnerable populations in Maryland and across the country. Those affected
671 799 858 1,0411,259
2,0892,282 2,406 2,379
2,799
645 682
0
500
1,000
1,500
2,000
2,500
3,000
2011 2012 2013 2014 2015 2016 2017 2018 2019 2020* Q1 2020
Q1 2021*
Figure 1. Unintentional Intoxication Fatalities, All Substances2011 through the First Calendar Quarter, 2021*
*2020 and 2021 data are preliminary.
5 | P a g e
OP IOID OP ERATIONAL COMMAND CENTER
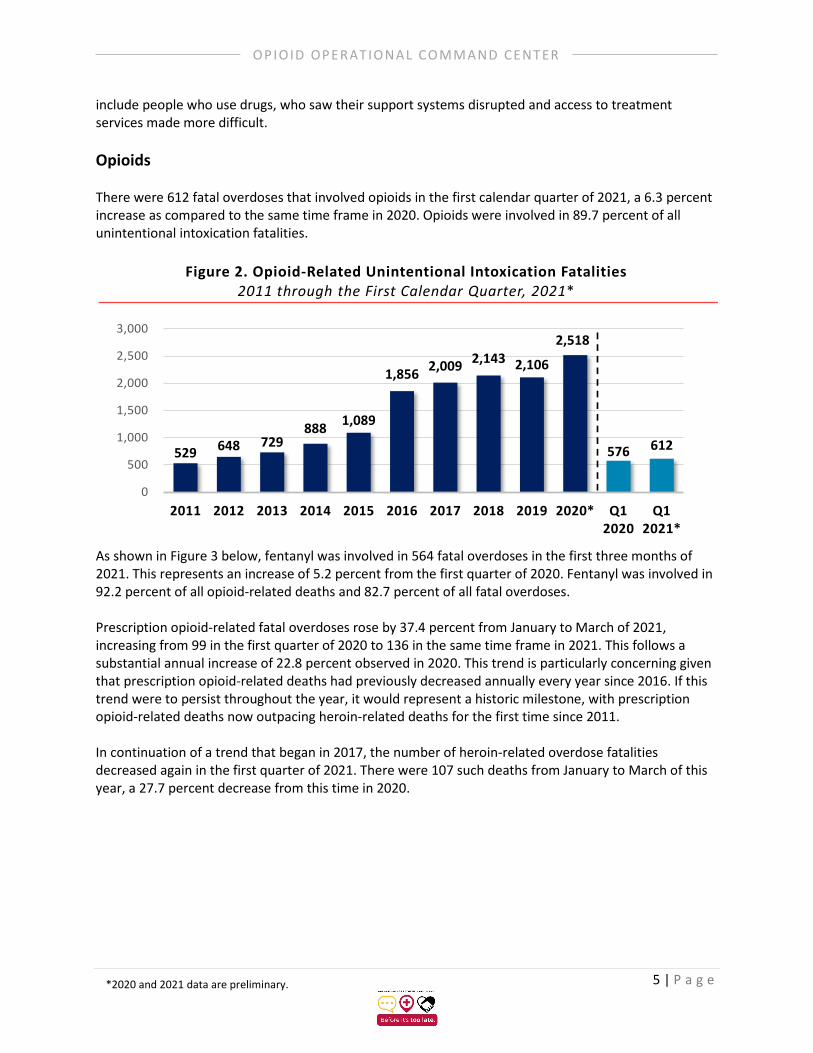
include people who use drugs, who saw their support systems disrupted and access to treatment services made more difficult. Opioids There were 612 fatal overdoses that involved opioids in the first calendar quarter of 2021, a 6.3 percent increase as compared to the same time frame in 2020. Opioids were involved in 89.7 percent of all unintentional intoxication fatalities.
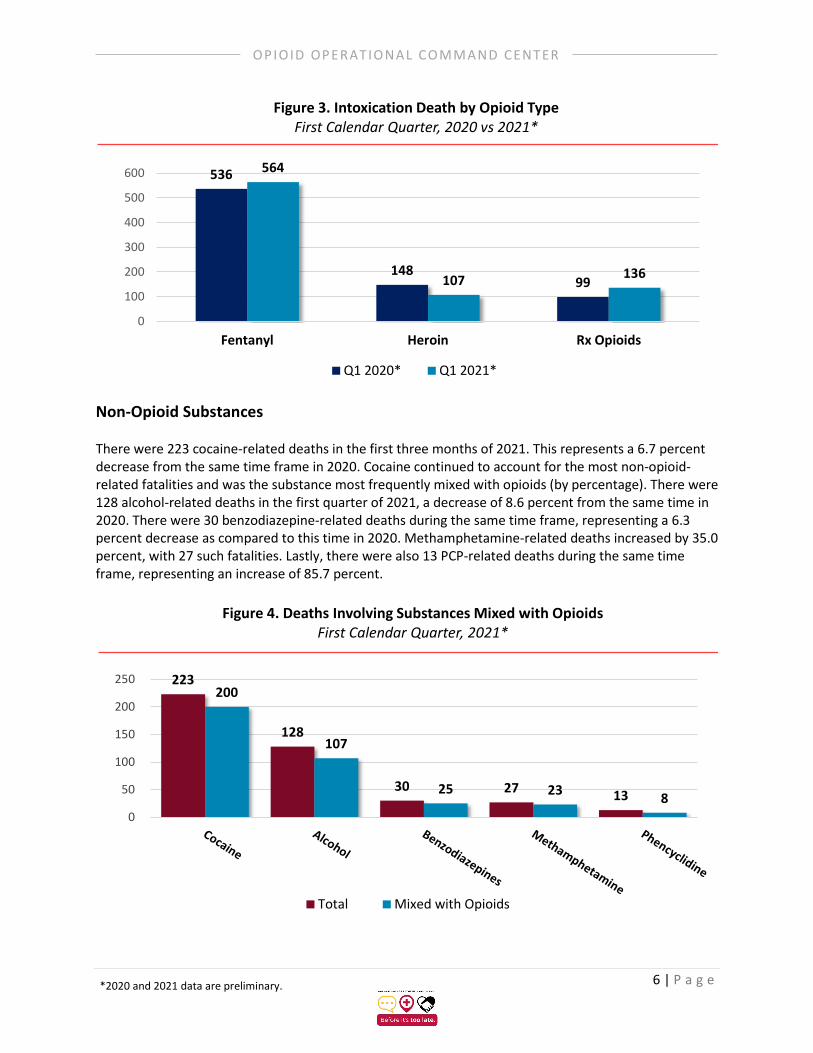
As shown in Figure 3 below, fentanyl was involved in 564 fatal overdoses in the first three months of 2021. This represents an increase of 5.2 percent from the first quarter of 2020. Fentanyl was involved in 92.2 percent of all opioid-related deaths and 82.7 percent of all fatal overdoses. Prescription opioid-related fatal overdoses rose by 37.4 percent from January to March of 2021, increasing from 99 in the first quarter of 2020 to 136 in the same time frame in 2021. This follows a substantial annual increase of 22.8 percent observed in 2020. This trend is particularly concerning given that prescription opioid-related deaths had previously decreased annually every year since 2016. If this trend were to persist throughout the year, it would represent a historic milestone, with prescription opioid-related deaths now outpacing heroin-related deaths for the first time since 2011. In continuation of a trend that began in 2017, the number of heroin-related overdose fatalities decreased again in the first quarter of 2021. There were 107 such deaths from January to March of this year, a 27.7 percent decrease from this time in 2020.
529 648 729 888 1,089
1,856 2,009 2,143 2,106
2,518
576 612
0
500
1,000
1,500
2,000
2,500
3,000
2011 2012 2013 2014 2015 2016 2017 2018 2019 2020* Q1 2020
Q1 2021*
Figure 2. Opioid-Related Unintentional Intoxication Fatalities2011 through the First Calendar Quarter, 2021*
*2020 and 2021 data are preliminary.
6 | P a g e
OP IOID OP ERATIONAL COMMAND CENTER
Non-Opioid Substances There were 223 cocaine-related deaths in the first three months of 2021. This represents a 6.7 percent decrease from the same time frame in 2020. Cocaine continued to account for the most non-opioid-related fatalities and was the substance most frequently mixed with opioids (by percentage). There were 128 alcohol-related deaths in the first quarter of 2021, a decrease of 8.6 percent from the same time in 2020. There were 30 benzodiazepine-related deaths during the same time frame, representing a 6.3 percent decrease as compared to this time in 2020. Methamphetamine-related deaths increased by 35.0 percent, with 27 such fatalities. Lastly, there were also 13 PCP-related deaths during the same time frame, representing an increase of 85.7 percent.
536
14899
564
107 136
0
100
200
300
400
500
600
Fentanyl Heroin Rx Opioids
Figure 3. Intoxication Death by Opioid Type First Calendar Quarter, 2020 vs 2021*
Q1 2020* Q1 2021*
223
128
30 27 13
200
107
25 23 80
50
100
150
200
250
Figure 4. Deaths Involving Substances Mixed with Opioids First Calendar Quarter, 2021*
Total Mixed with Opioids
*2020 and 2021 data are preliminary.

7 | P a g e
OP IOID OP ERATIONAL COMMAND CENTER
As shown in Figure 4, above, a vast majority of non-opioid-related fatalities also involved opioids in the first calendar quarter of 2021. Of the 408 instances in which a non-opioid was involved in a fatality, opioids were also present 87.0 percent of the time. Fatalities at the County Level While all 24 of Maryland’s local jurisdictions reported opioid-related fatal overdoses from January to March of 2021, the large growth in intoxication fatalities was not experienced evenly throughout the state. Many jurisdictions reported large increases, while some saw slight decreases. As shown in Table 1 below, Baltimore City (227 deaths), Baltimore County (89 deaths), and Anne Arundel County (57 deaths) experienced the highest number of fatalities, collectively accounting for 60.9 percent of all opioid-related deaths in Maryland. Other jurisdictions that reported large numbers of opioid-related fatalities included Prince George’s County (35 deaths), Montgomery County (29 deaths), Washington County (25 deaths), Harford County (24 deaths), and Cecil County (23 deaths).
Table 1. Opioid-Related Intoxication Deaths by County First Calendar Quarter, 2020 vs. 2021*
The largest numerical increase was observed in Baltimore City, which reported 18 more opioid-related intoxication fatalities than it experienced in the first quarter of 2020. This represented an 8.6 percent increase, which was above the state average. Queen Anne’s County saw the largest percent increase (600.0 percent), with 7 opioid deaths, 6 more than at this time last year. Fatalities at the Regional Level Opioid-related fatal overdose trends varied by region across Maryland in the first calendar quarter of 2021. The largest numerical increase was observed in Central Maryland, which reported a total of 419
Coun
ty
2020
2021
Diffe
renc
e
Perc
ent
Diffe
renc
e
Coun
ty
2020
2021
Diffe
renc
e
Perc
ent
Diffe
renc
e
Allegany 13 8 (5) (38.5%) Harford 19 24 5 26.3% Anne Arundel 54 57 3 5.6% Howard 12 8 (4) (33.3%) Baltimore City 209 227 18 8.6% Kent 1 1 0 0.0% Baltimore Co. 84 89 5 6.0% Montgomery 26 29 3 11.5% Calvert 3 5 2 66.7% Prince George's 41 35 (6) (14.6%) Caroline 4 0 (4) (100.0%) Queen Anne's 1 7 6 600.0% Carroll 8 14 6 75.0% Somerset 3 4 1 33.3% Cecil 20 23 3 15.0% St. Mary's 3 11 8 266.7% Charles 8 6 (2) (25.0%) Talbot 3 5 2 66.7% Dorchester 6 4 (2) (33.3%) Washington 31 25 (6) (19.4%) Frederick 13 15 2 15.4% Wicomico 7 12 5 71.4% Garrett 2 1 (1) (50.0%) Worcester 5 2 (3) (60.0%)
Statewide Total 576 612 36 6.3%
*2020 and 2021 data are preliminary.

8 | P a g e
OP IOID OP ERATIONAL COMMAND CENTER
regional deaths, 33 more than during the same time frame in 2020. This represents an 8.5 percent increase. Central Maryland consists of Baltimore City and Anne Arundel, Baltimore, Carroll, Harford, and Howard Counties. More than half of these fatalities occurred in Baltimore City alone, while Howard County reported the only decrease in the region, with 33.3 percent fewer than at this time in 2020. The largest regional percent increase in opioid-related fatal overdoses was observed in Southern Maryland, which includes Calvert, Charles, and St. Mary’s Counties. Southern Maryland reported 22 regional opioid-related fatalities in the first three months of 2021, up 57.1 percent from the same time last year. However, Southern Maryland also had the fewest regional opioid deaths in the state. The Capital Region, which is made up of Montgomery, Prince George’s, and Frederick Counties, reported 79 opioid-related fatalities from January to March of 2021. This was one death fewer than in the first quarter of 2020. Prince George’s County led the region, with 35 opioid-related fatal overdoses, though the county also reported six fewer than at this time last year. The Eastern Shore saw a regional increase of 16.0 percent with 58 total opioid-related fatalities. This was eight more than was reported in the first quarter of 2020. The Eastern Shore is made up of Caroline, Cecil, Dorchester, Kent, Queen Anne’s, Somerset, Talbot, Wicomico, and Worcester Counties. Cecil County reported the highest number of opioid deaths with 23, or 39.7 percent of the regional total. Western Maryland reported the second-fewest total of opioid-related fatal overdoses in the first quarter of 2021. There were 34 such deaths reported in the quarter, 26.1 percent fewer than at this time in 2020. Western Maryland consists of Allegany, Garrett, and Washington Counties.
Figure 5. Percent Change in Opioid-Related Intoxication Deaths by Region January through March, 2020 vs. 2021*
Allegany
Washington
Frederick
Carroll
Charles
Wicomico
Cecil Harford
Baltimore
Balt. City
Garrett
Kent
Anne Arundel
Queen Anne’s
Western Maryland 34 Regional Fatalities
(-26.1%)
Capital Region 79 Regional Fatalities
(-1.3%)
Southern Maryland 22 Regional Fatalities
(+57.1%)
Eastern Shore 58 Regional Fatalities
(+16.0%)
Central Maryland 419 Regional Fatalities
(+8.5%)
*2020 and 2021 data are preliminary.

9 | P a g e
OP IOID OP ERATIONAL COMMAND CENTER
Opioid-Related Fatality Demographics Figure 6, below, illustrates demographic trends in opioid-related fatal overdoses in the first three months of 2021. It includes the number of fatalities by age, gender, and race/ethnicity.
Figure 6: Opioid-Related Fatal Overdoses by Age, Gender, and Race/Ethnicity First Calendar Quarter, 2020 vs. 2021*
Age
• Opioid-related fatal overdoses increased by the largest margin (numerically and by percentage) among people between the ages of 45 and 54.
• While the percentage of opioid-related deaths increased substantially among people under the age of 25, this cohort had significantly fewer fatal overdoses than all other age cohorts.
Gender
• Gender trends have remained consistent as compared to previous years. Opioid-related deaths involving males vastly outnumbered those involving females.
• For context, in 2020, males made up 72.5
percent of opioid overdose decedents.
Race/Ethnicity
• Opioid-related fatal overdoses increased substantially among Black Marylanders while decreasing marginally among White Marylanders.
• The percentage of opioid-related fatal
overdoses grew the most among other non-Hispanic race groups, though this cohort had very few deaths, numerically.
22
133 140117
164
27
128 119150
183
<25 25-34 35-44 45-54 >55
Q1 2020 Q1 2021
Female176
(28.8%)
Male436
(71.2%)
2021*
343
211
19 3
326
262
16 8
W h i t e ( N H )
B l a c k ( N H )
H i s p a n i c O t h e r ( N H )
Q1 2020 Q1 2021
+11.6% +28.2% -15.0% -3.8% +22.7%
-5.0% +24.2% -15.8% +166.7%
*2020 and 2021 data are preliminary.
10 | P a g e
OP IOID OP ERATIONAL COMMAND CENTER
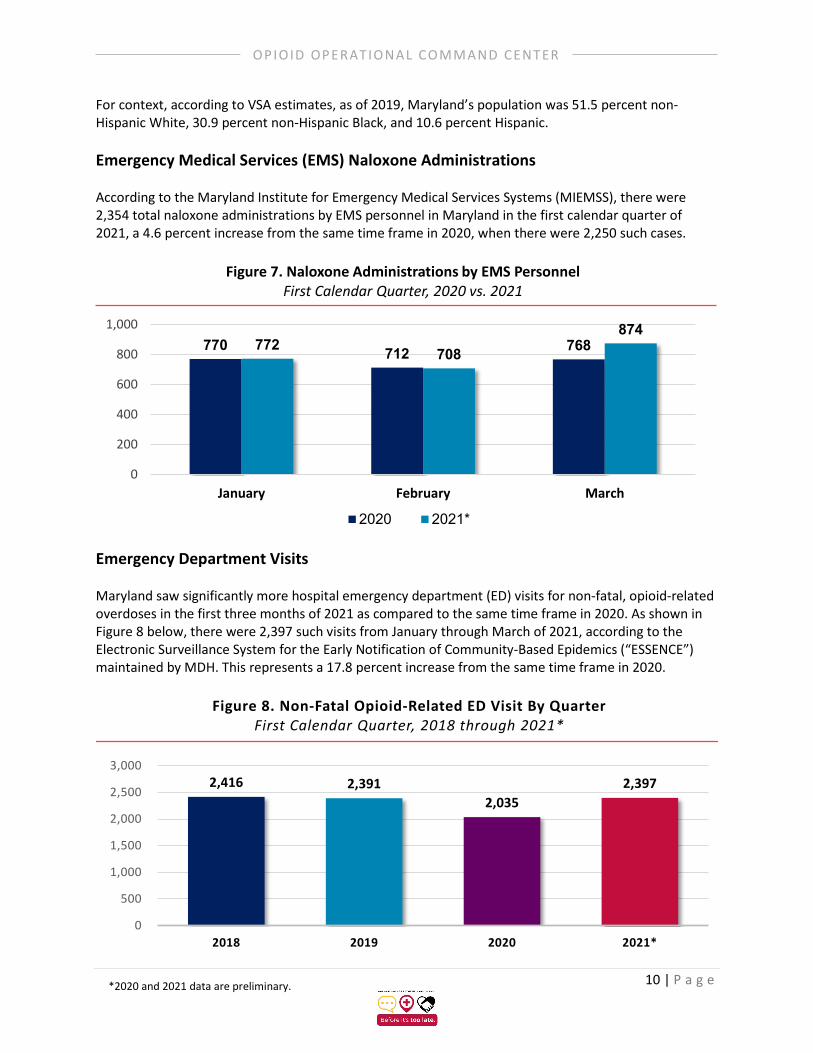
For context, according to VSA estimates, as of 2019, Maryland’s population was 51.5 percent non-Hispanic White, 30.9 percent non-Hispanic Black, and 10.6 percent Hispanic. Emergency Medical Services (EMS) Naloxone Administrations According to the Maryland Institute for Emergency Medical Services Systems (MIEMSS), there were 2,354 total naloxone administrations by EMS personnel in Maryland in the first calendar quarter of 2021, a 4.6 percent increase from the same time frame in 2020, when there were 2,250 such cases.
Emergency Department Visits Maryland saw significantly more hospital emergency department (ED) visits for non-fatal, opioid-related overdoses in the first three months of 2021 as compared to the same time frame in 2020. As shown in Figure 8 below, there were 2,397 such visits from January through March of 2021, according to the Electronic Surveillance System for the Early Notification of Community-Based Epidemics (“ESSENCE”) maintained by MDH. This represents a 17.8 percent increase from the same time frame in 2020.
770 712 768772 708874
0
200
400
600
800
1,000
January February March
Figure 7. Naloxone Administrations by EMS PersonnelFirst Calendar Quarter, 2020 vs. 2021
2020 2021*
2,416 2,3912,035
2,397
2018 2019 2020 2021*0
500
1,000
1,500
2,000
2,500
3,000
Figure 8. Non-Fatal Opioid-Related ED Visit By QuarterFirst Calendar Quarter, 2018 through 2021*
*2020 and 2021 data are preliminary.

11 | P a g e
OP IOID OP ERATIONAL COMMAND CENTER
It is important to note that the decrease observed in the first quarter of 2020 was very likely the result of the COVID-19 pandemic. According to ESSENCE, total ED visits diminished significantly for all conditions beginning in mid-to-late March near the onset of the coronavirus pandemic in Maryland. Please also note that, as of 2021, the ESSENCE database has undergone an update in methodology in order to align case definitions more closely with the ICD-10 hospital case coding system. The database now includes more codes that qualify as opioid-related and, as such, the numbers presented in this report are significantly higher on a quarterly basis than have been included in previous OOCC reports. However, the annual trends remain largely consistent with prior reporting.
*2020 and 2021 data are preliminary.

12 | P a g e
OP IOID OP ERATIONAL COMMAND CENTER
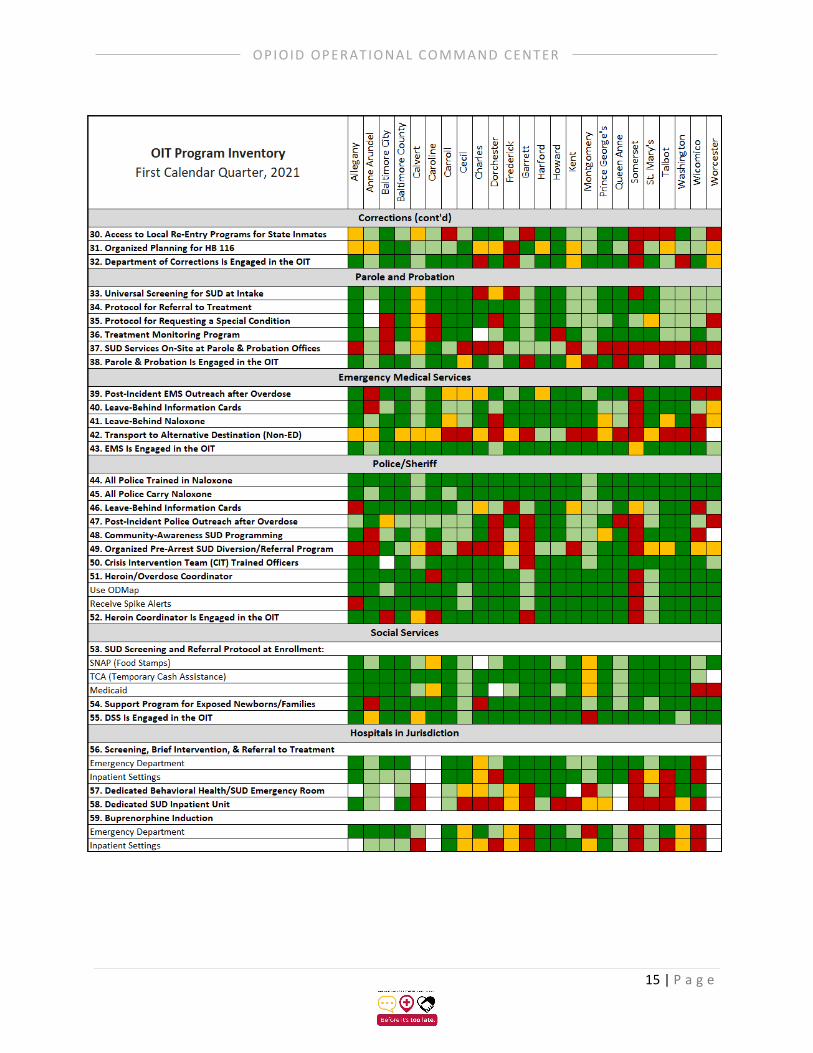
OPIOID INTERVENTION TEAMS UPDATE To promote a comprehensive and coordinated response to the opioid crisis in all parts of the state, the OOCC consults regularly with the Opioid Intervention Teams (OITs) in each of Maryland’s 24 local jurisdictions. OITs are multiagency coordinating bodies that seek to enhance multidisciplinary collaboration at the local level. Each OIT is chaired by the local health officer and emergency manager. OITs are also required to have representatives from various agencies and organizations, including law enforcement, social services, education, and community groups. Each OIT is responsible for administering funds received through the OOCC’s Block Grant Program. OIT Program Inventory A central component of our work involves sharing best practices with our local partners. To do this, we survey and evaluate all programs and initiatives that are being supported by OITs in their respective jurisdictions to address the opioid crisis. We have identified 143 high-priority programs and services that have been shown to be effective at the local level, and we are working to help our partners establish and expand these services to the greatest extent possible. The tables to the right and below illustrate the implementation of these activities throughout the state based on self-reported OIT data. Responses on implementation status range from “no programming planned” (red) to “substantial programming in place” (dark green). Programs that were not applicable for a given jurisdiction were not color-coded. Maryland’s local jurisdictions continued to make steady progress in implementing high-priority programs despite the disruptions caused by the COVID-19 pandemic. All jurisdictions reported having at least 50 percent of the 143 programs either partially or substantially implemented, and 15 jurisdictions (one more than in the fourth quarter of 2020) reported having above 80 percent of these programs at some stage of development. 10 jurisdictions reported having 90 percent of programs at some phase of development (three more than last quarter). Although nearly all jurisdictions reported plans to expand high-priority programming, no counties reported having plans to implement all 143 programs. Thus, ample opportunities remain for program expansion across all jurisdictions in the future.
Table 2. Summary of Program Implementation by Jurisdiction – As of March 31, 2021
County
Subs
tant
ially
Im
plem
ente
d
Part
ially
Im
plem
ente
d
Subs
tant
ial
+ So
me
In
Deve
lopm
ent
Not
Pl
anne
d
Allegany 92 15 107 9 24
Anne Arundel 71 49 120 4 17
Baltimore City 74 46 120 8 9
Baltimore Co. 90 40 130 12 0
Calvert 39 52 91 38 9
Caroline 81 11 92 6 25
Carroll 85 38 123 8 12
Cecil 64 53 117 12 13
Charles 52 41 93 11 31
Dorchester 72 22 94 13 31
Frederick 78 42 120 9 13
Garrett 52 36 88 8 47
Harford 114 14 128 13 2
Howard 98 34 132 7 4
Kent 89 15 104 10 28
Montgomery 50 56 106 16 21
Prince George's 108 8 116 19 8
Queen Anne 65 36 101 7 31
Somerset 64 8 72 5 64
St. Mary's 64 48 112 23 8
Talbot 80 22 102 10 31
Washington 86 26 112 18 12
Wicomico 73 43 116 2 25
Worcester 56 30 86 15 23

13 | P a g e
OP IOID OP ERATIONAL COMMAND CENTER
Table 3. Full OIT Program Inventory as of March 31, 2021

14 | P a g e
OP IOID OP ERATIONAL COMMAND CENTER
15 | P a g e
OP IOID OP ERATIONAL COMMAND CENTER

16 | P a g e
OP IOID OP ERATIONAL COMMAND CENTER
Note: The OOCC evaluates and updates the OIT Program Inventory on a regular basis, and the number of programs may change from quarter to quarter. We frequently add new programs that have been shown to be effective and, where appropriate, remove programs that no longer fit our criteria for inclusion due to the dynamic nature of the opioid crisis.