
2021 Drinking Water Quality Report (for Calendar Year 2020)
10
2021 Drinking Water Quality Report (for Calendar Year 2020) Cornell University Table of Contents Water Treatment Process ............ .A Health Effects and Individuals At-Risk ..................... .B Water Quality Data...................... .C General Water Information ......... .D Detected Contaminants ............... .E Non-Detected Contaminants ....... .F Major Modifications Completed . .G Future Projects…………………..H Water Conservation Measures…...I Security Concerns………….…….J Source Water Protection…………K Cornell University is providing this Drinking Water Quality Report to our customers because we want you to be fully informed about your water quality and the need to protect its source. This overview of last calendar year’s water quality includes details about where your water comes from, what it contains, and how it compares to New York State standards. The staff of Cornell’s Water System have worked tirelessly through the pan- demic to provide the highest quality water and to maintain processes. They are some of the many heroes that serve the community’s needs. If you have any questions about this report or your drinking water, please contact: Christopher Lynn Bordlemay Padilla, Water Manager 607.255.1408 or [email protected]. Cornell University Source Water Fall Creek is the source of water for the Cornell University Water System (CUWS). The water intake is on Forest Home Drive near the Cornell Bo- tanic Gardens Arboretum entrance. Fall Creek originates in Lake Como northeast of Ithaca and flows through a 125 square mile watershed, indi- cated by the dark green area on the figure above and to the right. Flow in Fall Creek for most of 2020 was adequate with an average of 168 cubic feet per second (cfs). We did experience a short, but intense, period of drought from late August through September where flows lowered to less than 20 cfs. Cornell withdraws a maximum of 5.5 cfs to put it in perspec- tive! Our system serves the University’s campus and supplies water to City customers in the Cornell Heights area and to Bolton Point-Town of Ithaca customers on the south side of Fall Creek in the Forest Home area. The Water Filtration Plant is located at 310 Caldwell Road, Ithaca, NY 14850.
Transcript of 2021 Drinking Water Quality Report (for Calendar Year 2020)

2021 Drinking Water
Quality Report
(for Calendar Year 2020)
Cornell University
Table of Contents
Water Treatment Process ............ .A
Health Effects and
Individuals At-Risk ..................... .B
Water Quality Data ...................... .C
General Water Information ......... .D
Detected Contaminants ............... .E
Non-Detected Contaminants ....... .F
Major Modifications Completed . .G
Future Projects…………………..H
Water Conservation Measures…...I
Security Concerns………….…….J
Source Water Protection…………K
Cornell University is providing this Drinking Water Quality Report to our
customers because we want you to be fully informed about your water
quality and the need to protect its source. This overview of last calendar
year’s water quality includes details about where your water comes from,
what it contains, and how it compares to New York State standards. The
staff of Cornell’s Water System have worked tirelessly through the pan-
demic to provide the highest quality water and to maintain processes.
They are some of the many heroes that serve the community’s needs.
If you have any questions about this report or your drinking water, please
contact:
Christopher Lynn Bordlemay Padilla, Water Manager
607.255.1408 or [email protected].
Cornell University Source Water
Fall Creek is the source of water for the Cornell University Water System
(CUWS). The water intake is on Forest Home Drive near the Cornell Bo-
tanic Gardens Arboretum entrance. Fall Creek originates in Lake Como
northeast of Ithaca and flows through a 125 square mile watershed, indi-
cated by the dark green area on the figure above and to the right. Flow in
Fall Creek for most of 2020 was adequate with an average of 168 cubic
feet per second (cfs). We did experience a short, but intense, period of
drought from late August through September where flows lowered to less
than 20 cfs. Cornell withdraws a maximum of 5.5 cfs to put it in perspec-
tive! Our system serves the University’s campus and supplies water to
City customers in the Cornell Heights area and to Bolton Point-Town of
Ithaca customers on the south side of Fall Creek in the Forest Home area.
The Water Filtration Plant is located at 310 Caldwell Road, Ithaca, NY
14850.

All drinking water, including bottled water, may reasonably be expected to contain at least small amounts of some contaminants. The presence of contaminants does not necessarily indicate the water poses a health risk. Some people may be more vulnerable to disease causing microorganisms or pathogens in drinking water than the general population. Immuno-compromised persons such as those with cancer undergoing chemotherapy, those who have undergone organ transplants, those with HIV/AIDS or other immune system disorders, some elderly, and some infants can be particularly at risk from infections. Please seek advice from your health care provider about your drinking water if you are, or are a caregiver for, an individual in one of those categories.
Environmental Protection Agency/Center for Disease Control (EPA/CDC) provides guidelines on appropriate means to lessen the risk of infection by cryptosporidium, giardia, and other microbial pathogens These guidelines are available from the Safe Drinking Water Hotline (800-426-4791). Cornell’s water system has not detected these pathogens in previous testing of the treated water. For additional information please contact the Tompkins County Health Department, 55 Brown Road, Ithaca, New York, 14850 or by phone at 607-274-6688.
“Eighty percent of the earth’s surface is covered by water, but only one percent of the earth’s water is suitable for drinking.”
A. Water Treatment Process
B. Health Effects and Individuals At-Risk
Pre-Treatment: Screens are used
to prevent leaves and debris from
entering the treatment process.
Coagulants, such as Alum or Poly-
aluminum chloride are added to
remove impurities.
Mixing: The water is rapidly
mixed to distribute the treatment
chemicals evenly.
Coagulation and Flocculation:
The water flows into chambers
where the coagulants react with
impurities in the water (coagulation)
causing them to form larger, heavier
particles called floc (flocculation).
Sedimentation: Flocculated wa-
ter flows into large basins where the
floc particles settle to the bottom,
thereby removing impurities and
chemicals from the water.
Filtration: Following the settling
process, water flows through layers
of anthracite coal, sand and gravel
where further removal of particulate
impurities occurs.
Post-Treatment: Chlor ine is
added to inhibit bacterial growth in
the distribution system, and a corro-
sion inhibitor is added to prevent
the potential leaching of lead and
copper into the water from plumb-
ing systems.
2
C. Water Quality Data INTRODUCTION: The sources of dr inking water (tap water and bottled water ) include r ivers, lakes, streams, ponds, reservoirs, springs, and wells. As water travels over the surface of the land or through the ground, it dissolves naturally occurring minerals and, in some cases, radioactive material. It also can pick up substances resulting from the presence of animals or from human activities. Contaminants that may be present in source wa-ter include microbial contaminants, inorganic contaminants, pesticides and herbicides, organic chemical contami-nants, and radioactive contaminants. To ensure that tap water is safe to drink, the State and the EPA prescribe reg-ulations that limit the amount of certain contaminants in water provided by public water systems. State Health Department and Federal Drug Administration regulations also establish limits for contaminants in bottled water, which must provide the same protection for public health.
In accordance with State regulations, the Cornell Water System routinely monitors your drinking water for nu-merous contaminants. Table 3a, page 5, shows the analytical test results for contaminants that were detected. These results are compared to the applicable state guideline or maximum contaminate level (MCL). Tables 3b and 3c, pages 6 and 7, show the unregulated contaminants that were detected. Table 4a, page 8, shows the contami-nants that were not detected in your water.

COMMON
WATER
QUALITY
DEFINITIONS
ALKALINITY is a measure of the
capability of water to neutralize
acids. Bicarbonates, carbonates and
hydroxides are the most
common forms of alkalinity.
HARDNESS is a measure of the
calcium and magnesium content of
natural waters. The harder the water,
the greater the tendency to precipi-
tate soap and to form
mineral deposits. Alkalinity and
hardness occur naturally due to
the contact of water with minerals in
the earth’s crust.
pH indicates how acidic or alkaline
a water sample is. A value of 7 is
neutral, 0-6 is acidic and 8-14 is
alkaline.
TOTAL ORGANIC CARBON
(TOC) is a measure of the organic
content of water. A high concentra-
tion of TOC in water may lead to
high levels of disinfection byprod-
ucts.
TURBIDITY is a measure of the
cloudiness of water. It is an
indication of the effectiveness
of water treatment. NYS regulations
require that treated water
turbidity always be below 1 NTU
(nephelometric turbidity unit). For
filtered systems 95% of the
composite effluent samples must be
below 0.3 NTU.
3
TOTAL COLIFORMS: Coliforms are bacter ia that are naturally present in the
environment and are used as an indicator that other, potentially harmful, bacteria may be
present. Total coliforms are tested on a weekly basis.
LEAD AND COPPER: The Cornell water system was required to sample for lead
and copper in 2020. There were no violations of State standards. We will sample again
during the summer of 2023. The State allows testing less frequently than once per year for
certain contaminants such as lead and copper since the concentrations of these contami-
nants do not change frequently. We will comply with the Lead and Copper Rule Revisions
(LCRR) when implemented.
SODIUM: People who are on severely restricted sodium diets should not drink water
containing more than 20 mg/l of sodium. Since the 2020 level of sodium in Cornell water
was 29 mg/l, customers on severely restricted sodium diets might wish to consult their
health care providers. People who are on moderately restricted sodium diets should not
drink water containing more than 270 mg/l of sodium. The sodium levels of the water
from all three local public water systems are well below this level.
EXCHANGES: Dur ing the course of the year, for maintenance, or for emergency
help, potable water is exchanged among the three Ithaca area water systems. If you wish
to know if this occurred, the time periods, and the water volumes, please call the Cornell
Water System.
UCMR: Required testing by the EPA for the Unregulated Contaminant Monitor ing
Rule #4 (UCMR4) began in the summer of 2018 and continued into 2020. Information
about the rule and the contaminants can be found on the EPA website
(epa.gov; search for UCMR4). The results for Cornell UCMR3 and for the on-going
UCMR4 sampling can be found on the Cornell Energy and Sustainability website.
D. General Water Information
C. Water Quality Data (cont.)
Table 1: General Water Data - 2020
Water System Cornell University
Public Water Supply ID 5417680
Water source Fall Creek
Approx Population Served 31,000
Number of Service Connections 266
Total Production in 2020 (MG) 309.6
Average Daily Withdrawal (MGD) 0.906
Average Daily Delivered (MGD) 0.848
Average Daily Lost (MGD) 0.058
Annual Charge per 1000 gallons $12.41
Table 2: General Water Quality Data - 2020
Water System Units Cornell University
Public Water Supply ID 5417680
Turbidity (EP) NTU 0.058
Total Hardness mg/L 150
Total Alkalinity mg/L 136
Total Dissolved Solids mg/L NR
Iron (Soluble) mg/L NR
Chlorine Residual (EP) mg/L 1.33
Chlorine Residual (POU) mg/L 0.30
Turbidity (POU) NTU 0.149
Total Organic Carbon (EP) mg/L 1.62
Dissolved Organic Carbon (EP) mg/L 1.58
NR=Not Required, EP=Entry Point, POU=Point of Use
Definitions of NTU and mg/L found in Section E.

Interesting Water Facts
There are over 58,900 com-
munity water systems in the
United States processing
more than 34 billion gallons
per day.
The average residence in the
United States uses 107,000
gallons of water a year.
It takes 62,600 gallons of
water to produce one ton of
steel.
It takes 101 gallons of water
to make one pound of wool
or cotton.
Water acts as a natural buff-
er against extreme or rapid
changes in the earth’s tem-
perature.
It would take 219 million
gallons of water to cover
one square mile with one
foot of water.
One gallon of water weighs
8.34 pounds.
When the weather is very
cold outside, let the cold
water drip from the faucet
served by exposed pipes.
Running water through the
pipe - even at a trickle -
helps prevent pipes from
freezing.
Water is the second most
common molecule in the
universe. The most common
is hydrogen gas, H2.
There is ice on the poles of
the moon, and on the poles
of Mars and Mercury.
Notes and Definitions for Tables 3-4:
AL (action level): The concentration
of a contaminant that, if exceeded, trig-
gers additional treatment or other re-
quirements that a water system must
follow.
Lead and Copper: The maximum
level values reported for lead and cop-
per represent the 90th percentile of the
samples taken. Testing for these metals
is only required every three years.
HAA5 (haloacetic acids): These are a
group of chemicals that are formed
when chlorine or other disinfectants
used to control microbial contaminants
in drinking water react with naturally
occurring organic and inorganic matter
in water. The regulated haloacetic acids,
known as HAA5, are monochloroacetic,
dichloroacetic, trichloroacetic, mono-
bromoacetic, and dibromoacetic acids.
The maximum level detected of HAA5
is the highest of the four quarterly run-
ning annual averages calculated during
the year and is the basis of the MCL for
these compounds.
Maximum Level Detected: The high-
est measurement detected for the con-
taminant during the year. For total
THMs and HAA5 the maximum level
detected is the highest of the four quar-
terly running annual averages during the
year.
MCL (maximum contaminant level):
The highest level of a contaminant that
is allowed in drinking water. MCLs are
set as close to the MCLGs as feasible.
MCLG (maximum contaminant level
goal): The level of a contaminant in
drinking water below which there is no
known or expected risk to health.
MCLGs allow for a margin of safety.
mg/L (milligrams per liter): Corre-
sponds to one part in one million parts
of liquid (parts per million, ppm).
MRDL (maximum residual disinfec-
tion level): The highest level of a dis-
infectant allowed in drinking water.
There is convincing evidence that addi-
tion of a disinfectant is necessary to
control microbial contaminants.
MRDLG (maximum residual disin-
fectant level goal): The level of a
drinking water disinfectant below
which there is no known or expected
risk to health. MRDLGs do not reflect
the benefits of the use of disinfectants
to control microbial contamination.
N/A (not applicable).
ND (not detected): Laboratory analy-
sis indicates that the constituent is not
present.
NTU (nephelometric turbidity unit): A turbidity of approximately 5 NTU is barely noticeable by the average person.
pCi/L (picocuries per liter): A meas-ure of radioactivity in water.
Range: The range of lowest to highest measurements detected for contaminants measured during the year.
THM (trihalomethane): These are a group of chemicals that are formed when chlorine or other disinfectants used to control microbial contaminants in drinking water react with naturally occurring organic and inorganic matter in water. The regulated trihalomethanes are bromodichloromethane, bromoform, chloroform, and dibromochloromethane. These compounds result from the disin-fection of water with chlorine. The maximum level detected of THMs is the highest of the four quarterly running annual averages calculated during the year and is the basis of the MCL for these compounds.
TT (treatment technique): A required process intended to reduce the level of a contaminant in drinking water.
µg/L (micrograms per liter): Cor re-sponds to one part in one billion parts of liquid (parts per billion, ppb). PFOA/PFOS/1-4 Dioxane: Beginning in the Fall of 2020, NYS required sam-pling and analysis for Perfluoroctanic Acid, Perfluorooctane Sulfonate and 1-4 Dioxane. These are released into the environment from widespread use in commercial and industrial applications. None were detected in 2020.
E. Detected Contaminants
4

Table 3a.
Contaminant
Units Vio-
lation
Y/N
Date of
Sample
Maximum Level
Detected
(Range)
Regulatory Limit MCLG Likely Source of Contamination
Microbiological contaminants
Turbidity NTU No 2020 0.100 TT=<1 NTU N/A Soil runoff.
Turbidity samples % below
MCL
No daily 100% <0.3NTU TT=95% of samples
<0.3NTU
N/A Soil runoff.
Disinfection By-Products
Total THMs
Site 1
Site 2
Site 3
Site 4
µg/l No 2020
66.6 (64.0-69.8)
53.1 (46.8-57.7)
65.2 (61.3-71.6)
64.8 (60.8-70.5)
MCL = 80 Running
Annual Average
N/A By-product of drinking water
chlorination.
Total HAA5
Site 1
Site 2
Site 3
Site 4
µg/l No 2020
25.2 (20.6-28.7)
27.3 (21.3-32.2)
29.8 (27.3-32.8)
25.4 (22.2-29.9)
MCL = 60 Running
Annual Average
N/A By-product of drinking water
chlorination.
Chlorine Residual mg/l No 2020 1.3 (0.6-3.5) MRDL=4 N/A Due to drinking water chlorina-
tion.
Inorganics
Barium mg/l No 12/07/20 0.025 MCL=2 2 Drilling wastes; discharge from
metal refineries; erosion of natural
deposits.
Chromium mg/l No 12/07/20 0.004 MCL=0.10 N/A Discharge from steel and pulp
mills; erosion of natural deposits.
Copper mg/l No 2020 0.33
(0.006-0.80)
AL=1.3 1.3 Household plumbing corrosion;
erosion of natural deposits; wood
preservatives.
Lead µg/l No 2020 2.7
(ND-18.0)
AL=15.0 0 Household plumbing corrosion;
erosion of natural deposits.
Nickel mg/l No 12/07/20 0.0012 N/A N/A Discharge from steel and pulp
mills, erosion of natural deposits.
Nitrate mg/l No 12/07/20 1.1 MCL=10 10 Fertilizer runoff; septic tank
leaching; sewage; erosion of natu-
ral deposits.
Sodium mg/l No 12/07/20 29 See Water Quality,
Section C
N/A Naturally occurring; road salt;
animal waste; water softeners;
water treatment chemicals.
Radioactive
Radium-228 pCi/l No 10/31/17 .907 MCL=5 0 Erosion of natural deposits.
E. Detected Contaminants (cont.)
5

Table 3b.
Detected Unregulated Contaminants (from 2013 UCMR3 list on Page 8)
Contaminant Units Vio-
lation
Y/N
Date of
Sample
Maximum Level
Detected
(Range)
Regulatory Limit MCLG Likely Source of Contamination
Chlorate µg/L No 2013 277 avg Unregulated N/A Chlorate ion is a known byprod-
uct of the drinking water disinfec-
tion process, forming when sodi-
um hypochlorite or chlorine diox-
ide are used in the disinfection
process.
Hexavalent Chromium µg/L No 2013 0.017 avg Unregulated N/A Hexavalent chromium can enter
waterways through the erosion of
natural deposits or from industrial
discharges.
Chromium, Total µg/l No 2013 0.099 avg Unregulated N/A Chromium is a metallic element
found in rocks, soils, plants, and
animals. It is used in steel mak-
ing, metal plating, leather tanning,
corrosion inhibitors, paints, dyes,
and wood preservatives
Strontium, Total µg/L No 2013 74.4 Unregulated N/A Strontium occurs nearly every-
where in small amounts. Air,
dust, soil, foods and drinking wa-
ter all contain traces of strontium.
Ingestion of small amounts of
strontium is not harmful. Howev-
er, high levels of strontium can
occur in water drawn from bed-
rock aquifers that are rich in
strontium minerals.
6
E. Detected Contaminants (cont.)
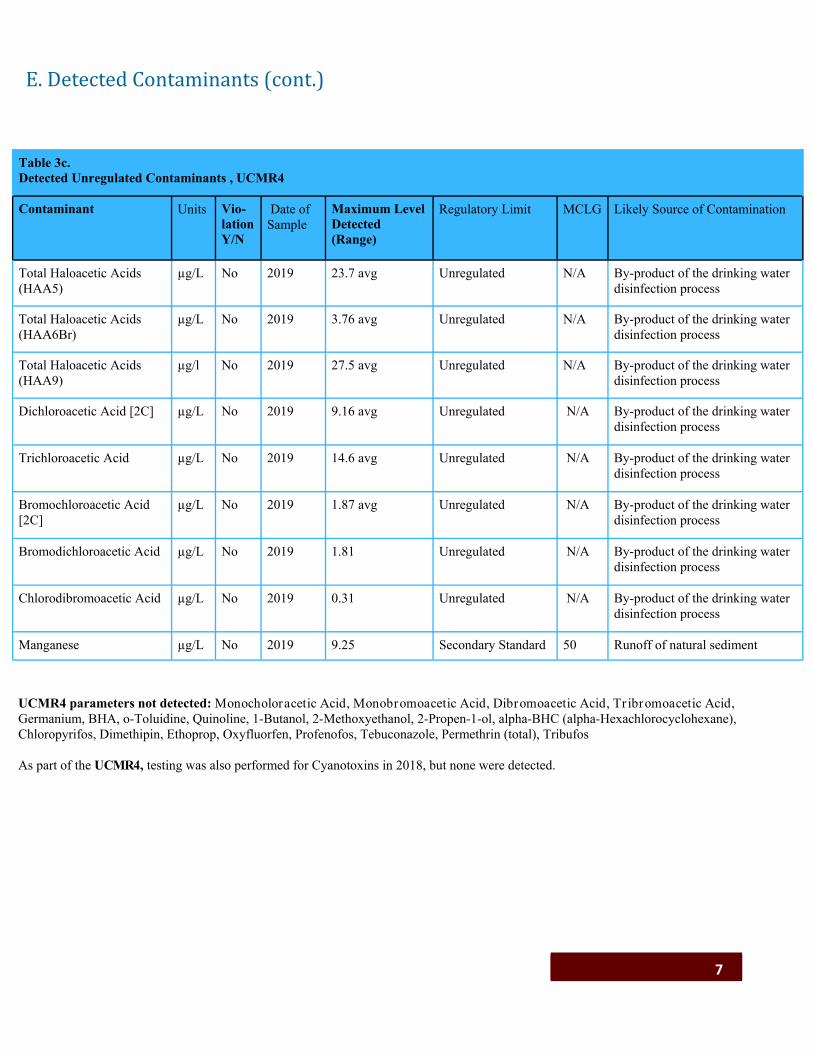
Table 3c.
Detected Unregulated Contaminants , UCMR4
Contaminant Units Vio-
lation
Y/N
Date of
Sample
Maximum Level
Detected
(Range)
Regulatory Limit MCLG Likely Source of Contamination
Total Haloacetic Acids
(HAA5)
µg/L No 2019 23.7 avg Unregulated N/A By-product of the drinking water
disinfection process
Total Haloacetic Acids
(HAA6Br)
µg/L No 2019 3.76 avg Unregulated N/A By-product of the drinking water
disinfection process
Total Haloacetic Acids
(HAA9)
µg/l No 2019 27.5 avg Unregulated N/A By-product of the drinking water
disinfection process
Dichloroacetic Acid [2C] µg/L No 2019 9.16 avg Unregulated N/A By-product of the drinking water
disinfection process
Trichloroacetic Acid µg/L No 2019 14.6 avg Unregulated N/A By-product of the drinking water
disinfection process
Bromochloroacetic Acid
[2C]
µg/L No 2019 1.87 avg Unregulated N/A By-product of the drinking water
disinfection process
Bromodichloroacetic Acid µg/L No 2019 1.81 Unregulated N/A By-product of the drinking water
disinfection process
Chlorodibromoacetic Acid µg/L No 2019 0.31 Unregulated N/A By-product of the drinking water
disinfection process
Manganese µg/L No 2019 9.25 Secondary Standard 50 Runoff of natural sediment
7
E. Detected Contaminants (cont.)
UCMR4 parameters not detected: Monocholoracetic Acid, Monobromoacetic Acid, Dibromoacetic Acid, Tr ibromoacetic Acid,
Germanium, BHA, o-Toluidine, Quinoline, 1-Butanol, 2-Methoxyethanol, 2-Propen-1-ol, alpha-BHC (alpha-Hexachlorocyclohexane),
Chloropyrifos, Dimethipin, Ethoprop, Oxyfluorfen, Profenofos, Tebuconazole, Permethrin (total), Tribufos
As part of the UCMR4, testing was also performed for Cyanotoxins in 2018, but none were detected.

8
F. Non-Detected Contaminants
CONTAMINANT CUWS
2020 Microbiological
Inorganics
Synthetic Organics & Pesticides; Groups 1 & 2
CONTAMINANT CUWS 2020
Principal Organics
CONTAMINANT CUWS
UCMR 1 2003
UCMR 2 2008
UCMR 3 2013
Radiological 2017
UCMR 4 2018-
2020
Anatoxins X
Cylindrospermopsin X
Total Microcystin X
UCMR4 List 1 (See table 3c.) DU4
Table 4a.

Many projects were put on hold due to pandemic related con-cerns.
Particle counters incorporated into the Water Filtration Plant computer systems to further optimize treatment.
Conductivity meters incorporated into the Water Filtration Plant computer systems to monitor effect of road salts in Fall Creek.
Additional design work was completed to install new sluice gates in the sedimentation basis.
Computer network improvements continued to increase secu-rity.
New technologies continued to be piloted for the Engineer-ing School’s AguaClara Program and other student research.
Miscellaneous improvement projects such as new day tanks for the disinfection system, new mixing equipment, and new monitoring equipment were completed.
Distribution system improvements were made to accommo-date the North Campus Residential Expansion project.
G. Major Modifications Completed 2020
H. Future Projects and Capital Improvements 2021 New sluice gates will be installed on the sedimentation basins.
Miscellaneous improvement projects will be constructed through-
out the water distribution system including implementation of a
valve exercising program.
Distribution system improvements needed for campus expansion will continue.
Concrete repairs to basins and tanks at the Water Filtration Plant will be completed.
New bulk storage tanks used for the disinfection process at the Wa-ter Filtration Plant will be designed and installed.
Piloting new technologies for the student research projects will continue.
Computer controls, both hardware and software, and network secu-rity improvements will be updated.
Chemical feed systems will be evaluated and updated if necessary.
Improvements to source water intake structures are planned.
A perimeter security fence will be installed around the Water Filtra-tion Plant with secure access gates.
I. Water Conservation
J. Security Generally, security threats to the local water systems have consisted primarily of minor vandalism and property damage. However,
our security efforts focus to a high degree on the much less likely, but more serious, threat of intentional contamination of the wa-
ter supply and cyber attacks. We have performed security assessments of the entire system and updated our Emergency Response
Plans and Vulnerability Assessments to cover the possibility of terrorism and attacks, including cyber attacks. Weaknesses in pro-
cedures have been corrected and improvements to increase the security of the infrastructure have been undertaken. Local police
are aware of the security needs of the water system and have maintained increased patrolling of our facilities. Your awareness and
reporting of suspicious activity throughout the system is appreciated.
2020, among all other things, saw a brief but intense period of drought where stream levels and ground water levels fell to lower than
desired levels during late summer and early fall. A limited water advisory was implemented until water levels returned to normal.
Water conservation is very important to protecting our natural resource. You, too, can play a role in conserving water at work and at
home by becoming conscious of the amount of water you are using and by looking for ways to use less whenever you can. It is not
hard to conserve water. The following are some ideas that you can apply directly in your own facility or home:
Use your water meter to detect hidden leaks. Turn off all taps and water using appliances, then record the meter reading and
check the meter after 15 minutes. If it registers usage, you have a leak.
The bathroom accounts for 75 percent of the water used inside the home.
Put 10 drops of food coloring in your toilet tank. If the color shows up in the bowl without flushing, you have a leak to repair.
It is common to lose up to 100 gallons a day from a toilet leak. Fix it, and you save more than 30,000 gallons a year.
If every American home installed low-flow faucet aerators, the United States would save 250 million gallons of water a day.
Do not hose down your driveway or sidewalk. Use a broom to clean leaves and other debris from these areas. Using a hose to
clean a driveway can waste hundreds of gallons of water.
Water your lawn only when it needs it. If you step on the grass and it springs back up when you move, it doesn’t need water. If it
stays flat, it does.
Fix leaks as soon as they are found. A dripping faucet with a 1/16 inch stream wastes 100 gallons of water per day. Please con-
tact your facility manager if you notice leaking water.
Saving water can lower your power bills by reducing your demand for hot or pumped water. These few simple steps will pre-
serve the resource for future generations and also save up to 30% on your bill.
9

The New York State Department of Environemental Conservation is in the process of developing a Source Water Protection Program for Cornell’s sur-face drinking water source. A review and summary will be posted on our web-site and provided in next year’s Annual Drinking Water Quality Report. Work has begun to revise the Fall Creek Watershed Rules and Regulations, however a broader effort to revise/develop Rules and Regulations for the en-tire Cayuga Lake Basin are being explored in conjunction with the Tompkins County Water Resources Council and other local water purveyors.
K. Source Water ProtectionCornell Water Links
Drinking Water Home
Lead Information
Past Water Quality Reports
Distribution System
PLEASE PLACE STAMP Cornell University Water
Christopher Lynn Bordlemay Padilla
CU Water Filtration Plant
310 Caldwell Road
Ithaca, NY 14850
Phone: 607-255-1408
E-mail: [email protected]
10
We hope you and your family are staying safe and healthy. We want to assure you we are working hard to provide safe and
reliable drinking water to the Cornell campus and surrounding community. Our staff conducted essential work during the
pandemic, including collecting routine monitoring samples, monitoring the treatment, inspecting our facilities, reading me-
ters, conducting important routine maintenance, and performing emergency repairs. Our staff is vital to keeping the water
system operational. They all deserve the gratitude and respect that you can give. Without their dedication our system
would not have successfully made it through 2020!
Thank you for your continued cooperation!


