
2020 Youth Behavior Risk Survey (YRBS)
39
2020 Youth Behavior Risk Survey (YRBS) Kimberlee Foster, VDH/Central Virginia Health District On behalf of LCS School Health Advisory Committee
Transcript of 2020 Youth Behavior Risk Survey (YRBS)

2020 Youth Behavior Risk Survey (YRBS)
Kimberlee Foster, VDH/Central Virginia Health District
On behalf of LCS School Health Advisory Committee

“
What is YRBS?
National school-based survey conducted by the CDC and state, territorial, tribal, and local governments
Nearly all US states participate; goal is to be nationally representative
YRBS aim: Monitor six categories of health-related behaviors that contribute to the leading causes of death and disability among youth and adults
2

Methodology
• Online survey of 115 questions completed through Google Forms
• Passive permission required by parents
• Administered to 8th, 10th, and 12th grade students in Lynchburg City Schools
3

8th grade 10th grade 12th grade
Number of respondents completing the survey
283 380 251
Percent of enrollment at
time of survey45% 61% 44%
Demographic variables
4
Total number of respondents: 913

Themes to be discussed
Physical health & extracurricular activities
Relationships & social supports
Violence & safety
Mental health
Substance use
5

Physical Health & Extracurricular Activities
6

Youth who describe themselves as overweight
• Approximately 29% of respondents in all grades: 4% increase in negative body image from 2018.
7
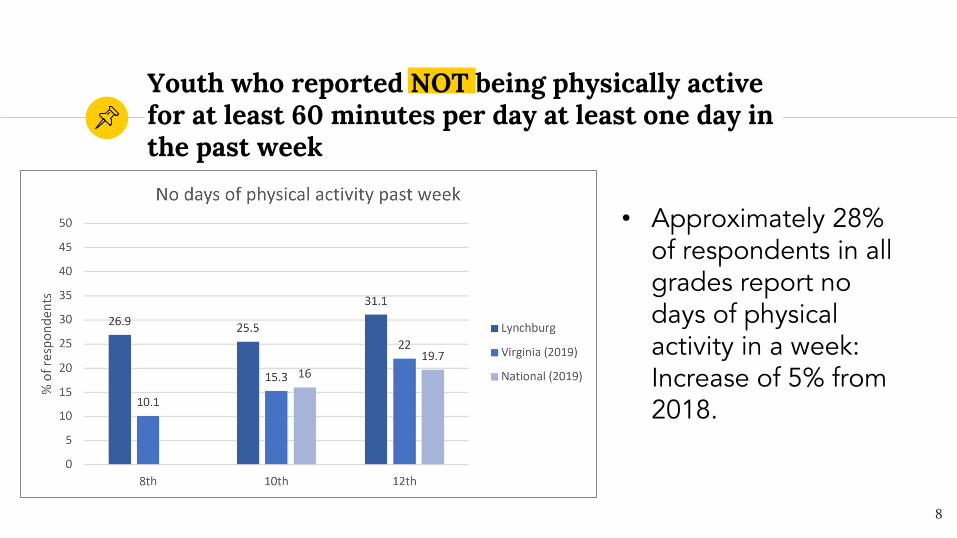
Youth who reported NOT being physically active for at least 60 minutes per day at least one day in the past week
• Approximately 28% of respondents in all grades report no days of physical activity in a week: Increase of 5% from 2018.
8
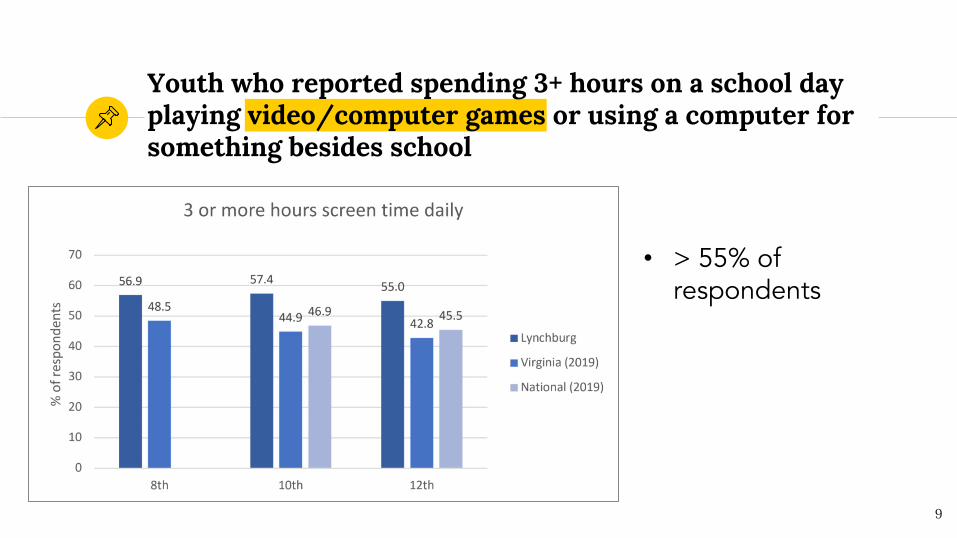
Youth who reported spending 3+ hours on a school day playing video/computer games or using a computer for something besides school
• > 55% of respondents
9

Relationships & Social Supports
10

Social media and threats/intimidation
• Approximately 25% of Lynchburg youth reported receiving threats and intimidation through social media, texting, or online
11

Sexting and inappropriate communication
• 40% of 12th graders received sexually inappropriate messages
• Number received is higher than what is sent
12

Bullying and bystanders
• 50% of respondents reported being a bystander to bullying behaviors
13

Bullying and bystanders
• 12.4% of all respondents reported being bullied daily or several times per day
• 8th graders most often reporting daily bullying
14

Bullying and bystanders
• 11% of respondents report missing 1 or more days of school due to bullying
15

Sexual orientation
• Approximately 25% of youth across grade levels identify as other than heterosexual
16

Sexual partners
• Higher than VA and national averages for 10th and 12th
graders
17
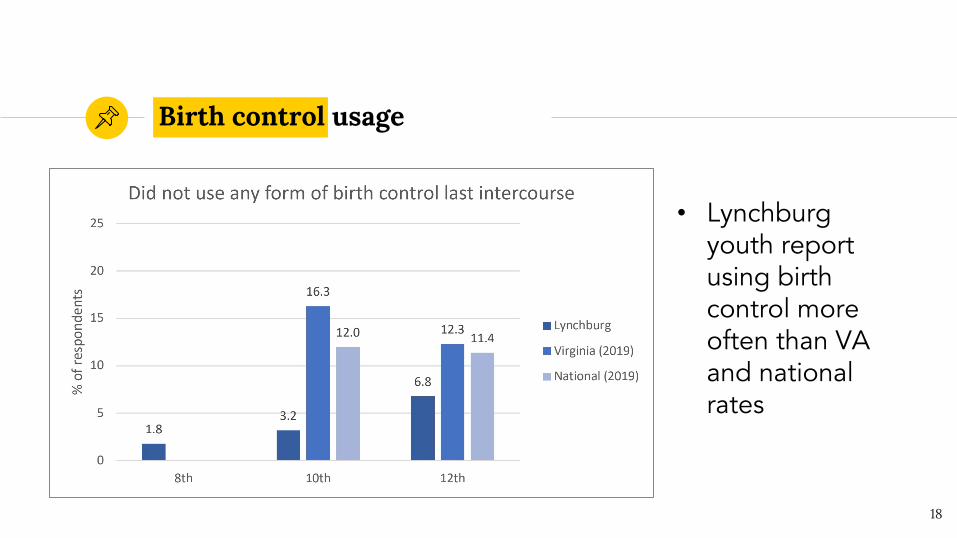
Birth control usage
• Lynchburg youth report using birth control more often than VA and national rates
18

Intimate partner violence
19
• Lynchburg youth are experiencing lower rates of IPV than VA and national rates

Social supports
20
• Youth feel supported with extracurricular activities, communication to parents, and adult/parental supports.
Violence & Safety
21

Carrying weapons
• Below national average in all grades except 8th grade
22

Physical fights
• Despite a high rate of physical fights among 8th graders, numbers decrease in higher grades
23

Victims of domestic violence
• A total of 14.9% of respondents reported having been physically harmed by a family or household member
24

Gang awareness
• As grade level increases, the reported awareness of gang activities in school also increases.
25

Mental Health
26

Sadness and hopelessness
• Over the past five years, there is an increasing trend of feelings of sadness and hopelessness amongst high school students
27

Suicide
• 16.1% of respondents reported considering suicide
• 12.5% made a plan to die by suicide
• 7.4% attempted suicide
28

Substance Use
29

Drugs and illicit substances
• 8th and 10th
graders: access drugs at school
• 12th graders: access drugs in their communities
30

Marijuana
• Rates are lower than VA and national rates
31

Alcohol
• Fewer Lynchburg youth report having their first drink before age 11-13 compared to VA and national data
32

Alcohol
• Lynchburg youth report the majority oftheir parents and friends would think it is wrong for them to drink alcohol
33

Cigarette use
• Rates are lower than VA and national averages
34

Vaping
• Rates are lower than VA and national averages
35

Strengths & Wins
◉ Respondents perceived strong parent, teacher, community, and social supports for reducing violence, increasing safety, and providing extracurricular activities and community programs that support physical activity in the Lynchburg area
◉ Overall low rate of IPV in Lynchburg Youth
◉ The vast majority of youth are not missing multiple days of school
due to fear of bullying
◉ Most youth reported that parents and friends think that it is wrong to smoke cigarettes and to drink alcohol
◉ Lower percentage of 10th and 12th graders who reported drinking in the past month
◉ Vast majority of Lynchburg youth reported never trying illicit drugs
36

Opportunities for growth◉ Continued community engagement
events, activities, and support to promote physical activity (including access to sports physicals, COVID testing, and vaccinations)
◉ Although the vast majority of youth are not missing multiple days of school due to fear of bullying, 11% is not an insignificant number for youth missing one day.
◉ Partnering with non-profit, community, and faith-based organizations to address physical safety, violence reduction, multiple sexual partner risks, birth
control use, exploitation, social media, and online safety.
◉ Increased education on positive relationships, empathy, and mentoring
◉ Increasing trend in Lynchburg youth reporting decline in mental health and an increase in reports of attempted suicide in the past 12 months.
◉ Need to address ease of access to drugs for older youth in the community and younger youth in the school environment.
37

Partner organizations
◉Behavioral health & counseling
◉Community programs
◉Faith-based organizations
◉Fraternal organizations
◉Grant-funded programming
◉Healthcare agencies & professionals
◉Higher educational institutions
◉Schools (SROs, administration, school nurses)
◉State, local, and tribal agencies
◉Substance abuse & recovery programs
◉Youth-serving organizations
38

Special thanks to:
LCS School Health Advisory Committee
Sherry Brown
Andrea Bryant
Faith Towles
Kali Miller
Januwaa Davis
Tonya Price
Tianna Knight
39


